Climate Chap. 14 What is climate Climate Classification Climatic Changes Human Influence on Climate.
Upload
myrtle-morganCategory
view
214download
0
Toward Seasonal Climate Forecasting and Climate Projections
in Future
Akio KITOHMeteorological Research Institute, Tsukuba, Japan
FOCRAII, 6-8 April 2010, Beijing

Contents
• Seasonal Prediction of Tropical Cyclone Occurrences in the JMA/MRI System
• New MRI/JMA High-Resolution AGCM
• Stratosphere Effect on Prediction of Arctic Oscillation

ENSO influences worldwide climate even out of the tropical Pacific on seasonal to inter-
annual scales.
Sea Surface Temperature anomaly in November 1997
Accumulated Precipitation Anomalyduring Nov.1997-Apr.1998
from BAMS, 1999, 80, S1-48
from JMA webpage

ENSO is the most successfully predicted large-scale phenomenon on seasonal to inter-
annual scales Observatio
nDec1997 - Feb1998
Prediction from
31 July 1997by
JMA/MRI model
Precipitation
Surface Air Temperature
Sea SurfaceTemperature
JMA/MRI
4-month lead

JMA Seasonal Prediction Systemdeveloped by JMA/MRI
JMA/MRI Coupled Model
• JMA/MRI Unified Atmospheric Model
• 180km Resolution (TL95L40)
• Ocean Model (MRI.COM)• 1.0°by 0.3-1.0° 50-layer
• 1-hour Coupling• Wind-stress, Heat-flux Adjustment
Ocean Initials and Data
• MOVE/MRI.COM• Usui et al. (2006)• 3D-VAR (T,S)
• TAO/TRITON array• Altimeter Data• Argo Float
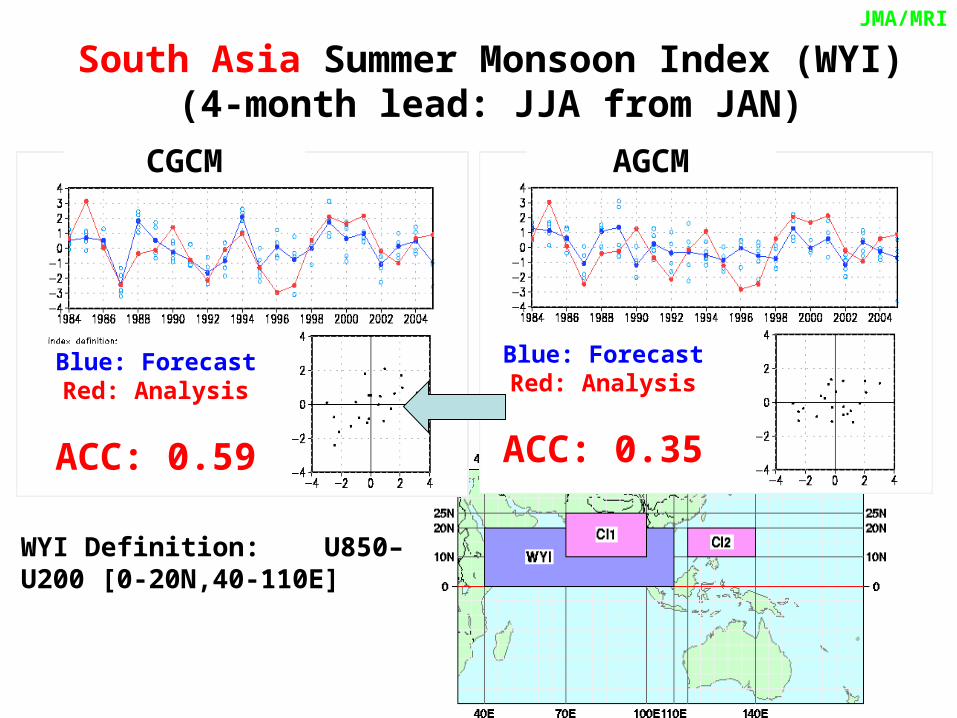
South Asia Summer Monsoon Index (WYI)(4-month lead: JJA from JAN)
AGCMCGCM
WYI Definition: U850–U200 [0-20N,40-110E]
Blue: ForecastRed: Analysis
ACC: 0.59
Blue: ForecastRed: Analysis
ACC: 0.35
JMA/MRI

East Asia Summer Monsoon Index (DU2)(4-month lead: JJA from JAN)
DU2 Definition :U850[5-15N,90-130E] - U850[22.5-32.5N,110-140E]
Blue: ForecastRed: Analysis
ACC: 0.58
Blue: ForecastRed: Analysis
ACC: -0.05
CGCM AGCM
JMA/MRI

Seasonal Prediction of Tropical Cyclone Occurrences in the
JMA/MRI System
What is predictable?
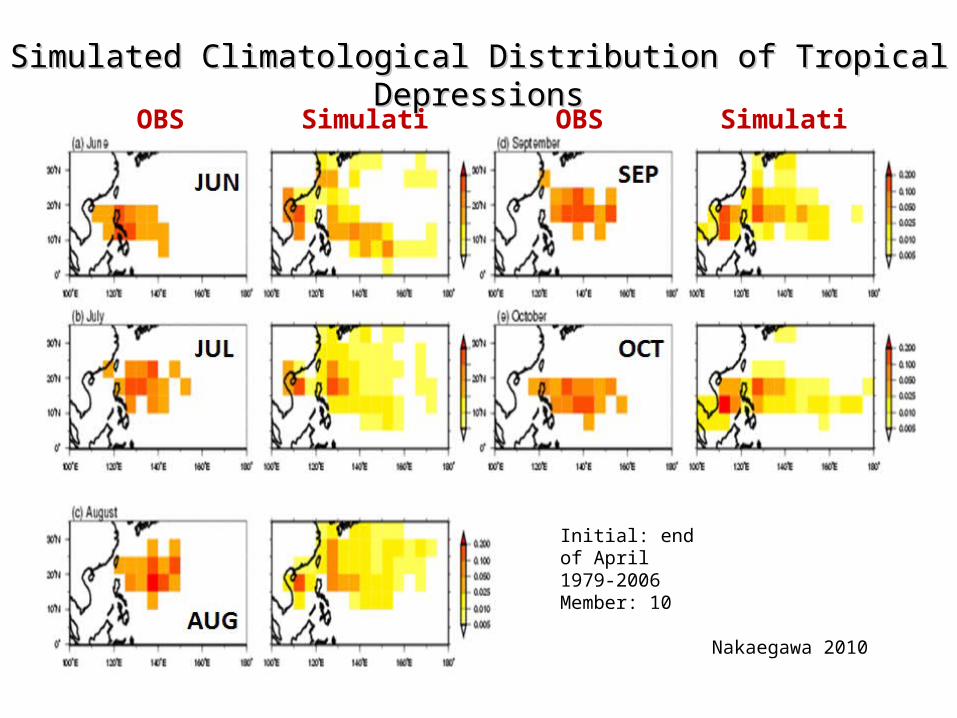
Simulated Climatological Distribution of Tropical Simulated Climatological Distribution of Tropical DepressionsDepressions
OBS OBS SimulationSimulation
Nakaegawa 2010
Initial: end of April1979-2006Member: 10
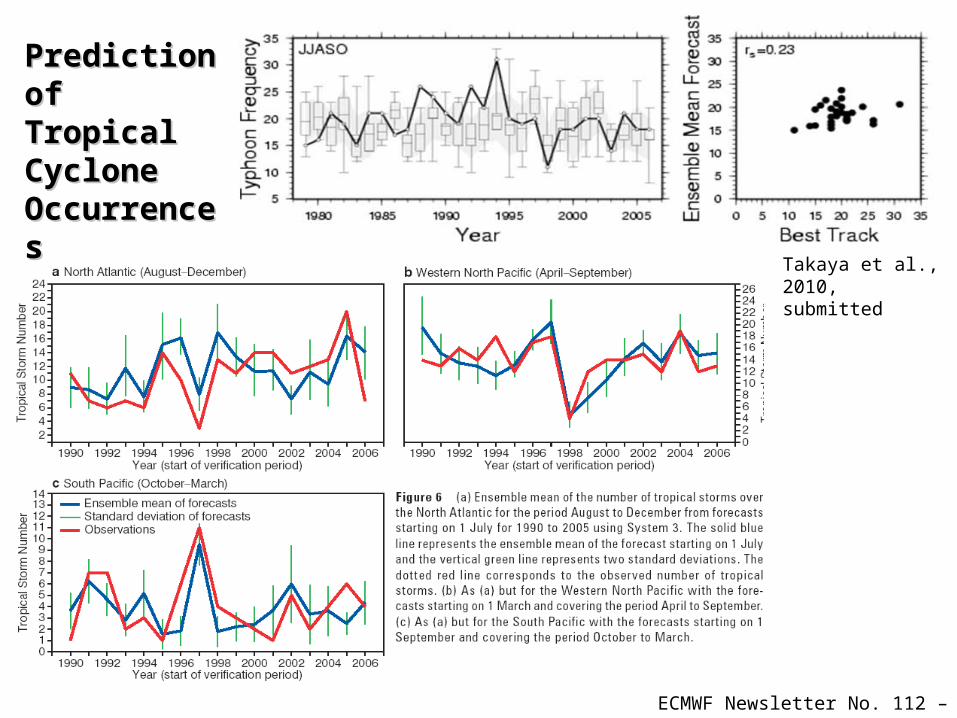
ECMWF Newsletter No. 112 – Summer 2007
PredictionPredictionofofTropicalTropicalCycloneCycloneOccurrencesOccurrences
Takaya et al., 2010, submitted

SE
SE
SW
SW
NE
NE
NW
NW
SW
NE
NW
r=0.74
r=0.46
r=0.34
r=0.03 SE
120E
17N
Takaya et al., 2010, submitted
Dependence of Tropical Cyclone Dependence of Tropical Cyclone Occurrence PredictionOccurrence Prediction
on Regionson Regions
Wang and Chan, 2002

MRI/JMA High-Resolution AGCM
impact of horizontal resolution


Future change in NH blocking frequency (JJA)
The higher horizontal resolution is required to accurately simulateEuro-Atlantic blocking. The Euro-Atlantic blocking frequency is predicted to show a significant decrease in the future.
20km
120km 180km
60kmMatsueda
and Palmer(in progress)

AR4 models
wet
dry
AR4 models predict wet (dry) conditions over north (south)Europe. Robust signals from AR4 models.
MRI AGCM
Much weaker signals at high resolution
Precipitation change over Europe (JJA)
180km(climate)
20km(NWP)
similar
robust
less blocking
Matsueda and Palmer (in progress)

AR4 models
wet
dry
AR4 models predict wet (dry) conditions over north (south)Europe. Robust signals from AR4 models.
MRI AGCM
Much weaker signals at high resolution
Precipitation change over Europe (JJA)
180km(climate)
20km(NWP)
similar
robust
less blocking
Matsueda and Palmer (in progress)
Unreliable?
New MRI/JMA High-Resolution AGCM
A new cumulus scheme impact on inter-annual
performance

Old version in 2007 New version in 2010
Horizontal Res. TL319 (60km) TL319 (60km)
Vertical Res. L60 (top 0.1hPa) L64 (top 0.01hPa)
Time-Step 15 minutes 20 minutes
Cumulus Scheme Prognostic AS Yoshimura Scheme
Cloud Scheme Smith (1990) & Kawai (2004)
Tiedtke (1993)
Radiation Shibata & Uchiyama (1992) JMA Scheme (2004_r1)
Gravity wave drag Iwasaki et al. (1989) Iwasaki et al. (1989)
Upper Treatment Newtonian Relaxation Rayleigh Friction
Ocean Surface JMA-Scheme MRI-Scheme & Skin Ocean
Land Surface SIB0109 SIB0109
PBL Mellor-Yamada Level-2 Mellor-Yamada Level-2
Direct Aerosol Effect
Sulphate Sulphate, Organic & Black Carbon, Salt, Mineral
Indirect Effect None None
Two versions of MRI/JMATwo versions of MRI/JMA AGCMsAGCMs

Old60kmmodel
New60kmmodel
New-OldTRMM3A25
GPCP&JRA25Reanalysis
CMAP&JRA25Reanalysis
Asian Monsoon ClimatologyAsian Monsoon Climatology (JJ(JJA)A)

Seasonal Progress of Monsoon PrecipitationSeasonal Progress of Monsoon Precipitation
Black + : CMAPBlack ○: GPCPRed : New ModelBlue : Old Model
South Asia(India)
Western North Pacific
East Asia(Japan)

Inter-annual Precipitation Variability (Inter-annual Precipitation Variability ( JJJJAA ))
Old60km
New60km
GPCP
EOF1
EOF2

Inter-annual Precipitation Variability (DJF)Inter-annual Precipitation Variability (DJF)
Old60km
New60km
GPCP
EOF1
EOF2
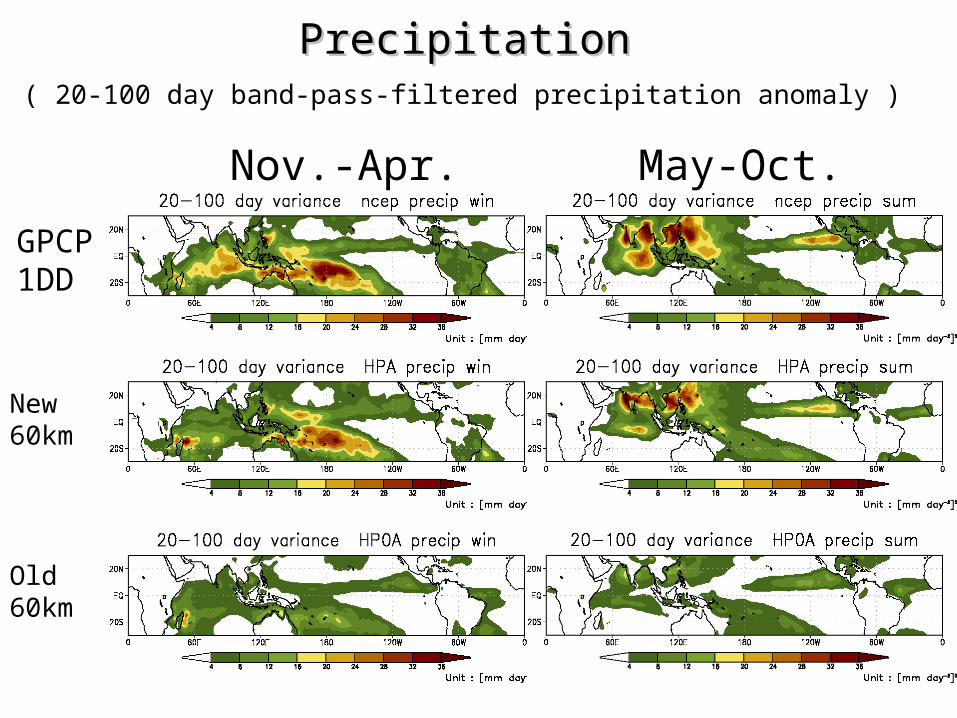
( 20-100 day band-pass-filtered precipitation anomaly )
Nov.-Apr.
GPCP1DD
Variance of Intra-Seasonal PrecipitationVariance of Intra-Seasonal Precipitation
Old60km
New60km
May-Oct.
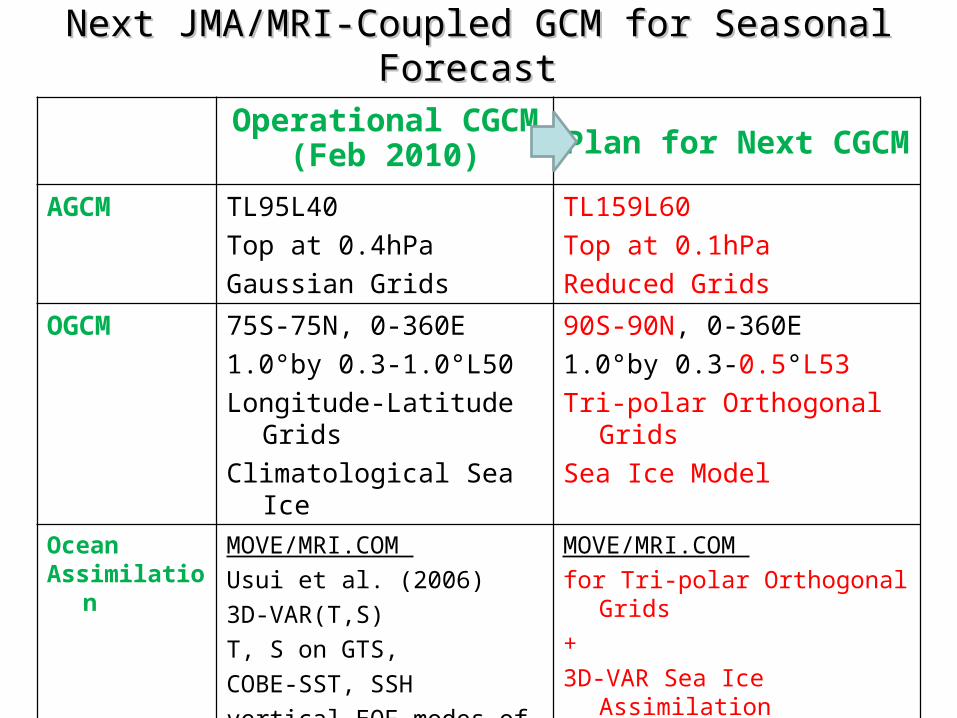
Next JMA/MRI-Coupled GCMNext JMA/MRI-Coupled GCM for Seasonal Forecastfor Seasonal Forecast
Operational CGCM(Feb 2010) Plan for Next CGCM
AGCM TL95L40
Top at 0.4hPa
Gaussian Grids
TL159L60
Top at 0.1hPa
Reduced Grids
OGCM 75S-75N, 0-360E
1.0°by 0.3-1.0°L50
Longitude-Latitude Grids
Climatological Sea Ice
90S-90N, 0-360E
1.0°by 0.3-0.5°L53
Tri-polar Orthogonal Grids
Sea Ice Model
OceanAssimilation
MOVE/MRI.COM
Usui et al. (2006)
3D-VAR(T,S)
T, S on GTS,
COBE-SST, SSH
vertical EOF modes of T-S coupling
MOVE/MRI.COM
for Tri-polar Orthogonal Grids
+
3D-VAR Sea Ice Assimilation
+
Coupled Ensemble Method
(Breeding)

Stratosphere Effect on Prediction of Arctic Oscillation

Toward further improvement of seasonal
prediction NWP model
Typhoon prediction model
El Niño prediction model
Seasonal prediction model
Climate model
Earth system model
Climate model development (IPCC AR4)
It is necessary to explore other predictability sources in the Earth system

Toward further improvement of seasonal
prediction NWP model
Typhoon prediction model
El Niño prediction model
Seasonal prediction model
Climate model
Earth system model
Improving atmosphere-ocean coupled models will lead to constant improvement of seasonal predictions based on slow-coupled process like ENSO.
On the other hand, high predictability from ENSO seems to be limited within relatively low-latitudes.
Therefore, for more complete seasonal prediction, we need to explore other influential elements that show relatively long-range persistency or predictability in the Earth system that consists of upper and/or polar atmosphere, land, snow and ice, chemical processes besides the low-latitude troposphere.
It is necessary to explore other predictability sources in the Earth system

Xie et al. (1999)
JAPAN Winter Temperature is significantly correlated with Arctic Oscillation besides
ENSO
・ Atlantic SST anomaly
・ Snow over Eurasia
・ Arctic Sea Ice Cover
・ Stratosphere, Ozone
・ Volcano Eruption
・ Global Warming
AO
ENSO
Possible Causes
2010/3/3 平成 21年度異常気象分析検討会
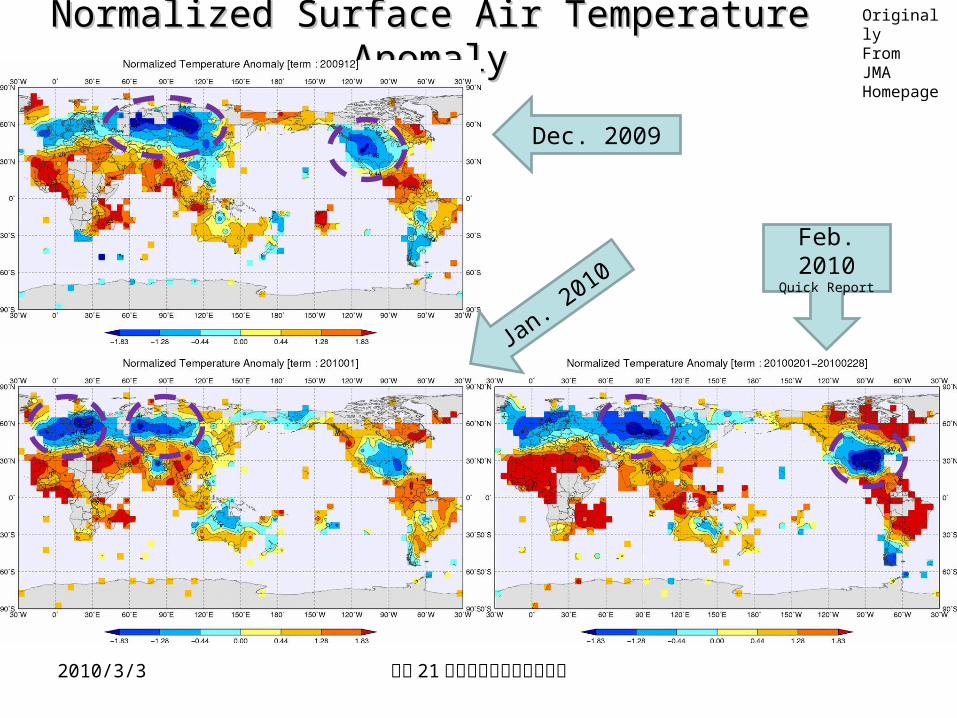
Normalized Surface Air Temperature Normalized Surface Air Temperature AnomalyAnomaly
Dec. 2009
Feb. 2010Quick Report
Jan. 2
010
Originally FromJMA Homepage

Most Negative AO index in 2009/10 WinterMost Negative AO index in 2009/10 Winter
DJF AO Variability (上: ERA40+JRA の Z500-
EOF1)(下: JRA+JCDAS の SLP-EOF
1 )09/1062/63
68/69 76/77 85/86 00/01
09/10 = -3.1
Z500
Originally FromJMA Homepage

From Science (2001)
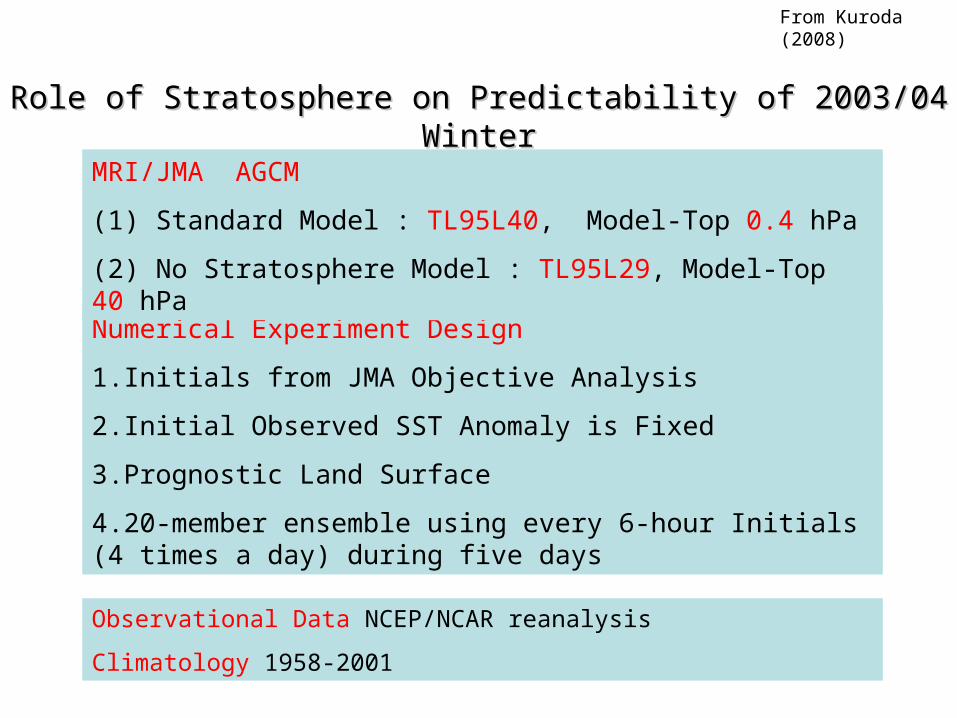
Role of Stratosphere on Predictability of 2003/04 WinterRole of Stratosphere on Predictability of 2003/04 Winter
Numerical Experiment Design
1.Initials from JMA Objective Analysis
2.Initial Observed SST Anomaly is Fixed
3.Prognostic Land Surface
4.20-member ensemble using every 6-hour Initials (4 times a day) during five days
Observational Data NCEP/NCAR reanalysis
Climatology 1958-2001
MRI/JMA AGCM
(1) Standard Model : TL95L40, Model-Top 0.4 hPa
(2) No Stratosphere Model : TL95L29, Model-Top 40 hPa
From Kuroda (2008)

06Z27Dec 2003- 00Z1Jan 2004
20-Initials Composite
2-month!
Anomalous zonal-mean zonal wind at 60N Anomalous zonal-mean zonal wind at 60N (( 2003/2004 2003/2004 WinterWinter ))
Shade : Student’s-t
2:95% -significance
4:99.9% -significance
6: very-high-significance
NCEPReanalysis
PredictionExperiment
Sudden Stratosphere Warming occursDuring early January
From Kuroda (2008)

AGCM
With
Stratosphere
AGCM
Without
Stratosphere
Role of Stratosphere in PredictionRole of Stratosphere in Prediction
2-month!
From Kuroda (2008)

1. Fixed to the Initially Observed SST Anomaly
2. Prognostic Land Surface
1. Climatological SST
2. Climatological Land Surface
Impact of SST and Land Surface State on Impact of SST and Land Surface State on PredictionPrediction
Forecasted anomalous zonal wind
2-month! From Kuroda (2008)

SUMMARY
• High predictability of tropical cyclones’ occurrences is confirmed in the eastern regions of the northwestern Pacific.
• Horizontal resolution matters.• The new cumulus scheme improves the
inter-annual and intra-seasonal variability of the Asian Monsoon simulation with the AGCM.
• Possibility of two-month lead prediction for negative-phase Arctic Oscillations after Stratosphere Sudden Warming.