Toward AR5: Activity of global water resources model H08
22
Toward AR5: Activity of global water resources model H08 Naota Hanasaki NIES
Transcript of Toward AR5: Activity of global water resources model H08

Toward AR5: Activity of global water resources model H08
Naota Hanasaki
NIES

Outline
• Global water resources model: H08• Activities toward IPCC/AR5
1. Global water scarcity assessment2. Impact/adaptation study of Thailand3. Global integrated assessment4. Multi-model simulation of CC impact on
global hydrological cycle
• Other activity– Global virtual water assessment

Application 1:Global water scarcity assessment
•Hanasaki, N., S. Kanae, T. Oki, K. Masuda, K. Motoya, N. Shirakawa, Y. Shen, and K. Tanaka (2008), An integrated model for the assessment of global water resources - Part 1: Model description and input meteorological
forcing, Hydrol. Earth Syst. Sci., 12, 1007-1025.
•Hanasaki, N., S. Kanae, T. Oki, K. Masuda, K. Motoya, N. Shirakawa, Y. Shen, and K. Tanaka (2008), An integrated model for the assessment of global
water resources - Part 2: Applications and assessments, Hydrol. Earth Syst. Sci., 12, 1027-1037.
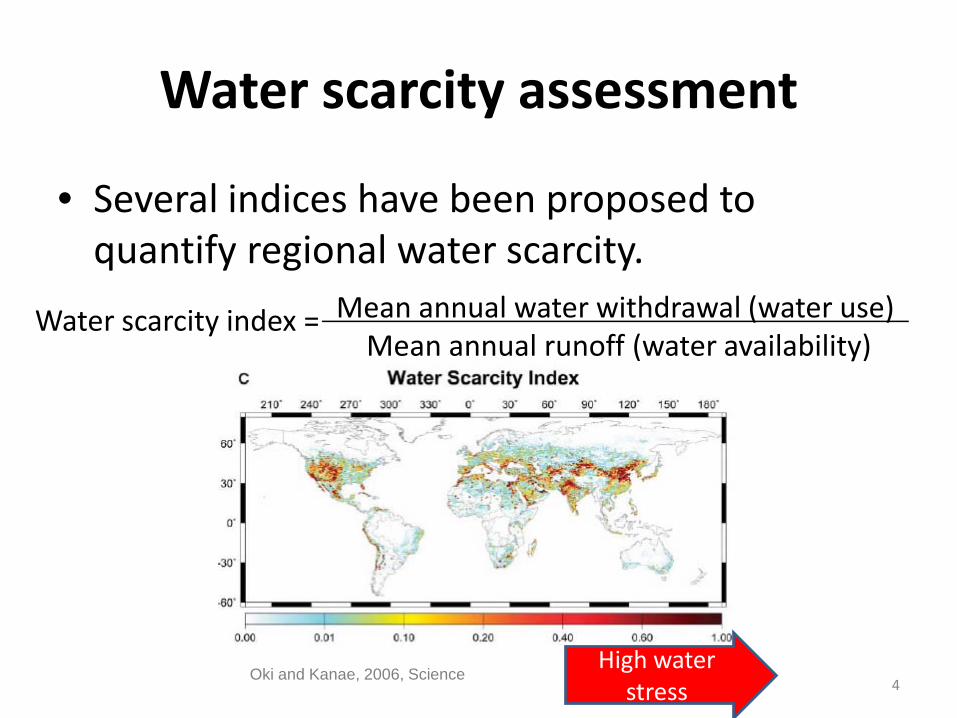
Water scarcity assessment
• Several indices have been proposed to quantify regional water scarcity.
Water scarcity index = Mean annual water withdrawal (water use)Mean annual runoff (water availability)
High water stress
Oki and Kanae, 2006, Science4

Projection of water scarcity in future
Population under high water stress (billion)
Milly et al., 2005, Nature
Mean annual water withdrawal Mean annual runoff
Use of statistical (regression) models-Population scenario-Economic scenario
9
1
7
5
3
Oki and Kanae, 2006, Science
5

Impact of climate change on water cycle
• IPCC AR4/WG2/Ch3– Change in annual precipitation/runoff
– Change in precipitation intensity(強度)/frequency(頻度)
– Decrease of snowfall, shift of snowmelt season
Projected number of days with heavy rain (Japan)
http://www.env.go.jp/earth/earthsimulator/Milly et al., 2005, Nature
Projected change in annual runoff by 2041-60 relative to 1900-70
6
Mean annual water withdrawal Mean annual runoff Sub-annual-basis assessment is needed
Water stress decreases??

Global water resources model H08
Human Activity
NaturalWaterCycle
1°×1°Total: 15,238 grids
•Requirements1. Simulate both water availability (streamflow)
and water use at daily-basis2. Deal with interaction between natural
hydrological cycle and anthropogenic activities3. Applicable for future climate change simulation
452 reservoirs, 4140 km3
Hanasaki et al., 2006, J. of Hydrol.Hanasaki et al. ,2008a,b, Hydrol. Earth Sys. Sci.
7
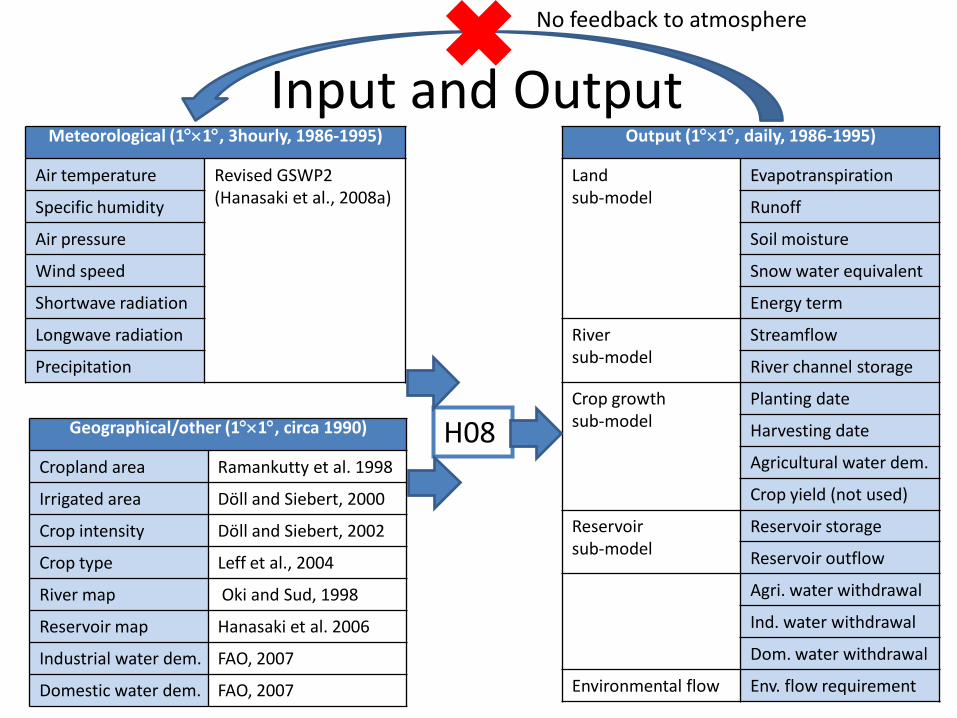
H08
Input and Output
Geographical/other (1°×1°, circa 1990)
Cropland area Ramankutty et al. 1998
Irrigated area Döll and Siebert, 2000
Crop intensity Döll and Siebert, 2002
Crop type Leff et al., 2004
River map Oki and Sud, 1998
Reservoir map Hanasaki et al. 2006
Industrial water dem. FAO, 2007
Domestic water dem. FAO, 2007
Meteorological (1°×1°, 3hourly, 1986-1995)
Air temperature Revised GSWP2(Hanasaki et al., 2008a)Specific humidity
Air pressure
Wind speed
Shortwave radiation
Longwave radiation
Precipitation
Output (1°×1°, daily, 1986-1995)
Landsub-model
Evapotranspiration
Runoff
Soil moisture
Snow water equivalent
Energy term
Riversub-model
Streamflow
River channel storage
Crop growthsub-model
Planting date
Harvesting date
Agricultural water dem.
Crop yield (not used)
Reservoirsub-model
Reservoir storage
Reservoir outflow
Agri. water withdrawal
Ind. water withdrawal
Dom. water withdrawal
Environmental flow Env. flow requirement
No feedback to atmosphere

High Stress Low StressMedium Stress
Annual basis∑daily withdrawal (simulated)
∑daily demand (simulated)
Water resources assessment
Daily basisAnnual water use (statistics)
Annual river discharge (simulation)Index= Index=
High stress 0.4≤Index
Medium stress 0.1≤index<0.4
Low stress Index<0.1
High stress Index<0.5
Medium stress 0.5≤index<0.8
Low stress 0.8≤Index
demand availability
jan dec
1 + 2 + 7 +4 + 3 + 2 + 1 + 1 + 1
1 + 2 + 2 +2 + 3 + 2 + 1 + 1 + 1≤1
deficit
withdrawal
Hanasaki et al., 2006, J. of Hydrol.Hanasaki et al. ,2008a,b, Hydrol. Earth Sys. Sci.
9

For future projection
Geographical/other (1°×1°, 2001-2100)
Cropland area RCP?
Irrigated area
Crop intensity
Crop type
Reservoir map
Industrial water dem ??
Domestic water dem ??
Meteorological (1°×1°, daily?,2001-2100)
Air temperature GCM results available.
Spatial/Temporal down scaling is needed
Bias correction is needed.
Specific humidity
Air pressure
Wind speed
Shortwave radiation
Longwave radiation
Precipitation
An European group developed a new dataset Some Japanese groups are also working hard.
New project launched in NIES
Land use & Agriculture model needed?
Application 2:Estimation of global virtual water
flows and sources of water
Hanasaki, N., Inuzuka, T., Kanae, S., Oki, T.: An estimation of global virtual water flow and sources of
water withdrawal for major crops and livestock products using a global hydrological model. J. Hydrol.
In press, doi:10.1016/j.jhydrol.2009.09.028

Introduction
• Global water resources assessments– high water stressed regions
are sometimes densely populated
• Virtual water (Allan, 1996)– Regional water scarcity can be alleviated by importing
commodities, especially foods– Production of agricultural/livestock products consumes a large
volume of water
• Virtual water complements water resource analyses of local water availability and use
Low stress High stress
Water use / Water availability

Virtual water export
Importing country (Japan) Exporting country (USA)
Wheat1t
1t1000t(evapotranspiration)
Export of wheat 1t
Virtual water export 1,000t
volume of water that an exporting nation consumes to produce the commodities that it trades abroad
(輸出製品を作るために海外の国が消費した水の量)
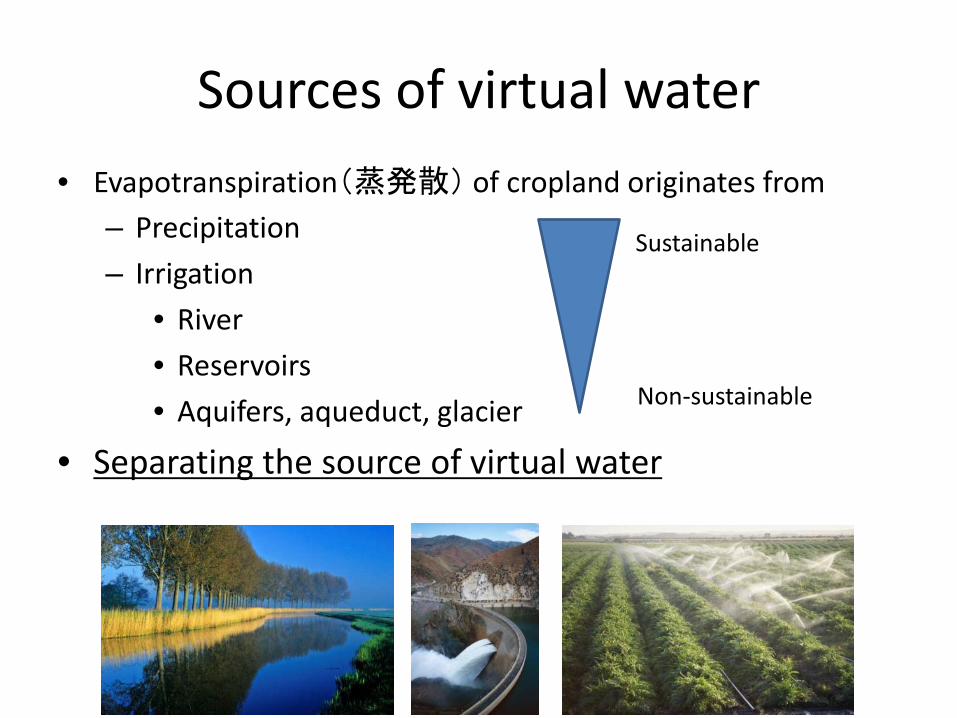
Sources of virtual water
• Evapotranspiration(蒸発散) of cropland originates from– Precipitation
– Irrigation
• River
• Reservoirs
• Aquifers, aqueduct, glacier
• Separating the source of virtual water
Sustainable
Non-sustainable

Objective & Methodology
• Objective– Estimate global virtual water flows and their sources
• Research focus– International food trade in 2000
– Five major crop products: barley, maize, rice, soy, wheat
– Three major livestock products: beef, pork, chicken
• Methodology
– Virtual water export Trade matrix(statistics)
National averageEvapotranspirationfrom cropland (sim)
National crop yield(statistics)
= x

Water consumption from cropland
Rainfed: Ramankutty et al. (2008)Irrigated: Siebert et al. (2005)Crop type: Monfreda et al. (2008)
Where
When
How much
Ramankutty et al. 2008
Land surface hydrology submodel estimates ET from planting date to harvesting date.
Crop growth submodel estimates planting/harvesting date.
Globally 0.5°×0.5°, daily-based calculation
Distribution of rainfed cropland area

Sources of water
River
ET(River)
Withdrawal①(River)
ET(NNBW)
Withdrawal③(NNBW=Nonrenewalbe and Nonlocal Blue Water)
ET(Medium)
Withdrawal②(Medium)
Land
Rainfed Irrigated
ET(Precip)
P(Precip)
ET(Precip)
P(Precip)
Medium-sizereservoirs< 1km3
250003280km3
Runoff
Largereservoirs1km3<4524140km3
Excess water

Sources of evapotranspiration from irrigated cropland
Irrigation/Total evaporation River/Total Irrigation
Medium-size reservoirs/Total irrigation
NNBW=Nonrenwable and Nonlocal Blue Water
NNBW/Total Irrigation

NNBW/Total Irrigation
• Reported regions of aquifer overexploitation (Postel, 1999)
NNBW/Total Irrigation
High Plains Aquifers
Punjab in Pakistan
NNBW=Nonrenwable and Nonlocal Blue Water
. Punjab, Haryana, and Gujarat in India
the North China Plain
Arabian Peninsula
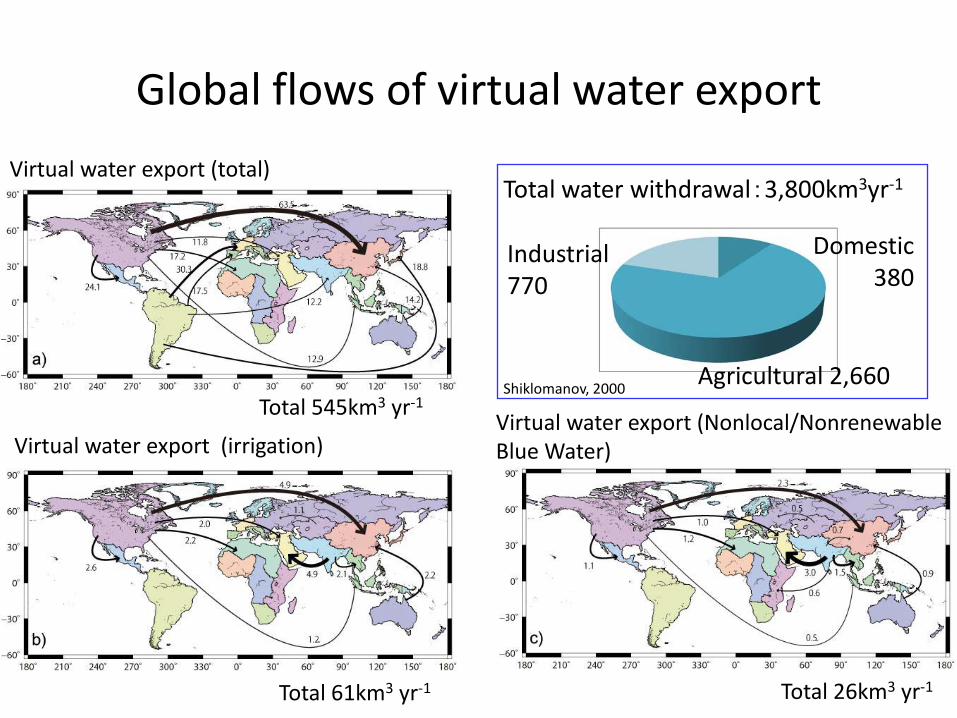
Global flows of virtual water export
Virtual water export (total)
Virtual water export (irrigation)Virtual water export (Nonlocal/Nonrenewable Blue Water)
Total 545km3 yr-1
Total 61km3 yr-1 Total 26km3 yr-1
Total water withdrawal:3,800km3yr-1
Agricultural 2,660
Domestic380
Industrial770
Shiklomanov, 2000

Summary
• Global water scarcity assessment
– Daily basis assessment
• Global virtual water assessment
– The virtual water export of the world was estimated at 545km3yr-1.
– Of total, 61km3yr-1 (11%) is irrigation water, and 26km3yr-1 (5%) is NNBW.

References• Shiogama, H., Hanasaki, N., Masutomi, Y., Nagashima, T., Ogura, T., Takahashi, K.,
Hijioka, Y., Takemura, T., Nozawa, T. and Emori, S.: Emission scenario dependencies in climate change assessments of the hydrological cycle, Climatic Change, DOI: 10.1007/s10584-009-9765-1, in press. http://www.springerlink.com/content/k4223u6px5677467/?p=1460a4ebf9054aa8ac8ca8befdca0e76&pi=15
• Hanasaki, N., Inuzuka, T., Kanae, S., Oki, T.: An estimation of global virtual water flow and sources of water withdrawal for major crops and livestock products using a global hydrological model, Journal of Hydrology, in print doi:10.1016/j.jhydrol.2009.09.028 http://dx.doi.org/10.1016/j.jhydrol.2009.09.028
• Hanasaki, N., Kanae, S., Oki, T., Masuda, K., Motoya, K., Shirakawa, N., Shen, Y., and Tanaka, K.: An integrated model for the assessment of global water resources –Part 1: Model description and input meteorological forcing, Hydrology and Earth System Sciences, 12, 1007-1025, 2008 http://direct.sref.org/1607-7938/hess/2008-12-1007
• Hanasaki, N., Kanae, S., Oki, T., Masuda, K., Motoya, K., Shirakawa, N., Shen, Y., and Tanaka, K.: An integrated model for the assessment of global water resources –Part 2: Applications and assessments, Hydrology and Earth System Sciences, 12, 1027-1037, 2008. http://direct.sref.org/1607-7938/hess/2008-12-1027
See: http://hydro.iis.u-tokyo.ac.jp/~hanasaki/pmwiki/index.php?n=CV.English