Key Performance Indicators for Facility Operations (from ASBO MD & DC Savings Summit)

Journal of Leisure Research Copyright 20132013, Vol. 45, No. 3, pp. 345-366 National Recreation and Park Association
Mark D. Needham is an associate professor in the Department of Forest Ecosystems and Society at Oregon State University.
Robyn L. Ceurvorst is an assistant professor in the Department of Environment and Society at Utah State University.
Joanne F. Tynon is an associate professor in the Department of Forest Ecosystems and Society at Oregon State University.
Address correspondence to Dr. Mark D. Needham, Department of Forest Ecosystems and Society, Oregon State University, Corvallis, Oregon, USA, 97331, phone: +1-541-737-1498, fax: +1-541-737-1393, [email protected]
The authors thank Michael Hamnett, Kristine Davidson, Risa Minato, and Pamela Fujii at Hawai`i Coral Reef Initiative; and Athline Clark, Carlie Wiener, Emma Anders, and Petra MacGowan at Hawai`i Division of Aquatic Resources for their support. Sherwood Maynard and Jeff Kuwabara at the University of Hawai`i Marine Option Program are also thanked for their assistance. Rhonda Collins, Will Connor, Molly Jean Culnane, Shawn Date, and Holly Needham assisted with data collection. Two anonymous reviewers, an associate editor, and the editor are also thanked for helpful comments on earlier versions of this article. This project was supported by the Hawai`i Coral Reef Initiative Research Program and Hawai`i Division of Aquatic Resources, Department of Land and Natural Resources pursuant to National Oceanic and Atmospheric Administration awards NA06NOS4260200 and NA05NOS4191014.
Toward an Approach for Measuring Indicators of Facility Carrying Capacity in Outdoor Recreation Areas
Mark D. Needham Oregon State University
Robyn L. CeurvorstUtah State University
Joanne F. TynonOregon State University
Abstract
This article uses data from 1,399 individuals at six sites in Hawai`i to examine congruence among their encounters, norms, and satisfaction with six types of facilities (e.g., trash cans, bathrooms, signs) and the actual number of these facili-ties. The majority of users recalled encountering fewer of each facility than the number they believed should be at each site (i.e., their norm) and these users were least satisfied with these facilities. When user norms were compared to the actual number of facilities, however, there were enough of most facilities to meet these norms. Combining the number of facilities with the observation—norm—evalu-ation approach used in many social carrying capacity studies (e.g., encounters, norms, crowding) may be useful for measuring indictors of facility capacity.
KEYWORDS: Facility carrying capacity, norms, satisfaction, indicators, standards of quality
NEEDHAM, CEURVORST, AND TYNON
Introduction
People often require some amenities, services, and facilities (e.g., trash cans, parking, signs) when visiting a recreation site, and the number and condition of these are important for meeting user needs (Bastmeijer, Lamers, & Harcha, 2008; Borrie, McCool, & Stankey, 1998; Coccossis & Mexa, 2004; Manning, 2011). Visi-tation, however, can impact and place demands on these amenities and facili-ties, thereby depreciating conditions and affecting the quality of user experiences (Donnelly, Vaske, DeRuiter, & King, 1996; Mexa & Collovini, 2004). The concept of carrying capacity is one approach that has been used extensively for addressing these types of impacts associated with recreation (see Manning, 2007; Shelby & Heberlein, 1986 for reviews).
There are three main types of recreation carrying capacities (Shelby & Heber-lein, 1986). First, social carrying capacity is the level of use beyond which social impacts such as crowding and conflict exceed acceptable levels specified by evalu-ative standards. Second, environmental or resource capacity is when biophysical factors cannot withstand a level of use, thereby creating unacceptable changes to resource indicators such as soils and vegetation. Third, facility capacity involves the amount and/or condition of infrastructure such as bathrooms, signs, and parking that accommodate the needs of some users. Social and environmental ca-pacities have received substantial empirical attention in the recreation literature, whereas there have been comparatively fewer studies addressing facility capacity issues (see Manning, 2007, 2011 for reviews).
Social capacity studies have primarily measured concepts such as the number of user encounters with other people, and user evaluations such as crowding and norms (see Vaske & Donnelly, 2002; Vaske & Shelby, 2008 for reviews). One line of research defines norms as standards that individuals use for evaluating activi-ties, environments, or management strategies as good or bad, better or worse (e.g., Donnelly, Vaske, Whittaker, & Shelby, 2000; Vaske, Shelby, Graefe, & Heberlein, 1986). Norms clarify what people believe conditions or behavior should or should not be in an area. When users perceive a setting to be over its social capacity, they likely compared conditions that they experienced (e.g., encounters) with their normative evaluations of what they feel conditions (e.g., use levels) should or should not be for the setting (Vaske & Donnelly, 2002). Users who encounter more people than their norm are more likely to feel that a site’s social capacity is being exceeded and report a dissatisfactory experience such as feeling crowded (Man-ning, 2011; Needham, Rollins, & Wood, 2004; Vaske & Donnelly, 2002).
It is possible that a similar approach could be adopted to examine facility ca-pacity issues where respondents could report their observations of facilities (e.g., encounters with facilities), norms for facilities, and evaluations of these facilities (e.g., satisfaction with facilities). This article uses data from several coastal sites in Hawai`i to examine this approach by measuring congruence among the actual numbers of facilities (e.g., bathrooms, trash cans, signs) and user observations, norms, and satisfaction with these facilities to inform management and monitor-ing.
MEASURING FACILITY CARRYING CAPACITY INDICATORS
Conceptual Foundation
Early applications of the carrying capacity concept in recreation often sought to establish a number or capacity across dimensions of a setting (i.e., social, envi-ronmental, facility; Shelby & Heberlein, 1986). Researchers argued, however, that this approach may not be useful for addressing complex use related issues while maintaining resources, experiences, and facilities (Graefe, Vaske, & Kuss, 1984; Manning, 2011). Recognizing that most recreation causes some impacts and ob-taining precise numbers to represent capacities across these dimensions may be unrealistic, the question of “how much use is too much” shifted to “how much use or impact is acceptable or should be allowed” (Manning, 2011). This approach is central to planning and management frameworks such as Limits of Acceptable Change (LAC), Visitor Impact Management (VIM), and Visitor Experience and Re-source Protection (VERP; Manning, 2004; Nilsen & Tayler, 1998). These frame-works emphasize addressing environmental (e.g., trail erosion), social (e.g., crowd-ing), and managerial indicators (e.g., facilities). These indicators are measured to reveal standards of quality or thresholds where conditions become unacceptable or should not be allowed (e.g., less than 25% of users should feel crowded). Indi-cators are monitored to ensure that standards are not violated and settings and experiences do not deteriorate.
Decisions regarding these indicators and standards can be subjective, and user input has typically been incorporated, especially in studies examining en-vironmental and social capacity issues. Many studies on social capacity, for ex-ample, have asked users to report their number of encounters with other users, specify their norms or minimum acceptable number of encounters, and evaluate conditions by reporting their level of satisfaction or perceptions of crowding (see Manning, 2007, 2011; Shelby, Vaske, & Donnelly, 1996; Vaske & Donnelly, 2002 for reviews). This body of research has consistently found that recreationists who encounter more people than their norm are often more likely to feel that a site’s social capacity is being exceeded and report a dissatisfactory experience such as feeling crowded (e.g., Needham et al., 2004; Vaske & Donnelly, 2002). Despite this research examining congruence among these concepts (i.e., encounters, norms, crowding) and applying this observation—norm—evaluation approach to social capacity issues, comparatively fewer studies have investigated facility carrying ca-pacities in recreation areas or used a similar systematic approach to address facility issues. It is possible that if the number and/or condition of facilities encountered by the majority of users at a given site is lower or worse than they feel should be present (i.e., norm), there could be a perceived problem with the site’s facility ca-pacity and these users could be less satisfied with its facilities.
Approaches for examining facility capacity issues in recreation, however, have been mixed. One line of research has examined these issues using mostly objective and descriptive use statistics, monitoring, and landscape design approaches such as supply and demand thresholds, physical space, use patterns, and performance of site attributes (see Butler, 2004; Manning, 2007, 2011; Shindler & Shelby, 1992 for reviews). Fisher and Krutilla (1972), for example, predicted optimum facility capacity using an econometric model outlining costs, benefits, and willingness to
NEEDHAM, CEURVORST, AND TYNON
pay to optimize facility benefits. A study on the Klamath River in Oregon used a different approach by evaluating inadequacy of facilities for launching boats (e.g., increased wait time, competition to launch, space not accommodating demand), physical capacity or density, and sanitation pressures (e.g., lack of toilets, wait time at toilets; Shelby & Stein, 1984). Some studies have also integrated spatial or landscape density information into facility assessments (e.g., Emphandhu, Ye-min, Pattanakiat, Tantasirin, Ruschano, Chettamart, & Nasa, 2006; Oh, 1998) and used approaches such as analysis of geographic information system data to exam-ine pressures on facilities and other aspects of recreation settings (see Gimblett & Skov-Petersen, 2008; Kliskey, 1998 for reviews). Most of these studies emphasize the importance of descriptive landscape design issues and monitoring actual use patterns to determine demand and capacities for facilities and services in recre-ation settings.
A second line of research has examined facilities from a more subjective and evaluative perspective by focusing on the importance of facilities to users and their satisfaction with the number and/or condition of these amenities and services. Recreation satisfaction has been defined as positive perceptions or feelings that an individual forms, elicits, or gains from engaging in activities or visiting settings; it is the degree that he or she is content or pleased with the experiences, condi-tions, and/or situations (Beard & Ragheb, 1980; Dorfman, 1979; Manning, 2011). Several studies, for example, have used importance–performance analysis to assess the importance that users attribute to various facilities and also their satisfaction with these facilities (e.g., Hollenhorst & Gardner, 1994; Hollenhorst, Olson, & Fortney, 1992; Tonge & Moore, 2006; Vaske, Beaman, Stanley, & Grenier, 1996). Some studies have also measured other cognitions of users including their norms toward facilities and services such as hardened trails, campfire rings and grates, and transportation services (e.g., Hallo & Manning, 2009; Needham et al., 2011; Shelby, Vaske, & Harris, 1988). A few studies have also used methods such as stated choice and conjoint modeling to evaluate user preferences and tradeoffs for facil-ity improvements and development (Arnberger & Haider, 2007; Cahill, Marion, & Lawson, 2008; Lew & Larson, 2005; Needham & Szuster, 2011). These studies have emphasized the importance of incorporating user evaluations in decisions about facilities and services in recreation areas.
Some research has also combined these user evaluations with more descrip-tive landscape design and use pattern data to examine facility capacity issues. A few studies, for example, have measured the actual physical size of facilities, avail-able space, and use level patterns that facilities can accommodate based on the type of setting (e.g., frontcountry, backcountry), as well as experiences sought by users (e.g., wilderness, high use) and facility attributes they desire (see Manning, 2007, 2011; Shelby & Heberlein, 1986 for reviews). Frameworks such as LAC, VIM, and VERP emphasize the importance of integrating objective and descriptive in-formation about a recreation system (e.g., actual use levels, landscape patterns) with evaluative data addressing the more subjective issue of how much impact or change is acceptable or unacceptable (e.g., user norms, satisfaction; Manning, 2004). These frameworks also emphasize that recreation planning and manage-ment should be participatory by involving evaluations by stakeholders such as users (Manning, 2011). Descriptive information such as the number of facilities

MEASURING FACILITY CARRYING CAPACITY INDICATORS
or how use patterns impact facilities help to describe existing conditions, but may not reveal maximum acceptable numbers of facilities or an understanding of how facilities should be managed. Incorporating evaluative information such as user norms facilitates an understanding of conditions that should and should not be allowed, thereby providing a basis for formulating standards of quality that can be used for informing management. Management efforts incorporating user evalua-tions about the quality, type, location, and number of facilities can be useful for avoiding complaints or opposition to management, loss of interest in visiting a site, and lack of financial support for a site (Eagles & McCool, 2002; Gunn, 1997; Needham & Szuster, 2011). Several social carrying capacity studies, therefore, inte-grate descriptive data such as actual use counts with evaluative information such as crowding and norms (see Manning, 2007, 2011; Vaske & Donnelly, 2002 for reviews).
Few studies, however, have implemented a systematic approach for address-ing facility issues similar to techniques followed in some of the social capacity literature (i.e., encounters, norms, crowding) by examining relationships among the actual number or condition of facilities, what users feel are appropriate num-bers or conditions of these facilities, and user evaluations such as satisfaction with these facilities. This article is exploratory and helps to address this knowledge gap by adopting this observation–norm–evaluation approach from the social capacity literature (e.g., Needham et al., 2004; Vaske & Donnelly, 2002) and extending it to investigate facility capacity issues at six coastal recreation sites in Hawai`i. This article has three primary objectives. The first objective is to record how many fa-cilities are actually at each site and how many facilities users report encountering (e.g., bathrooms, trash cans, signs). The second objective is to measure user norms regarding the number of facilities that they feel should be at each site. The third objective is to determine what proportion of users encounter fewer facilities than they believe should be at each site and whether this reduces their satisfaction with facilities, and then compare these evaluations to the actual number of facilities at each site.
Methods
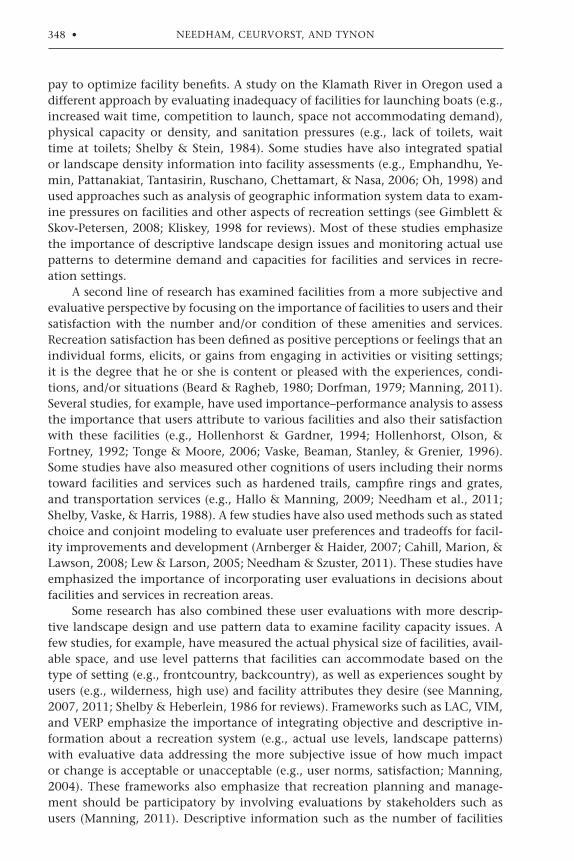
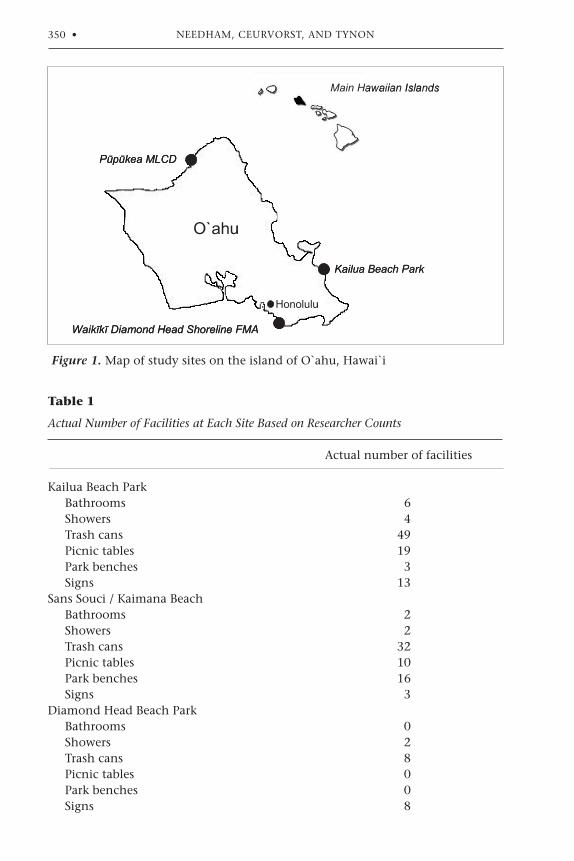
Data were obtained from questionnaires administered to people visiting sev-eral coastal areas on the island of O`ahu, Hawai`i: Pupukea Marine Life Conserva-tion District (MLCD), Waikiki – Diamond Head Shoreline Fisheries Management Area (FMA), and Kailua Beach Park (Figure 1). These were priority sites identified for study by local and state agencies. Pupukea MLCD is on the north shore of O`ahu and questionnaires were administered at three sites: Waimea Bay, Three Tables, and Shark’s Cove. The most common facilities at Waimea Bay are trash cans, park benches, picnic tables, and signs, but there are also a few showers and bathrooms (Table 1). Three Tables has several signs and trash cans, two bathrooms, and one table, but does not have benches or showers. The most common facilities at Shark’s Cove are trash cans and signs. There are also two bathrooms and one shower at this site, but no tables or benches.
Waikiki – Diamond Head Shoreline FMA is on the leeward south coast of the island and extends from the Waikiki War Memorial Natatorium east to Diamond
NEEDHAM, CEURVORST, AND TYNON
O`ahu
Honolulu
P p kea MLCD
Waik k Diamond Head Shoreline FMA
Kailua Beach Park
Main Hawaiian IslandsMain Hawaiian Islands
O`ahu
Honolulu
P p kea MLCD
k Diamond Head Shoreline FMA
Kail
O`ahu
Honolulu
P p kea MLCD
Waik k Diamond Head Shoreline FMA
Kailua Beach Park
Main Hawaiian IslandsMain Hawaiian Islands
Figure 1. Map of study sites on the island of O`ahu, Hawai`i
Table 1
Actual Number of Facilities at Each Site Based on Researcher Counts Actual number of facilities
Kailua Beach Park Bathrooms 6 Showers 4 Trash cans 49 Picnic tables 19 Park benches 3 Signs 13Sans Souci / Kaimana Beach Bathrooms 2 Showers 2 Trash cans 32 Picnic tables 10 Park benches 16 Signs 3Diamond Head Beach Park Bathrooms 0 Showers 2 Trash cans 8 Picnic tables 0 Park benches 0 Signs 8

MEASURING FACILITY CARRYING CAPACITY INDICATORS
Head Lighthouse. Questionnaires were administered at two sites in this area: Sans Souci/Kaimana Beach and Diamond Head Beach Park. At Sans Souci/Kaimana Beach, the most common facilities are trash cans followed by park benches and picnic tables (Table 1). There are only a few signs, showers, and bathrooms at this site. Diamond Head Beach Park is less developed and only has a few trash cans, signs, and showers, but does not have any bathrooms, tables, or benches.
Kailua Beach Park is on the windward northeast coast of the island and the most common facility at this site is trash cans followed by picnic tables and infor-mation signs (Table 1). There are also a few bathrooms, showers, and park benches at this site. Although all of these sites have regulatory and jurisdictional differ-ences in that they range from a state marine protected area to a county beach park, they have similar activity groups (e.g., swimmers, beach walkers) and natural resources (e.g., beaches). With the exception of Kailua Beach Park where there are multiple entry points and facilities are somewhat dispersed, all of the other sites are relatively small, have just one or two access points, have only short distances between the parking areas and beaches, and all facilities are concentrated and vis-ible from most vantage points (Needham et al., 2008).
Individuals visiting these sites in July and August 2007 were approached and asked to complete a questionnaire onsite. Use trends show only marginal seasonal
Table 1 (cont.)
Actual number of facilities
Waimea Bay Bathrooms 2 Showers 2 Trash cans 20 Picnic tables 11 Park benches 13 Signs 6Three Tables Bathrooms 2 Showers 0 Trash cans 9 Picnic tables 1 Park benches 0 Signs 11Shark’s Cove Bathrooms 2 Showers 1 Trash cans 10 Picnic tables 0 Park benches 0 Signs 6
NEEDHAM, CEURVORST, AND TYNON
variation in visitation to coastal and marine areas in Hawai`i (Friedlander et al., 2005). To increase the probability of achieving a representative sample of summer users, sampling alternated so that questionnaires were administered at each site at least once for each day of the week and at least once for each of three time periods each day (8:00 to 10:30 a.m., 11:30 a.m. to 2:00 p.m., 3:00 to 5:30 p.m.). Individu-als were selected through systematic random sampling where one random person was selected from every 5th or 10th selected group depending on size of the site. Sampling did not occur as soon as users arrived at the site or at the end of their vis-it as they were leaving. Instead, users were intercepted on the beach or in the park areas during their visit to improve the chance that questionnaire responses would be more informed and not based on limited knowledge or lack of familiarity with the site. In total, 1,399 questionnaires were completed by users and the overall re-sponse rate was 87%. Sample sizes were n = 491 at Pupukea MLCD (Waimea Bay: n = 197, Three Tables: n = 147, Shark’s Cove: n = 147), n = 463 at Waikiki – Diamond Head Shoreline FMA (Sans Souci/Kaimana Beach: n = 296, Diamond Head Beach Park: n = 167), and n = 445 at Kailua Beach Park. No recent or accurate data exist on actual use levels at each site to determine if these sample sizes are proportional to visitation (Friedlander et al., 2005).
The questionnaires addressed three facility capacity measures at each site–re-spondent: (a) observations or number of encounters (i.e., number seen) with six types of facilities at the site where they were surveyed (bathrooms, showers/rinse stations, trash cans, picnic tables, park benches, information signs about regula-tions/guidelines), (b) norms regarding how many of each of these facilities they felt should be at the site, and (c) evaluations of their satisfaction with each of these facilities at the site. To measure encounters with facilities, questionnaires asked respondents “how many of each of the following facilities have you seen at [the site where they were surveyed]” and instructed them to circle one number from a list of 16 numbers (0 to 20+) for each of the six facilities. To measure respondent norms regarding these facilities, they were asked, “how many of each of the fol-lowing facilities do you feel should be at [the site where they were surveyed]” and instructed to circle one number from a list of 16 numbers (0 to 20+) for each of the six facilities. Respondents were asked the extent that they were satisfied with each of these facilities at the site on 5-point scales of 1 “very dissatisfied” to 5 “very satisfied.” The actual number of each type of facility was counted and recorded by researchers during site visits.
The first step in the analysis was to describe the sociodemographic character-istics of respondents at each site and use chi-square ( 2) and analysis of variance (F) tests to examine differences among sites. The 2 test is typically used when the independent variable (e.g., site) and dependent variable (e.g., male, female) are coded as dichotomous or categorical, whereas the F test is typically used when the independent variable is categorical and the dependent (e.g., age) is continu-ous (Vaske, 2008). The second step involved reporting descriptive statistics (e.g., means) for respondent observations or number of encounters with facilities at each site, norms regarding how many facilities they felt should be at each site, and satisfaction with the facilities. The third step involved comparing respondent

MEASURING FACILITY CARRYING CAPACITY INDICATORS
norms to their observations by creating new variables grouping respondents into two groups for each facility at each site–those who encountered: (a) fewer of the facility than they felt should be at the site (i.e., their norm), and (b) the same num-ber or more of the facility than they felt should be at the site. A similar approach was used for comparing norms to the actual number of each facility at each site. The fourth step compared these two groups (i.e., encountered fewer facilities than their norm, encountered the same or more than their norm) in terms of their sat-isfaction with each facility at each site using independent samples t-tests, which are used when the independent variable (i.e., two groups) is dichotomous and the dependent (i.e., satisfaction) is continuous (Vaske, 2008). Given that a goal of this study was to adopt the observation–norm–evaluation approach used in social capacity studies (e.g., encounters, norms, crowding; Needham et al., 2004; Vaske & Donnelly, 2002) and apply it to facilities, this analytical approach was chosen because it is identical to these studies.
These inferential statistical tests can reveal relationships or differences among variables, but limited information about the strength or magnitude of these re-lationships or differences. Effect size statistics can help address this issue and corresponding effect sizes include Cramer’s V for 2 tests, eta ( ) for F tests, and point-biserial correlation (rpb) for independent samples t-tests (see Vaske, 2008 for a review). Using guidelines from Cohen (1988) and Vaske (2008), Cramer’s V val-ues of .10, .30, and .50, and and rpb values of .10, .24, and .37 can be considered “small” or “minimal,” “medium” or “typical,” and “large” or “substantial,” respec-tively.
Results
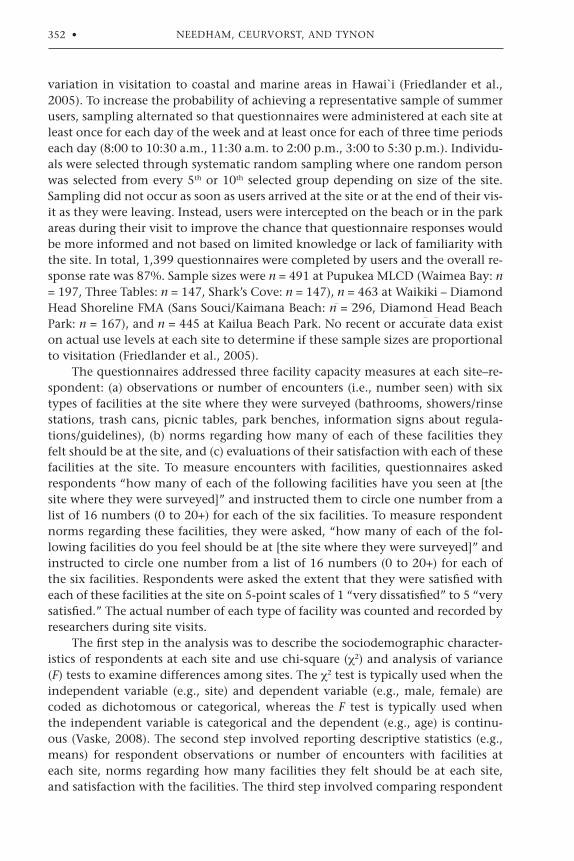
In total, 57% of respondents were female and 43% were male (Table 2). There was, however, a statistically significant difference among the six sites, as the ma-jority of users at Diamond Head Beach Park were male (68%), whereas the majority at the other sites were female (56% to 64%), 2 = 95.56, p < .001. The Cramer’s V ef-fect size of .19 suggests that this difference among sites in the proportions of males and females was between “small” and “medium” (Cohen, 1988) or “minimal” and “typical” (Vaske, 2008). The average age of respondents was 38 years, but those at Diamond Head Beach Park (M = 34 years) and Waimea Bay (M = 35 years) were significantly younger than those at the other sites (M = 37 to 40 years), F = 11.12, p < .001. The Eta ( ) of .15 suggests that this difference among sites was relatively “small” (Cohen, 1988) or “minimal” (Vaske, 2008). The majority of respondents (56%) were local residents of Hawai`i; 44% lived in other states or countries. Over 70% of users at Sans Souci / Kaimana Beach (71%) and Diamond Head Beach Park (77%) were residents of Hawai`i and 46% to 59% of those at the other sites lived in this state, 2 = 171.77, p < .001, V = .26. Most respondents (76%) had previously visited the site where they were surveyed and only 24% were first time visitors on the day that they were surveyed. Slightly fewer respondents were repeat visitors to Shark’s Cove (59%) and Three Tables (63%) compared to the other sites (71% to 88%), 2 = 143.17, p < .001, V = .23.1
NEEDHAM, CEURVORST, AND TYNON
Table 2
Sociodemographic Profile of Respondents at Each Site1
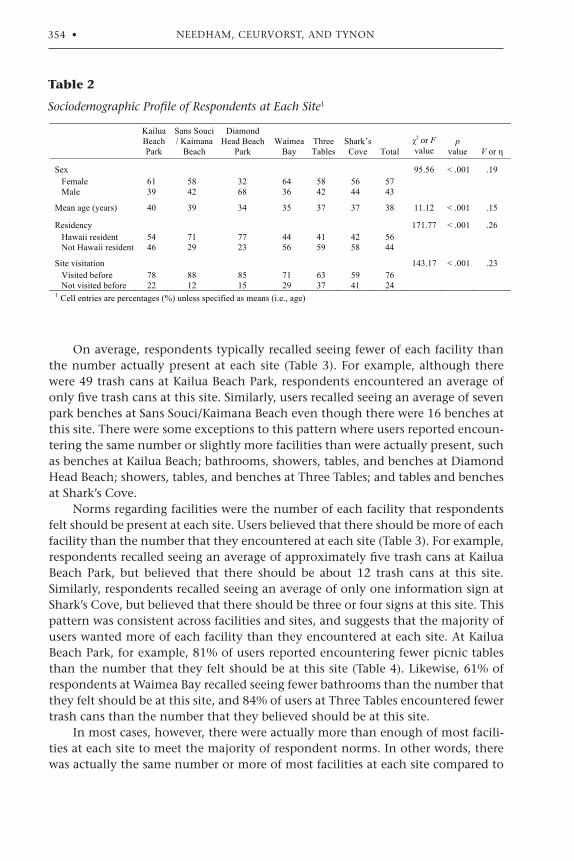
On average, respondents typically recalled seeing fewer of each facility than the number actually present at each site (Table 3). For example, although there were 49 trash cans at Kailua Beach Park, respondents encountered an average of only five trash cans at this site. Similarly, users recalled seeing an average of seven park benches at Sans Souci/Kaimana Beach even though there were 16 benches at this site. There were some exceptions to this pattern where users reported encoun-tering the same number or slightly more facilities than were actually present, such as benches at Kailua Beach; bathrooms, showers, tables, and benches at Diamond Head Beach; showers, tables, and benches at Three Tables; and tables and benches at Shark’s Cove.
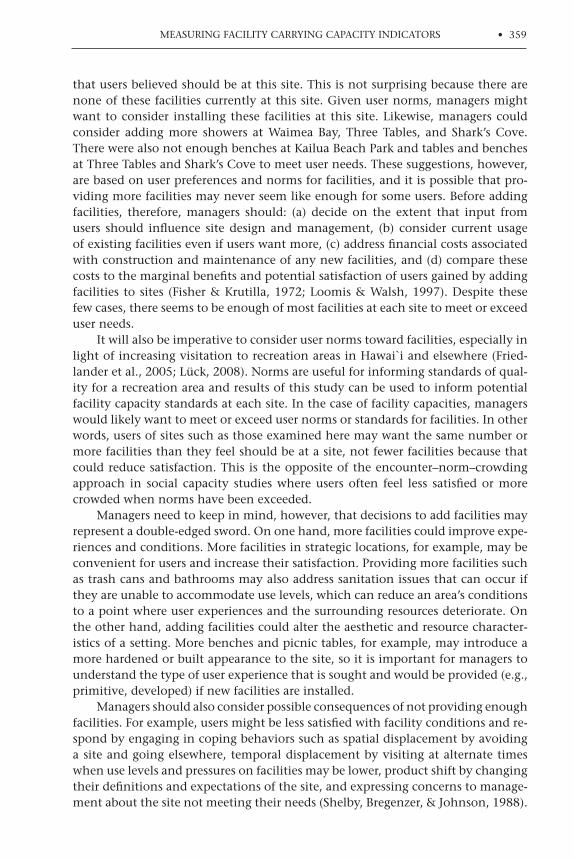
Norms regarding facilities were the number of each facility that respondents felt should be present at each site. Users believed that there should be more of each facility than the number that they encountered at each site (Table 3). For example, respondents recalled seeing an average of approximately five trash cans at Kailua Beach Park, but believed that there should be about 12 trash cans at this site. Similarly, respondents recalled seeing an average of only one information sign at Shark’s Cove, but believed that there should be three or four signs at this site. This pattern was consistent across facilities and sites, and suggests that the majority of users wanted more of each facility than they encountered at each site. At Kailua Beach Park, for example, 81% of users reported encountering fewer picnic tables than the number that they felt should be at this site (Table 4). Likewise, 61% of respondents at Waimea Bay recalled seeing fewer bathrooms than the number that they felt should be at this site, and 84% of users at Three Tables encountered fewer trash cans than the number that they believed should be at this site.
In most cases, however, there were actually more than enough of most facili-ties at each site to meet the majority of respondent norms. In other words, there was actually the same number or more of most facilities at each site compared to
Kailua Beach Park
Sans Souci / Kaimana
Beach
Diamond Head Beach
Park
Waimea
Bay
Three Tables
Shark’s Cove
Total
2 or F value
p
value
V or
Sex 95.56 < .001 .19 Female 61 58 32 64 58 56 57 Male 39 42 68 36 42 44 43
Mean age (years) 40 39 34 35 37 37 38 11.12 < .001 .15
Residency 171.77 < .001 .26 Hawaii resident 54 71 77 44 41 42 56 Not Hawaii resident 46 29 23 56 59 58 44
Site visitation 143.17 < .001 .23 Visited before 78 88 85 71 63 59 76 Not visited before 22 12 15 29 37 41 24 1 Cell entries are percentages (%) unless specified as means (i.e., age)

MEASURING FACILITY CARRYING CAPACITY INDICATORS
Mean number of facilities encountered
Mean number of facilities that should be present (norm)
Mean satisfaction with facilities (1 = very dissatisfied, 5 = very satisfied)
Kailua Beach Park Bathrooms 2.27 4.25 3.48 Showers 2.41 4.74 3.79 Trash cans 5.39 11.58 3.82 Picnic tables 4.08 9.25 3.48 Park benches 3.06 8.40 3.38 Signs 2.64 6.90 3.44 Sans Souci / Kaimana Beach Bathrooms 1.37 2.91 3.17 Showers 1.92 3.11 3.75 Trash cans 4.79 7.59 3.96 Picnic tables 3.09 6.08 3.36 Park benches 7.11 8.43 3.75 Signs 1.97 3.72 3.42 Diamond Head Beach Park Bathrooms 0.48 1.91 2.60 Showers 2.11 2.93 3.98 Trash cans 2.99 6.47 3.37 Picnic tables 0.62 2.32 3.28 Park benches 0.73 2.67 3.34 Signs 2.91 4.39 3.35 Waimea Bay Bathrooms 1.54 2.80 3.31 Showers 1.97 3.34 3.86 Trash cans 4.14 8.89 3.60 Picnic tables 4.03 7.47 3.49 Park benches 2.48 6.31 3.39 Signs 2.47 5.37 3.70 Three Tables Bathrooms 0.98 2.21 3.24 Showers 0.60 2.40 2.70 Trash cans 2.05 5.31 3.53 Picnic tables 1.09 3.55 3.24 Park benches 0.61 3.00 3.22 Signs 1.43 3.49 3.29 Shark’s Cove Bathrooms 1.26 2.18 3.43 Showers 1.00 2.27 3.68 Trash cans 2.77 5.80 3.78 Picnic tables 0.41 2.91 3.26 Park benches 0.39 2.74 3.17 Signs 1.37 3.74 3.36
Table 3
Number of Facilities Encountered, Norms, and Satisfaction with Facilities
the number that the majority of users felt should be at each site. At Kailua Beach Park, for example, the actual number of picnic tables was equal to or greater than the number desired by 86% of respondents (Table 4). Similarly, the actual number of bathrooms at Waimea Bay was equal to or greater than the number of bath-rooms that 62% of respondents felt should be at this site. There were a few excep-tions to this pattern where the actual number of a facility at a site was still lower than the number that the majority of respondents felt should be at the site. At Kailua Beach Park, for example, 83% of respondents felt that there should be more park benches than there actually were at this site, and the majority of users at Diamond Head Beach Park felt that there should be more bathrooms (73%), tables (52%), and benches (57%) than what was actually present at this site.

NEEDHAM, CEURVORST, AND TYNON
Facility encounters compared to norm (%)
Actual number of facilities compared to norm (%)
Fewer facilities seen than norm
Same or more facilities seen than norm
Fewer actual facilities than norm
Same or more actual facilities than norm
Kailua Beach Park Bathrooms 71 29 13 87 Showers 73 27 37 63 Trash cans 83 17 0 100 Picnic tables 81 19 14 86 Park benches 84 16 83 17 Signs 82 18 11 89 Sans Souci / Kaimana Beach Bathrooms 73 27 34 66 Showers 64 36 47 53 Trash cans 69 31 0 100 Picnic tables 71 29 9 91 Park benches 43 56 7 93 Signs 71 29 42 58 Diamond Head Beach Park Bathrooms 65 35 73 27 Showers 54 46 37 63 Trash cans 82 18 24 76 Picnic tables 48 52 52 48 Park benches 51 49 57 43 Signs 58 42 11 89 Waimea Bay Bathrooms 61 39 38 62 Showers 67 33 51 49 Trash cans 84 16 0 100 Picnic tables 75 25 16 84 Park benches 79 21 9 91 Signs 79 21 25 75 Three Tables Bathrooms 67 33 20 80 Showers 83 17 96 4 Trash cans 84 16 12 88 Picnic tables 70 30 76 24 Park benches 76 24 80 20 Signs 72 28 5 95 Shark’s Cove Bathrooms 57 43 24 76 Showers 63 37 68 32 Trash cans 81 19 4 96 Picnic tables 70 30 72 28 Park benches 63 37 68 32 Signs 73 27 12 88
Table 4
Relationships among Number of Facilities Encountered, Norms, and Actual Numbers of Facilities

MEASURING FACILITY CARRYING CAPACITY INDICATORS
Mean satisfaction with facilities (1 = very dissatisfied, 5 = very satisfied)
Fewer facilities seen than norm
Same or more facilities seen than norm
t value
p value
rpb
Kailua Beach Park Bathrooms 3.36 3.67 2.35 .020 .13 Showers 3.70 4.02 2.92 .004 .15 Trash cans 3.76 4.07 2.33 .021 .12 Picnic tables 3.40 3.74 2.72 .007 .15 Park benches 3.33 3.62 1.73 .089 .11 Signs 3.37 3.67 2.01 .045 .11 Sans Souci / Kaimana Beach Bathrooms 2.91 3.81 6.17 < .001 .36 Showers 3.55 4.12 4.86 < .001 .27 Trash cans 3.92 4.14 1.93 .055 .12 Picnic tables 3.32 3.55 2.16 .032 .14 Park benches 3.75 3.79 0.48 .635 .03 Signs 3.38 3.58 1.59 .114 .10 Diamond Head Beach Park Bathrooms 2.17 3.49 5.83 < .001 .46 Showers 3.79 4.17 2.35 .020 .19 Trash cans 3.24 3.76 1.98 .049 .17 Picnic tables 2.90 3.59 3.57 .001 .30 Park benches 3.01 3.63 3.33 .001 .28 Signs 3.15 3.56 2.18 .031 .19 Waimea Bay Bathrooms 3.24 3.39 0.91 .362 .07 Showers 3.75 4.05 2.29 .023 .17 Trash cans 3.53 4.16 2.83 .005 .21 Picnic tables 3.34 3.82 2.78 .007 .23 Park benches 3.31 3.61 1.74 .083 .14 Signs 3.62 3.97 2.64 .010 .18 Three Tables Bathrooms 2.96 3.80 4.36 < .001 .37 Showers 2.54 3.43 3.63 < .001 .31 Trash cans 3.39 4.44 4.46 < .001 .37 Picnic tables 3.04 3.75 4.25 < .001 .38 Park benches 3.10 3.59 2.68 .010 .25 Signs 3.12 3.87 4.05 < .001 .34 Shark’s Cove Bathrooms 3.24 3.76 2.56 .012 .23 Showers 3.45 4.13 3.97 < .001 .32 Trash cans 3.73 4.30 2.63 .010 .24 Picnic tables 3.14 3.54 2.41 .017 .22 Park benches 3.10 3.29 1.09 .277 .10 Signs 3.20 3.79 3.01 .003 .27
Table 5
Relationships among Number of Facilities Encountered, Norms, and Satisfaction with Facilities

NEEDHAM, CEURVORST, AND TYNON
On average, users who encountered the same number or more of each facil-ity at each site than their norms for these facilities reported higher satisfaction with these facilities than those who encountered fewer of each facility than they thought should be at each site (Table 5). In other words, users were more satisfied with facilities when the number of these facilities met or exceeded their norm. For example, users who recalled seeing fewer bathrooms at Sans Souci/Kaimana Beach than the number that they believed should be at this site were less satisfied with the bathrooms at this site (M = 2.91) than those who felt that the number of bathrooms was sufficient (i.e., encountered the same or more than their norm; M = 3.81). This pattern was consistent across all facilities and sites, and was statisti-cally significant in 29 of 36 comparisons, t = 1.98 to 6.17, p = .049 to < .001. Effect sizes for these significant comparisons ranged from rpb = .11 to .46 and averaged .25, suggesting a “medium” (Cohen, 1988) or “typical” (Vaske, 2008) relationship among facility encounters, norms, and evaluations of the facilities (i.e., satisfac-tion).
Discussion
This article applied the observation–norm–evaluation approach used in the social capacity literature (e.g., encounters, norms, crowding) to investigate facility capacity issues at coastal recreation sites in Hawai`i. Four measures of facility ca-pacities were examined: (a) the actual number of six types of facilities at each site, (b) user encounters (i.e., number observed) with these facilities, (c) their norms about how many of each of these facilities should be at each site, and (d) user satisfaction with these facilities. The majority of users at each site recalled seeing fewer facilities than there actually were at each site, and also encountered fewer fa-cilities than the number that they thought should be at each site (i.e., their norm). When norms were compared to the actual number of facilities at each site, how-ever, there were enough of most facilities, as there was actually the same number or more of most facilities than the number that users felt should be at each site. Exceptions were at sites where there were few or none of a particular facility. Users who encountered fewer facilities than their norm were also less satisfied with fa-cilities. In other words, the majority of users saw fewer of most facilities than they believed should be at each site and these individuals were less satisfied with these facilities. When compared to the actual number of facilities, however, there were enough of most facilities to meet user norms. These findings have implications for management, theory, and research.
Implications for ManagementFrom a management perspective, the majority of users generally reported en-
countering fewer facilities than they felt should be at each site and wanted more of most facilities. However, when the number of each facility that users felt should be at each site was compared to the number that was actually present, there were enough of most facilities, which suggests that managers may not need to add more of all facilities at these sites. There were, however, some exceptions to this pattern, especially at sites with few or no facilities. At Diamond Head Beach Park, for example, there were fewer bathrooms, tables, and benches than the number
MEASURING FACILITY CARRYING CAPACITY INDICATORS
that users believed should be at this site. This is not surprising because there are none of these facilities currently at this site. Given user norms, managers might want to consider installing these facilities at this site. Likewise, managers could consider adding more showers at Waimea Bay, Three Tables, and Shark’s Cove. There were also not enough benches at Kailua Beach Park and tables and benches at Three Tables and Shark’s Cove to meet user needs. These suggestions, however, are based on user preferences and norms for facilities, and it is possible that pro-viding more facilities may never seem like enough for some users. Before adding facilities, therefore, managers should: (a) decide on the extent that input from users should influence site design and management, (b) consider current usage of existing facilities even if users want more, (c) address financial costs associated with construction and maintenance of any new facilities, and (d) compare these costs to the marginal benefits and potential satisfaction of users gained by adding facilities to sites (Fisher & Krutilla, 1972; Loomis & Walsh, 1997). Despite these few cases, there seems to be enough of most facilities at each site to meet or exceed user needs.
It will also be imperative to consider user norms toward facilities, especially in light of increasing visitation to recreation areas in Hawai`i and elsewhere (Fried-lander et al., 2005; Lück, 2008). Norms are useful for informing standards of qual-ity for a recreation area and results of this study can be used to inform potential facility capacity standards at each site. In the case of facility capacities, managers would likely want to meet or exceed user norms or standards for facilities. In other words, users of sites such as those examined here may want the same number or more facilities than they feel should be at a site, not fewer facilities because that could reduce satisfaction. This is the opposite of the encounter–norm–crowding approach in social capacity studies where users often feel less satisfied or more crowded when norms have been exceeded.
Managers need to keep in mind, however, that decisions to add facilities may represent a double-edged sword. On one hand, more facilities could improve expe-riences and conditions. More facilities in strategic locations, for example, may be convenient for users and increase their satisfaction. Providing more facilities such as trash cans and bathrooms may also address sanitation issues that can occur if they are unable to accommodate use levels, which can reduce an area’s conditions to a point where user experiences and the surrounding resources deteriorate. On the other hand, adding facilities could alter the aesthetic and resource character-istics of a setting. More benches and picnic tables, for example, may introduce a more hardened or built appearance to the site, so it is important for managers to understand the type of user experience that is sought and would be provided (e.g., primitive, developed) if new facilities are installed.
Managers should also consider possible consequences of not providing enough facilities. For example, users might be less satisfied with facility conditions and re-spond by engaging in coping behaviors such as spatial displacement by avoiding a site and going elsewhere, temporal displacement by visiting at alternate times when use levels and pressures on facilities may be lower, product shift by changing their definitions and expectations of the site, and expressing concerns to manage-ment about the site not meeting their needs (Shelby, Bregenzer, & Johnson, 1988).
NEEDHAM, CEURVORST, AND TYNON
Results of this study, however, suggest that enough of most facilities were present at each site, yet users may have simply been unaware of all facilities. To address this issue, managers could use educational approaches to inform users and help them locate existing site facilities. Strategically placing more signs or adding more information assistants (e.g., rangers, lifeguards) could be useful. Managers need to recognize that the nature of this information is site specific and should be applied to address the needs of users and conditions at a particular site.
Implications for Theory and ResearchFrom a research perspective, many studies have examined relationships among
social carrying capacity concepts such as encounters, norms, and crowding. Given that comparatively fewer studies have examined facility issues, a similar and more systematic approach was adopted here to explore indicators of facility capacity. To increase the generalizability of these findings, the following theoretical and research implications should be considered. First, respondents underestimated the number of many facilities by reporting fewer encounters with facilities than the number that was actually present at each site. In addition, these users wanted more of most facilities and this would increase their satisfaction even though there were more than enough of most facilities at each site. These findings suggest that many users were not highly observant of the number of facilities present, and illustrate differences among observations, expectations (i.e., norms), the actual number of facilities, and the way that these measures relate to evaluations such as satisfac-tion. These differences are somewhat consistent with a few studies in the social capacity literature where users had a tendency to underestimate their number of encounters with other people and these encounters differentially influenced per-ceptions of crowding (e.g., Bell, Needham, & Szuster, 2011; Shelby & Colvin, 1982; Shelby & Heberlein, 1986). Although many studies have focused on encounter levels reported by users, researchers may also need to ensure that actual conditions such as the number of people or facilities at sites are considered (Manning, 2007; Shelby & Colvin, 1982). Research is also needed to examine whether informing us-ers about the actual number of facilities could influence their encounters, norms, and satisfaction with facilities. Regardless, user observations and encounters are still important irrespective of whether they reflect the exact number of facilities or people present because they represent each individual’s perceived reality and influence the quality of their experience (Manning, 2011).
Second, this study examined six facility indicators specific to several coastal recreation sites on the island of O`ahu, Hawai`i (bathrooms, showers, trash cans, picnic tables, benches, signs). Future studies, however, should consider additional indicators that are specific, relevant, measureable, and amenable to management at applicable sites. For example, parking facilities and other transportation related issues may be salient for many high use areas. More research is needed to address a variety of facility capacity indicators relevant to various settings.
Third, this study used written formats to measure encounters and norms relat-ed to facility indicators. Recent studies, however, have used visuals such as photo-graphs and videos to measure indicators such as encounters and crowding because they may provide a more realistic depiction of conditions, especially in high use areas (Manning & Freimund, 2004; Manning, Lime, Freimund, & Pitt, 1996; Man-

MEASURING FACILITY CARRYING CAPACITY INDICATORS
ning, Valliere, Wang, & Jacobi, 1999; Needham & Rollins, 2005). Using visuals for facility indicators may be more difficult than those for encounters and crowding given the larger spatial size needed to show all facilities at a site. Regardless of the method used, however, it remains unclear whether respondents base their evalu-ations on the potential utility of indicator conditions (e.g., more bathrooms for comfort and convenience) or the biophysical conditions (e.g., more bathrooms to improve sanitation and prevent human waste). Research is needed to not only determine the extent that visuals for measuring facility indicators would provide similar or different results to those reported here, but also whether individuals base their responses on the utility or biophysical conditions of these indicators.
Fourth, researchers have used the encounter–norm–crowding approach exten-sively to address social capacity issues, and have found that those who encounter more people than their norm often feel more crowded than those who encounter fewer people than their norm. This study adopted a similar approach in the con-text of facility indicators and found that those who encountered fewer facilities than their norm were less satisfied with these facilities. Studies have used the con-cept of satisfaction to evaluate many recreation conditions and experiences (e.g., Dorfman, 1979; Hendee, 1974; Manning, 2011). Just because some users may be dissatisfied with the specific number or condition of certain facilities, however, does not necessarily mean that these facilities impacted their overall experience (Manning, 2011). Future studies, therefore, should consider additional evaluative dimensions associated with facility capacity indicators.
Fifth, given that the carrying capacity literature typically focuses on numbers of people or objects in an area (e.g., number of encounters or people; Manning, 2007), this study examined the number of facilities that users encountered, norms regarding how many of each facility that users felt should be present, and user satisfaction with the number of facilities. This emphasis on the number of fa-cilities, however, is different from the ability to access facilities or the comfort or condition of facilities such as their quality and upkeep (e.g., cleanliness, structural integrity, aesthetic appeal). It is unclear whether people isolate their perceptions of the number of facilities from evaluations of other facility conditions, or whether they combine these when replying to questionnaires. Research is needed on the extent that this phenomenon may or may not occur.
Sixth, perceptions of facilities such as satisfaction or dissatisfaction with these amenities and facilities may manifest themselves differently than satisfaction or dissatisfaction with other people such as crowding. Data in this article focused only on indicators of facility capacity and not social capacity (e.g., crowding), but it is possible that recreationists may recall encounters with people differently than encounters with facilities. Many recreationists likely interact on some level with other users, even if they are just passing each other. Interactions with facilities, however, may be less salient simply because recreationists may pass these facili-ties without giving them much thought unless they are in need of the services. This may be one reason why respondents tended to underestimate the number of facilities at each site by recalling fewer facilities than the number that was actually present. This article, however, showed that most users were able to report their sat-isfaction with facilities and specify norms corresponding with numbers of facilities
NEEDHAM, CEURVORST, AND TYNON
that they felt should be present, but future research is needed to determine the ex-tent that these evaluations of facilities manifest themselves similarly or differently to evaluations of other situations, conditions, and indicators such as encounters with other users.
Seventh, other than Kailua Beach Park where there were multiple entry points, the other sites were relatively small, had one or two access points, and all facili-ties were concentrated and visible from most vantage points. Even though most respondents still underestimated the number of each facility at each site, these physical characteristics made it possible for users to encounter or observe most of the facilities at these sites. Sites in future studies, however, may be much larger with multiple access points and more dispersed facilities, making it difficult for respondents to accurately count facilities and specify norms for these facilities. Research is needed to devise innovative approaches for measuring facility carrying capacity indicators at these types of sites.
Finally, there were clear patterns in results that began to generalize across the six study sites. At each site, for example, users underestimated the actual number of facilities, wanted more facilities than they observed even though there were already enough of most facilities, and would be more satisfied if there were more facilities. Regardless, this study is exploratory and should be viewed as a starting point for adopting the observation–norm–evaluation approach from the social capacity literature (e.g., encounters, norms, crowding or satisfaction; Needham et al., 2004; Vaske & Donnelly, 2002) and extending it to investigate facility car-rying capacity issues. Evaluations of facility indicators may differ at other areas, so researchers are encouraged to apply this approach to examine facility carrying capacity issues in other geographical settings.
Notes1The potential influence of the four sociodemographic characteristics on re-
spondent observations, norms, and satisfaction associated with the six types of facilities were examined at each of the six sites. Only 61 of 432 (14%) tests for dif-ferences (i.e., 4 sociodemographic questions * 3 facility evaluation questions for 6 facilities at 6 sites = 432 tests) were statistically significant at p < .05 and there were no consistent patterns in these differences. Effect sizes (V, rpb) also ranged from only .01 to .22 and averaged .07. Using guidelines from Cohen (1988) and Vaske (2008), these effect sizes suggest that the strength of any relationships between the sociodemographic characteristics and concepts examined in this article for each type of facility at each site were “small” or “minimal.” Taken together, these find-ings suggest that these sociodemographic characteristics had minimal influence on evaluations of encounters, norms, and satisfaction associated with facilities at each study site.
MEASURING FACILITY CARRYING CAPACITY INDICATORS
References
Arnberger, A., & Haider, W. (2007). Would you displace? It depends! A multivariate visual approach to intended displacement from an urban forest trail. Journal of Leisure Research, 39, 345-365.
Bastmeijer, K., Lamers, M., & Harcha, J. (2008). Permanent land-based facilities for tourism in Antarctica: The need for regulation. Review of European Community and International Environmental Law, 17, 84-99.
Beard, J. G., & Ragheb, M. G. (1980). Measuring leisure satisfaction. Journal of Lei-sure Research, 12, 20-33.
Bell, C. M., Needham, M. D., & Szuster, B. W. (2011). Congruence among encoun-ters, norms, crowding, and management in a marine protected area. Environ-mental Management, 48, 499-513.
Borrie, W. T., McCool, S. F., & Stankey, G. H. (1998). Protected area planning prin-ciples and strategies. In K. Lindberg, M. E. Wood, & D. Engeldrum (Eds.), Eco-tourism: A guide for planners and managers. North Bennington, VT: The Ecotour-ism Society.
Butler, R. W. (2004). Issues in applying carrying capacity concepts: Examples from the United Kingdom. In H. Coccossis & A. Mexa (Eds.), The challenge of tourism carrying capacity assessment (pp. 135-149). Burlington, VT: Ashgate.
Cahill, K. L., Marion, J. L., & Lawson, S. R. (2008). Exploring visitor acceptability for hardening trails to sustain visitation and minimise impacts. Journal of Sus-tainable Tourism, 16, 232-245.
Coccossis, H., & Mexa, A. (2004). The challenge of tourism carrying capacity assess-ment. Burlington, VT: Ashgate.
Cohen, J. (1988). Statistical power for the behavioral sciences. Hillsdale, NJ: Erlbaum.Donnelly, M. P., Vaske, J. J., DeRuiter, D. S., & King, T. B. (1996). Person-occasion
segmentation of state park visitors. Journal of Park and Recreation Administra-tion, 14(2), 95-106.
Donnelly, M. P., Vaske, J. J., Whittaker, D., & Shelby, B. (2000). Toward an under-standing of norm prevalence: Analysis of 20 years of research. Environmental Management, 25, 403-414.
Dorfman, P. W. (1979). Measurement and meaning of recreation satisfaction: A case study in camping. Environment and Behavior, 11, 483-510.
Eagles, P., & McCool, S. (2002). Tourism in national parks and protected areas: Plan-ning and management. New York, NY: CABI.
Emphandhu, D., Yemin, T., Pattanakiat, S., Tantasirin, C., Ruschano, R., Chett-amart, S., & Nasa, M. (2006). Recreation carrying capacity analysis at Khao Leam Ya-Mu Ko Samed National Park, Thailand. In D. Siegrist, C. Clivaz, M. Hunziker & S. Iten (Eds.), Exploring the nature of management: Proceedings of the third international conference on monitoring and management of visitor flows in recreational and protected areas. Rapperswil, Switzerland: University of Applied Sciences.
Fisher, A., & Krutilla, J. (1972). Determination of optimal capacity of resource-based recreation facilities. Natural Resources Journal, 12, 417-442.

NEEDHAM, CEURVORST, AND TYNON
Friedlander, A. M., Aeby, G., Brainard, R., Brown, E., Chaston, K., Clark, A., et al. (2005). The state of coral reef ecosystems of the main Hawaiian Islands. In J. Waddell (Ed.), The state of coral reef ecosystems in the United States and Pacific Freely Associated States (pp. 222-269). Silver Spring, MD: NOAA/NCCOS Center for Coastal Monitoring and Assessment.
Gimblett, H. R., & Skov-Petersen, H. (2008). Monitoring, simulation, and manage-ment of visitor landscapes. Tucson, AZ: University of Arizona Press.
Graefe, A. R., Vaske, J. J., & Kuss, F. R. (1984). Resolved issues and remaining ques-tions about social carrying capacity. Leisure Sciences, 6, 497-507.
Gunn, C. A. (1997). Vacationscape: Developing tourist areas. New York, NY: Taylor & Francis.
Hallo, J. C., & Manning, R. E. (2009). Transportation and recreation: A case study of visitors driving for pleasure at Acadia National Park. Journal of Transport Geography, 17, 491-499.
Hendee, J. C. (1974). A multiple-satisfaction approach to game management. Wildlife Society Bulletin, 2, 104-113.
Hollenhorst, S., & Gardner, L. (1994). The indicator performance estimate ap-proach to determining acceptable wilderness conditions. Environmental Man-agement, 18, 901-906.
Hollenhorst, S., Olson, D., & Fortney, R. (1992). Use of importance-performance analysis to evaluate state park cabins: The case of the West Virginia state park system. Journal of Park and Recreation Administration, 10, 1-11.
Kliskey, A. (1998). Linking the wilderness perception mapping concept to the rec-reation opportunity spectrum. Environmental Management, 22, 79-88.
Lew, D. K., & Larson, D. M. (2005). Valuing recreation and amenities at San Diego County beaches. Coastal Management, 33, 71-86.
Loomis, J. B., & Walsh, R. G. (1997). Recreation economic decisions: Comparing ben-efits and cost. State College, PA: Venture.
Lück, M. (2008). The encyclopedia of tourism and recreation in marine environments. Wallingford, UK: CABI.
Manning, R. E. (2004). Management planning frameworks. In M. J. Manfredo, J. J. Vaske, B. L. Bruyere, D. R. Field, & P. J. Brown (Eds.), Society and natural resources: A summary of knowledge (pp. 83-96). Jefferson, MO: Modern Litho.
Manning, R. E. (2007). Parks and carrying capacity: Commons without tragedy. Wash-ington, D.C.: Island Press.
Manning, R. E. (2011). Studies in outdoor recreation: Search and research for satisfac-tion. Corvallis, OR: Oregon State University Press.
Manning, R. E., & Freimund, W. A. (2004). Use of visual research methods to mea-sure standards of quality for parks and outdoor recreation. Journal of Leisure Research, 36, 557-579.
Manning, R. E., Lime, D. W., Freimund, W. A., & Pitt, D. (1996). Crowding norms at frontcountry sites: A visual approach to setting standards of quality. Leisure Sciences, 18, 39-59.
Manning, R. E., Valliere, W. A., Wang, B., & Jacobi, C. (1999). Crowding norms: Alternative measurement approaches. Leisure Sciences, 21, 91-115.

MEASURING FACILITY CARRYING CAPACITY INDICATORS
Mexa, A., & Collovini, A. (2004). Managing the impacts of tourism in European destimations: Using carrying capacity. In H. Coccossis, & Mexa, A. (Eds.), The challenge of tourism carrying capacity assessment (pp. 243-275). Burlington, VT: Ashgate.
Needham, M. D., & Rollins, R. B. (2005). Interest group standards for recreation and tourism impacts at ski areas in the summer. Tourism Management, 26, 1-13.
Needham, M. D., Rollins, R. B., Ceurvorst, R. L., Wood, C. J. B., Grimm, K. E., & Dearden, P. (2011). Motivations and normative evaluations of summer visi-tors at an alpine ski area. Journal of Travel Research, 50, 669-684.
Needham, M. D., Rollins, R. B., & Wood, C. J. B. (2004). Site-specific encounters, norms and crowding of summer visitors at alpine ski areas. International Jour-nal of Tourism Research, 6, 421-437.
Needham, M. D., & Szuster, B. W. (2011). Situational influences on normative evaluations of coastal tourism and recreation management strategies in Ha-waii. Tourism Management, 32, 732-740.
Needham, M. D., Tynon, J. F., Ceurvorst, R. L., Collins, R. L., Connor, W. M., & Culnane, M. J. W. (2008). Recreation carrying capacity and management at Pu-pukea Marine Life Conservation District on Oahu, Hawai‘i. Final project report for Hawai‘i Division of Aquatic Resources, Department of Land and Natural Resources. Corvallis: Oregon State University, Department of Forest Ecosys-tems and Society.
Nilsen, P., & Tayler, G. (1998). A comparative analysis of protected area planning and management frameworks. In S. F. McCool & D. N. Cole (Eds.), Proceedings of the limits of acceptable change and related planning processes: Progress and future directions (pp. 49-57). Missoula, MT: USDA Forest Service, Rocky Mountain Research Station.
Oh, K. (1998). Visual threshold carrying capacity (VTCC) in urban landscape man-agement: A case study of Seoul, Korea. Landscape and Urban Planning, 39, 283-294.
Shelby, B., Bregenzer, N. S., & Johnson, R. (1988). Displacement and product shift: Empirical evidence from Oregon rivers. Journal of Leisure Research, 20, 274-288.
Shelby, B., & Colvin, R. B. (1982). Encounter measures in carrying capacity re-search: Actual, reported, and diary contacts. Journal of Leisure Research, 14, 350-360.
Shelby, B., & Heberlein, T. A. (1986). Carrying capacity in recreation settings. Corval-lis, OR: Oregon State University Press.
Shelby, B., & Stein, K. (1984). Recreational use and carrying capacity of the Klamath river. Corvallis, OR: Oregon State University, Water Resources Research Insti-tute.
Shelby, B., Vaske, J. J., & Donnelly, M. P. (1996). Norms, standards, and natural resources. Leisure Sciences, 18, 103-123.
Shelby, B., Vaske, J. J., & Harris, R. (1988). User standards for ecological impacts at wilderness campsites. Journal of Leisure Research, 20, 245-256.
Shindler, B., & Shelby, B. (1992). Use assessment of ecological and social campsite attributes. In Defining wilderness quality: The role of standards in wildernes man-agement- A workshop proceedings (pp. 107-114). USDA General Technical Report PNW-305.

NEEDHAM, CEURVORST, AND TYNON
Tonge, J., & Moore, S. A. (2007). Importance-satisfaction analysis for marine-park hinterlands: A Western Australian case study. Tourism Management, 28, 768-776.
Vaske, J. J. (2008). Survey research and analysis: Applications in parks, recreation and human dimensions. State College, PA: Venture.
Vaske, J. J., Beaman, J., Stanley, R., & Grenier, M. (1996). Importance performance and segmentation: Where do we go from here? Journal of Travel & Tourism Marketing, 5, 225-240.
Vaske, J. J., & Donnelly, M. P. (2002). Generalizing the encounter-norm-crowding relationship. Leisure Sciences, 24, 255-269.
Vaske, J. J., & Shelby, L. B. (2008). Crowding as a descriptive indicator and an evaluative standards: Results from 30 years of research. Leisure Sciences, 30, 111-126.
Vaske, J. J., Shelby, B., Graefe, A. R., & Heberlein, T. A. (1986). Backcountry en-counter norms: Theory, method and empirical evidence. Journal of Leisure Re-search, 18, 137-153.