Toward a Preferred Future - Global Footprint Network · Eighty per cent waste diversion from...
24
calgary.ca/footprint | call 3-1-1 “The cities, power plants and homes we build today will either lock society into damaging over-consumption beyond our lifetimes, or begin to propel this and future generations towards sustainable living.” — James Leape, Director General, World Wildlife Fund Toward a Preferred Future Understanding Calgary’s Ecological Footprint Fall 2007
-
Upload
truongcong -
Category
Documents
-
view
216 -
download
1
Transcript of Toward a Preferred Future - Global Footprint Network · Eighty per cent waste diversion from...

calgary.ca/footprint | call 3-1-1
“The cities, power plants and homes we build today will either lock society into damaging over-consumption beyond our lifetimes, or begin to propel this and future generations towards sustainable living.” — James Leape, Director General, World Wildlife Fund
Toward a Preferred Future
Understanding Calgary’s Ecological Footprint
Fall 2007

Table of contents
Stepping lightly into the future 1
The challenge 2
Calgary’s demand on nature 3
Calgary’s Ecological Footprint by component 4
Canada’s Ecological Footprint and biocapacity 5
The Global Ecological Footprint 6
We are borrowing from the future 8
Creating a city that thinks differently... 9
Changing our course 10
Slow things first 11
Decision framework for sustainable development 12
Ecological Footprint Exchange 14
Mini-Footprints
Ride the wind: Calgary’s wind-powered CTrain 15
Housing and shelter 16
An infrastructure investment that enables Footprint reduction 18
Planning projects that enable Footprint reduction 19
Ecological Footprint: frequently asked questions 20
Purpose of this booklet
Reducing Calgary’s Ecological Footprint is a challenge we all share. Strategic, targeted and measurable action to address issues that threaten our quality of life into the future is both an immediate and long-term proposition. Footprint is a multi-dimensional tool to guide and measure these efforts.
The purpose of this booklet is to provide communities, organizations and The City of Calgary with information about the Footprint so we can collaborate to create meaningful change that reduces the demands we place on nature and helps ensure a high quality of life.
The City’s Ecological Footprint Project measures Calgary’s Footprint and engages citizens, business and government to take action. Visit calgary.ca/footprint for details and other publications.
Working with the community to reduce
our Footprint is a Council priority.
Ecological Footprint supports achieving imagineCALGARY
targets and goals.
Stepping lightly into the futureCan we build on current Footprint reduction efforts by making decisions now to ensure sustainable development for the future?
Future-proofing Calgary means committing to
secure Calgary’s economic competitiveness and
quality of life during times when resources become
unavailable or too expensive.
In 2005, a Federation of Canadian Municipalities report stated that Calgary has the largest Ecological Footprint in Canada. Ecological Footprint measures the amount of resources we consume and compares this to nature’s ability to provide these resources and absorb waste. Currently, the Earth can no longer keep up with our demand. We are turning resources into waste faster than nature can turn waste back into resources.
The City of Calgary is showing genuine environmental leadership by implementing corporate policies and decision making frameworks targeted at making Footprint reduction a priority:
ImagineCALGARY, the creation of a 100-year vision and 30-year targets and strategies for long-range urban sustainability.
Eighty per cent waste diversion from landfill by 2020.
Calgary Climate Change Action Plan Target Minus 50.
Water Efficiency Plan to reduce per capita water use by 30 per cent in 30 years.
Plan It Calgary sustainable land use and transportation objectives (an integrated land use and mobility plan).
Strategies within the Sustainable, Environmental and Ethical Procurement policy.
EnviroSystem, The City of Calgary’s ISO 14001 Environmental Management System registration.
The Triple Bottom Line policy.
Sustainable Building Policy.
Creation of the Ecological Footprint Project.
As demand currently exceeds supply, we will need to accelerate change that ensures a sustainable future.
1
Human population and its economies continue to grow, yet our planet remains the same size. These increases put more and more pressure on Earth’s living systems and create a demand for more resources than the planet can support. If we continue to use ecological resources 30 per cent faster than the Earth can regenerate them, we will erode the biological productivity on which our well being depends.
In order to preserve the Earth’s ability to provide us with what we need to live, we must take action to reduce the demands we place on nature. The Ecological Footprint:
Provides a way to measure human demand on nature.
Offers a metric to evaluate potential actions directed at future-proofing our cities and economies.
Helps set targets and chart actions to reduce our Footprint.
Allows us to keep track of the resources we consume and the waste we generate.
Serves as an indicator of whether we’re living within nature’s ability to provide resources or whether we have exceeded that limit.
Show the level of change necessary to achieve sustainable development.
Ecological Footprint accounting works much
like financial budgeting and accounting: it allows us to see whether or not we are
living within our means.
The challengeCan we reduce our Ecological Footprint while preserving a high quality of life?
200119961991198619811976197119661961
0.0
0.5
1.0
1.5
Num
ber
of p
lane
t E
arth
s
Human demand on the biosphere:Ecological Footprint 1961 – 2003
Overshoot:human demand hasexceeded the capacitythe Earth can sustain
Current resource demand
Earth’s ecological capacity
{Humanity’s food, fibre, built-land
and nuclear Footprint
Carbon dioxide portion of humanity’s Ecological Footprint
2
Footprint reductions allow Calgarians to ensure
they can maintain a high quality of life even as the resource costs increase
and supply decreases.
Calgary’s demand on natureWill our current actions manoeuver us into resource-intensive legacies or can we integrate ecological limits into business planning?
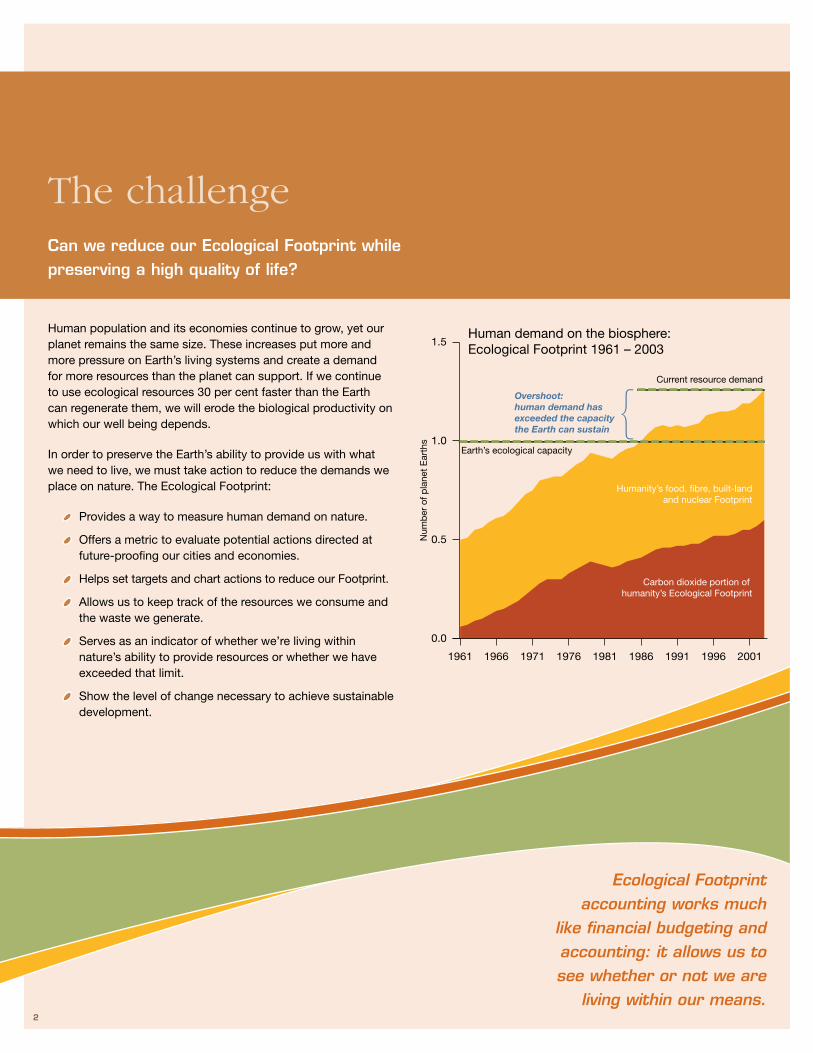
In October 2007, early results of a new baseline calculation of Calgary’s Ecological Footprint clearly suggest there is more work to be done. Calgary’s Ecological Footprint is currently estimated to be between 9.5 and 9.9 global hectares (Gha) per person. This exceeds the Canadian average of 7.6 Gha per person and is well beyond the global available average of 1.8 Gha per person. When our demand for resources is greater than supply we are in overshoot.
The largest component of Calgary’s Ecological Footprint is energy use, which includes the carbon component and makes up over 50 per cent of our Footprint. The carbon component, a contributor to climate change, reflects CO2 emissions from fossil fuels used for transportation, electricity, residential heat and hot water.
Imported goods consumed by Calgarians are considered a component of Calgary’s Footprint. Goods exported from Calgary become a component of the Footprint for people in other countries who consume those exported goods.
The ability to reduce the Footprint is directly affected by infrastructure and planning decisions. To reduce energy use we can build a transit-oriented, compact, mixed-use city, reduce reliance on vehicles, design pedestrian-friendly communities with certified ‘green’ construction, reduce waste, increase reuse/recycling and promote alternative energy technologies and delivery systems. If we build smaller, more energy-efficient homes, green technology buildings, take steps to increase how efficiently homes and businesses operate and choose low emission sources of energy, we can reduce the Footprint.
3
Num
ber
of E
arth
s
■ Built land ■ Nuclear energy ■ CO2 from fossil fuels
■ Fishing ground ■ Forest ■ Grazing land ■ Cropland
200119961991198619811976197119661961
Humanity’s totalEcological Footprint
Earth’s biological capacity
World Ecological Footprint 1961 – 2001
0.0
0.2
0.4
0.6
0.8
1.0
1.2
1.4

Calgary’s Ecological Footprint by componentWhat components are measured to calculate Calgary’s Ecological Footprint?
CO2 Area – area required to sequester carbon emissions produced by fossil fuel combustion, fossil fuel energy used to produce and transport food (crops and animals), manufacture and transport building materials and to construct and operate buildings, transport people and goods and operate infrastructure, manufacture and transport consumer goods and services and operate facilities that provide them.
To reduce the Footprint citizens can buy energy efficient appliances, replace incandescent light bulbs with compact fluorescent ones, purchase green power from your local supplier, take public transit and drive energy efficient vehicles.
Cropland – area required to grow crops for food and animal feed and to produce consumer goods (e.g. textiles and rubber).
Pasture land – area required to graze animals and produce associated goods and services (e.g. leather and milk).
To reduce the Footprint citizens can choose locally grown organic food and replace the number of meat-based meals with a vegetarian alternative.
Built land – area required to develop infrastructure for housing, transportation, industrial production, public and private buildings and services (i.e. parks, airports, schools, shops, offices, parking lots, etc.).
Forest land – area required to grow timber to produce building materials and associated goods and services (e.g. paper and furniture).
To reduce the Footprint we can use technology to reduce printing, purchase paper with a high recycled content and default printers to two-sided, purchase items with less packaging, ensure our business and homes have recycling programs and divert unwanted materials to organizations that could re-use them.
Fisheries – Total ocean area required for marine and freshwater fishing.
Key local indicators for energy, water, waste,
biodiversity, planning and infrastructure are also tracked to strengthen
Calgary’s Footprint measurement system.
Built land1.91 %
Fisheries1.71 %
Energy66.27 %
Forest11.04 %
Pasture land
5.02 %
Cropland14.06 %
4
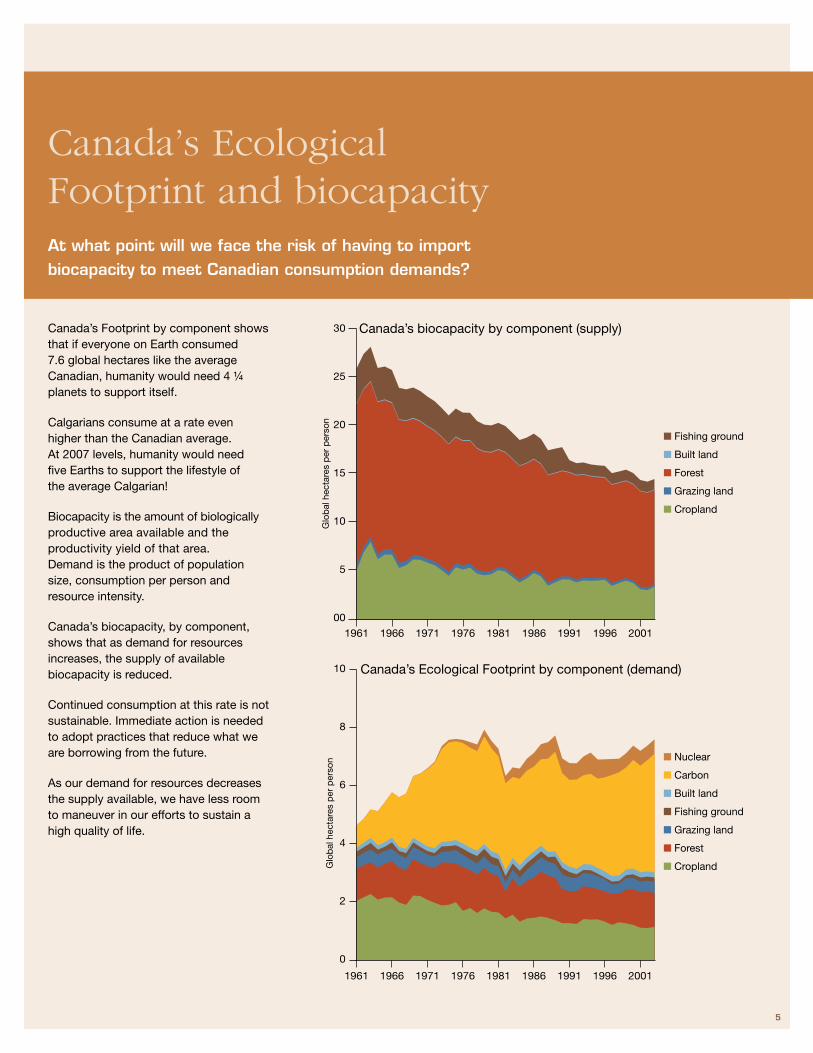
Canada’s Ecological Footprint and biocapacityAt what point will we face the risk of having to import biocapacity to meet Canadian consumption demands?
Canada’s Footprint by component shows that if everyone on Earth consumed 7.6 global hectares like the average Canadian, humanity would need 4 ¼ planets to support itself.
Calgarians consume at a rate even higher than the Canadian average. At 2007 levels, humanity would need five Earths to support the lifestyle of the average Calgarian!
Biocapacity is the amount of biologically productive area available and the productivity yield of that area. Demand is the product of population size, consumption per person and resource intensity.
Canada’s biocapacity, by component, shows that as demand for resources increases, the supply of available biocapacity is reduced.
Continued consumption at this rate is not sustainable. Immediate action is needed to adopt practices that reduce what we are borrowing from the future.
As our demand for resources decreases the supply available, we have less room to maneuver in our efforts to sustain a high quality of life.
Glo
bal
hec
tare
s p
er p
erso
n
0
2
4
6
8
10
200119961991198619811976197119661961
200119961991198619811976197119661961
Glo
bal
hec
tare
s p
er p
erso
n
■ Nuclear
■ Carbon
■ Built land
■ Fishing ground
■ Grazing land
■ Forest
■ Cropland
■ Fishing ground
■ Built land
■ Forest
■ Grazing land
■ Cropland
Canada’s biocapacity by component (supply)30
25
20
15
10
5
00
Canada’s Ecological Footprint by component (demand)
5
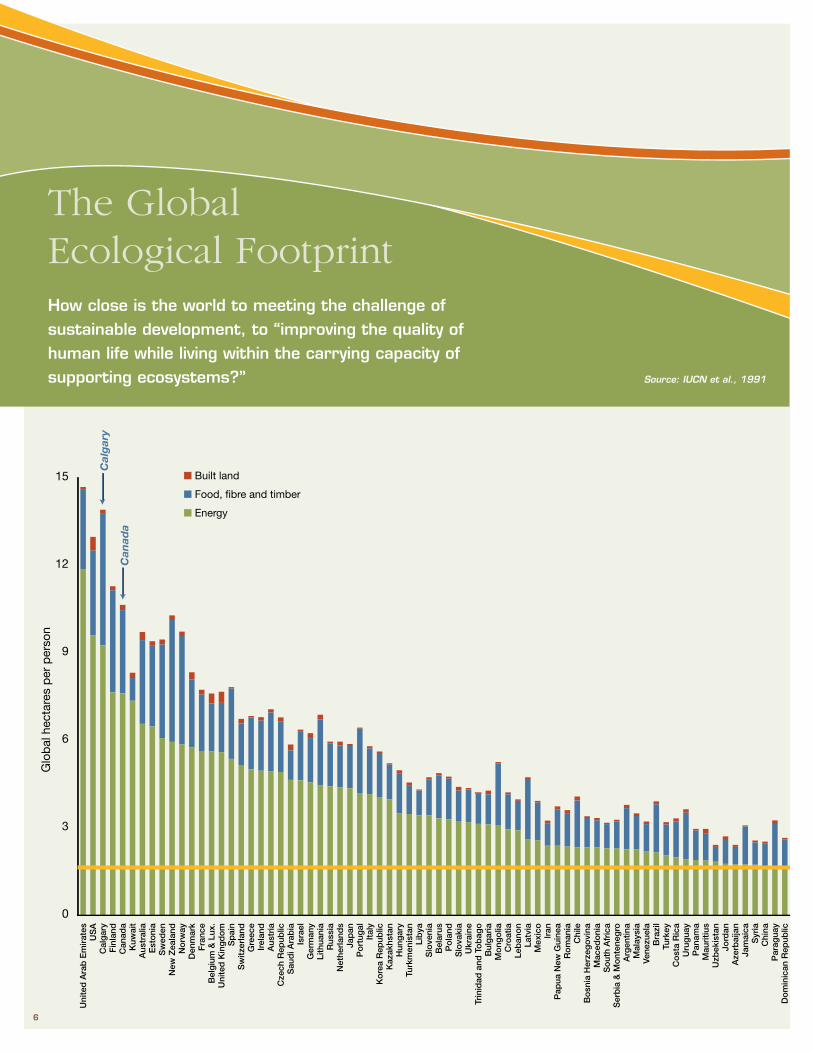
The Global Ecological FootprintHow close is the world to meeting the challenge of sustainable development, to “improving the quality of human life while living within the carrying capacity of supporting ecosystems?”
0
3
6
Glo
bal
hec
tare
s p
er p
erso
n
9
12
15
Uni
ted
Ara
b E
mir
ates
US
AC
alg
ary
Fin
land
Can
ada
Kuw
ait
Aus
tral
iaE
sto
nia
Sw
eden
New
Zea
land
No
rway
Den
mar
kF
ranc
eB
elg
ium
& L
ux.
Uni
ted
Kin
gd
om
Sp
ain
Sw
itzer
land
Gre
ece
Irel
and
Aus
tria
Cze
ch R
epub
licS
aud
i Ara
bia
Isra
elG
erm
any
Lith
uani
aR
ussi
aN
ethe
rlan
ds
Jap
anP
ort
ugal
Ital
yK
ore
a R
epub
licK
azak
hsta
nH
ung
ary
Turk
men
ista
nLi
bya
Slo
veni
aB
elar
usP
ola
ndS
lova
kia
Ukr
aine
Trin
idad
and
To
bag
oB
ulg
aria
Mo
ngo
liaC
roat
iaLe
ban
on
Latv
iaM
exic
oIr
anP
apua
New
Gui
nea
Ro
man
iaC
hile
Bo
snia
Her
zeg
ovi
naM
aced
oni
aS
out
h A
fric
aS
erb
ia &
Mo
nten
egro
Arg
entin
aM
alay
sia
Vene
zuel
aB
razi
lTu
rkey
Co
sta
Ric
aU
rug
uay
Pan
ama
Mau
ritiu
sU
zbek
ista
nJo
rdan
Aze
rbai
jan
Jam
aica
Syr
iaC
hina
Par
agua
yD
om
inic
an R
epub
licA
lger
iaB
ots
wan
aC
uba
Tuni
sia
Ecu
ado
rK
ore
a D
PR
PA
lban
iaG
abo
nT
haila
ndG
amb
iaE
l Sal
vad
or
Eg
ypt
Bo
livia
Gua
tem
ala
Co
lom
bia
Mo
ldo
va R
epub
licH
ond
uras
Mau
rita
nia
Kyr
gyz
stan
Nic
arag
uaN
iger
iaS
eneg
alS
waz
iland
Nam
ibia
Nig
erA
rmen
iaU
gan
da
Ind
one
sia
Phi
lipp
ines
Cha
dA
ngo
laS
udan
Sri
Lan
kaB
urki
na F
aso
Gha
naG
uine
aM
yanm
arLa
os
Mo
rocc
oV
ietn
amC
entr
al A
fric
an R
epP
eru
Tog
oIr
aqZ
imb
abw
eYe
men
Mal
iC
amer
oo
nE
thio
pia
Ben
inK
enya
Leso
tho
Geo
rgia
Ind
iaC
ote
dIv
oire
Sie
rra
Leo
neE
ritr
eaC
amb
od
iaM
adag
asca
rTa
nzan
iaN
epal
Bur
und
iLi
ber
iaG
uine
a-B
issa
uR
wan
da
Tajik
ista
nM
oza
mb
ique
Zam
bia
Co
ngo
Pak
ista
nC
ong
o D
em R
epH
aiti
Mal
awi
Ban
gla
des
hS
om
alia
Afg
hani
stan
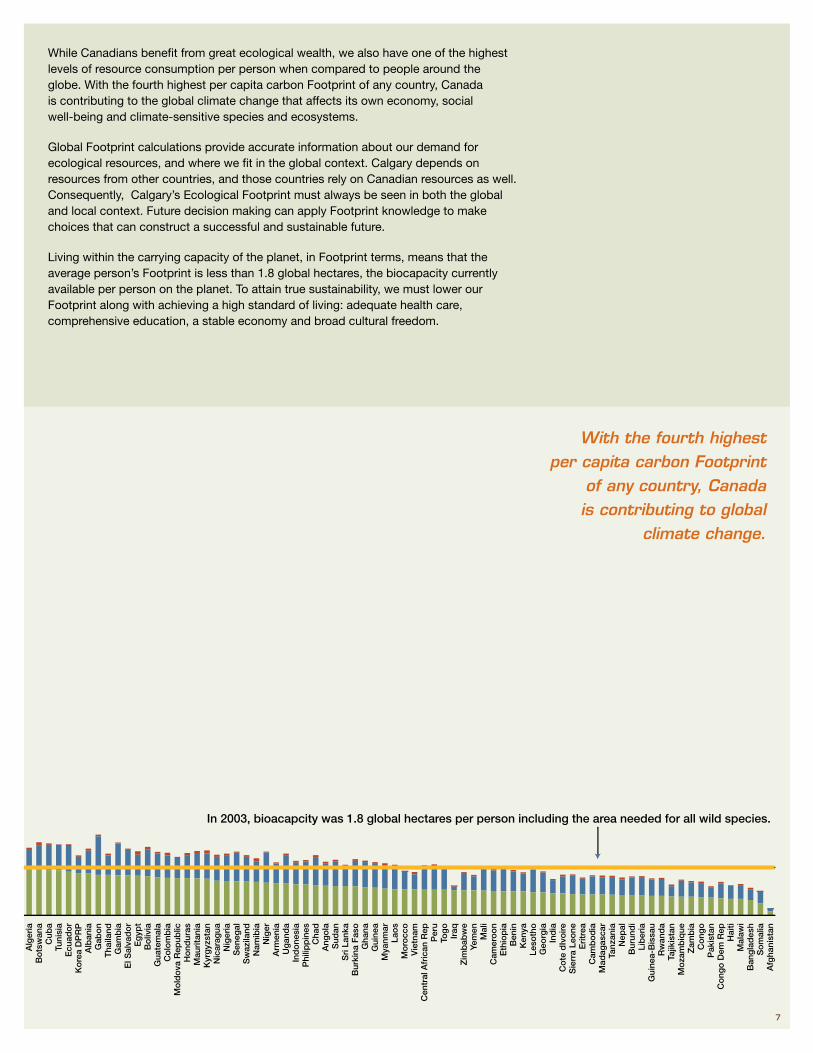
In 2003, bioacapcity was 1.8 global hectares per person including the area needed for all wild species.
■ Built land
■ Food, fibre and timber
■ Energy
Ca
lga
ry
Ca
na
da
6
Source: IUCN et al., 1991
With the fourth highest per capita carbon Footprint
of any country, Canada is contributing to global
climate change.
While Canadians benefit from great ecological wealth, we also have one of the highest levels of resource consumption per person when compared to people around the globe. With the fourth highest per capita carbon Footprint of any country, Canada is contributing to the global climate change that affects its own economy, social well-being and climate-sensitive species and ecosystems.
Global Footprint calculations provide accurate information about our demand for ecological resources, and where we fit in the global context. Calgary depends on resources from other countries, and those countries rely on Canadian resources as well. Consequently, Calgary’s Ecological Footprint must always be seen in both the global and local context. Future decision making can apply Footprint knowledge to make choices that can construct a successful and sustainable future.
Living within the carrying capacity of the planet, in Footprint terms, means that the average person’s Footprint is less than 1.8 global hectares, the biocapacity currently available per person on the planet. To attain true sustainability, we must lower our Footprint along with achieving a high standard of living: adequate health care, comprehensive education, a stable economy and broad cultural freedom.
0
3
6
Glo
bal
hec
tare
s p
er p
erso
n
9
12
15
Uni
ted
Ara
b E
mir
ates
US
AC
alg
ary
Fin
land
Can
ada
Kuw
ait
Aus
tral
iaE
sto
nia
Sw
eden
New
Zea
land
No
rway
Den
mar
kF
ranc
eB
elg
ium
& L
ux.
Uni
ted
Kin
gd
om
Sp
ain
Sw
itzer
land
Gre
ece
Irel
and
Aus
tria
Cze
ch R
epub
licS
aud
i Ara
bia
Isra
elG
erm
any
Lith
uani
aR
ussi
aN
ethe
rlan
ds
Jap
anP
ort
ugal
Ital
yK
ore
a R
epub
licK
azak
hsta
nH
ung
ary
Turk
men
ista
nLi
bya
Slo
veni
aB
elar
usP
ola
ndS
lova
kia
Ukr
aine
Trin
idad
and
To
bag
oB
ulg
aria
Mo
ngo
liaC
roat
iaLe
ban
on
Latv
iaM
exic
oIr
anP
apua
New
Gui
nea
Ro
man
iaC
hile
Bo
snia
Her
zeg
ovi
naM
aced
oni
aS
out
h A
fric
aS
erb
ia &
Mo
nten
egro
Arg
entin
aM
alay
sia
Vene
zuel
aB
razi
lTu
rkey
Co
sta
Ric
aU
rug
uay
Pan
ama
Mau
ritiu
sU
zbek
ista
nJo
rdan
Aze
rbai
jan
Jam
aica
Syr
iaC
hina
Par
agua
yD
om
inic
an R
epub
licA
lger
iaB
ots
wan
aC
uba
Tuni
sia
Ecu
ado
rK
ore
a D
PR
PA
lban
iaG
abo
nT
haila
ndG
amb
iaE
l Sal
vad
or
Eg
ypt
Bo
livia
Gua
tem
ala
Co
lom
bia
Mo
ldo
va R
epub
licH
ond
uras
Mau
rita
nia
Kyr
gyz
stan
Nic
arag
uaN
iger
iaS
eneg
alS
waz
iland
Nam
ibia
Nig
erA
rmen
iaU
gan
da
Ind
one
sia
Phi
lipp
ines
Cha
dA
ngo
laS
udan
Sri
Lan
kaB
urki
na F
aso
Gha
naG
uine
aM
yanm
arLa
os
Mo
rocc
oV
ietn
amC
entr
al A
fric
an R
epP
eru
Tog
oIr
aqZ
imb
abw
eYe
men
Mal
iC
amer
oo
nE
thio
pia
Ben
inK
enya
Leso
tho
Geo
rgia
Ind
iaC
ote
dIv
oire
Sie
rra
Leo
neE
ritr
eaC
amb
od
iaM
adag
asca
rTa
nzan
iaN
epal
Bur
und
iLi
ber
iaG
uine
a-B
issa
uR
wan
da
Tajik
ista
nM
oza
mb
ique
Zam
bia
Co
ngo
Pak
ista
nC
ong
o D
em R
epH
aiti
Mal
awi
Ban
gla
des
hS
om
alia
Afg
hani
stan
In 2003, bioacapcity was 1.8 global hectares per person including the area needed for all wild species.
■ Built land
■ Food, fibre and timber
■ Energy
Ca
lga
ry
Ca
na
da
7
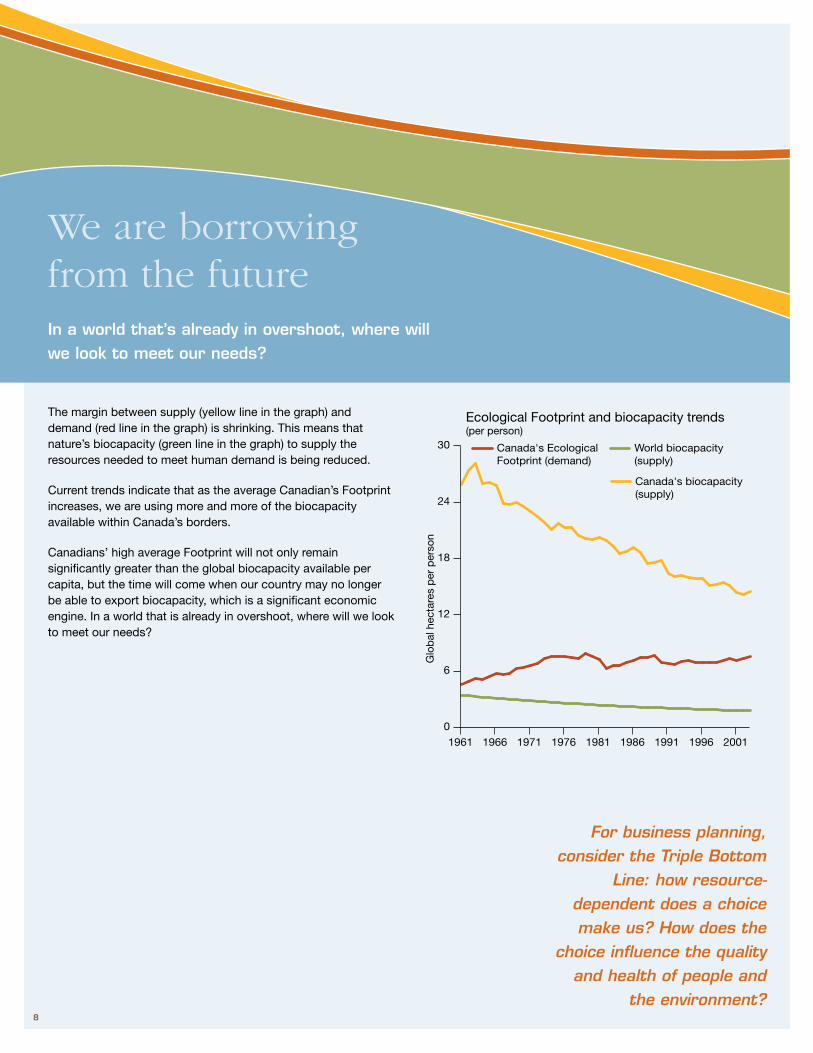
We are borrowing from the futureIn a world that’s already in overshoot, where will we look to meet our needs?
The margin between supply (yellow line in the graph) and demand (red line in the graph) is shrinking. This means that nature’s biocapacity (green line in the graph) to supply the resources needed to meet human demand is being reduced.
Current trends indicate that as the average Canadian’s Footprint increases, we are using more and more of the biocapacity available within Canada’s borders.
Canadians’ high average Footprint will not only remain significantly greater than the global biocapacity available per capita, but the time will come when our country may no longer be able to export biocapacity, which is a significant economic engine. In a world that is already in overshoot, where will we look to meet our needs?
For business planning, consider the Triple Bottom
Line: how resource- dependent does a choice make us? How does the
choice influence the quality and health of people and
the environment?
World biocapacity (supply)
Canada's Ecological Footprint (demand)
Canada's biocapacity (supply)
200119961991198619811976197119661961
Ecological Footprint and biocapacity trends(per person)
Glo
bal
hec
tare
s p
er p
erso
n
0
6
12
18
24
30
8

Creating a city that thinks differently...Can Footprint become an effective tool for community engagement, measuring our impact and planning for the future?
The Ecological Footprint Project framework consists of three components in a continual improvement cycle aimed at reducing the Calgary’s Footprint.
Measuring Calgary’s Ecological Footprint.
Enabling and empowering action.
Community dialogue and engagement.
Ecological Footprint provides a planning and measurement tool that enables and empowers meaningful action. Some examples include:
Through partners such as the Calgary Board of Education and Education Matters, The City is supporting a student-led recycling program that will reduce the amount of school waste that is landfilled, along with a water conservation program that helped students measure water use and take steps to reduce consumption at their school.
The Eco-Footprint Exchange website, which provides a network of organizations that support Footprint reduction efforts.
We can continue to use renewable energy, reduce energy consumption and the production of greenhouse gases, introduce a curbside recycling program and continue efforts to conserve water.
In October, 2007 early results from a new baseline calculation of Calgary’s Ecological Footprint provided information regarding how every aspect of our Footprint, both now and into the future, could be significantly affected by infrastructure and land-use planning decisions made today.
Building on The City’s corporate success, the Ecological Footprint Project is engaged in community dialogue and engagement work with internal City business units and external partners to enable Footprint reductions in Calgary.
As demand outpaces supply we have less room to manoeuver. Incremental changes
to current practice may not be enough.
9

If humanity remains on its current course, by 2050 we will be using ecological resources at twice the rate the Earth can generate them, according to moderate-level United Nations projections of increases in population, food and fibre consumption, CO2 emissions and agricultural productivity.
If trends are not reversed, either by a slow shift or a rapid reduction, we could damage the Earth’s ability to provide the resources and life-support systems on which we all depend. Eliminating overshoot means closing the gap between human demand and Earth’s supply. While increasing ecosystem productivity may help, reducing humanity’s global Footprint is essential.
Calgary has started to invest in a sustainable future. Initiatives such as the Plan It Calgary demonstrate that it’s becoming increasingly normal to apply ecological limits to decision-making, creating choices for reducing the Footprint, both now and in the future. Structures that continue to enable City administration to leverage these City actions into community initiatives will motivate others to engage in actions that advance environmental stewardship.
City and community action should engage Calgarians in collaborative community engagement strategies that take targeted, comprehensive action and:
Link directly to imagineCALGARY targets.
Incorporate existing policies and procedures into daily operations.
Apply Footprint as an effective tool for both measurement and planning.
Integrate key local indicators and local data sources to ensure local relevancy.
Consider community priorities and business objectives.
Provide deeper insight on what Calgarians can do to reduce the per capita Footprint through enabling and empowering engagement activities.
Be developed in collaboration with the community and City business units.
Apply Mini-Footprints as an effective Footprint measure and planning tool for single activities or scenarios.
The City’s existing commitment to projects to reduce the Footprint is recognized nationally and internationally, placing Calgary in the forefront of a growing global network of cities intent on achieving environmental excellence.
Ecological Footprint is the common denominator for
a wide range of existing environmental actions,
targets and plans.
Changing our courseHow do we apply ecological limits to decision-making such that societal choices allow for immediate and long-term reduction of overshoot?
Rapid reduction
UN’s mostmoderate scenario
Slow shift
Footprint Earth’s biocapacity
Moderate business as usual
0.0
0.2
0.4
0.6
0.8
1.0
1.2
1.4
1.6
1.8
21002080206020402020200019801960
Num
ber
of p
lane
t E
arth
s
10

Planning and infrastructure decisions made today
determine citizen behaviour for much of
the rest of the century.
Slow things firstCan we make decisions today to create structures and neighbourhoods which will reduce the Footprint for the next 100 years?
Considering the rapid escalation of overshoot and the slow rate at which human institutions, land-use patterns, and infrastructure change, the most critical action steps must focus on decisions that will be with us for many years. These decisions will shape community consumption patterns and determine success in reducing our Footprint for years to come.
Human-made infrastructure — homes, roads, office structures, power plants, dams, transportation — may last 50 or even 100 years. Not only do infrastructure decisions require resources to build, they also dictate how we use resources over their entire lifecycle. Mini-Footprints, a tool for evaluating a variety of options, can inform decisions on evaluating the long-term implications of options that will affect our Footprint into the future.
0
1
2
2100208020602040202020002006
19801960
Num
ber
of p
lane
t E
arth
s
Footprint (demand)
Biocapacity (supply)
Amount of overshoot
Car(US avg: 9 years)
Nuclear power station(US/Europe: 40 years) Long-term waste
Highway(25-50 years)
Bridge(30-75 years)
Coal power station((30-75 years)
Human(national avg.: 32-82 years)
Commercial building design(50-100 years)
Housing, railway and dam(50-150 years)
11
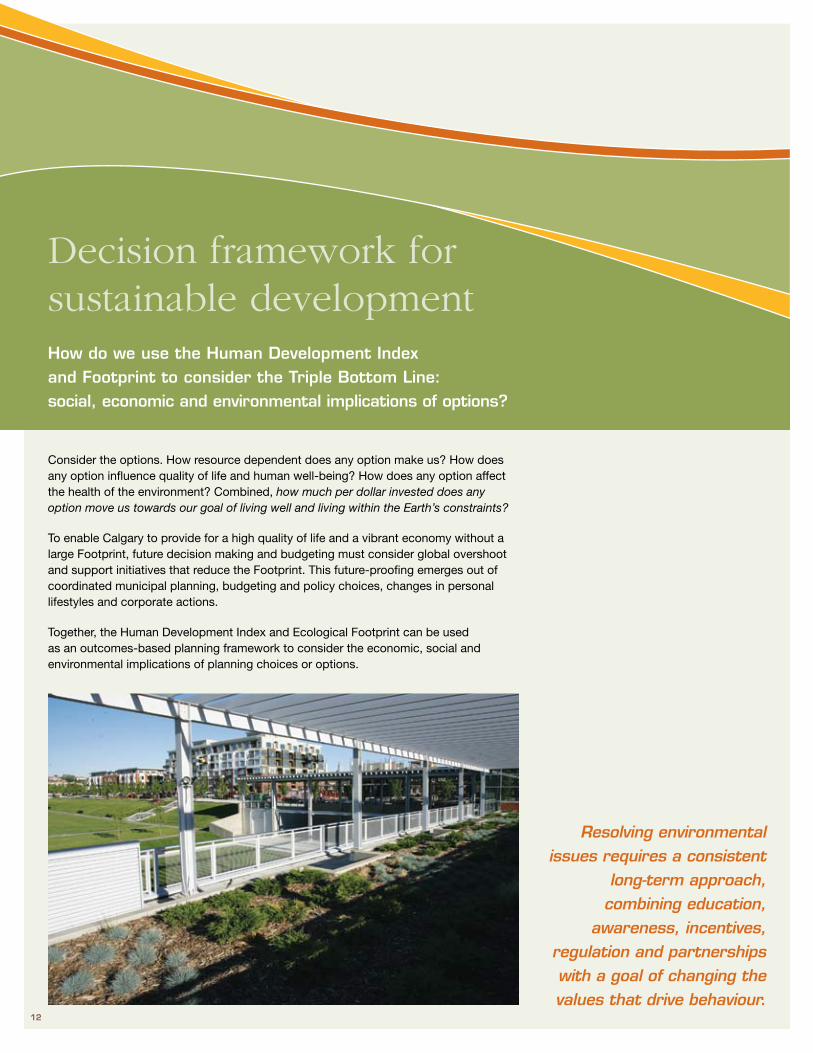
Decision framework for sustainable developmentHow do we use the Human Development Index and Footprint to consider the Triple Bottom Line: social, economic and environmental implications of options?
Consider the options. How resource dependent does any option make us? How does any option influence quality of life and human well-being? How does any option affect the health of the environment? Combined, how much per dollar invested does any option move us towards our goal of living well and living within the Earth’s constraints?
To enable Calgary to provide for a high quality of life and a vibrant economy without a large Footprint, future decision making and budgeting must consider global overshoot and support initiatives that reduce the Footprint. This future-proofing emerges out of coordinated municipal planning, budgeting and policy choices, changes in personal lifestyles and corporate actions.
Together, the Human Development Index and Ecological Footprint can be used as an outcomes-based planning framework to consider the economic, social and environmental implications of planning choices or options.
Resolving environmental issues requires a consistent
long-term approach, combining education,
awareness, incentives, regulation and partnerships with a goal of changing the values that drive behaviour.
12
13
Eco
logi
cal F
ootp
rint
(hec
tare
s p
er p
erso
n)
Human development index
0.00
2.00
4.00
6.00
8.00
10.00
12.00
0.00 0.50 1.00
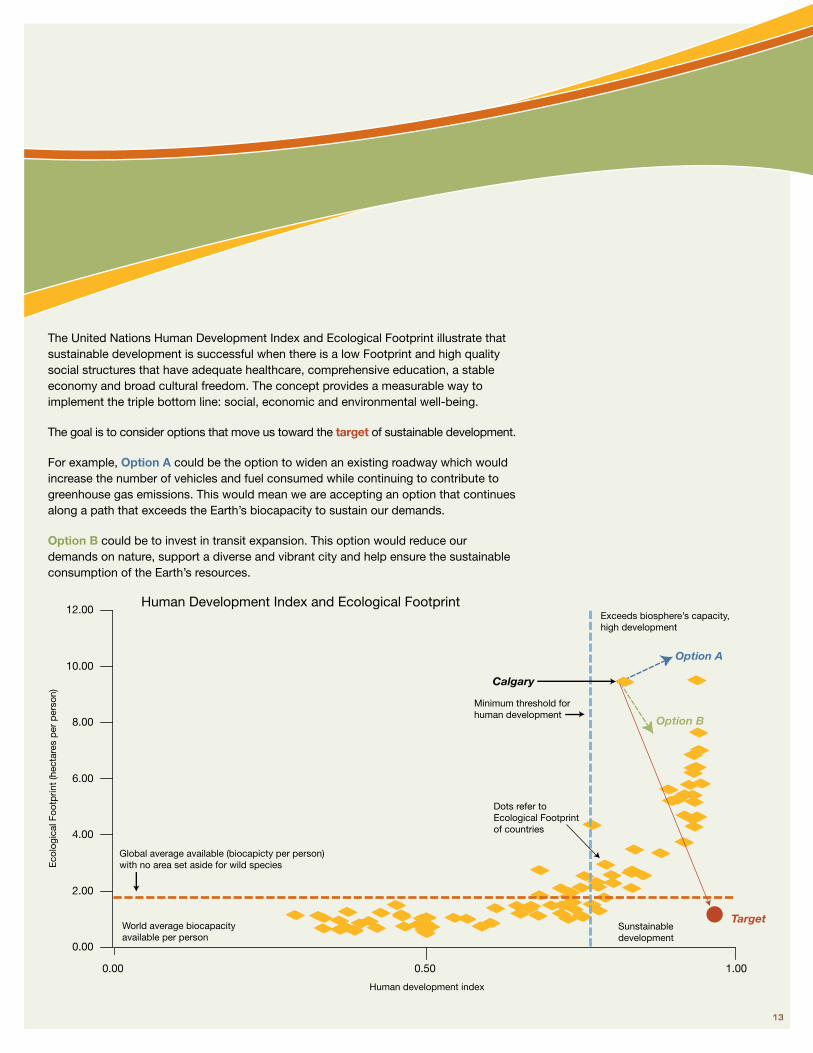
World average biocapacity available per person
Sunstainabledevelopment
Exceeds biosphere’s capacity,high development
Global average available (biocapicty per person)with no area set aside for wild species
Dots refer to Ecological Footprint of countries
Minimum threshold forhuman development
Calgary
Target
Option A
Option B
Human Development Index and Ecological Footprint
The United Nations Human Development Index and Ecological Footprint illustrate that sustainable development is successful when there is a low Footprint and high quality social structures that have adequate healthcare, comprehensive education, a stable economy and broad cultural freedom. The concept provides a measurable way to implement the triple bottom line: social, economic and environmental well-being.
The goal is to consider options that move us toward the target of sustainable development.
For example, Option A could be the option to widen an existing roadway which would increase the number of vehicles and fuel consumed while continuing to contribute to greenhouse gas emissions. This would mean we are accepting an option that continues along a path that exceeds the Earth’s biocapacity to sustain our demands.
Option B could be to invest in transit expansion. This option would reduce our demands on nature, support a diverse and vibrant city and help ensure the sustainable consumption of the Earth’s resources.

14
Ecological Footprint ExchangeHow does The City partner with the community to support Footprint reductions?
One example of a City initiative that connects The City with the community is the Ecological Footprint Exchange (EFX). This City of Calgary website provides a network that links organizations interested in reducing their Footprint. An analysis of the members of the EFX shows that The City is demonstrating leadership in enabling partnerships and brokering City initiatives into the community. For example:
Waste – The Calgary Materials Exchange (CMEX) at Clean Calgary is connected with Waste & Recycling Services.
CMEX assists companies throughout Calgary to divert industrial, commercial and construction waste going to landfill by working to build relationships between companies and provide opportunities and information to facilitate exchanges of material for reuse and recycling.
Water – The Centre for Affordable Water and Sanitation Technology (CAWST) and Water Resources
The World Water Day Youth Summit is an annual event that is co-ordinated by the CAWST and sponsored by The City of Calgary Water Resources. This full-day event, designed to motivate youth to take action on local and international water issues, serves as a starting point for water conservation activities that span the entire year. Each planning team develops their own idea for making a difference, design a project plan and receives some seed funding. This program provides an opportunity to engage youth, to support actions on water conservation and help reduce the Ecological Footprint.
Visit calgary.ca/footprint to learn more about the Ecological Footprint Exchange.
Energy – ENMAX Green Energy and Infrastructure Services
The City of Calgary has entered into an electricity supply agreement with ENMAX to purchase green power over a 20-year term. The agreement requires that at least 75 per cent of The City’s electricity purchase comes from green electricity sources beginning in 2007, with the ability to increase the purchase target to at least 90 per cent green electricity by 2012.
Ecological Footprint is a multi-dimensional tool that
can be used as a vehicle for education and change.
0
10
20
30
40
50
60
Num
ber
of i
nitia
tives
Bio
div
ersi
ty
Con
stru
ctio
n
Ene
rgy
Food
Goo
ds
and
serv
ices
Land
and
dev
elop
men
t
Tran
spor
tatio
n
Was
tem
anag
emen
t
Wat
er a
ndw
astw
ater
■ The City of Calgary’s Initiatives
■ Total
Footprint theme areas
14
15
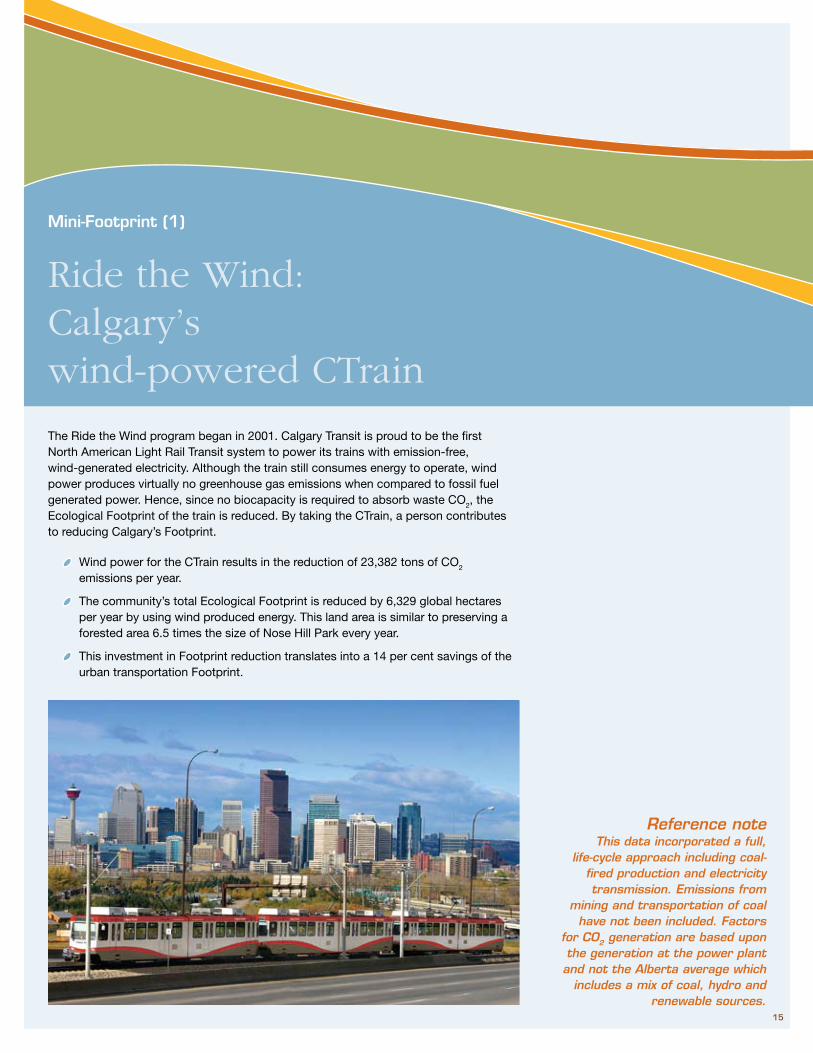
Mini-Footprint (1)
Ride the Wind: Calgary’s wind-powered CTrain
The Ride the Wind program began in 2001. Calgary Transit is proud to be the first North American Light Rail Transit system to power its trains with emission-free, wind-generated electricity. Although the train still consumes energy to operate, wind power produces virtually no greenhouse gas emissions when compared to fossil fuel generated power. Hence, since no biocapacity is required to absorb waste CO2, the Ecological Footprint of the train is reduced. By taking the CTrain, a person contributes to reducing Calgary’s Footprint.
Wind power for the CTrain results in the reduction of 23,382 tons of CO2 emissions per year.
The community’s total Ecological Footprint is reduced by 6,329 global hectares per year by using wind produced energy. This land area is similar to preserving a forested area 6.5 times the size of Nose Hill Park every year.
This investment in Footprint reduction translates into a 14 per cent savings of the urban transportation Footprint.
Reference noteThis data incorporated a full,
life-cycle approach including coal-fired production and electricity transmission. Emissions from
mining and transportation of coal have not been included. Factors
for CO2 generation are based upon the generation at the power plant and not the Alberta average which
includes a mix of coal, hydro and renewable sources.
15

Mini-Footprint (2)
Housing and shelter
16
Living Building
LEEDTM
Platinum
LEEDTM
Gold
LEEDTM
Silver
LEEDTM
Certified
Market
N
100 Year Building
45' Wings
Solar Orientation
Natural Daylighting
Natural Ventilation
Living Machine®
100 Year Building
45' Wings
Solar Orientation
Natural Daylighting
Natural Ventilation
60 Year Building
90' Wings
Natural Daylighting
40 Year Building
120' Wings
Big Box
40 Year Building
120' Wings
Big Box
80 Year Building
65' Wings
Solar Orientation
Natural Daylighting
Living Building
LEEDTM
Platinum
LEEDTM
Gold
LEEDTM
Silver
LEEDTM
Certified
MarketTM
· 3 Story Building
· Concrete Frame
· Raised Access Flooring
· Sun Shades
· Operable Windows
· Partially Daylit Parking
· Living Machine
· Photovoltaics (100%)
· 3 Story Building
· Concrete Frame
· Raised Access Flooring
· Sun Shades
· Operable Windows
· Partially Daylit Parking
· Photovoltaics (20%)
· 3 Story Building
· Concrete Frame
· Raised Access Flooring
· Sun Shades
· Operable Windows
· Partially Daylit Parking
· Photovoltaics (10%)
· 3 Story Building
· Steel Frame
· Raised Access Flooring
· Sun Shades
· Operable Windows
· Photovoltaics (5%)
· 2 Story Building
· Steel Frame
· Efficient HVAC
· Lay-In Ceilings
· Fixed Windows
· 2 Story Building
· Steel Frame
· Typical HVAC
· Lay-In Ceilings
· Fixed Windows
13'-
6"13
'-0"
13'-
6"13
'-6"
Plan Wall Section
Pollution fromBuilding External Cost to
Society (20 yr.)
= 5 Households = Energy Consumed by the Building = Energy Generated by the Building
= Carbon Dioxide (tons) - Global Warming = Sulfur Dioxide (lbs.) - Acid Rain = Nitrogen Dioxide (lbs.) - Smog = Particulate Matter < 10 Microns (lbs.) - Air Quality
Width of Bar = Amount of Energy Required
Height of Bar = % of Energy Obtained from the Grid
Operation (20 yr.)
0
1000
2000
3000
4000
5000
6000
7000
8000
9000
10000
11000
12000
13000
14000
15000
16000
17000
18000
0
1
2
3
4
5
6
7
8
9
10
11
12
13
14
15
CO2 SO2 NO 2 PM10
0
1000
2000
3000
4000
5000
6000
7000
8000
9000
10000
11000
12000
13000
14000
15000
16000
17000
18000
0
1
2
3
4
5
6
7
8
9
10
11
12
13
14
15
CO2 SO2 NO 2 PM10
0
1000
2000
3000
4000
5000
6000
7000
8000
9000
10000
11000
12000
13000
14000
15000
16000
17000
18000
0
1
2
3
4
5
6
7
8
9
10
11
12
13
14
15
CO2 SO2 NO 2 PM10
0
1000
2000
3000
4000
5000
6000
7000
8000
9000
10000
11000
12000
13000
14000
15000
16000
17000
18000
0
1
2
3
4
5
6
7
8
9
10
11
12
13
14
15
CO2 SO2 NO 2 PM10
0
1000
2000
3000
4000
5000
6000
7000
8000
9000
10000
11000
12000
13000
14000
15000
16000
17000
18000
0
1
2
3
4
5
6
7
8
9
10
11
12
13
14
15
CO2 SO2 NO 2 PM10
0
1000
2000
3000
4000
5000
6000
7000
8000
9000
10000
11000
12000
13000
14000
15000
16000
17000
18000
0
1
2
3
4
5
6
7
8
9
10
11
12
13
14
15
CO2 SO2 NO 2 PM10
Schedule
Q 2 Q 3 Q 4
2002 Q 2 Q 3 Q 4
2003 Q 2 Q 3 Q 4 Q 2 Q 3 Q 4
2004
2005
Construction
Design
Add'l Research
Q 2 Q 3 Q 4
2002 Q 2 Q 3 Q 4
2003 Q 2 Q 3 Q 4 Q 2 Q 3 Q 4
2004
2005
Construction
Design
Add'l Research
Q 2 Q 3 Q 4
2002 Q 2 Q 3 Q 4
2003 Q 2 Q 3 Q 4 Q 2 Q 3 Q 4
2004
2005
Construction
Design
Add'l Research
Q 2 Q 3 Q 4
2002 Q 2 Q 3 Q 4
2003 Q 2 Q 3 Q 4 Q 2 Q 3 Q 4
2004
2005
Construction
Design
Add'l Research
Q 2 Q 3 Q 4
2002 Q 2 Q 3 Q 4
2003 Q 2 Q 3 Q 4 Q 2 Q 3 Q 4
2004
2005
Construction
Design
Q 2 Q 3 Q 4
2002 Q 2 Q 3 Q 4
2003 Q 2 Q 3 Q 4 Q 2 Q 3 Q 4
2004
2005
Construction
Design
= Additional Research= Design= Construction
Grid Reliance
0%
10%
20%
30%
40%
50%
60%
70%
80%
90%
100%
0%
10%
20%
30%
40%
50%
60%
70%
80%
90%
100%
0%
10%
20%
30%
40%
50%
60%
70%
80%
90%
100%
0%
10%
20%
30%
40%
50%
60%
70%
80%
90%
100%
0%
10%
20%
30%
40%
50%
60%
70%
80%
90%
100%
0%
10%
20%
30%
40%
50%
60%
70%
80%
90%
100%
Building form
Energy, pollution and external cost to Society All of these figures are based on cost estimates created for each conceptual building model. All costs shown have been adjusted from actual cost estimates to reflect a $10 million Market Building as a baseline. The Net Present Values indicated represent 30-, 60- and-100 year cost models that are based on 5% cost of capital, 1-1/2% inflation rate and 5% annual increase in energy costs.
Schedules
Energy to Operate Building
89
89
150
208
250
461
Short- and long-term costs
Copy
right
© 2
002
The
David
and
Luc
ile P
acka
rd F
ound
atio
n
$0
$0.7 m
$1.3 m
$2.0 m
$2.5 m
$3.2 m
Living Machine ®
45' Wings
Increase in Photovoltaics (100%)
Design For Deconstruction
Reduce Life Cycle Impacts of All Building Materials
80 Year Building
65' Wings
Increase in Photovoltaics (10%)
Concrete Frame Building
Partially Daylit Parking
Efficient HVAC
Collect 50% of Rainwater
50% of Materials that are Removed from Site are Recycled or Salvaged
Material Selection Based on LEED
Typical Class "A" Office Building
$12.9 m
$12.1 m
$11.5 m
$11.3 m
$10.1 m
$10.0 m
Construction Cost
100 Year Building
45' Wings
Increase in Photovoltaics (20%)
Additional Window Shading
Additional Concrete Massing
60 Year Building
90' Foot Wings - 3 Stories
Raised Access Flooring
Sun Shades on South
Photovoltaics (5%)
$19.7m
$36.7 m
$166.9 m
30 Year Model
30 Year Model
$18.7 m
$19.6 m
$20.8 m
$18.3 m
$23.7 m
$62.2 m
$18.5 m
$27.8 m
$95.8 m
$19.6m
$45.3 m
$218.4 m
$22.7 m
$62.9 m
Net Present Value
30 Year Model
60 Year Model
100 Year Model
60 Year Model
100 Year Model
30 Year Model
60 Year Model
100 Year Model
60 Year Model
100 Year Model
30 Year Model
60 Year Model
100 Year Model
30 Year Model
$348.9 m
60 Year Model
100 Year Model
$1.3 m
$1.4 m
$1.5 m
$1.6 m
$1.6 m
$1.7 m
Furniture, Fixtures and Equipment
$1.3 m
$1.3 m
$1.5 m
$1.5 m
$1.7 m
$2.0 m
Design and Management Fees

17
Living Building
LEEDTM
Platinum
LEEDTM
Gold
LEEDTM
Silver
LEEDTM
Certified
Market
N
100 Year Building
45' Wings
Solar Orientation
Natural Daylighting
Natural Ventilation
Living Machine®
100 Year Building
45' Wings
Solar Orientation
Natural Daylighting
Natural Ventilation
60 Year Building
90' Wings
Natural Daylighting
40 Year Building
120' Wings
Big Box
40 Year Building
120' Wings
Big Box
80 Year Building
65' Wings
Solar Orientation
Natural Daylighting
Living Building
LEEDTM
Platinum
LEEDTM
Gold
LEEDTM
Silver
LEEDTM
Certified
MarketTM
· 3 Story Building
· Concrete Frame
· Raised Access Flooring
· Sun Shades
· Operable Windows
· Partially Daylit Parking
· Living Machine
· Photovoltaics (100%)
· 3 Story Building
· Concrete Frame
· Raised Access Flooring
· Sun Shades
· Operable Windows
· Partially Daylit Parking
· Photovoltaics (20%)
· 3 Story Building
· Concrete Frame
· Raised Access Flooring
· Sun Shades
· Operable Windows
· Partially Daylit Parking
· Photovoltaics (10%)
· 3 Story Building
· Steel Frame
· Raised Access Flooring
· Sun Shades
· Operable Windows
· Photovoltaics (5%)
· 2 Story Building
· Steel Frame
· Efficient HVAC
· Lay-In Ceilings
· Fixed Windows
· 2 Story Building
· Steel Frame
· Typical HVAC
· Lay-In Ceilings
· Fixed Windows
13'-
6"13
'-0"
13'-
6"13
'-6"
Plan Wall Section
Pollution fromBuilding External Cost to
Society (20 yr.)
= 5 Households = Energy Consumed by the Building = Energy Generated by the Building
= Carbon Dioxide (tons) - Global Warming = Sulfur Dioxide (lbs.) - Acid Rain = Nitrogen Dioxide (lbs.) - Smog = Particulate Matter < 10 Microns (lbs.) - Air Quality
Width of Bar = Amount of Energy Required
Height of Bar = % of Energy Obtained from the Grid
Operation (20 yr.)
0
1000
2000
3000
4000
5000
6000
7000
8000
9000
10000
11000
12000
13000
14000
15000
16000
17000
18000
0
1
2
3
4
5
6
7
8
9
10
11
12
13
14
15
CO2 SO2 NO 2 PM10
0
1000
2000
3000
4000
5000
6000
7000
8000
9000
10000
11000
12000
13000
14000
15000
16000
17000
18000
0
1
2
3
4
5
6
7
8
9
10
11
12
13
14
15
CO2 SO2 NO 2 PM10
0
1000
2000
3000
4000
5000
6000
7000
8000
9000
10000
11000
12000
13000
14000
15000
16000
17000
18000
0
1
2
3
4
5
6
7
8
9
10
11
12
13
14
15
CO2 SO2 NO 2 PM10
0
1000
2000
3000
4000
5000
6000
7000
8000
9000
10000
11000
12000
13000
14000
15000
16000
17000
18000
0
1
2
3
4
5
6
7
8
9
10
11
12
13
14
15
CO2 SO2 NO 2 PM10
0
1000
2000
3000
4000
5000
6000
7000
8000
9000
10000
11000
12000
13000
14000
15000
16000
17000
18000
0
1
2
3
4
5
6
7
8
9
10
11
12
13
14
15
CO2 SO2 NO 2 PM10
0
1000
2000
3000
4000
5000
6000
7000
8000
9000
10000
11000
12000
13000
14000
15000
16000
17000
18000
0
1
2
3
4
5
6
7
8
9
10
11
12
13
14
15
CO2 SO2 NO 2 PM10
Schedule
Q 2 Q 3 Q 4
2002 Q 2 Q 3 Q 4
2003 Q 2 Q 3 Q 4 Q 2 Q 3 Q 4
2004
2005
Construction
Design
Add'l Research
Q 2 Q 3 Q 4
2002 Q 2 Q 3 Q 4
2003 Q 2 Q 3 Q 4 Q 2 Q 3 Q 4
2004
2005
Construction
Design
Add'l Research
Q 2 Q 3 Q 4
2002 Q 2 Q 3 Q 4
2003 Q 2 Q 3 Q 4 Q 2 Q 3 Q 4
2004
2005
Construction
Design
Add'l Research
Q 2 Q 3 Q 4
2002 Q 2 Q 3 Q 4
2003 Q 2 Q 3 Q 4 Q 2 Q 3 Q 4
2004
2005
Construction
Design
Add'l Research
Q 2 Q 3 Q 4
2002 Q 2 Q 3 Q 4
2003 Q 2 Q 3 Q 4 Q 2 Q 3 Q 4
2004
2005
Construction
Design
Q 2 Q 3 Q 4
2002 Q 2 Q 3 Q 4
2003 Q 2 Q 3 Q 4 Q 2 Q 3 Q 4
2004
2005
Construction
Design
= Additional Research= Design= Construction
Grid Reliance
0%
10%
20%
30%
40%
50%
60%
70%
80%
90%
100%
0%
10%
20%
30%
40%
50%
60%
70%
80%
90%
100%
0%
10%
20%
30%
40%
50%
60%
70%
80%
90%
100%
0%
10%
20%
30%
40%
50%
60%
70%
80%
90%
100%
0%
10%
20%
30%
40%
50%
60%
70%
80%
90%
100%
0%
10%
20%
30%
40%
50%
60%
70%
80%
90%
100%
Building form
Energy, pollution and external cost to Society All of these figures are based on cost estimates created for each conceptual building model. All costs shown have been adjusted from actual cost estimates to reflect a $10 million Market Building as a baseline. The Net Present Values indicated represent 30-, 60- and-100 year cost models that are based on 5% cost of capital, 1-1/2% inflation rate and 5% annual increase in energy costs.
Schedules
Energy to Operate Building
89
89
150
208
250
461
Short- and long-term costs
Copy
right
© 2
002
The
David
and
Luc
ile P
acka
rd F
ound
atio
n
$0
$0.7 m
$1.3 m
$2.0 m
$2.5 m
$3.2 m
Living Machine ®
45' Wings
Increase in Photovoltaics (100%)
Design For Deconstruction
Reduce Life Cycle Impacts of All Building Materials
80 Year Building
65' Wings
Increase in Photovoltaics (10%)
Concrete Frame Building
Partially Daylit Parking
Efficient HVAC
Collect 50% of Rainwater
50% of Materials that are Removed from Site are Recycled or Salvaged
Material Selection Based on LEED
Typical Class "A" Office Building
$12.9 m
$12.1 m
$11.5 m
$11.3 m
$10.1 m
$10.0 m
Construction Cost
100 Year Building
45' Wings
Increase in Photovoltaics (20%)
Additional Window Shading
Additional Concrete Massing
60 Year Building
90' Foot Wings - 3 Stories
Raised Access Flooring
Sun Shades on South
Photovoltaics (5%)
$19.7m
$36.7 m
$166.9 m
30 Year Model
30 Year Model
$18.7 m
$19.6 m
$20.8 m
$18.3 m
$23.7 m
$62.2 m
$18.5 m
$27.8 m
$95.8 m
$19.6m
$45.3 m
$218.4 m
$22.7 m
$62.9 m
Net Present Value
30 Year Model
60 Year Model
100 Year Model
60 Year Model
100 Year Model
30 Year Model
60 Year Model
100 Year Model
60 Year Model
100 Year Model
30 Year Model
60 Year Model
100 Year Model
30 Year Model
$348.9 m
60 Year Model
100 Year Model
$1.3 m
$1.4 m
$1.5 m
$1.6 m
$1.6 m
$1.7 m
Furniture, Fixtures and Equipment
$1.3 m
$1.3 m
$1.5 m
$1.5 m
$1.7 m
$2.0 m
Design and Management Fees
About this table
This table represents a snapshot of the differences in economic and environmental outcomes relative to the type of building design ranging from a standard minimum building code construction (‘Market’), through all LEED (Leadership in Energy and Environmental Design) standards, to the highest form of sustainable building design (‘Living Building’).
The columns provide a visual reference or data point based on design, energy use and electrical grid reliance. The columns further quantify economic factors for each design type such as the externalities (cost to society), total schedule (time), construction, furnishing, design and management fees as well as Net Present Value based on 30, 60 and 100-year models.
The Mini-Footprint of buildings and city infrastructure has
not yet been calculated, but the table at the left serves as an example.
Note: this chart is included for illustrative purposes only.
Used with permission.
Packard Sustainability Matrix and Report
© 2001 BMIM Architects www.mbnim.com
Footprint reduction occurs at many levels. For example, building form, site design and regional location strongly influence resource consumption during construction and throughout its lifecycle. Capital outlays can be offset through reduced operational costs over the life of the development.
Also, the regional location and type of transportation infrastructure will drive human behaviour over the lifetime of the development.

An infrastructure investment that enables Footprint reduction
CTrain expansion
The CTrain was developed in 1981 with an initial 13 km line from downtown to Anderson Road. Since then, LRT expansion has had six phases of growth to a total of 42 km and 25 stations. Construction is currently underway for the seventh and eighth phases. The northeast line will extend 2.8 km to the McKnight/ Westwinds station. The northwest line will be expanded 3.8 km to the Crowfoot station.
In 2006, the average number of passengers per day was 248,200. Public transit supports Footprint reduction by removing vehicles from roads, conserving fuel, reducing both greenhouse gas emissions and local air pollution. Public transit and its expansion offer a long-term solution to reducing the transportation portion of the energy Footprint. It’s estimated the Northeast expansion alone will reduce vehicle travel by over five million km annually, saving 1,400 tonnes of greenhouse gas emissions annually.
18

Planning projects that enable footprint reductions
Garrison Woods
The redevelopment of the former Canadian Forces Base (CFB) Calgary is a project which reduced the land use and energy components of the Footprint by creating a community with a higher density (25 units per hectare) and more energy-efficient homes, connected to the transit system.
Some duplex and single-family homes were actually refurbished from the original military housing. The community incorporates customized road features, mixed uses (residential, commercial and institutional), a diversity of housing types and creative use of greenspace which creates a walkable, attractive development with a strong community feel.
The Bridges
Located close to downtown, the Bridges development is designed as an urban village. It’s a three-phase, multi-family development including affordable housing residential units and mixed use that is being developed over a nine-year period. The first phase, which is already constructed, includes 425 residential units and street level retail. The second phase will include 707 residential units, commercial and institutional development.
This development addresses Footprint reduction by reducing energy consumption, increasing population density, providing access to public transportation networks and by integrating such things as solar orientation, low- maintenance vegetation to conserve water and live-work opportunities. Some of the first multi-residential units to meet the LEED standard for new construction are included. It’s important to note, elements supporting Footprint reduction such as this can also meet our needs for affordable housing.
19
How is the Ecological Footprint calculated?
The Ecological Footprint measures the amount of biologically productive land and water area required to produce the resources an individual, population or activity consumes and to absorb the waste they generate, given prevailing technology and resource management. This area is expressed in global hectares, hectares with world-average biological productivity.
Footprint calculations use yield factors to take into account national differences in biological productivity (e.g. tonnes of wheat per UK hectare versus per Argentina hectare) and equivalence factors to take into account differences in world average productivity among land types (e.g. world average forest versus world average cropland).
Footprint and biocapacity results for nations are calculated annually by Global Footprint Network. The continuing methodological development of these National Footprint Accounts is overseen by a formal review committee (footprintstandards.org/committees). A detailed methods paper and copies of sample calculation sheets can be obtained at no charge: see footprintnetwork.org.
What is included in the Ecological Footprint? What is excluded?
To avoid exaggerating human demand on nature, the Ecological Footprint includes only those aspects of resource consumption and waste production for which the Earth has regenerative capacity, and where data exist that allow this demand to be expressed in terms of productive area. For example, freshwater withdrawal is not explicitly included in national Footprint calculations, however, its effects on biocapacity and the energy used to pump and treat it are included. In Calgary, water use is tracked using key local indicators.
Ecological Footprint accounts provide snapshots of past resource demand and availability. They do not predict the future. Thus, while the Footprint does not estimate future losses caused by present degradation of ecosystems, if persistent this degradation will likely be reflected in future accounts as a loss of biocapacity. Footprint accounts also do not indicate the intensity with which a biologically productive area is being used, nor do they pinpoint specific biodiversity pressures. Finally, the Ecological Footprint is a biophysical measure; it does not evaluate the essential social and economic dimensions of sustainability.
How does the Ecological Footprint account for the use of fossil fuels?
Fossil fuels are extracted from the Earth’s crust rather than produced by ecosystems. When burning this fuel, carbon dioxide is produced. The goal of the UN Framework Convention on Climate Change suggests two options for avoiding this: a) human technological sequestration, such as deep well injection, or b) natural sequestration. Natural sequestration corresponds to the biocapacity required to absorb and store the CO2 not sequestered by humans, less the amount absorbed by the oceans. This is the Footprint for fossil fuel. Currently, negligible amounts of CO2 are sequestered through human technological processes.
The sequestration rate used in Ecological Footprint calculations is based on an estimate of how much carbon the world’s forests can remove from the atmosphere and retain. One 2003 global hectare can absorb the CO2 released by burning approximately 1450 litres of gasoline per year.
The fossil fuel Footprint does not suggest that carbon sequestration is the key to resolving global warming. Rather the opposite: it shows that the biosphere does not have sufficient capacity to cope with current levels of CO2 emissions.
Ecological Footprint: frequently asked questions
20
How does the Ecological Footprint account for nuclear energy?
The demand on biocapacity associated with the use of nuclear power is difficult to quantify. Also, many of its impacts are not addressed by the research question behind the Footprint. For lack of conclusive data, the Footprint of nuclear electricity is presently assumed to be the same as the Footprint of the equivalent amount of electricity from fossil fuels. Global Footprint Network and its partners are working to refine this assumption. The Footprint of nuclear electricity currently represents approximately five per cent of the total global Ecological Footprint.
How is international trade taken into account?
The National Ecological Footprint accounts calculate each country’s net consumption by adding its imports to its production and subtracting its exports. This means that the resources used for producing a car manufactured in Japan, but sold and used in India, will contribute to the Indian, not the Japanese consumption Footprint.
The resulting national consumption Footprints can be distorted, since the resources used and waste generated in making products for export is not fully documented. This affects the Footprints of countries whose trade-flows are large relative to their overall economies. These misallocations, however, do not affect the total global Ecological Footprint.
Does the Ecological Footprint take into account other species?
The Ecological Footprint describes human demand on nature. Currently, there are 1.8 global hectares of biocapacity available per person on planet Earth, less if some of this biologically productive area is set aside for use by wild species. The value society places on biodiversity will determine how much of a biodiversity buffer to set aside. Efforts to increase biocapacity, such as mono-cropping and application of pesticides, may also increase pressure on biodiversity; this can increase the size of the biodiversity buffer required to achieve the same conservation results.
Does the Ecological Footprint say what is a ‘fair’ or ‘equitable‘ use of resources?
The Footprint documents what happened in the past. It can quantitatively describe the ecological resources used by an individual or a population, but it does not prescribe what they should be using. Resource allocation is a policy issue, based on societal beliefs about what is or is not equitable. Thus, while Footprint accounting can determine the average biocapacity available per person, it cannot stipulate how that biocapacity should be allocated among individuals or nations. However, it provides a context for such discussions.
Calculating the Ecological Footprint of a city or region?
While the calculations for global and national Ecological Footprints have been standardized within the National Footprint Accounts, there are a variety of ways used to calculate the Footprint of a city or region.
The family of “process-based” approaches use production recipes and supplementary statistics to allocate the national per capita Footprint to consumption categories (e.g. food, shelter, mobility, goods and services). Regional or municipal average per capita Footprints are calculated by scaling these national results up or down based on differences between national and local consumption patterns. The family of input-output approaches use monetary, physical or hybrid input-output tables for allocating overall demand to consumption categories.
There is growing recognition of the need to standardize sub-national Footprint application methods in order to increase their comparability across studies and over time. In response to this need, methods and approaches for calculating the Footprint of cities and regions are currently being aligned through the global Ecological Footprint Standards initiative. For more information on current Footprint standards and ongoing standardization debates, see footprintstandards.org.
The City of Calgary
Protecting Calgary’s environment is important to all Calgarians. The City of Calgary is committed to being a leader in responsible environmental stewardship and encourages all citizens, businesses and organizations to do their part.
For information about The City of Calgary’s Footprint, please visit: calgary.ca/footprint.
Global Footprint Network
Together with its partners, Global Footprint Network co-ordinates research, develops methodological standards and provides decision-makers with robust resource accounts to help the human economy operate with the Earth’s ecological limits.
For information about Global Footprint Network, please visit: footprintnetwork.org.
The production of this document was the result of
a collaboration between The City of Calgary and
Global Footprint Network.21

calgary.ca/footprint | call 3-1-1
2007-2567
Future-proofing CalgaryThe assets we create today can be future-friendly or not. Future-friendly infrastructure — cities and buildings designed to be resource efficient, zero-energy buildings and pedestrian or public transit oriented transportation systems — can enable great lives with small Footprints.
Succeeding in future-proofing Calgary requires a commitment to securing Calgary’s economic competitiveness even in a time when resources become unavailable or too expensive. The longer infrastructure is designed to last, the more critical it is to ensure we’re not manoeuvring ourselves into resource-intensive legacies for decades to come.
For references and additional information about Footprint methodology, data sources, assumptions and definitions, please visit: footprintnetwork.org/2006technotes.
The City will officially launch the Ecological Footprint Project on Earth Day 2008. This call to action celebrates initiatives to reduce our Footprint and demonstrate how Calgarians are partnering and supporting each other in initiatives today to create great lives with a smaller Footprint as we move forward.
Partnering for a Sustainable Future
Calgary Ecological Footprint project launchCan we apply what we’re learning from the Footprint to consider ecological limits, track progress and take collaborative action?
The following environmental information has
been provided by Mohawk Paper. Savings derived
from using post-consumer recycled fibre in lieu
of virgin fibre (based on 1000 copies printed):
................... 7.39 trees preserved for the future
................. 157.4 kgs solid waste not generated
......... 310 kgs net greenhouse gases prevented
............... 174.6 kgs air emissions not generated
................ 11,886 litres wastewater flow saved
....... 257.8 cubic metres of natural gas unused
................................ 24 equivalent trees planted