
Toward a Comprehensive Water Sector Information System in ...
32
Beitbridge Emergency Water Supply and Sanitation Project Effects on service access and citizen confidence in government institutions September 2014 Delivering Water Supply and Sanitation (WSS) Services in Fragile States WATER AND SANITATION PROGRAM: REPORT Towards a Comprehensive Water Sector Information System in Mozambique Luis Macário and Eric Buhl-Nielsen May 2015
-
Upload
truongdung -
Category
Documents
-
view
221 -
download
0
Transcript of Toward a Comprehensive Water Sector Information System in ...

Beitbridge Emergency Water Supply and Sanitation Project Effects on service access and citizen confidence in government institutions
September 2014
Delivering Water Supply and Sanitation (WSS) Services in Fragile States
WatEr and Sanitation Program: REPORT
Towards a Comprehensive Water Sector Information System in MozambiqueLuis Macário and Eric Buhl-Nielsen
May 2015
Authors: Luis Macário (WSP) and Eric Buhl-Nielsen (PEM
Consult)
AcknowledgementsThe joint effort by the National Water Directorate (DNA),
sector institutions responsible for water and sanitation, local
governments and development partners has been crucial in
the development of the Water Sector Information System
(SINAS) and this output. In particular; Messias Macie, Head
of Planning Department and Horácio Cruz, Information
Management, were closely involved in the development
of the output and Amélia José Cumbi (Program Assistant,
GWASA) who supported the project implementation. Water
and Sanitation Program (WSP), working closely with the
Swiss Development Cooperation (SDC), the United Nations
Fund for Children (UNICEF), the Netherlands’ Embassy
and others, have contributed to the concept and design
of SINAS through early dialogue, round table processes
and funding of sector studies. The task team leader was
Luis Macário who has guided the work throughout the
process. This ouput has benefited from extensive review
and guidance by Glenn Pearce-Oroz (Principal Regional
Team Leader, GWASA) and Peter M. Hawkins (Sr. Water &
Sanitation Specialist, GWASA). The team also acknowledges
Uri Raich (Senior Urban Specialist, GSURR) and David
Michaud (Senior Water Supply Specialist, GWADR) who
peer-reviewed the output. The main drafting was provided
by Eric Buhl-Nielsen, PEM consult.
The Water and Sanitation Program is a multi-donor partnership, part of
the World Bank Group’s Water Global Practice, supporting poor people
in obtaining affordable, safe, and sustainable access to water and
sanitation services. WSP’s donors include Australia, Austria, Denmark,
Finland, France, the Bill & Melinda Gates Foundation, Luxembourg,
Netherlands, Norway, Sweden, Switzerland, United Kingdom, United
States, and the World Bank.
Disclaimer
The findings, interpretations, and conclusions expressed herein
are entirely those of the author and should not be attributed to the
World Bank or its affiliated organizations, or to members of the Board
of Executive Directors of the World Bank or the governments they
represent. The World Bank does not guarantee the accuracy of the
data included in this work. The boundaries, colors, denominations, and
other information shown on any map in this work do not imply any
judgment on the part of the World Bank concerning the legal status of
any territory or the endorsement or acceptance of such boundaries.
Copyright Statement
The material in this work is subject to copyright. Because The World
Bank encourages dissemination of its knowledge, this work may be
reproduced, in whole or in part, for noncommercial purposes as long
as full attribution to the work is given.
© 2015 International Bank for Reconstruction and Development/The
World Bank
www.wsp.org
Towards a Comprehensive Water Sector Information System in MozambiqueLuis Macário and Eric Buhl-Nielsen
May 2015
iv
table of Contents
Abbreviations and Acronyms ........................................................................................................................................ v
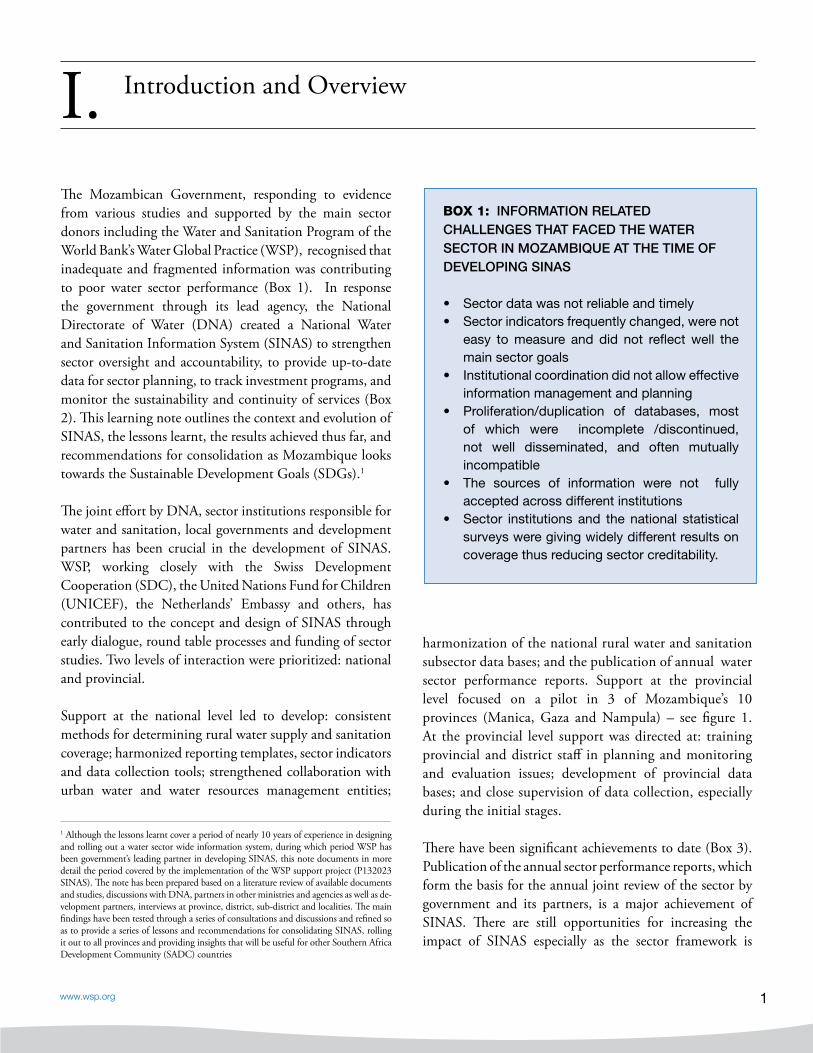
I. Introduction and overview .....................................................................................................................................1
II. Context and evolution of SINAS ............................................................................................................................5
III. The strategic elements of a single sector wide information system ...................................................................9
IV. SINAS in operation - Rural water supply and sanitation ....................................................................................12
V. SINAS in operation - Urban water supply and sanitation...................................................................................14
VI. SINAS in operation - Water resources management and development ............................................................16
VII. SINAS reporting and users ..................................................................................................................................17
VIII. Major lessons learned ..........................................................................................................................................20
IX Recommendations for consolidating and implementing a national rollout .......................................................21
Annex – end note – Outline of the evolution of SINAS ..............................................................................................22
Documents consulted .................................................................................................................................................24

www.wsp.org v
acronyms
AIAS Administração de Infraestruturas de Abastecimento de Água e SaneamentoARAS Administrações Regionais de ÁguaCRA Conselho de Regulação do Abastecimento de ÁguaDAS Departamento de Agua RuralDNA DirecçãoNacional de AguasDPOH Direcção Provincial de Obras PublicasFIPAG Fundo de Investimento de Património do Abastecimento de AguaGPS Geographical Positioning SystemICT Information and Communication TechnologyINE Instituto Nacional de EstatisticaJMP Joint Monitoring ProgrammeMAE Ministério da Administração EstatalMICS Multiple Indicator Cluster SurveyMIS Management Information SystemMISAU Ministério da SaúdeMopH Ministério de Obras Públicas e HabitaçãoMPD Ministério da Planificação e DesenvolvimentoM&E Monitoring and EvaluationNGO Non Government OrganisationPRONASAR Programa Nacional de Abastecimento de Agua e Saneamento RuralRWSS Rural Water Supply and SanitationSADC Southern African Development CommunitySDPI Servicos Distritais de Planificação e InfraestruturaSINAS Sistema de Informação Nacional de Agua e SaneamentoSMoDD Sistema de Monitoria do Desenvolvimento do DistritoUWSS Urban Water Supply and SanitationWSP Water and Sanitation Programme (World Bank Global Water Practice)WRD Water Resources DevelopmentWRM Water Resources Management

vi
www.wsp.org 1
Introduction and OverviewI.
1 Although the lessons learnt cover a period of nearly 10 years of experience in designing and rolling out a water sector wide information system, during which period WSP has been government’s leading partner in developing SINAS, this note documents in more detail the period covered by the implementation of the WSP support project (P132023 SINAS). The note has been prepared based on a literature review of available documents and studies, discussions with DNA, partners in other ministries and agencies as well as de-velopment partners, interviews at province, district, sub-district and localities. The main findings have been tested through a series of consultations and discussions and refined so as to provide a series of lessons and recommendations for consolidating SINAS, rolling it out to all provinces and providing insights that will be useful for other Southern Africa Development Community (SADC) countries
The Mozambican Government, responding to evidence from various studies and supported by the main sector donors including the Water and Sanitation Program of the World Bank’s Water Global Practice (WSP), recognised that inadequate and fragmented information was contributing to poor water sector performance (Box 1). In response the government through its lead agency, the National Directorate of Water (DNA) created a National Water and Sanitation Information System (SINAS) to strengthen sector oversight and accountability, to provide up-to-date data for sector planning, to track investment programs, and monitor the sustainability and continuity of services (Box 2). This learning note outlines the context and evolution of SINAS, the lessons learnt, the results achieved thus far, and recommendations for consolidation as Mozambique looks towards the Sustainable Development Goals (SDGs).1
The joint effort by DNA, sector institutions responsible for water and sanitation, local governments and development partners has been crucial in the development of SINAS. WSP, working closely with the Swiss Development Cooperation (SDC), the United Nations Fund for Children (UNICEF), the Netherlands’ Embassy and others, has contributed to the concept and design of SINAS through early dialogue, round table processes and funding of sector studies. Two levels of interaction were prioritized: national and provincial.
Support at the national level led to develop: consistent methods for determining rural water supply and sanitation coverage; harmonized reporting templates, sector indicators and data collection tools; strengthened collaboration with urban water and water resources management entities;
BOX 1: INFORMATION RElATED CHAllENGES THAT FACED THE WATER SECTOR IN MOzAMBIqUE AT THE TIME OF DEVElOPING SINAS
• Sectordatawasnotreliableandtimely• Sectorindicatorsfrequentlychanged,werenot
easy to measure and did not reflect well the main sector goals
• Institutionalcoordinationdidnotalloweffectiveinformation management and planning
• Proliferation/duplication of databases, mostof which were incomplete /discontinued, not well disseminated, and often mutually incompatible
• The sources of information were not fullyaccepted across different institutions
• Sector institutions and thenational statisticalsurveys were giving widely different results on coverage thus reducing sector creditability.
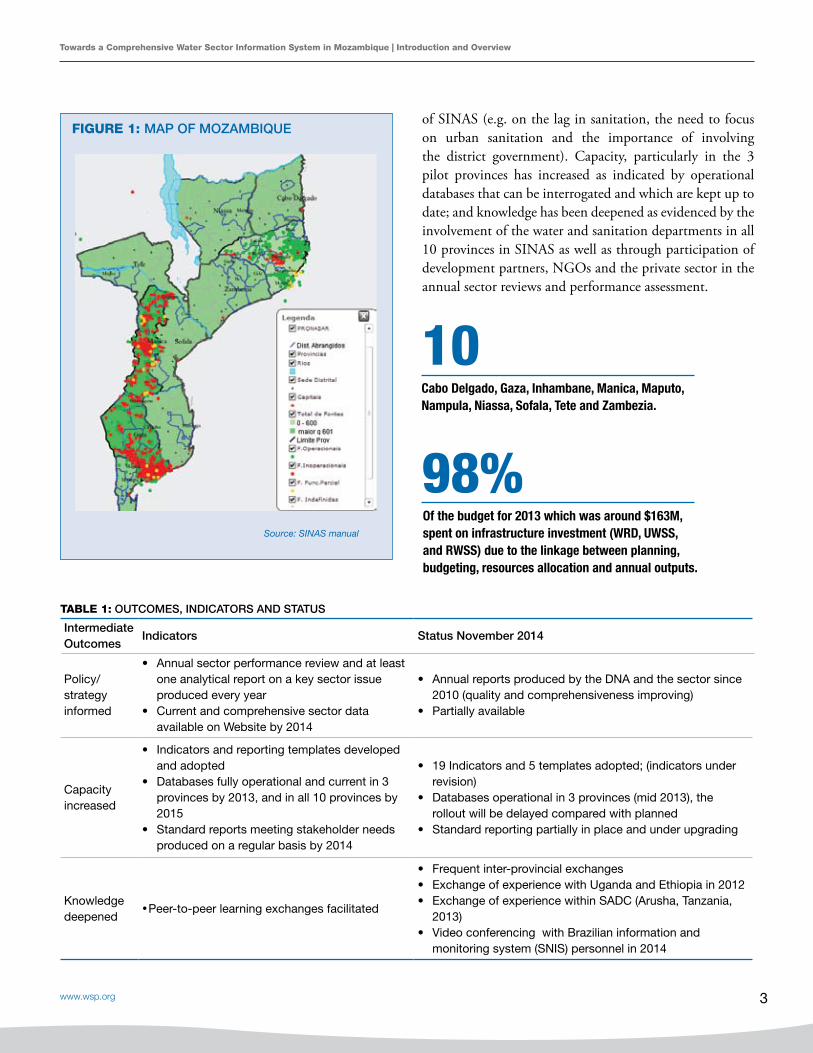
harmonization of the national rural water and sanitation subsector data bases; and the publication of annual water sector performance reports. Support at the provincial level focused on a pilot in 3 of Mozambique’s 10 provinces (Manica, Gaza and Nampula) – see figure 1. At the provincial level support was directed at: training provincial and district staff in planning and monitoring and evaluation issues; development of provincial data bases; and close supervision of data collection, especially during the initial stages.
There have been significant achievements to date (Box 3). Publication of the annual sector performance reports, which form the basis for the annual joint review of the sector by government and its partners, is a major achievement of SINAS. There are still opportunities for increasing the impact of SINAS especially as the sector framework is
2
Towards a Comprehensive Water Sector Information System in Mozambique | Introduction and Overview
BOX 2: WHAT IS SINAS
The national water sector information system (SINAS) is an information management system designed to cover the entire water sector (rural and urban water and sanitation as well as water resources management and water resources development).
The vision for SINAS is that it functions as a single, integrated sector-wide mechanism that is the first port of call for information on the water sector.
The mission of SINAS is to create a robust institutional network of information that seeks to identify, analyse, disseminate, use and store data and information for management, planning, policy formulation and decision-making.
Core elements• For Rural water supply and sanitation (RWSS)
there is a series of models that collect data from the local, sub-district, district and provincial levels (Model 0, I to III)
• For Urban water supply and sanitation (UWSS)there is a series of models that link to the institutions serving the sector. Model A (municipalities); Model E (AIAS); Model D (Water supply asset holding company (FIPAG))
• For water resources there is a system underdevelopment for categorising hydraulic structures and water bodies
BOX 3: Summary of achievementS,
opportuntieS and remaining challengeS
Achievements• Development of 19 sector indicators and 5
reporting templates that are under use. • Publicationofannualsectorperformancereports(by
DNA) leading to an informed stakeholder dialogue• Dataanalysistotrackkeyindicatorsandaddress
specific issues raised by sector stakeholders• Developmentofnationalandprovincialdatabase
and manuals on data management, analysis, and reporting
• Capacity-building in the three pilot provincesincluding refresher courses on planning, monitoring and reporting
• Establishment of provincial planning groupsincluding all district water staff and the provincial water department.
• Linkagebetweenplanning,budgeting, resourcesallocation and annual outputs. The budget for 2013 wasaround$163M,98%spentoninfrastructureinvestment (WRD, UWSS, and RWSS).
Opportunities • With the strengthening ofmunicipalities and the
development of AIAS there is an opportunity to integrate SINAS information management.
• The role out of SmoDD (district developmmentmonitoring system) will provide an opportunity to integrate SINAS
• Using the graphic outputs of the database toinform political and technical staff and increase incentives to make use of the information and sustain SINAS locally.
Challenges remaining• Ensuringdataqualityandconsistency• Refining and simplifying indicators, especially
within urban sanitation• Allocatingsufficientfinancialandhumanresources
at both national, but also especially at local government level
• Providing continuous capacity building to allprovince and districts and consolidating the national rollout.
further developed and the district development monitoring system (SMoDD) and the Administration for Water and Sanitation Infrastructure (AIAS) and other institutions and initiatives become more fully established. There are also challenges. One of the most urgent and important is the development and reporting ofurban sanitation indicators.
Table 1 shows the intended outcomes, the indicators and the status as of November 2014. The status of the indicators shows that the progress and achievements outlined in box 3 have contributed significantly to reaching the expected immediate outcomes. There is evidence that the policy and sector strategy has been better informed as a result
www.wsp.org 3
Towards a Comprehensive Water Sector Information System in Mozambique | Introduction and Overview
FIGURE 1: MAP OF MOzAMBIqUE
Source: SINAS manual
of SINAS (e.g. on the lag in sanitation, the need to focus on urban sanitation and the importance of involving the district government). Capacity, particularly in the 3 pilot provinces has increased as indicated by operational databases that can be interrogated and which are kept up to date; and knowledge has been deepened as evidenced by the involvement of the water and sanitation departments in all 10 provinces in SINAS as well as through participation of development partners, NGOs and the private sector in the annual sector reviews and performance assessment.
TaBlE 1: OUTCOMES, INDICATORS AND STATUS
Intermediate Outcomes
Indicators Status November 2014
Policy/strategy informed
• Annualsectorperformancereviewandatleastone analytical report on a key sector issue produced every year
• Currentandcomprehensivesectordataavailable on Website by 2014
• AnnualreportsproducedbytheDNAandthesectorsince2010(qualityandcomprehensivenessimproving)
• Partiallyavailable
Capacity increased
• Indicatorsandreportingtemplatesdevelopedand adopted
• Databasesfullyoperationalandcurrentin3provinces by 2013, and in all 10 provinces by 2015
• Standardreportsmeetingstakeholderneedsproduced on a regular basis by 2014
• 19Indicatorsand5templatesadopted;(indicatorsunderrevision)
• Databasesoperationalin3provinces(mid2013),therollout will be delayed compared with planned
• Standardreportingpartiallyinplaceandunderupgrading
Knowledge deepened
Peer-to-peer learning exchanges facilitated•
• Frequentinter-provincialexchanges• ExchangeofexperiencewithUgandaandEthiopiain2012• ExchangeofexperiencewithinSADC(Arusha,Tanzania,
2013)• VideoconferencingwithBrazilianinformationand
monitoring system (SNIS) personnel in 2014
Of the budget for 2013 which was around $163M, spent on infrastructure investment (WRD, UWSS, and RWSS) due to the linkage between planning, budgeting, resources allocation and annual outputs.
Cabo Delgado, Gaza, Inhambane, Manica, Maputo, Nampula, Niassa, Sofala, Tete and Zambezia.
98%
10

4
Table 1-a summarises the time line for the remaining components now that the RWSS system has been implemented in the pilot provinces and a full range of data collection modules agreed upon for both RWSS and UWSS.
TaBlE 1-a: TIMElINE FOR REMAINING COMPONENTS
System Components 2015 2016
RWSS National rollout
UWSSFIPAG implement the data collection
AIAS, Municipalitiesimplementthe data collection
WRM/D
Water development information integrated into SINAS (ARAs)
Water resources information integrated into SINAS
Ongoing and future support aims at supporting the sector to consolidate the achievements to date and roll out the rural water supply and sanitation monitoring system to cover all provinces. Within then urban sector the monitoring actions of AIAS will be integrated into SINAS and sector indicators for urban sanitation will be developed.
Towards a Comprehensive Water Sector Information System in Mozambique | Introduction and Overview

www.wsp.org 5
Summary of experience – The evolution of SINAS has taken place over nearly 10 years. Experience over this period demonstrates the importance of considering the political and institutional context of information systems, with technology playing a supportive rather than leading role – earlier attempts which did not take this into account failed. The evolution also shows how crucial it is to integrate the national statistical service in the definition and measurement of indicators and to involve at an early stage both the generators and users of information and to align the information system with institutional roles and responsibilities. A key learning point early on in the process was the importance of effective project management. Significant delays arose from procurement problems and these led to knock-on effects such as training taking place in advance of equipment being available and software development and hardware supply not being synchronised. Human resource capacity was a serious constraint all levels from local to central government and at decision-making as well as technical and operational levels.
SINAS does not operate in a vacuum. Success is closely linked to how well SINAS is aligned to the institutional setup. A simplified institutional set up of the water sector that SINAS serves is shown in figure 2. The black full lines show line management and the red dotted lines show where relationships are dependent on collaboration. It is evident that the institutional set up is heavily dependent on collaboration. This means that SINAS needs to link to various databases within sector institutions rather than being a monolithic unitary system, and this in turn means that managing SINAS is a “diplomatic” as much as a technical task.
Sector level - The Ministry of Public Works and Housing (MOPH) through its lead agency, the National Directorate of Water (DNA), is the custodian and assumes the overall policy leadership of the sector. Other Ministries, Departments and Agencies such as the Ministry of Planning and Development (MPD), the Ministry for State Administration (MAE), the Institute for National Statistics (INE) and the Ministry of Health (MISAU) are also important national actors, each with their own role. Within
Context and Evolution of SINASII.DNA, the Planning Department has the lead responsibility for SINAS. The Water Supply and Sanitation, Hydraulic Works and Water Resources Departments in DNA coordinate closely with the Planning Department and provide the core technical support in each sub-sector.
The sector regulatory body (CRA) has the regulatory oversight role for UWSS.
RWSS – The Public Works Water and Sanitation Departments at the provincial level are the custodians of provincial information and key actors in aggregating and supporting the districts and lower tiers of local government. The provincial departments work with the District Administration and the Planning and Infrastructure Units which have the responsibility for water supply and sanitation at district level and are responsible for district data collection. This is often a team of one or two people. The District Administration liaises and supports the Sub-district which are responsible for post level data collection. Finally the head of the Locality, which would typically include 2 or 3 villages, is responsible for data collection at a household level.
UWSS – FIPAG has responsibility for water supply in the major towns. AIAS has responsibility for sanitation in all major and secondary towns and water supply in those towns not served by FIPAG. The towns served by both FIPAG and AIAS in principle delegate water supply to utilities that implement and operate the systems, whilst sanitation is a local government function, with major investments being made through AIAS. Autonomous municipalities run their own systems normally through their water and sanitation departments. FIPAG, AIAS and the municipalities are each responsible for data collection and processing and standard forms have been developed to ensure consistent information is collected.
WRM-WRD- Water resources is a centralised function in Mozambique that is led by the department of water resources in DNA. Water resources development is coordinated

6
FIGURE 2: SIMPlIFIED INSTITUTIONAl SET UP
nationally by DNA but implementation is delegated to a number of catchment based Regional Water Resources Boards (ARAs).
Mozambique has been collecting data on the water sector since the 1970s and a variety of attempts at developing a nationwide system have been made without widespread success. A key factor behind these failures was that the national institutional set-up was weak and its roles and responsibilities were largely ignored by well-meaning efforts to improve data collection and reporting. In the decades following independence, the rural water subsector became dominated by donor and NGO projects. Each project developed its own project monitoring unit to respond to specific NGO or donor demands, making it difficult for the sector to get accurate data. This made it difficult for
DNA to develop a consistent sector overview. Attempts at improving coordination tended to focus on developing computer software, instead of building capacities and an institutional structure that could sustain the sector monitoring system. Within urban subsector monitoring, substantive changes came about as a result of reforms that created autonomous sector institutions (FIPAG and AIAS, regulated by CRA) as shown in figure 2, but despite these well-conceived reforms, the sector did not get better data immediately. Each institution tended to create its own management information system which served immediate operational monitoring needs but did not provide longer term strategic information for the sector as a whole. There was a lack of clarity in defining the information needed at different levels of government and weak coordination with the autonomous sector institutions
Towards a Comprehensive Water Sector Information System in Mozambique | Context and Evolution of SINaS
Urban Water and SanitationWRM and development Rural Water and Sanitation
CRA
Water Utilities
SewerageUtilities
Planning Dept.SINAS Unit
Collaboration
line Management
DistrictAdministration
Sub-District
locality
Dept. Water Resources
Hydraulic Works Dept.
ARAS
Other Provincial Depts.
INE, MISAU, MAE,MPD etc.
FIPAGAIAS
Water and Sanitation Dept.
Public Works
W & S Dept.
Other Depts.
Provincial Government
Water and Sanitation Dept.
Other Depts.
Planning and Infrastructure Unit
MunicipalGovernment
MOPH/National Water Directorate
www.wsp.org 7
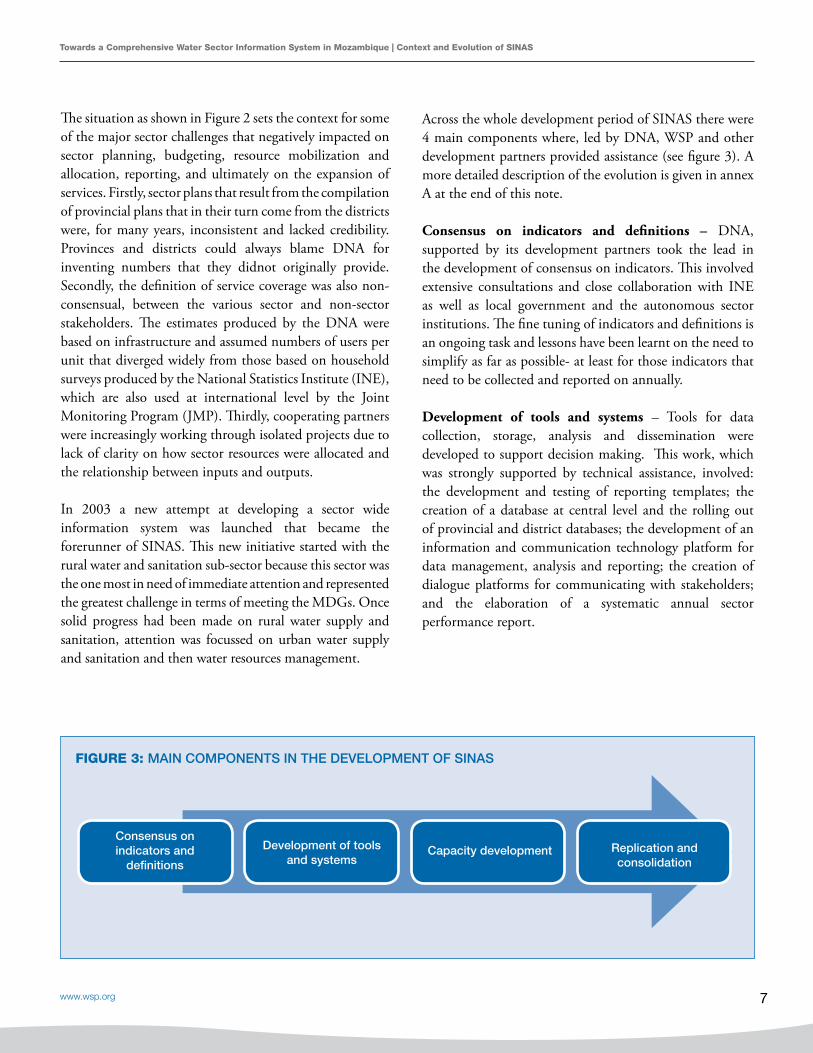
FIGURE 3: MAIN COMPONENTS IN THE DEVElOPMENT OF SINAS
The situation as shown in Figure 2 sets the context for some of the major sector challenges that negatively impacted on sector planning, budgeting, resource mobilization and allocation, reporting, and ultimately on the expansion of services. Firstly, sector plans that result from the compilation of provincial plans that in their turn come from the districts were, for many years, inconsistent and lacked credibility. Provinces and districts could always blame DNA for inventing numbers that they didnot originally provide. Secondly, the definition of service coverage was also non-consensual, between the various sector and non-sector stakeholders. The estimates produced by the DNA were based on infrastructure and assumed numbers of users per unit that diverged widely from those based on household surveys produced by the National Statistics Institute (INE), which are also used at international level by the Joint Monitoring Program (JMP). Thirdly, cooperating partners were increasingly working through isolated projects due to lack of clarity on how sector resources were allocated and the relationship between inputs and outputs.
In 2003 a new attempt at developing a sector wide information system was launched that became the forerunner of SINAS. This new initiative started with the rural water and sanitation sub-sector because this sector was the one most in need of immediate attention and represented the greatest challenge in terms of meeting the MDGs. Once solid progress had been made on rural water supply and sanitation, attention was focussed on urban water supply and sanitation and then water resources management.
Towards a Comprehensive Water Sector Information System in Mozambique | Context and Evolution of SINaS
Across the whole development period of SINAS there were 4 main components where, led by DNA, WSP and other development partners provided assistance (see figure 3). A more detailed description of the evolution is given in annex A at the end of this note.
Consensus on indicators and definitions – DNA, supported by its development partners took the lead in the development of consensus on indicators. This involved extensive consultations and close collaboration with INE as well as local government and the autonomous sector institutions. The fine tuning of indicators and definitions is an ongoing task and lessons have been learnt on the need to simplify as far as possible- at least for those indicators that need to be collected and reported on annually.
Development of tools and systems – Tools for data collection, storage, analysis and dissemination were developed to support decision making. This work, which was strongly supported by technical assistance, involved: the development and testing of reporting templates; the creation of a database at central level and the rolling out of provincial and district databases; the development of an information and communication technology platform for data management, analysis and reporting; the creation of dialogue platforms for communicating with stakeholders; and the elaboration of a systematic annual sector performance report.
Consensus on indicators and
definitions
Development of tools and systems
Capacity development Replication and consolidation
8
Capacity development –It was recognised that at all levels but especially for local government (for rural water supply and sanitation) there were substantial capacity constraints in terms of both numbers of staff and their qualifications and experience. A variety of capacity development initiatives were undertaken directed both at decision-makers and operational staff. This went beyond simply monitoring, and started with training on planning, as a way of creating local demand for the data to be collected and managed. Much has been learned (see some of the key lessons in box 4). With the support of WSP and other development partners, training in monitoring and evaluation (M&E) skills was carried out at all levels to improve the system of data collection, storage, analysis, validation, and dissemination. It was recognized that the training should focus firstly on local government and RWSS because of the weakness of monitoring in this subsector and the critical need to monitor the progress of the National Rural Water Supply and Sanitation Program (PRONASAR). The partners also agreed on a road map for implementing capacity building nationwide as a threefold activity: (a) strengthening SINAS at the national level to improve the effectiveness of sector governance; (b) building capacity in the three pilot provinces that had shown the best progress to date, and in their constituent districts; and (c) replicating this experience in the other seven provinces to establish a comprehensive and sustainable national system. Learning exchanges were also held at inter-province and inter-district level and later on in the process also with other countries in the South African Development Community (SADC) region and beyond.
BOX 4: leSSonS on capacity development
Capacity development is the key to success both in terms of commitment to prioritise SINAS and competence in making it work.
Experience showed that once-off training is not enough. People change (many hundreds are involved, so turnover is considerable) and most people need repeat training. If what is learnt is not usedsoonafter,familiaritywillquicklydiminish,andit was also found that class room training and on the job coaching/ supervision are more powerful when combined – a three day class room event is not enough; follow-up as part of normal task supervision is needed. Rigorous readiness tests are needed to ensure capacity development is well targeted. Both the trainer and trainee need to be confident that minimum competence levels have been reached.
The Target group needs to be carefully selected. There are different target groups, the leaders, the technical staff and the politically responsible bodies – all of which need attention.
Replication and consolidation – a study on the lessons learnt during the pilot phase in the 3 model provinces was undertaken to prepare the way for consolidation of SINAS and the national roll-out to all provinces. At the same time plans were developed to extend the databases and support tools to include urban sanitation and water resources.
Towards a Comprehensive Water Sector Information System in Mozambique | Context and Evolution of SINaS

www.wsp.org 9
FIGURE 4: SINAS 4 PIllAR STRATEGy
Summary of experience – A core lesson from earlier attempts was that it is much easier to start an information system than to sustain it. In response, SINAS was explicitly and structurally designed to enhance sustainability. The main strategy was to focus on the end user and take into consideration the incentive environment for generating data and making use of information. A key strategy is to delegate responsibility for management of information to where data is generated and used.
In line with its vision and mission SINAS was intended to create a single information system to service the entire water sector so that robust information would be available for management, planning, policy formulation and decision making – at all levels.The overall strategy of SINAS is built on 4 pillars that respond to 12 basic questions (see figure 4)[SINAS June 2009].
The four pillars are centred on the theme of sustainability:• Ownership – ownership in this sense is related to
the demand for and usefulness of the information, the pillar looks to ensure that the information responds to the needs of different stakeholders who will then act to ensure the system is sustained.
• Information management – management in this sense is related to how the system is coordinated and operated; as it involves many different institutions it is crucial that the overall system and responsibility for operating it is well anchored and well managed.
• Maintenance – maintenance in this sense is related to the flow of information through the channels established and ensuring that data is quality controlled and processed as it moves up the information ladder.
The Strategic Elements of a Single Sector Wide Information SystemIII.
SINAS
Ownership
Who are the actors that have stake in the sector?
Who will establish, govern and manage the system?
What data needs to be collected, what is the flow of information?
Are the indicators valid and reliable?
What information is needed?
What financial and human resources does the system need?
How is the data qualitycontrolledandprocessed?
How is the data and information linked to official statistics?
Who will use the information and for what?
What procedures/guidance is needed at each stage?
How do in-depth studies complement routine monitoring?
How is the information reported and disseminated?
Maintenance CredibilityInformation
Management
1. 4. 7. 10.
2. 5. 8. 11.
3. 6. 9. 12.

10
• Credibility – credibility in this sense is related to how reliable the information is and is perceived; how well it is disseminated and reported on.
The core principle behind all the principles is that SINAS will only be sustained if it serves a useful purpose – it must be adjusted constantly to ensure that it is responsive to evolving needs for information.
Towards a Comprehensive Water Sector Information System in Mozambique | The Strategic Elements of a Single Sector Wide Information System
Based on these principles, SINAS developed 19 indicators with a number of sub-indicators or definitions giving a total of 46 indicators (see table 2 where the indicators are given). These indicators have been evolving and there is a process underway to refine and simplify them because some have proven difficult and unwieldy to report. Some of the most insightful indicators are not suitable for annual reporting and are more of research nature e.g. time taken to fetch water. There is also a mix of sector performance and input based construction progress indicators.
TaBlE 2: INDICATORS AND DEFINITIONS
Indicator Definition
RWSS
Time to fetch water %ofhouseholdsthatuselessthan30minutestofetchdrinkingwater
Access %oftheruralpopulationwithaccesstoimprovedwatersupplywithin500m
Use%oftheruralpopulationthatusesimprovedwaterpoints;%oftheruralpopulationthatusesimproved sanitation installations
Functionality %waterpointsthatareoperational
Infrastructure constructed /rehabilitated
7 definitions related to water points, piped systems, latrines (improved and traditional) and open defecation status
Sustainability No. of districts with spare part outlets
InvestmentAvailabilityoffundstomeetMDGsRatioofreductionofactivitiesoutsidestatebudget;%ofaidflowsreportedinthebudgetexecutionreport;%ofaidtothesectorthatusesthenationalpublicprocurement procedures
Gender %ofwatercommitteeswithwomenasthehead
Equity%ofhouseholdersinpoorareaswithaccesstowaterandsanitation;%ofwatersourcesmaintained and repaired by communities in in accordance with pro-poor standards and regulations
UWSS
Incidence of water-borne disease
Number of reported cases of diarrheal diseases in a given period
Use of water facilities %of(urban)populationwhoregularlyconsumewaterfromsafewatersources(piped)
Use of sanitation facilities %of(urban)populationwhoregularlyusesafesanitationfacilities
Infrastructure constructed and rehabilitated
11 definitions related to water connections, water points, septic tanks, sewerage connections, schools
EfficiencyPhysicalwaterloss-%ofwatertreatedanddistributed;Commercialwaterloss;Continuityofwatersupply;%offaecalsludgetreated
Waterquality %ofsamplestestedthatarewithintheregulatorylimitsforhumanconsumption
WRM
Population affected by extreme events
Number of people affected by floods and droughts in a given period
Level of storage Quantity of water stored versus the installed storage capacity in a given period
Hydrometric stations constructed/rehabilitated
Number of Hydrometric stations constructed and rehabilitated per year
Hydraulic structures constructed/ rehabilitated
Number of large dams in construction and completed per year; Number of medium dams in construction and completed per year; Number of small dams in construction and completed per year; Number of weirs in construction and completed per year
www.wsp.org 11
Towards a Comprehensive Water Sector Information System in Mozambique | The Strategic Elements of a Single Sector Wide Information System
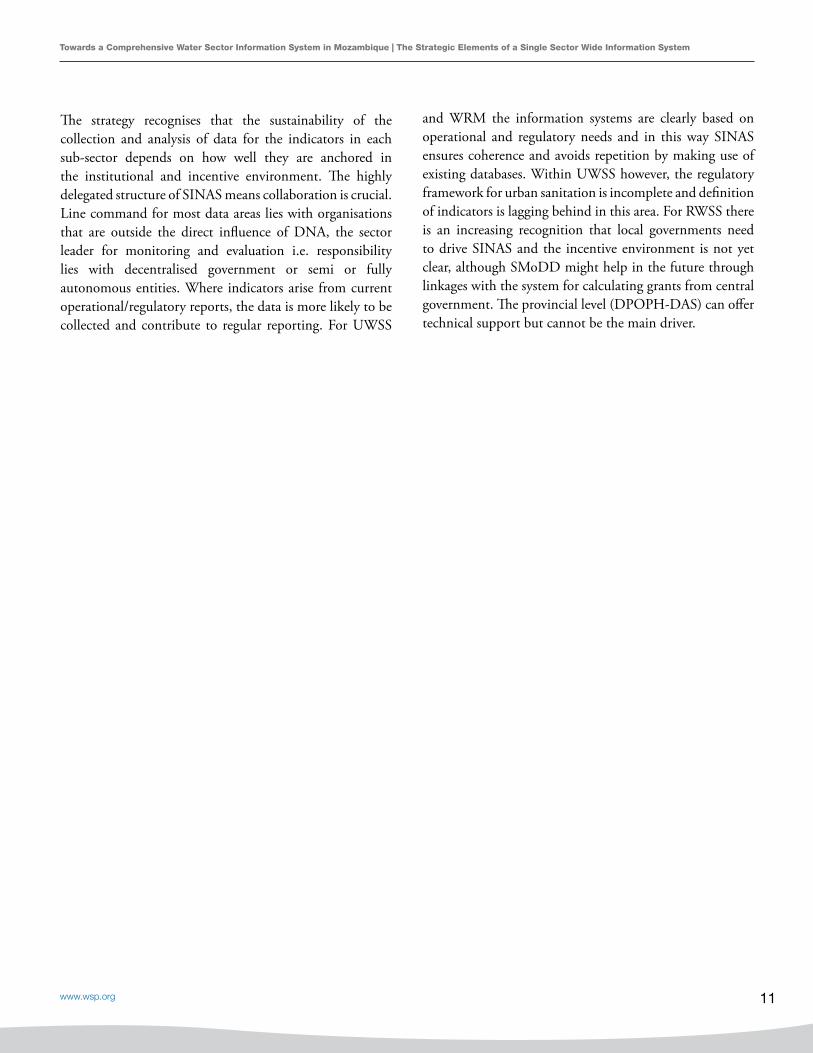
The strategy recognises that the sustainability of the collection and analysis of data for the indicators in each sub-sector depends on how well they are anchored in the institutional and incentive environment. The highly delegated structure of SINAS means collaboration is crucial. Line command for most data areas lies with organisations that are outside the direct influence of DNA, the sector leader for monitoring and evaluation i.e. responsibility lies with decentralised government or semi or fully autonomous entities. Where indicators arise from current operational/regulatory reports, the data is more likely to be collected and contribute to regular reporting. For UWSS
and WRM the information systems are clearly based on operational and regulatory needs and in this way SINAS ensures coherence and avoids repetition by making use of existing databases. Within UWSS however, the regulatory framework for urban sanitation is incomplete and definition of indicators is lagging behind in this area. For RWSS there is an increasing recognition that local governments need to drive SINAS and the incentive environment is not yet clear, although SMoDD might help in the future through linkages with the system for calculating grants from central government. The provincial level (DPOPH-DAS) can offer technical support but cannot be the main driver.
12
SINAS in Operation - Rural Water Supply and SanitationIV.FIGURE 5: EXTRACT FROM SINAS ANNUAl SECTOR PERFORMANCE REPORT 2013
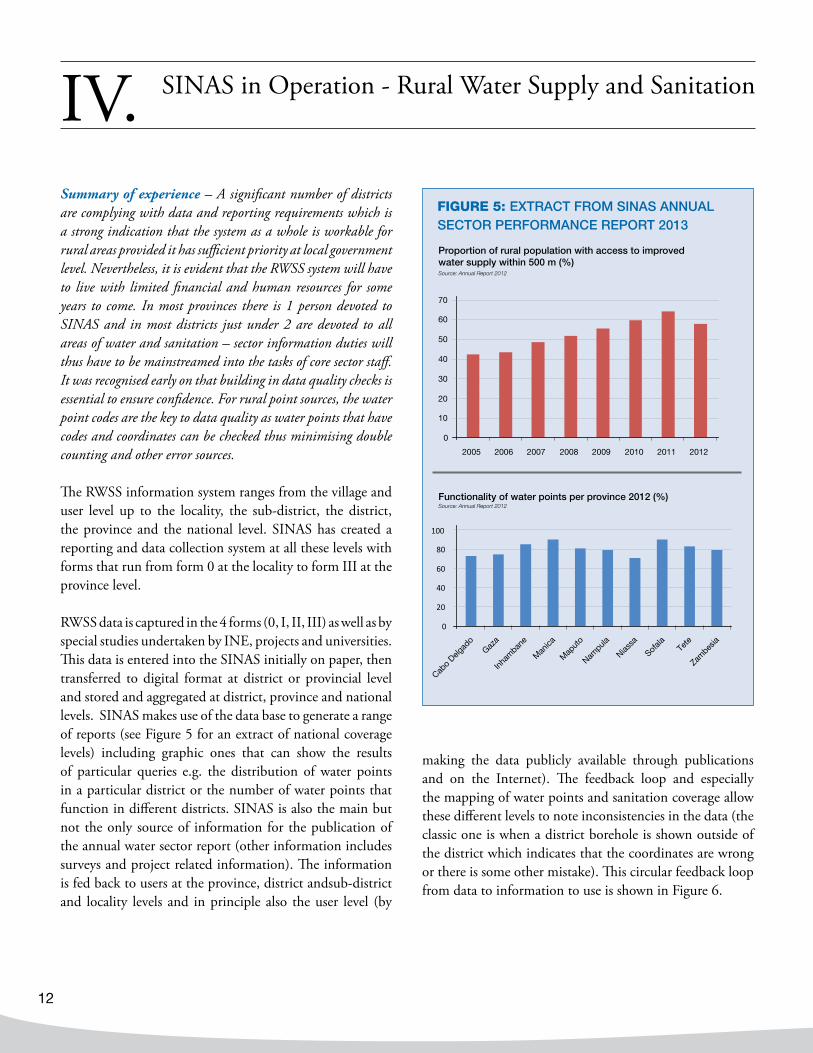
Summary of experience – A significant number of districts are complying with data and reporting requirements which is a strong indication that the system as a whole is workable for rural areas provided it has sufficient priority at local government level. Nevertheless, it is evident that the RWSS system will have to live with limited financial and human resources for some years to come. In most provinces there is 1 person devoted to SINAS and in most districts just under 2 are devoted to all areas of water and sanitation – sector information duties will thus have to be mainstreamed into the tasks of core sector staff. It was recognised early on that building in data quality checks is essential to ensure confidence. For rural point sources, the water point codes are the key to data quality as water points that have codes and coordinates can be checked thus minimising double counting and other error sources.
The RWSS information system ranges from the village and user level up to the locality, the sub-district, the district, the province and the national level. SINAS has created a reporting and data collection system at all these levels with forms that run from form 0 at the locality to form III at the province level.
RWSS data is captured in the 4 forms (0, I, II, III) as well as by special studies undertaken by INE, projects and universities. This data is entered into the SINAS initially on paper, then transferred to digital format at district or provincial level and stored and aggregated at district, province and national levels. SINAS makes use of the data base to generate a range of reports (see Figure 5 for an extract of national coverage levels) including graphic ones that can show the results of particular queries e.g. the distribution of water points in a particular district or the number of water points that function in different districts. SINAS is also the main but not the only source of information for the publication of the annual water sector report (other information includes surveys and project related information). The information is fed back to users at the province, district andsub-district and locality levels and in principle also the user level (by
making the data publicly available through publications and on the Internet). The feedback loop and especially the mapping of water points and sanitation coverage allow these different levels to note inconsistencies in the data (the classic one is when a district borehole is shown outside of the district which indicates that the coordinates are wrong or there is some other mistake). This circular feedback loop from data to information to use is shown in Figure 6.

www.wsp.org 13
Towards a Comprehensive Water Sector Information System in Mozambique | SINaS in Operation - Rural Water Supply and Sanitation
FIGURE 6: RWSS INFORMATION SySTEMS – COllECTION, PROCESSING, REPORTING AND USE

14
Summary of experience – A set of coherent templates and databasesare in place for the urban sector. However, the experience is that implementation is uneven as some institutions are more advanced in information management e.g. FIPAG and ARAs (WRM)and DNA (WRD) have operational systems, AIAS and the municipalities do not yet have them. It was recognised early on that building in data quality checks is essential to ensure confidence. For urban piped systems, utility operational records are a good means of correlating and checking data with that collected by the surveys. Since 2010, SINAS has been reporting data from 18 principal systems (3 small and 15 large) whose population size represent about 80% of the country urban population.
The urban water supply and sanitation information system of SINAS is based on 4 main sources of data arranged across 3 forms and special surveys:
• Form A - collects the data from small piped systems at the district and municipal levels
• Form D – collects the data from FIPAG which is the asset-holder for the water supply utilities in the major towns
• Form E – collects the data from AIAS which is a recent organisation established to manage water supply in secondary towns and sanitation in both primary and secondary towns
• Special surveys – these are undertaken by the sector regulatory body (CRA) and can also be commissioned by INE, research bodies and projects.
By way of example, Figure 7 shows the use of improved water in the 18 principal urban systems (Extracted from SINAS - annual report 2012).
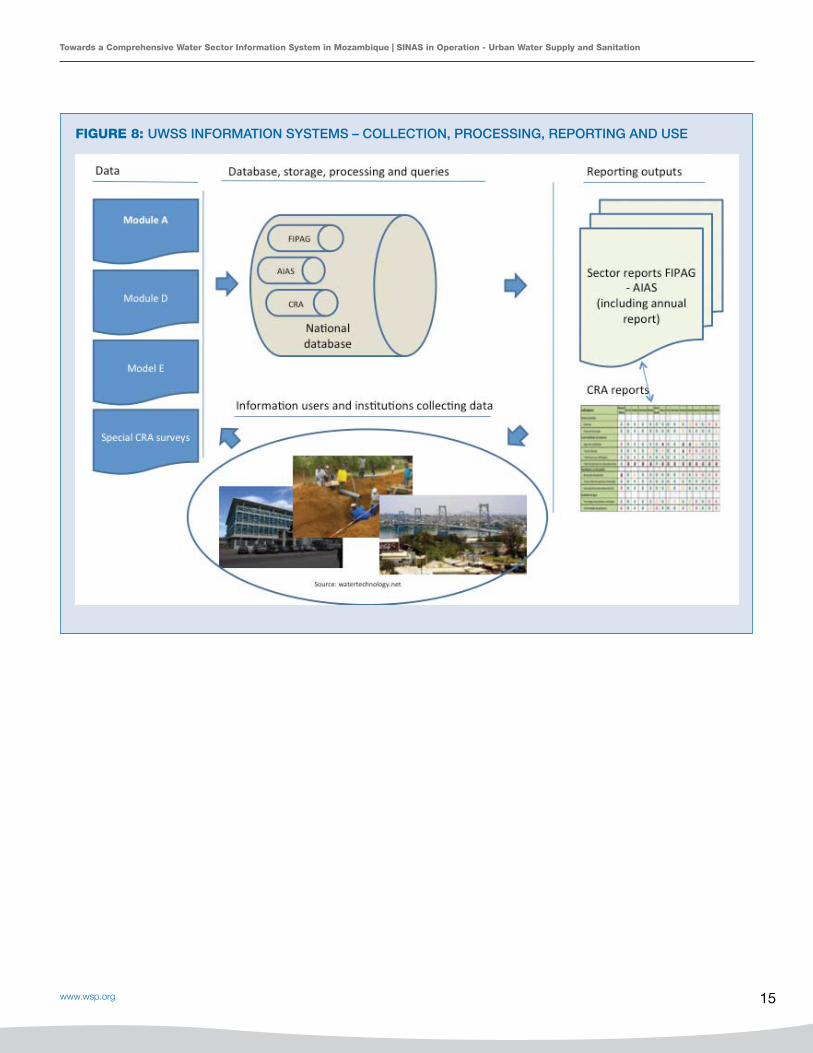
Figure 8 shows the links between the data (arising from the modules and surveys above), the processing and database storage held at the different institutions and the national database under SINAS, and then the link to the development of annual reports by the relevant institutions (FIPAG, AIAS, CRA) and also the annual sector performance report.
SINAS in Operation - Urban Water Supply and SanitationV.FIGURE 7: EXTRACT FROM SINAS ANNUAl SECTOR PERFORMANCE REPORT 2012
A key feature of the urban water supply and sanitation sub-sector information is the role of CRA which generates and makes use of regulatory data and the utility based organisations, FIPAG and AIAS, which generate and make use of operational data such as water loss statistics. There is also an international dimension as many of the utilities report through the IBNET system, hosted by the World Bank, which has a wide range of indicators. This provides an opportunity to further cross-check and make use of this data set.
www.wsp.org 15
Towards a Comprehensive Water Sector Information System in Mozambique | SINaS in Operation - Urban Water Supply and Sanitation
FIGURE 8: UWSS INFORMATION SySTEMS – COllECTION, PROCESSING, REPORTING AND USE

16
Summary of experience – A consensus has started to develop over water resources development indicators. Water Resources Management is more complex and is served by own system which may be better to retain as a specialist data base rather than to try to integrate it into SINAS.
The Water Resource Department of DNA and the ARAs are the main agencies involved in water resources management and development. Data from DNA and the ARAs on each hydraulic structure are entered into the SINAS system against the main technical details and
SINAS in operation - Water resources management and developmentVI.
parameters. Each hydraulic structure has a unique code signifying the province, local government, sub-district, number of the structure and the year of construction. This allows easy verification and updating of the information. Using the information provided in the data-base, maps can be drawn showing the location and status of all registered hydraulic structures and works as shown in figure 9. SINAS is currently being extended to integrate the water resources information data base that is held by the water resources management department of DNA.
FIGURE 9: MAPPING OUTPUT ON HyDRAUlIC WORkS (SINAS)
www.wsp.org 17
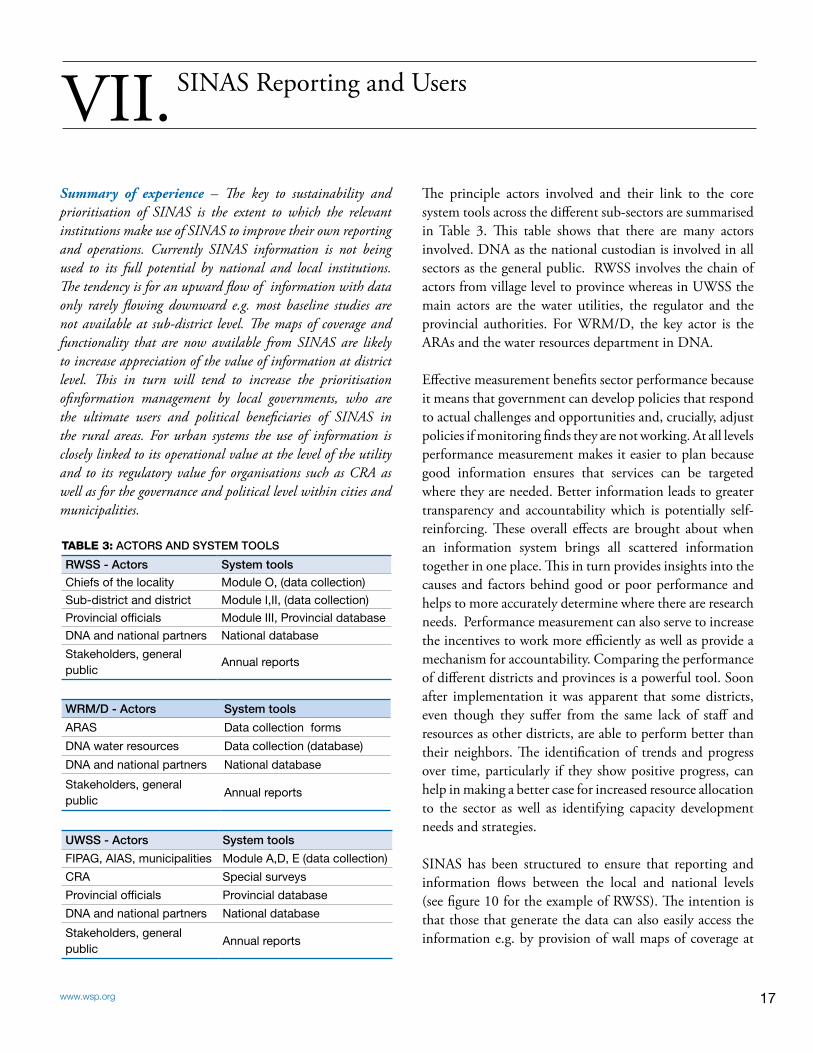
SINAS Reporting and UsersVII.Summary of experience – The key to sustainability and prioritisation of SINAS is the extent to which the relevant institutions make use of SINAS to improve their own reporting and operations. Currently SINAS information is not being used to its full potential by national and local institutions. The tendency is for an upward flow of information with data only rarely flowing downward e.g. most baseline studies are not available at sub-district level. The maps of coverage and functionality that are now available from SINAS are likely to increase appreciation of the value of information at district level. This in turn will tend to increase the prioritisation ofinformation management by local governments, who are the ultimate users and political beneficiaries of SINAS in the rural areas. For urban systems the use of information is closely linked to its operational value at the level of the utility and to its regulatory value for organisations such as CRA as well as for the governance and political level within cities and municipalities.
The principle actors involved and their link to the core system tools across the different sub-sectors are summarised in Table 3. This table shows that there are many actors involved. DNA as the national custodian is involved in all sectors as the general public. RWSS involves the chain of actors from village level to province whereas in UWSS the main actors are the water utilities, the regulator and the provincial authorities. For WRM/D, the key actor is the ARAs and the water resources department in DNA.
Effective measurement benefits sector performance because it means that government can develop policies that respond to actual challenges and opportunities and, crucially, adjust policies if monitoring finds they are not working. At all levels performance measurement makes it easier to plan because good information ensures that services can be targeted where they are needed. Better information leads to greater transparency and accountability which is potentially self-reinforcing. These overall effects are brought about when an information system brings all scattered information together in one place. This in turn provides insights into the causes and factors behind good or poor performance and helps to more accurately determine where there are research needs. Performance measurement can also serve to increase the incentives to work more efficiently as well as provide a mechanism for accountability. Comparing the performance of different districts and provinces is a powerful tool. Soon after implementation it was apparent that some districts, even though they suffer from the same lack of staff and resources as other districts, are able to perform better than their neighbors. The identification of trends and progress over time, particularly if they show positive progress, can help in making a better case for increased resource allocation to the sector as well as identifying capacity development needs and strategies.
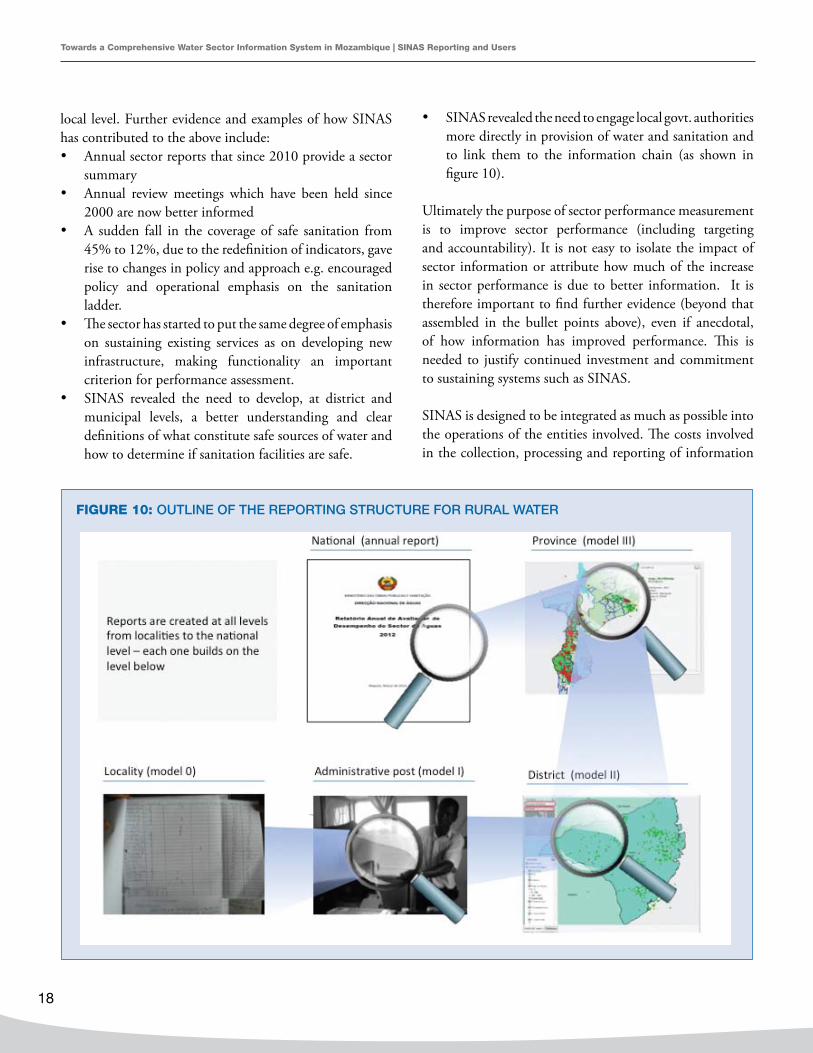
SINAS has been structured to ensure that reporting and information flows between the local and national levels (see figure 10 for the example of RWSS). The intention is that those that generate the data can also easily access the information e.g. by provision of wall maps of coverage at
TaBlE 3: ACTORS AND SySTEM TOOlS
RWSS - Actors System tools
Chiefs of the locality Module O, (data collection)
Sub-district and district Module I,II, (data collection)
Provincial officials Module III, Provincial database
DNA and national partners National database
Stakeholders, general public
Annual reports
WRM/D - Actors System tools
ARAS Data collection forms
DNA water resources Data collection (database)
DNA and national partners National database
Stakeholders, general public
Annual reports
UWSS - Actors System tools
FIPAG, AIAS, municipalities Module A,D, E (data collection)
CRA Special surveys
Provincial officials Provincial database
DNA and national partners National database
Stakeholders, general public
Annual reports
18
FIGURE 10: OUTlINE OF THE REPORTING STRUCTURE FOR RURAl WATER
Towards a Comprehensive Water Sector Information System in Mozambique | SINaS Reporting and Users
local level. Further evidence and examples of how SINAS has contributed to the above include:• Annual sector reports that since 2010 provide a sector
summary • Annual review meetings which have been held since
2000 are now better informed • A sudden fall in the coverage of safe sanitation from
45% to 12%, due to the redefinition of indicators, gave rise to changes in policy and approach e.g. encouraged policy and operational emphasis on the sanitation ladder.
• The sector has started to put the same degree of emphasis on sustaining existing services as on developing new infrastructure, making functionality an important criterion for performance assessment.
• SINAS revealed the need to develop, at district and municipal levels, a better understanding and clear definitions of what constitute safe sources of water and how to determine if sanitation facilities are safe.
• SINAS revealed the need to engage local govt. authorities more directly in provision of water and sanitation and to link them to the information chain (as shown in figure 10).
Ultimately the purpose of sector performance measurement is to improve sector performance (including targeting and accountability). It is not easy to isolate the impact of sector information or attribute how much of the increase in sector performance is due to better information. It is therefore important to find further evidence (beyond that assembled in the bullet points above), even if anecdotal, of how information has improved performance. This is needed to justify continued investment and commitment to sustaining systems such as SINAS.
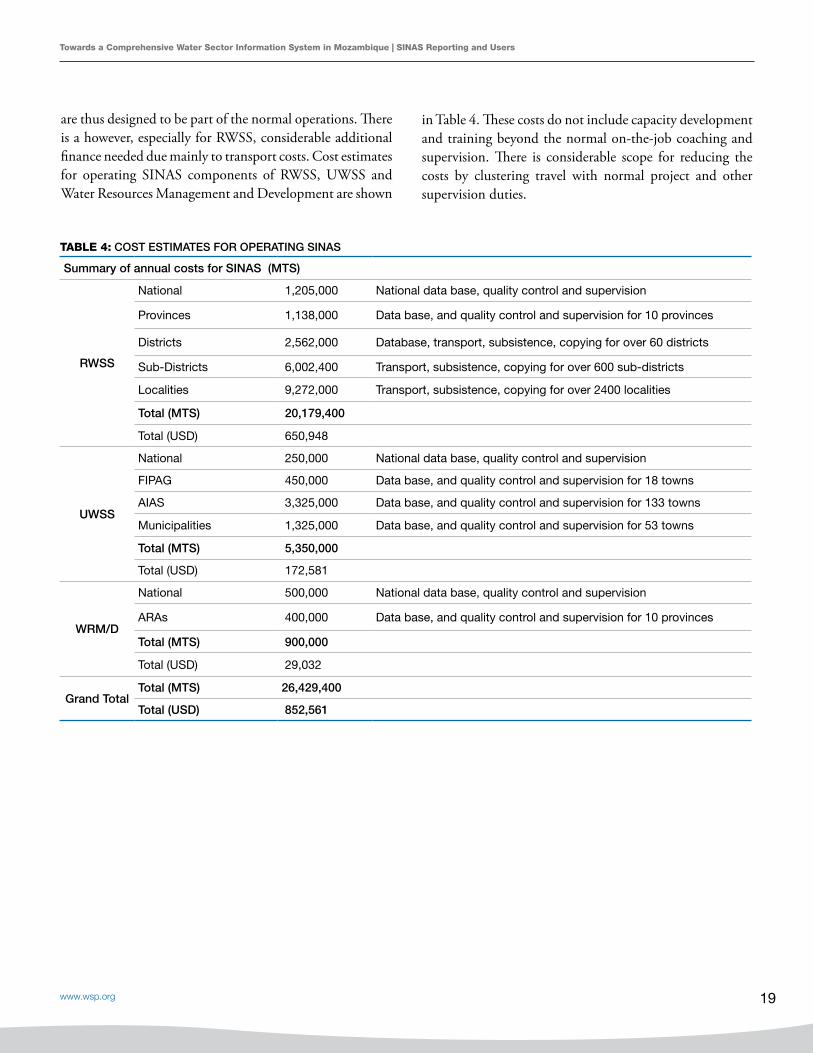
SINAS is designed to be integrated as much as possible into the operations of the entities involved. The costs involved in the collection, processing and reporting of information
www.wsp.org 19
TaBlE 4: COST ESTIMATES FOR OPERATING SINAS
Summary of annual costs for SINAS (MTS)
RWSS
National 1,205,000 Nationaldatabase,qualitycontrolandsupervision
Provinces 1,138,000 Database,andqualitycontrolandsupervisionfor10provinces
Districts 2,562,000 Database, transport, subsistence, copying for over 60 districts
Sub-Districts 6,002,400 Transport, subsistence, copying for over 600 sub-districts
Localities 9,272,000 Transport, subsistence, copying for over 2400 localities
Total (MTS) 20,179,400
Total (USD) 650,948
UWSS
National 250,000 Nationaldatabase,qualitycontrolandsupervision
FIPAG 450,000 Database,andqualitycontrolandsupervisionfor18towns
AIAS 3,325,000 Database,andqualitycontrolandsupervisionfor133towns
Municipalities 1,325,000 Database,andqualitycontrolandsupervisionfor53towns
Total (MTS) 5,350,000
Total (USD) 172,581
WRM/D
National 500,000 Nationaldatabase,qualitycontrolandsupervision
ARAs 400,000 Database,andqualitycontrolandsupervisionfor10provinces
Total (MTS) 900,000
Total (USD) 29,032
Grand TotalTotal (MTS) 26,429,400
Total (USD) 852,561
are thus designed to be part of the normal operations. There is a however, especially for RWSS, considerable additional finance needed due mainly to transport costs. Cost estimates for operating SINAS components of RWSS, UWSS and Water Resources Management and Development are shown
in Table 4. These costs do not include capacity development and training beyond the normal on-the-job coaching and supervision. There is considerable scope for reducing the costs by clustering travel with normal project and other supervision duties.
Towards a Comprehensive Water Sector Information System in Mozambique | SINaS Reporting and Users

20
Delegation, incentives and institutional alignment: Rather than aiming at a sole management structure of a single master system, SINAS delegated information management to the institutions that had operational and regulatory obligations to manage information. This ensures that the information system supports rather than inadvertently distorts institutional mandates in the sector. It also means that those which will make use of the information are also those which have responsibility for collecting the information, which strengthens motivation and accountability. The databases are located at district and provincial levels to ensure that local users have access to the information and can analyse it. It is also planned to produce maps of the outputs (e.g. coverage and functionality) with each reporting cycle that could be strategically placed, not just in the water office but in the main district offices, so that decision makers are aware of the progress or lack of progress.
Sustaining interest and commitment: Sustaining interest and commitment is challenging, especially for local governments that are strapped for resources and have responsibilities across many sectors and tasks. At local government level, direct implementation and provision of services isunderstandably prioritised above longer term monitoring and evaluation. SINAS, through its capacity building efforts supported by DNA and its development partners aims to show how good information is an essential tool for better targeting of limited resources and leads to more efficient implementation and service provision. Where local governments are convinced of the benefits, implementation has been smoother and problems that occurred have been solved locally e.g. lack of transport has been solved by clustering field visits with other services such as health; staff that were trained and transferred to other duties left hand-over notes and ensured a smooth transfer of duties. To further encourage the mainstreaming of the water and sanitation sector into the government’s overall monitoring program, and thus promote the sustainability of SINAS through government’s administrative accountability mechanisms, SINAS is now coordinating its activities with the on-going development of SMoDD. The SMoDD, a decentralization project supported by the World Bank,
Major Lessons LearnedVIII.will contribute to better coordination between sectors and different levels of government, and SINAS will contribute to this by making availableaccurate and up-to-date sector data. The combined effect of the two projects will result in better district planning, clearly linking inputs and activities to outputs and key outcomes.
Leadership and coordination: A highly delegated information structure places demands on leadership and coordination. SINAS progressed strongly during periods where strong national champions emerged that were able to inspire and create allies in other institutions. Leadership is needed to spearhead, adjust and persist with the sector information strategy. SINAS has found it difficult to fully coordinate across the national stakeholders. Most of the coordination structures at the central level remain on paper. Plans to institute a SINAS coordination unit in DNA could potentially help. At the local level, coordination has often been much easier to obtain e.g. in Nampula the coordination between AIAS and the provincial office for water and sanitation occurs on a daily basis as they share the same office.
Simplicity and starting step by step: Complex indicators cause confusion, are difficult to measure and lead to disagreement. Experience indicates that a national information system should routinely monitor a few simple core indicators, leaving more complex topics to periodic studies and research. Once the national system is robust and reporting regularly on the core indicators, new more complex indicators can be introduced for routine monitoring, step by step.
Data before ICT systems: The development of SINAS focused clearly on obtaining regular, consistent and decent-quality data. Only when this system was clearly established was the ICT infrastructure developed. This meant that the ICT element was fully attuned to the data collection system as developed in the field, and also avoided the all too common pitfall of creating a beautiful user interface with maps and graphs, giving users the impression that there is a wonderful system in place, when the frontline data collection underlying it is still very weak.
www.wsp.org 21
In order for SINAS to move forward as an effective tool for policy making, strategy adjustment, and targeting of resources, the DNA needs to prioritize its efforts to achieving a national scale. It is recommended to focus on the following priority actions:
Consolidate SINAS and prepare the national roll out by:• Making use of existing arrangements to coordinate at
the national level. • Making minimal revisions to improve current
indicators • Securing continuous funding for at least a 5 to 10 year
horizon.• Planning a phased transfer of ownership and
responsibility from the Provincial offices to the local governments; formalising the agreements with MOUs and linking where possible with SMoDD
• Emphasising the dissemination of data and reports
Recommendations for Consolidating and Implementing a National RolloutIX.
Implement the national rollout by:• Making a readiness test before final roll out to provinces
including: i) adequate recurrent budget; ii) staff trained; iii) local government agreements.
• Synchronising the roll out of training events with provision of hardware and software and registering of those who are trained and tested as competent; make use of successful districts/ municipalities to train and inspire other districts/municipalities at the technical but also managerial and political level.
• Ensuring that contractor records (water point fiche) are provided systematically at district and administrative post level and that each local government has GPS equipment.
• Providing graphic material and wall maps for all institutions that contribute to and make use of the M&E systems and introducing them to the political / decision making level.

22
Figure 11 provides a simplified outline of the evolution of SINAS. The springboard for the new initiative on rural water and sanitation information was the start of joint annual sector reviews. The annual sector reviews demanded ever better information and stimulated donor interest in supporting national information management. To consolidate the momentum, a first joint database meeting, convened by DNA, was held in 2003 (step #1) which can be seen as the start of SINAS. But even so, it took a couple of years until this new interest translated into a GPS mapping exercise that was undertaken in 2005/6 in 5 out of 10 provinces, mainly constrained by where project funds were available (Step #2).
Towards a Comprehensive Water Sector Information System in Mozambique | annex 1: Outline of the evolution of SINaS
annex 1: outline of the evolution of SinaS
During this period WSP and other development partners supported a number of round table processes and studies which culminated in a series of important sector documents (including the RWSS strategy (2006), water policy (2007), WRM strategy, UWSS strategic plan (2007) and the SINAS strategy (2007). These efforts established a strong policy and strategic framework for SINAS, not onlyby advancing rural water supply and sanitation monitoring and evaluation, but also by establishing the basis for later advancement and incorporation of UWSS and WRM.
The strategic plan developed for RWSS in 2006 was followed by negotiations and practical cooperation between DNA and the National Statistical Office (INE) on joint
FIGURE 9: SIMPlIFIED OUTlINE OF THE EVOlUTION OF SINAS
Mee
ting
sR
epo
rtin
gD
ocu
men
tsTr
aini
ngIm
ple
men
t
First RWSS Database meeting
Manica
2003 2006 2007 2009 2010 2011 2012 2013
First UWSS Database meeting
Maputo
Agreement with INE on Indicators
2nd RWSS Database meeting on Indicators
quleimane
First Joint Annual Review(2000+)
First Sector Performance Report
RWSS Strategic Plan
GPS water mapping Gaza*, Manica, Nampula, Sofala, Tete, zambezi 2005-2006
SINAS Pillars
PRONASARdesign
UWSS Strategy Approved
Database training
Training program startedlaunch of Mode 1, 2, 3
INE Census
MIC Survey
SINAS formsModel 1, 2, 3
Urban Models E, D, F
Database launch in 4 Provinces
Baseline PRONASAR Module 0 IDS INE
•WaterPolicy•WRMStrategy•SINASStrategy•UWSSStrategic
Plan
3
1
2 34
5
6
7
WRM and hydraulic works database integrated
2
1
3
2008
Capacity assessment

www.wsp.org 23
Towards a Comprehensive Water Sector Information System in Mozambique | annex 1: Outline of the evolution of SINaS
monitoring. Both INE and DNA benefitted from specialist statistical and other technical support provided by WSP. This allowed the subsequent household surveys (and Multiple Indicator Cluster Surveys (MICS)) conducted by INE to become integrated into SINAS. In this way INE and sector indicators and household questions were aligned and the INE results were reported through SINAS at annual reviews (Step #3).
Comparing the results of indicators gathered using different data sources led to a realisation that there were significant capacity constraints to implementing SINAS. With the support of WSP, SDC and the Netherlands a series of capacity assessments and training programs were launched. (Step #4).
In 2009, a second data base meeting on RWSS was held to learn from the initial implementation and capacity development efforts. This meeting led, with the support of WSP and other development partners, to development of a harmonised set of data collection templates or forms. The forms were designed for an upward cascade of data collection where form 1 focussed at the sub-district level; form 2 at the district and form 3 at the provincial level. Meetings and agreements with the Ministry for State Administration (MAE) helped pave the way for local government taking ownership and control of the data collection and initial processing. (Step #5).
Following this second meeting, a national programme for rural water and sanitation (PRONSAR) was launched,to which SINAS was aligned and brought additional resources for systematic implementation including the introduction of a new form 0 for data collection at the community level by the Chiefs of the Localities (Step #6).
An important milestone was the publication in 2010 of the first full sector performance report. This report
allowed the data and sector results to be openly discussed and contested by stakeholders, a process which has led to healthy scrutiny and encouraged efforts to increase the accuracy of information as well as pinpointing areas where sector performance was lagging. (Step#7).
Since 2010, DNA, WSP and other partners have carried outfurther capacity development and designed and tested national and provincial data bases not only for RWSS but also for UWSS and WRM. Once the data bases were up and running, intensive training was given to ensure that current data collection as well as historical records were entered and subject to quality control.
The urban water supply and sanitation and water resources sub-sectors followed a shorter path. The first step was the approval in 2011of a UWSS strategy that had taken 5 years to develop (Step #1).Following this first sector-wide meeting, a first urban database and information system meeting was held in 2012, which drew on learning from the RWSS processes, including the need to involve at an early stage all the relevant organisations that would be expected to collect data and make use of the information. The main output was an agreement with INE and relevant sector institutions on the definition of indicators (Step #2). In 2013, encouraged by the progress in UWSS, a set of indicators for water resources development and management was added to SINAS and the national database (Step #3).
These sub-sector component systems were then brought together in a unified database in 2013 for all subsectors (rural, urban and water resources). WSP provided support to DNA to develop training manuals for the database to support future training and help ensure future institutional sustainability and create the basis for good governance and improving levels of productivity.
24
references
DNA, Outubro 2007, Estrategia de Implementação do Sistema de Informação Nacional de Água E Saneamento, (pp 44)
DNA, 2008 Resumo Nacional Sobre a Situação do Sistema de Informação de Água E Saneamento nos Distritos (19pp) and Análise dos Inquéritos, (10pp) Annex II of the Resumo Nacional
DNA, Junho 2009, Proposta de Indicadores do Sector de Águas – Power Point Presentation, (18pp)
SINAS, Junho 2009, Abordagem em Pilares, (7pp)DNA, Março, 2011, Relatório Anual de Avaliação do
Desempenho do Sector de Águas , 2010/11, (52pp)WSP 2011. AMCOW country status overview (36pp)DNA, Abril 2012, Relatório Anual de Avaliação do
Desempenho do Sector de Águas 2011 (49pp)Chavana, D., L., April 2012, Assistência técnica no âmbito
do melhoramento do sistema de informação nacional de água e saneamento (17pp)
DNA Novembro 2012, iª Reunião nacional sobre a base de dados do abastecimento de água e saneamento urbano (15pp)
DNA, Março, 2013, Relatório Anual de Avaliação do Desempenho do Sector de Águas 2012 (46pp)
SINAS, Novembro 2013, Modelo A – SDPI E Municipios, Relatório de Actividades do Abastecimento de Agua E Saneamento Urbano, (15pp)
SINAS, Dezembro 2013, Modelo D – FIPAG, Relatório de Actividades do Fundo de Invetsimento E Património de Águas (15pp)
SINAS, Dezembro 2013, Modelo E – AIAS, Relatório de Actividades da Adminsitração de Infraestruturas de Água E Saneament, (15pp)
DNA, Agosto 2013, Relatório de Supervisão do Processo de Implementação na Província de Gaza, Manica, Niassa, Nampula (8pp each)
DNA, August 2013, Mozambique: Water Supply and Sanitation Data Collection, presentation to SADC Arusha, Tanzania, (20pp)
DNA, Novembro 2013, Capacitação dos directores, técnicos de planificação e infra-estruturas dos sdpi e técnicos do das em matéria de segurança de dados, base de dados, monitoria, avaliação e plano operacional (14pp)
DNA, August 2013, Mozambique: Water Supply and Sanitation Data Collection, presentation to SADC Arusha, Tanzania, (20pp)
DNA, November 2013, Capacitação dos directores, técnicos de planificação e infra-estruturas dos sdpi, e técnicos do das em materia de seguraça de dados, base de dados, monitoria, avaliaçao e plano operacional (14pp)
Towards a Comprehensive Water Sector Information System in Mozambique | References

www.wsp.org 25

May 2015
Water and Sanitation Program
The World BankMozambiqueOfficeAvenida Kenneth Kaunda Nr 1224, Maputo
Tel:+25821482300Fax:+25821482384E-mail: [email protected] sites: www.worldbank.org/waterwww.wsp.org
design and Layout by Eric Lugaka


