Institutions for Regional Integration: Toward an Asian Economic Community

Toward a Community-Based Rural Policy: Implications
for Community DevelopmentPresented to the2003 Midstates
Community Development ConferenceSouth Sioux City, Nebraska
March 25, 2003
Charles W. Fluharty, DirectorRural Policy Research Institute
http://www.rupri.org
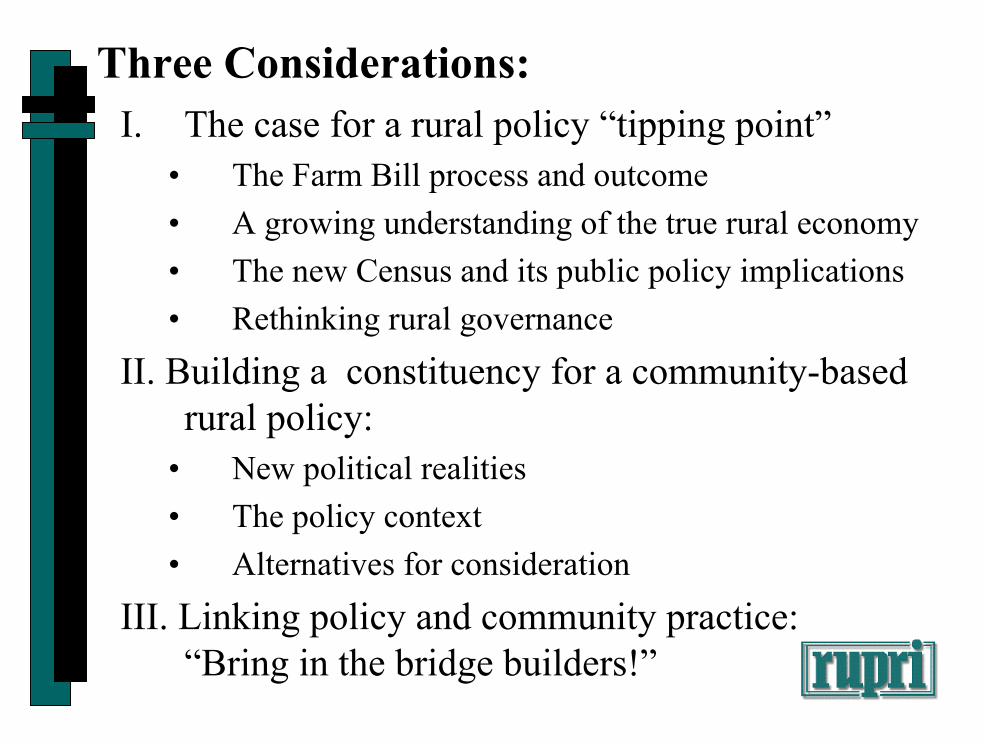
Three Considerations:I. The case for a rural policy “tipping point”
• The Farm Bill process and outcome• A growing understanding of the true rural economy• The new Census and its public policy implications• Rethinking rural governance
II. Building a constituency for a community-based rural policy:
• New political realities• The policy context• Alternatives for consideration
III. Linking policy and community practice:“Bring in the bridge builders!”
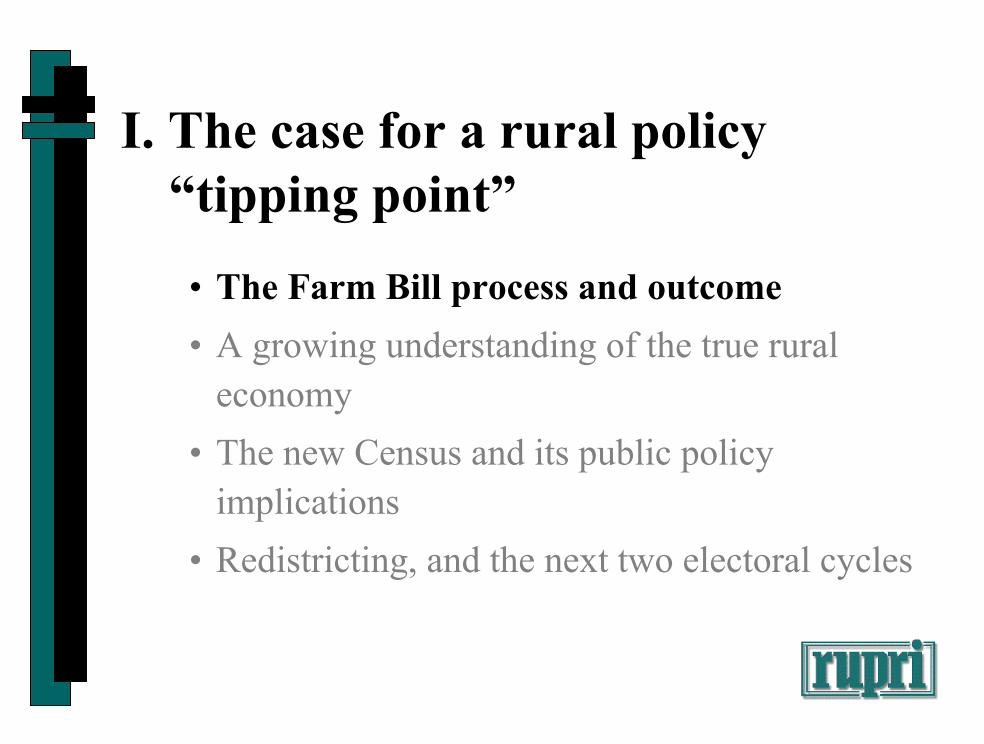
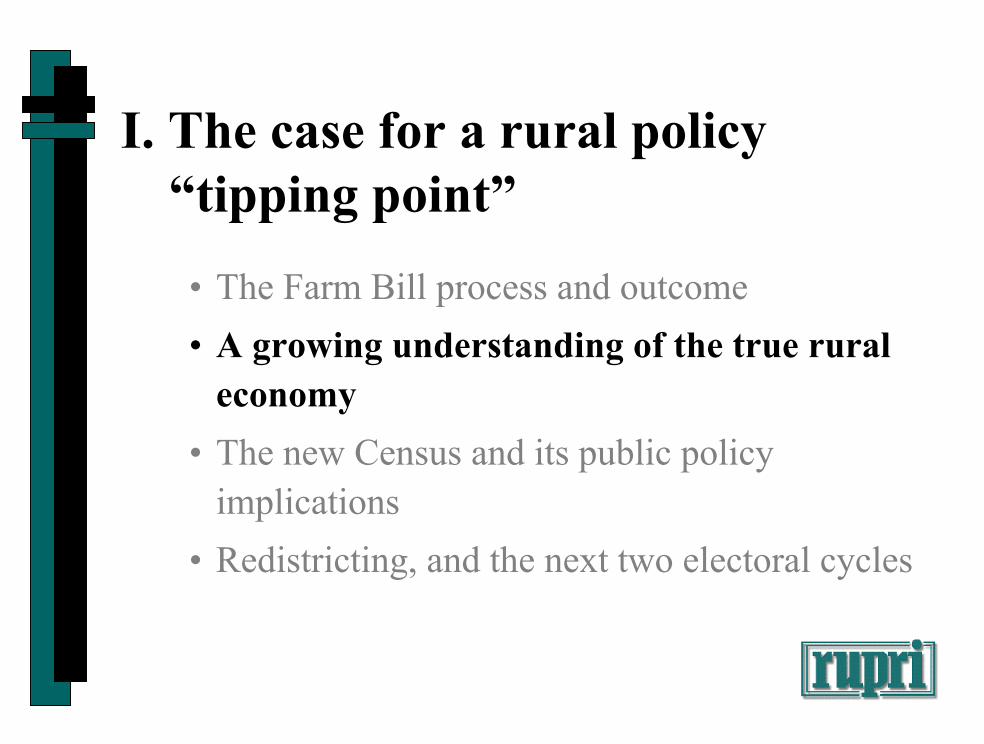
I. The case for a rural policy “tipping point”
• The Farm Bill process and outcome• A growing understanding of the true rural
economy• The new Census and its public policy
implications• Redistricting, and the next two electoral cycles

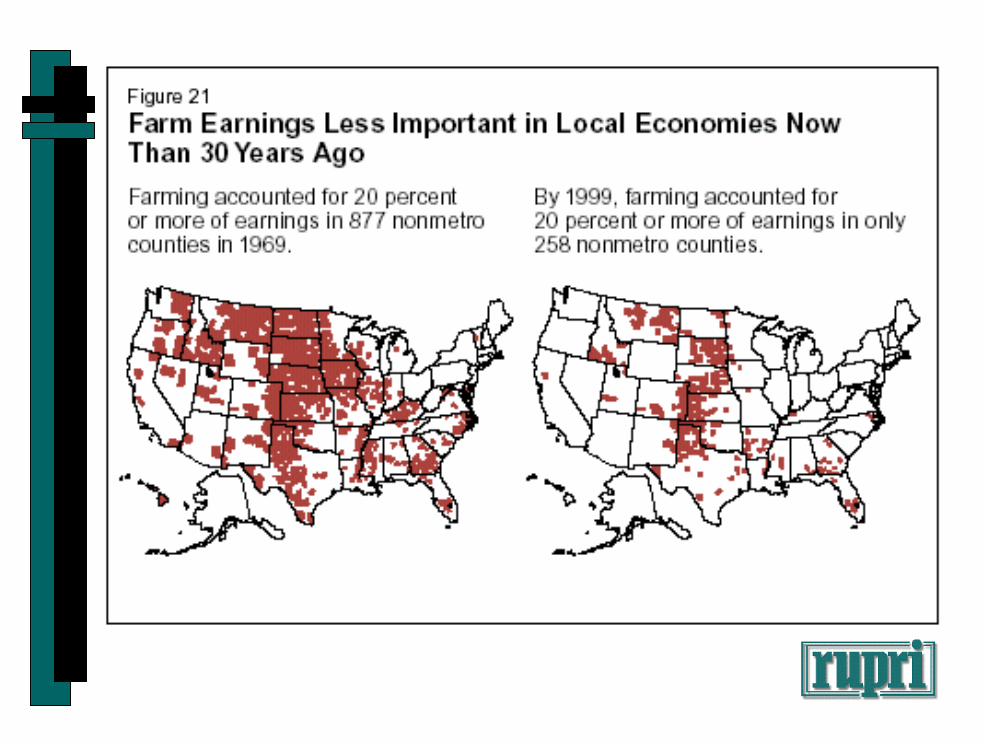
“Rural” is much more than agriculture; and the future success of our nation’s family farms is critically linked to the economies of rural communities.
• Only 6.3% of rural Americans live on farms.• Farming accounts for only 7.6% of rural
employment. • 90% of rural workers have non-farm jobs.• In 1999, 90% of all farm operator’s household
income came from off-farm sources.

• Only 0.39% of the US population is engaged in farming as a primary occupation; and
• Only 1.78% of the US rural population is engaged in farming as a primary occupation.
But . . . • In ag dependent counties, or rural areas where
agriculture is the dominant sector, as in most of the Great Plains, we are literally in “crisis”!

17.7%11.6%$23,371$35,572$201,20658,403Very Large Family Farms
40.4%28.0%$24,011$34,598$85,68577,314Large Family Farms
49.9%36.0%$19,194$26,621$53,322175,370Farming-occupation high sales
100.3%56.3%$22,379$39,892$39,764480,441Farming-occupation low sales
104.8%95.5%$79,982$87,796$83,788931,561Residential / lifestyle
103.3%27.7%$11,254$41,991$40,643297,566Retirement
137.5%61.5%$5,862$13,114$9,534126,920Limited Resource
Small Family Farms
Percent of HH
income from
total off-farm
sources
Percent of HH
income from
earnedoff-farm sources
Avg. earnedoff-farm income
Avg. Off-
Farm Income
Avg. HH Income
Number of House-
holdsERS Farm Typology
Source: ERS, February 2001
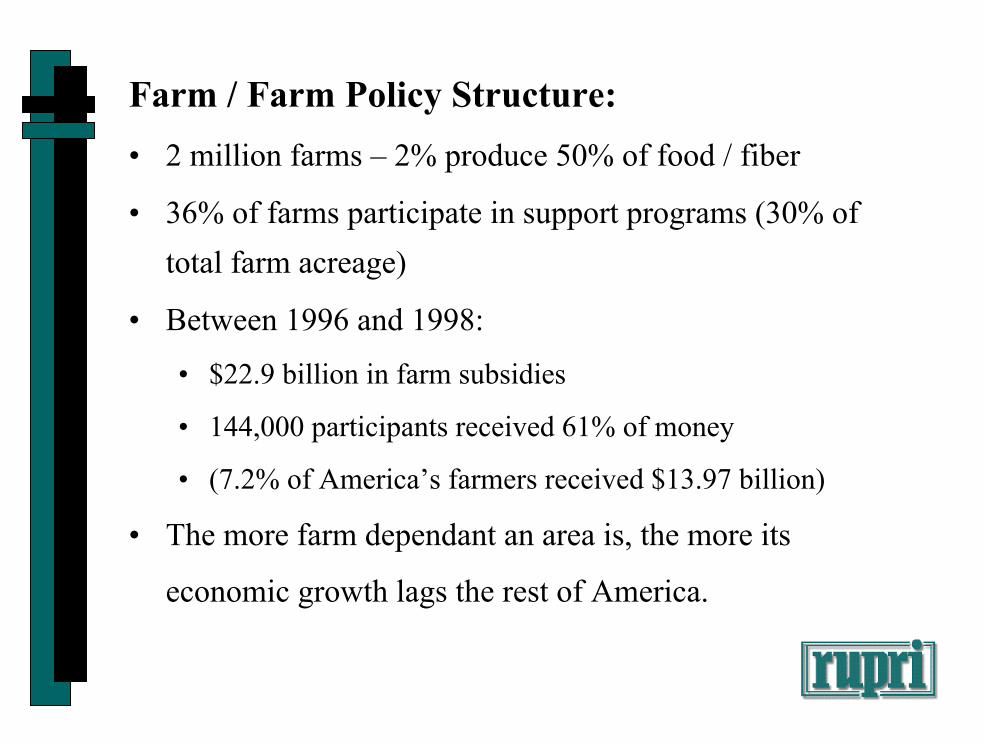
Farm / Farm Policy Structure:• 2 million farms – 2% produce 50% of food / fiber
• 36% of farms participate in support programs (30% of total farm acreage)
• Between 1996 and 1998:
• $22.9 billion in farm subsidies
• 144,000 participants received 61% of money
• (7.2% of America’s farmers received $13.97 billion)
• The more farm dependant an area is, the more its
economic growth lags the rest of America.
I. The case for a rural policy “tipping point”
• The Farm Bill process and outcome• A growing understanding of the true rural
economy• The new Census and its public policy
implications• Redistricting, and the next two electoral cycles
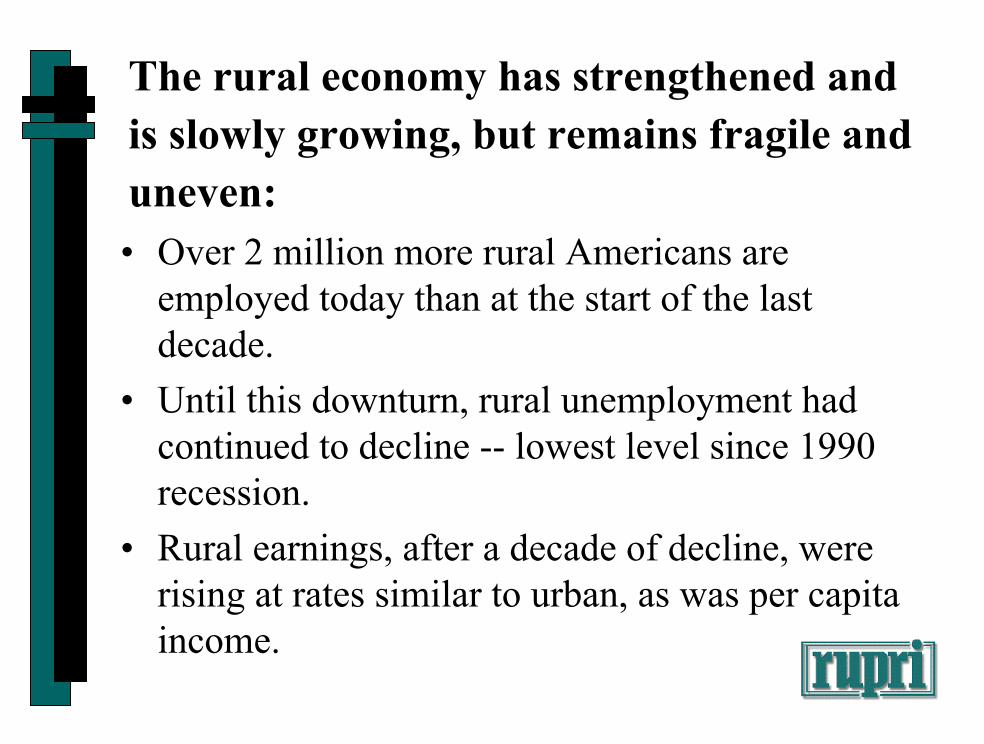
The rural economy has strengthened and is slowly growing, but remains fragile and uneven:• Over 2 million more rural Americans are
employed today than at the start of the last decade.
• Until this downturn, rural unemployment had continued to decline -- lowest level since 1990 recession.
• Rural earnings, after a decade of decline, were rising at rates similar to urban, as was per capita income.
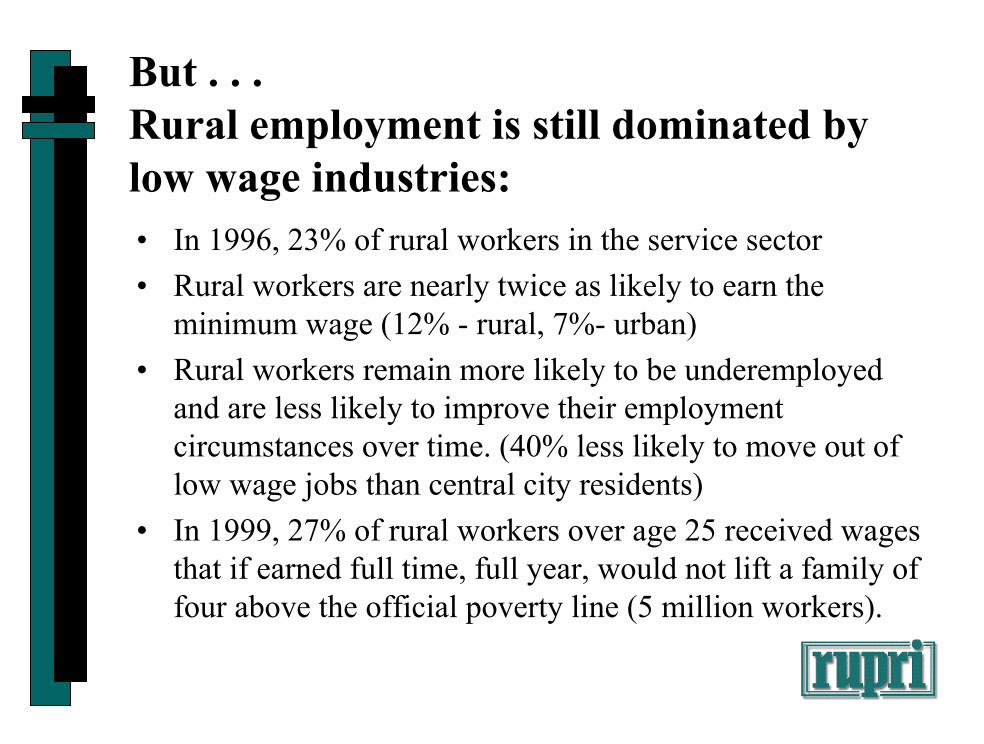
• In 1996, 23% of rural workers in the service sector• Rural workers are nearly twice as likely to earn the
minimum wage (12% - rural, 7%- urban)• Rural workers remain more likely to be underemployed
and are less likely to improve their employment circumstances over time. (40% less likely to move out of low wage jobs than central city residents)
• In 1999, 27% of rural workers over age 25 received wages that if earned full time, full year, would not lift a family of four above the official poverty line (5 million workers).
But . . .Rural employment is still dominated by low wage industries:

Distribution of Nonmetro Employment, 1969
Construction5%
Manufacturing21%
TCPU4%
Trade17%
FIRE4%
Services15%
Extractive17%Government
17%

Distribution of Nonmetro Employment, 1979
Construction5%
Manufacturing20%
TCPU4%Trade
18%
FIRE5%
Services17%
Extractive15%Government
16%

Distribution of Nonmetro Employment, 1989
Construction5%
Manufacturing18%
TCPU4%
Trade19%
FIRE5%
Services20%
Extractive12%Government
17%

Distribution of Nonmetro Employment, 1999
Manufacturing15%
TCPU4%
Trade20%
FIRE5%
Services24%
Construction6%
Extractive10%Government
16%

The Changing U.S. Economy:Percent Employment in Goods and Services Industries, 1951-2001
0.0%
10.0%
20.0%
30.0%
40.0%
50.0%
60.0%
70.0%
80.0%
90.0%
1951
1953
1955
1957
1959
1961
1963
1965
1967
1969
1971
1973
1975
1977
1979
1981
1983
1985
1987
1989
1991
1993
1995
1997
1999
2001
Percent in Goods Producing
Percent in Services Producing
Source: RUPRI Analysis of BLS Data

From: Creating Vibrant Communities & Economies in Rural America, Lionel J. Beaulieu, Southern Rural Development Center

Between 1990-1996 there was a gain of 2,756,000 jobs in rural America – an increase of 11.3%.
However, between 1990-1996 there was only anegligible change in non-metropolitan job earnings – remaining more or less around $22,493 per year per job. (1996)
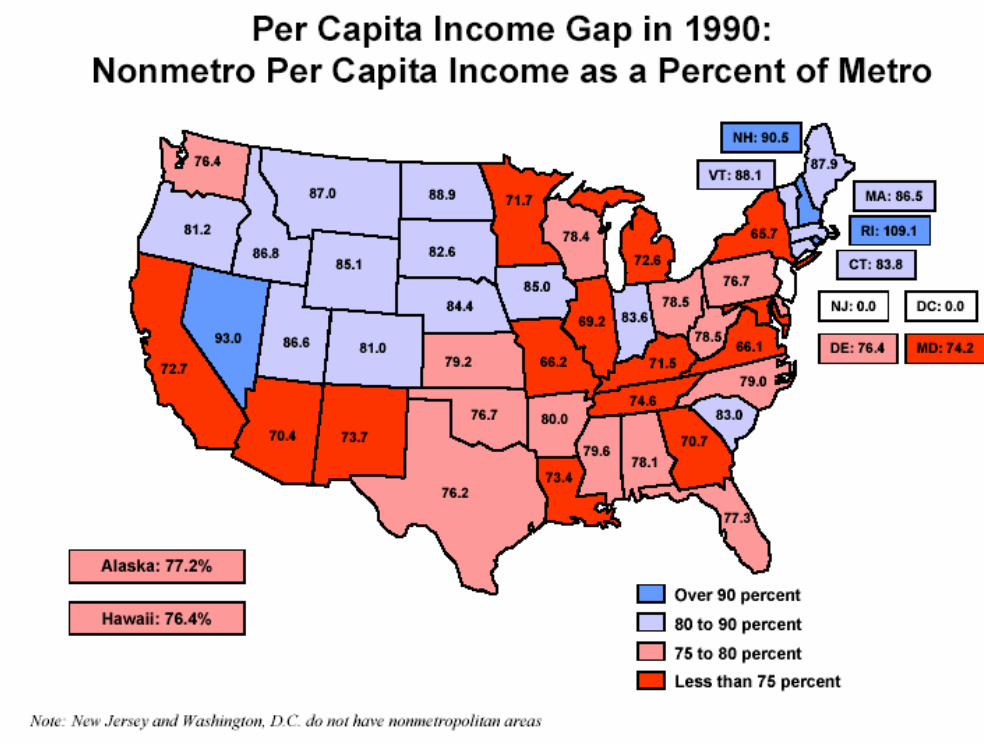
In fact, the rural/urban earnings gap persisted and widened in the 1990s (from 73.8 to 70 percent).
Now, this downturn . . . !

Therefore:
• Rural incomes remain lower than urban (1997 median: $30K+ - Rural, 39K+ - Urban)
• Rural poor families are more likely to be employed and still poor. (In 1998, 2/3 of poor families had at least one member working at some time during the year; 16% had two or more members working; 29% had one or more full time, full year workers -- a 9% rise since 1996).

Per Capita Income in the U.S. andin Metro and Nonmetro Areas
(all figures adjusted to 2000 dollars)
-
5,000
10,000
15,000
20,000
25,000
30,000
35,000
1969
1971
1973
1975
1977
1979
1981
1983
1985
1987
1989
1991
1993
1995
1997
1999
U.S.
Metro
Nonmetro

Farm Income as a Percent of Total Incomein Nonmetro Areas
0.0%
2.0%
4.0%
6.0%
8.0%
10.0%
12.0%
14.0%
1969
1971
1973
1975
1977
1979
1981
1983
1985
1987
1989
1991
1993
1995
1997
1999

Per Capita Income Gap in the U.S.Nonmetro Income as aPercent of Metro Income
64.0%
66.0%
68.0%
70.0%
72.0%
74.0%
76.0%
78.0%
80.0%
1969
1971
1973
1975
1977
1979
1981
1983
1985
1987
1989
1991
1993
1995
1997
1999
Source: RUPRI Analysis of BEA Data


From: Creating Vibrant Communities & Economies in Rural America, Lionel J. Beaulieu, Southern Rural Development Center
I. The case for a rural policy “tipping point”
• The Farm Bill process and outcome• A growing understanding of the true rural
economy• The new Census and its public policy
implications• Rethinking rural governance
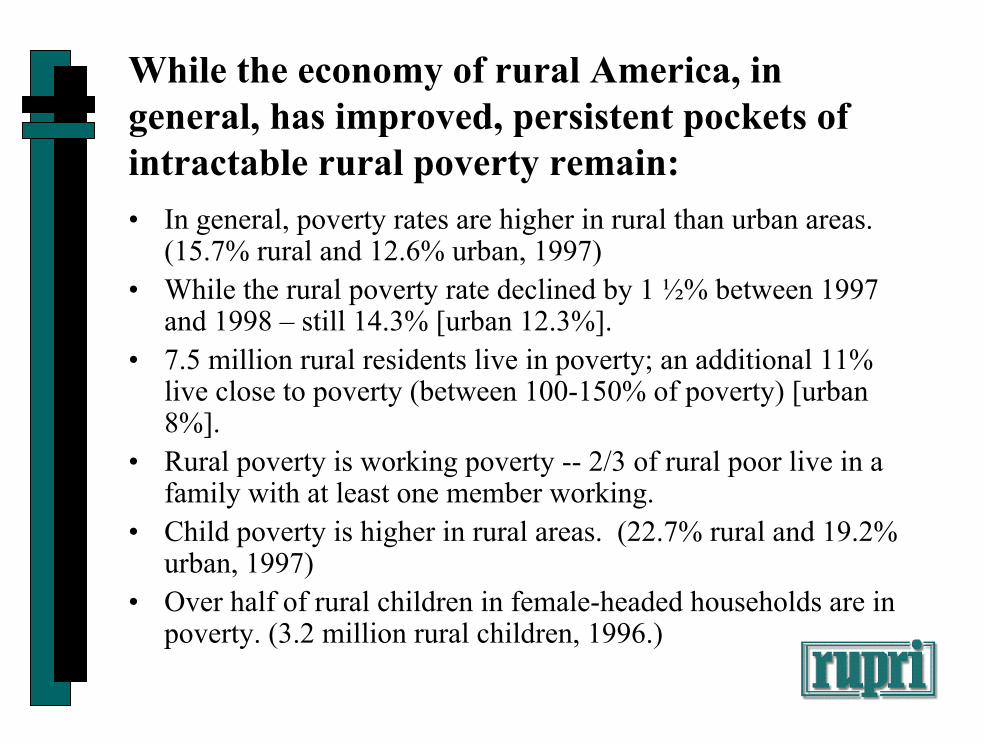
While the economy of rural America, in general, has improved, persistent pockets of intractable rural poverty remain:• In general, poverty rates are higher in rural than urban areas.
(15.7% rural and 12.6% urban, 1997)• While the rural poverty rate declined by 1 ½% between 1997
and 1998 – still 14.3% [urban 12.3%]. • 7.5 million rural residents live in poverty; an additional 11%
live close to poverty (between 100-150% of poverty) [urban 8%].
• Rural poverty is working poverty -- 2/3 of rural poor live in a family with at least one member working.
• Child poverty is higher in rural areas. (22.7% rural and 19.2% urban, 1997)
• Over half of rural children in female-headed households are in poverty. (3.2 million rural children, 1996.)

Persistent Poverty as of 1999Poverty Rates of 20% or Higher in 1959, 1969, 1979, 1989 and 1999
Metro (19)Nonmetro Adjacent (134)Nonmetro Nonadjacent (229)
Source: U.S. Census Bureau andEconomic Research Service, USDAMap Prepared by RUPRI
The Census population shifts were very significant:• The 1990’s saw a rural population rebound; which totally
reversed the outmigration of the 1980’s.• 70% of rural counties grew in population from 1990 to
1999.• But, this growth is largely concentrated in only 40% of
rural counties. • 7/8 of these growing counties derived some or all of their
increase from in-migration of metro residents.• 61% of rural counties experienced net in-migration between
1990 and 1999.• In fact, between 1990 and 1999, 2.2 million more
Americans moved from the city to the country, than the reverse.

• However, rural population increases have steadily dropped since momentarily exceeding urban levels in 1994-95.
• And, all rural counties have turned downward in growth rate since 1995, except commuter counties:– Mining and farming dependent counties had the greatest relative fall-off in
pace of growth.
• In 1998-99, the rural population growth rate was less than half of urban.
• And, the number of rural counties with decreasing population rose from 600 in 1990-95 to 855 in 1995-99.
• Significant rural population declines continue in the Great Plains, and other “disadvantaged” rural areas.
• And, numerous growth counties are experiencing expanding diversity in ethnic / racial composition, with attendant challenges.
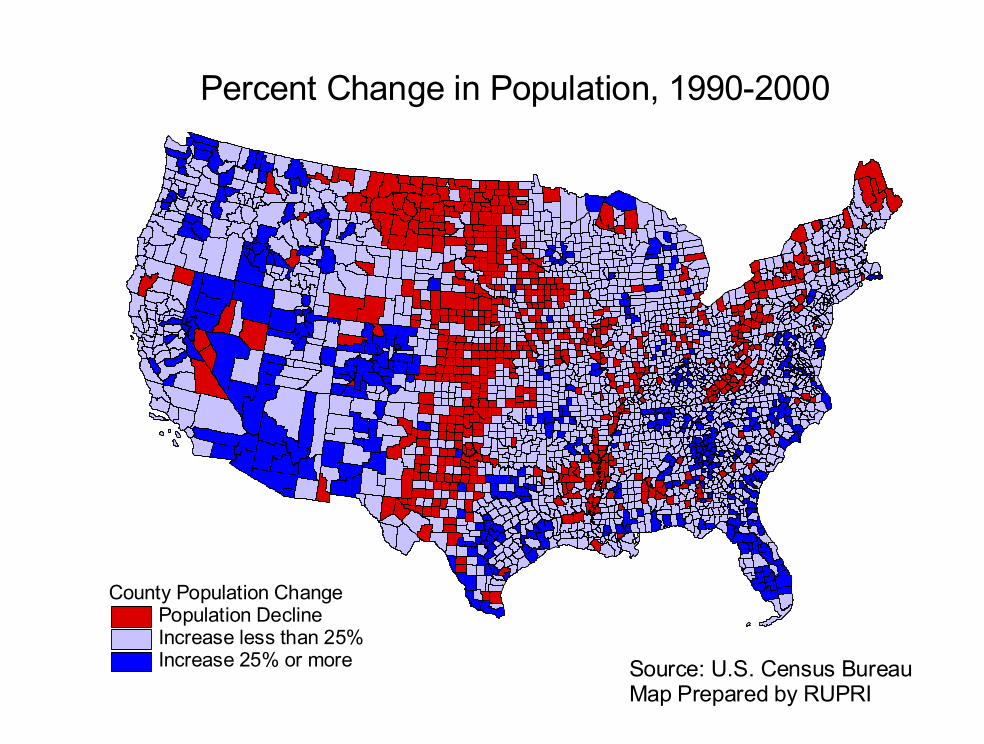
Percent Change in Population, 1990-2000
County Population ChangePopulation DeclineIncrease less than 25%Increase 25% or more Source: U.S. Census Bureau
Map Prepared by RUPRI
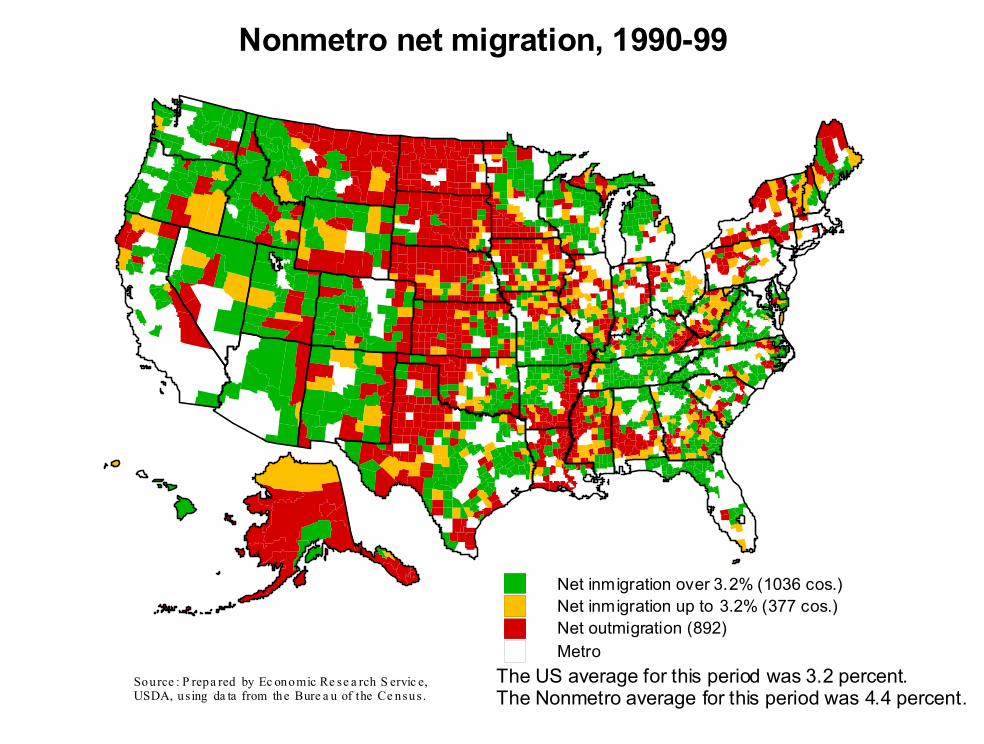
Net inmigration over 3.2% (1036 cos.) Net inmigration up to 3.2% (377 cos.) Net outmigration (892) Metro
Nonmetro net migration, 1990-99
Source : P repa red by Ec onomic Re se a rch S ervic e, USDA, using da ta from the Bure a u of the Ce nsus.
The US average for this period was 3.2 percent.The Nonmetro average for this period was 4.4 percent.
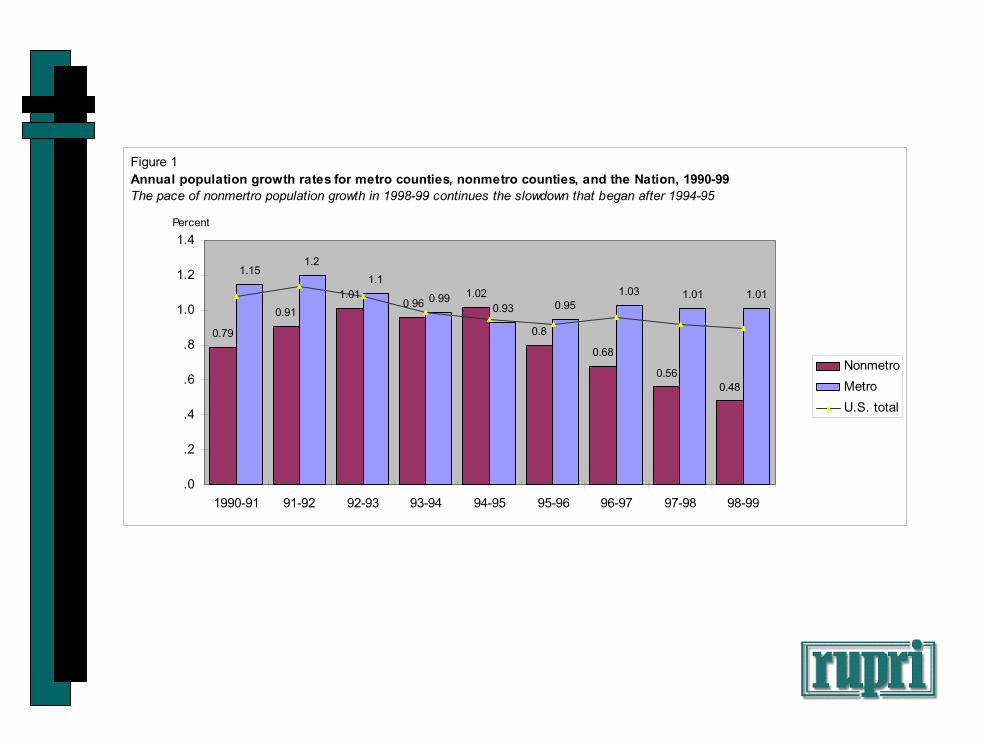
Figure 1Annual population growth rates for metro counties, nonmetro counties, and the Nation, 1990-99The pace of nonmertro population growth in 1998-99 continues the slowdown that began after 1994-95
0.79
0.911.01
0.961.02
0.8
0.68
0.560.48
1.151.2
1.1
0.990.93 0.95
1.03 1.01 1.01
.0
.2
.4
.6
.8
1.0
1.2
1.4
1990-91 91-92 92-93 93-94 94-95 95-96 96-97 97-98 98-99
Percent
NonmetroMetroU.S. total

Total Population, 1990 and 2000
-
20,000,000
40,000,000
60,000,000
80,000,000
100,000,000
120,000,000
140,000,000
160,000,000
Metroinside central cities
Metrooutside central cities
Nonmetro
1990
2000
Source: U.S. Census Bureau
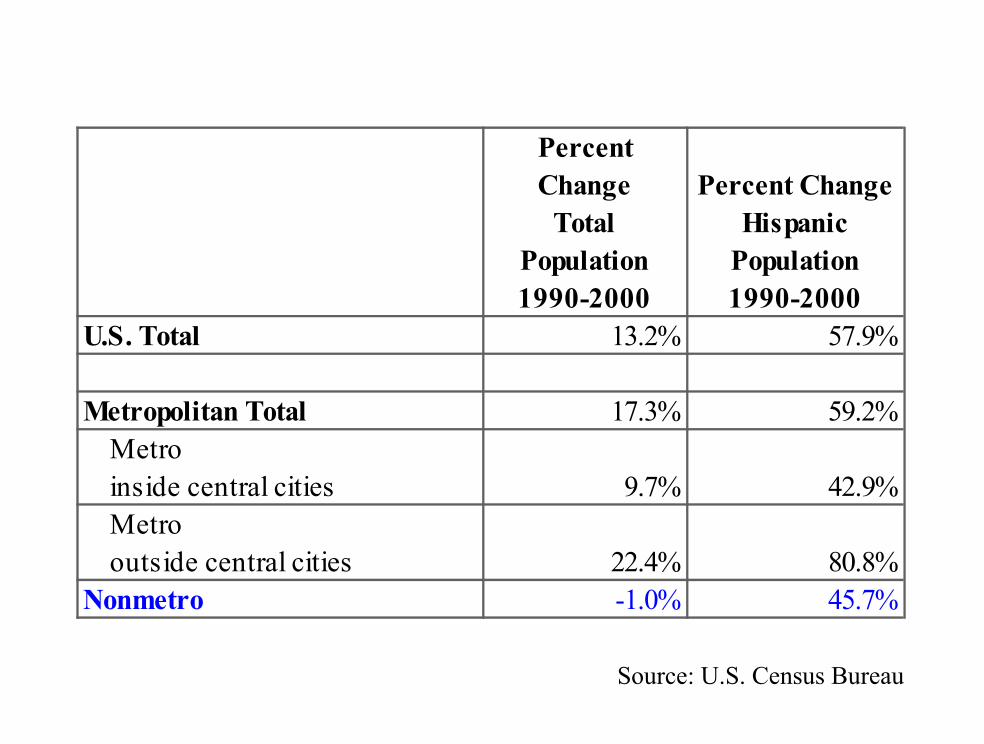
Percent Change
Total Population1990-2000
Percent Change Hispanic
Population1990-2000
U.S. Total 13.2% 57.9%
Metropolitan Total 17.3% 59.2%Metroinside central cities 9.7% 42.9%Metrooutside central cities 22.4% 80.8%
Nonmetro -1.0% 45.7%
Source: U.S. Census Bureau
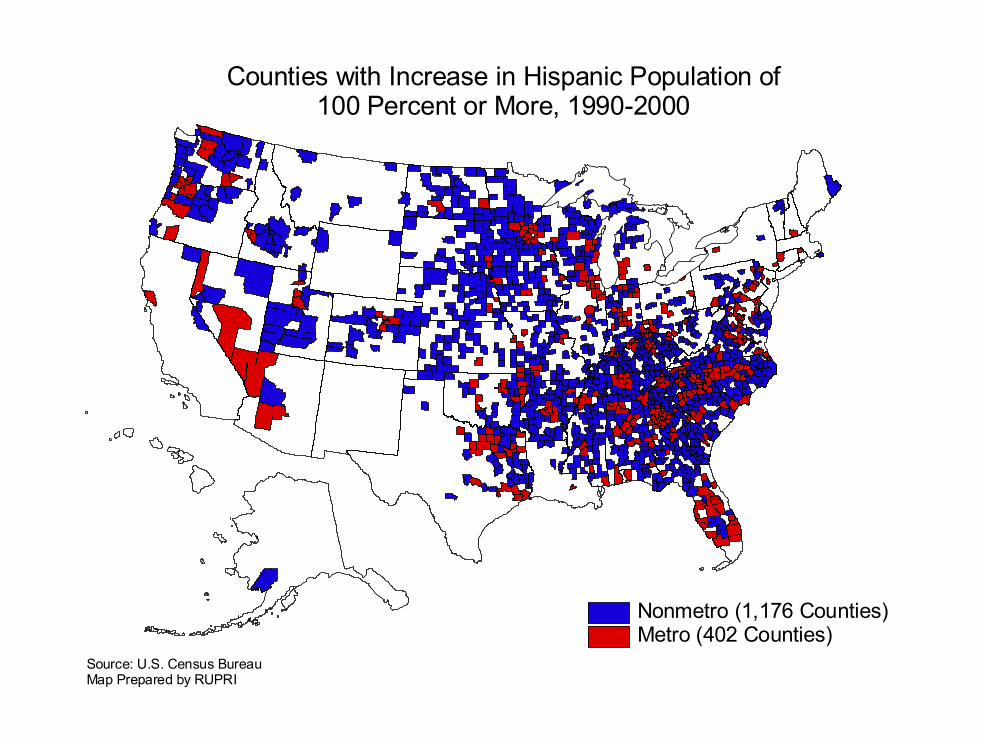
Counties with Increase in Hispanic Population of100 Percent or More, 1990-2000
Source: U.S. Census BureauMap Prepared by RUPRI
Nonmetro (1,176 Counties)Metro (402 Counties)
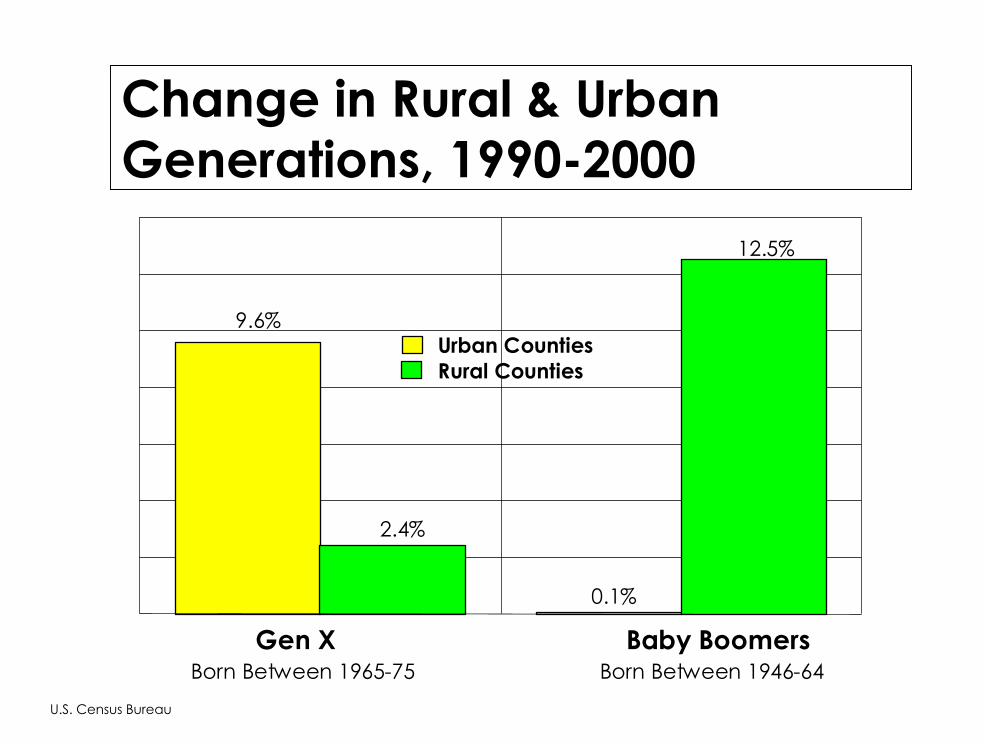
Change in Rural & Urban Generations, 1990-2000
Gen X Baby Boomers
9.6%
0.1%
2.4%
12.5%
Urban Counties
Rural Counties
Born Between 1965-75 Born Between 1946-64U.S. Census Bureau

Human and Social Capital Considerations:
• Education:– Recent rural high school graduation rates match or exceed urban rates.– Rural dropout rates have fallen sharply in recent years,
• But --– Rural out-migration remains largely our youngest and most highly
educated:“Rural America’s most important export remains our best and our brightest.”
– So, fewer young adults in rural areas seek post secondary education; have college degrees; and more have no high school diplomas (23.5% rural and 17.4% urban, 1997).
• Yet, --– Rural schools represented 22% of all public schools in 1997, but:
• Only received 12.5% of federal funding• 14% of all state funding• 11% of all local funding
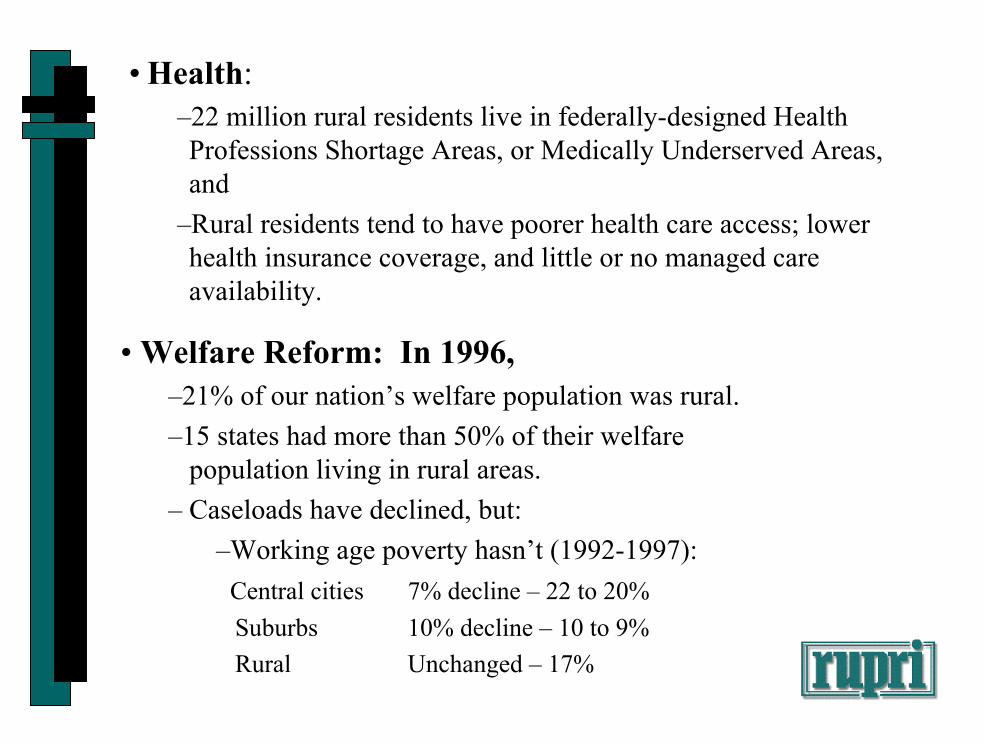
• Health:–22 million rural residents live in federally-designed Health Professions Shortage Areas, or Medically Underserved Areas, and
–Rural residents tend to have poorer health care access; lower health insurance coverage, and little or no managed care availability.
• Welfare Reform: In 1996, –21% of our nation’s welfare population was rural.–15 states had more than 50% of their welfare
population living in rural areas.– Caseloads have declined, but:
–Working age poverty hasn’t (1992-1997):Central cities 7% decline – 22 to 20%Suburbs 10% decline – 10 to 9%Rural Unchanged – 17%
I. The case for a rural policy “tipping point”
• The Farm Bill process and outcome• A growing understanding of the true rural
economy• The new Census and its public policy
implications• Rethinking rural governance
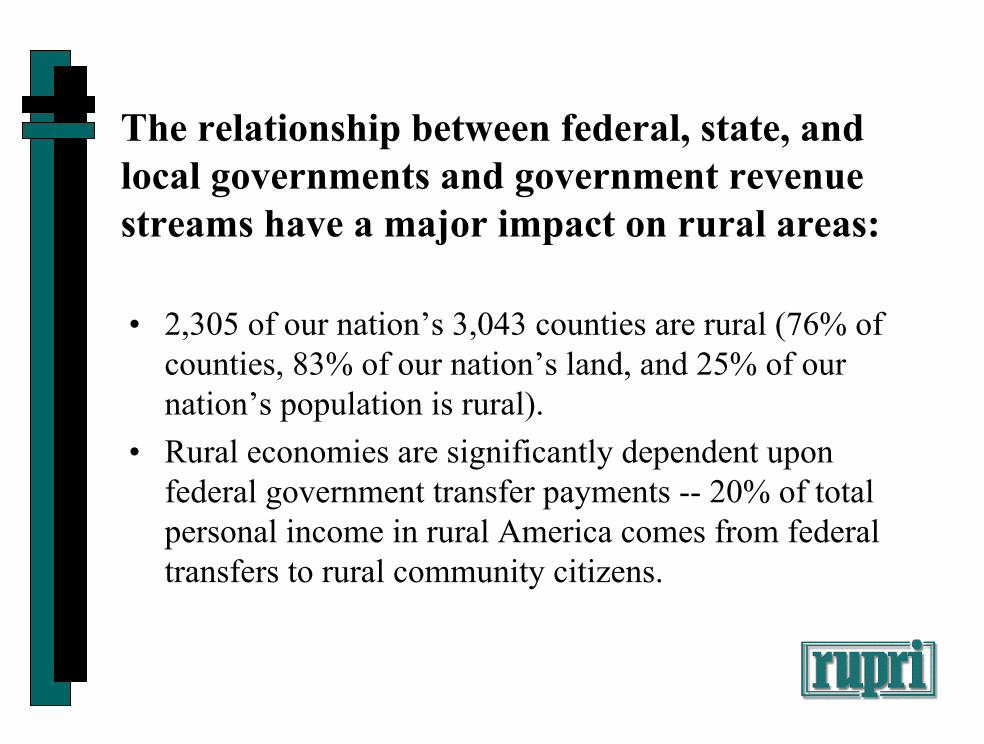
The relationship between federal, state, and local governments and government revenue streams have a major impact on rural areas:
• 2,305 of our nation’s 3,043 counties are rural (76% of counties, 83% of our nation’s land, and 25% of our nation’s population is rural).
• Rural economies are significantly dependent upon federal government transfer payments -- 20% of total personal income in rural America comes from federal transfers to rural community citizens.
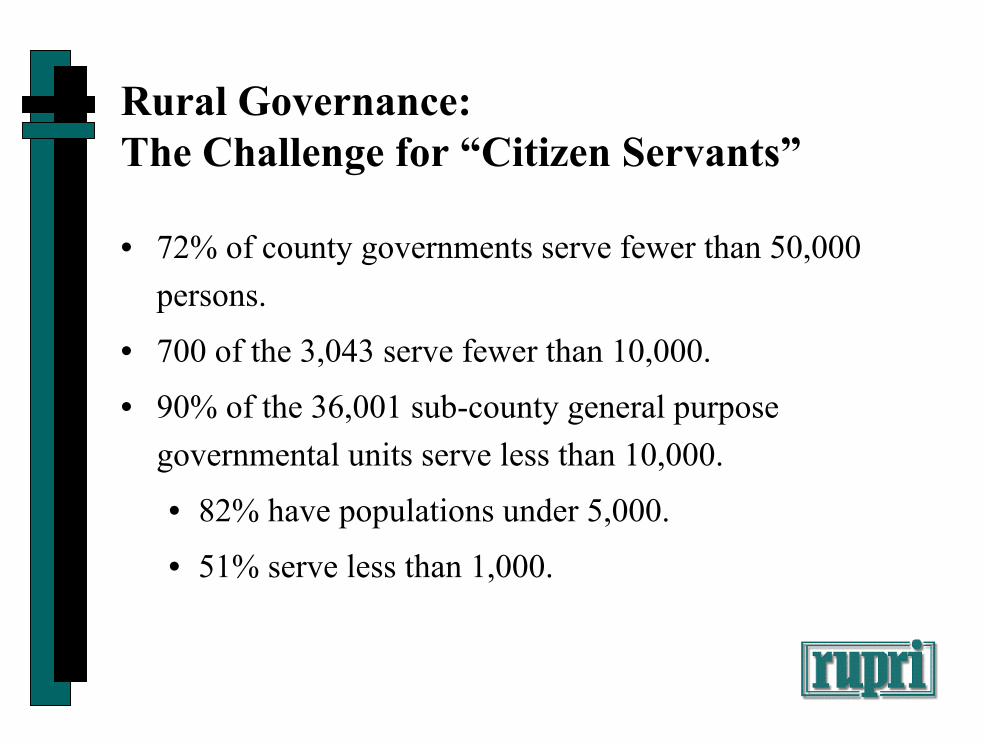
Rural Governance: The Challenge for “Citizen Servants”
• 72% of county governments serve fewer than 50,000 persons.
• 700 of the 3,043 serve fewer than 10,000.
• 90% of the 36,001 sub-county general purpose governmental units serve less than 10,000.
• 82% have populations under 5,000.
• 51% serve less than 1,000.

II. Building a constituency for a community based rural policy:
• New political realities• The policy context• Alternatives for consideration

The New Political Realities• Suburbanization of the American public policy arena
– 1990 Census– 1992 Presidential Election– The 25/25/50 rule– 2000 Census – The Congressional reality
• Devolution: “To” the states, or “through” the states?– Current downturn has changed much, but . . . – 31 states have cut taxes since 1996– Since 1990, state and local government expenditures up 15%,
in real terms– Nearly $50 billion in current state budget deficits– Federal workforce reduced by 345,000 since 1990– State and local government workforce expanded by nearly 2
million in same period
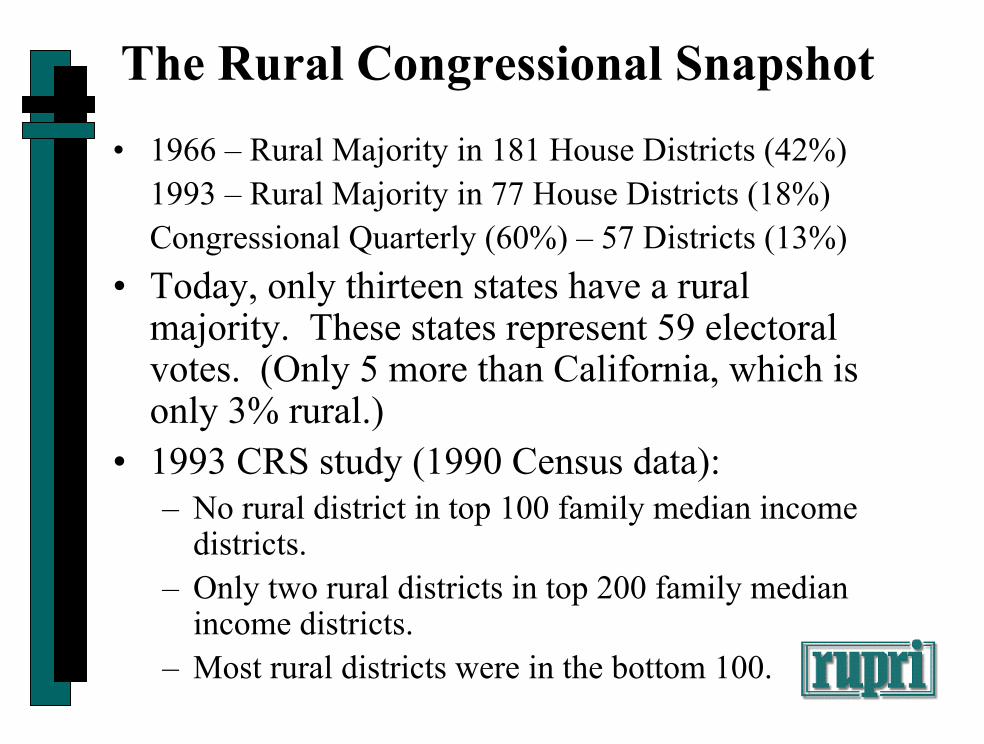
The Rural Congressional Snapshot• 1966 – Rural Majority in 181 House Districts (42%)
1993 – Rural Majority in 77 House Districts (18%)Congressional Quarterly (60%) – 57 Districts (13%)
• Today, only thirteen states have a rural majority. These states represent 59 electoral votes. (Only 5 more than California, which is only 3% rural.)
• 1993 CRS study (1990 Census data):– No rural district in top 100 family median income
districts.– Only two rural districts in top 200 family median
income districts.– Most rural districts were in the bottom 100.

The Challenge of a National Rural Policy:
• Believable problem articulation
• National voice
• Coalition consensus
• Sustained, integrative implementation strategy
• Visionary leadership - AARP!

Why a National Rural Policy is So Difficult to Achieve• “Rural” remains synonymous with “agriculture”• A constituency has not been organized
– Many sector-level constituencies• Congressional and Administration programs
remain fragmented.– No one Congressional Committee or Administrative
Department with overall responsibility for rural policy and rural program integration

The “Policy” Component of Rural Policy• What?
– Integrative national rural policy• Global examples
– National sector-level rural policy• Department initiatives• Congressional initiatives
– Integrative state rural policy• Governor’s initiatives• Legislative initiatives• Public / private sector initiatives

The “Policy” Component of Rural Policy
• Who?– Potential “change agents” for a “new rural policy?”
• President• Congress• Colleges / Universities• Governors• State Legislatures• Philanthropic community• Private sector
– Building a constituency for action
Hopeful Developments of Possible Consequence:– Congressional Rural Caucus – Presidential Letter– National Rural Network:
• New rural mission areas in many NGOs
– Farm Bill Rural Development Title– HHS Secretary’s Rural Initiative– State-level policy efforts– Emergent, new rural leadership:
• Expanding leadership role for women
– Kansas City Fed – Center for the Study of Rural America– Expanding philanthropic interest in rural portfolio– Rural “new governance”: public / private / philanthropic
collaborations– State Rural Development Councils

III. Linking policy and community practice: “Bring in the bridge builders!”

Building a new “rural pragmatism”
or . . . .
“So, if we all care so muchabout rural America,
Why is she in such bad shape?”

“Would you tell me please, which way I ought to go from here?” said Alice.
“That depends a good deal on where you want to get,” said the cat.
“I don’t much care where,” said Alice.“Then it doesn’t matter much which way you
go,” said the cat.- Lewis Carroll
Alice in Wonderland
Community Policy and Constituency Convergence:
Toward a Place-Based Policy:“Why Cities Matter . . .”
The Brookings Institution
Community ConnectionsDoug Nelson, PresidentThe Annie E. Casey Foundation

“No snowflake in an avalancheever feels responsible!”
- Stanislaus Lezcynski

“The poet is the joiner, he sees how they join.”
- Walt Whitman, 1855

The OECD Framework:
• Sector to Place• Subsidy to Regional Competitiveness• A Governance Structure to Accomplish
Both

Challenges Facing All RuralRegions Today• Technological Change• Globalization• Localization• New Governance• Changing Industrial Structure & Employment• Changing Demographics• Changing Lifestyles and Settlement Patterns• Changing Political Economy

The New Institutional Framework for Rural Regional Advancement
• Regional Collaborations• Jurisdictional Realignments• A Cross-Sectoral Framework• Optimizing the “Public / Private” Moment• An Entrepreneurial Awakening• The Critical Role of Intermediaries • Finding New Institutional Actors!

Building Rural Public and Private Entrepreneurship

State Rural Policy Challenges:• Acknowledging the Diversity of “Rurals”• Addressing the “Two Economies” of
Most States • Addressing the “Out State” Challenge in a
Suburban-Based Legislature

• Rethinking the Ag / Natural Resources Role in Rural Development:– Is it Production, Processing, or Retail?
– Are Local Food Systems Possible? • Rural residents qua rural resource consumers
– Are There Local Natural Resource and Service Industry Possibilities?

• Linking Ag and Natural Resources to These Regional Rural Strategies:– “Necessary, but not sufficient” model– Building community-based constituencies
for “change support” and neutralizing the resistance of old turf tendencies.

State Policy Recommendations• Rural Development Must Become a Major
State Policy Goal– Associated with ag / natural resources policy, but
not secondary to them• State Rural Development Policy Must Be
Focused:– Cross-sectoral– Cross-departmental– Cross-jurisdictional– Regionally Targeted

• State Rural Development Policy Must Have the Resources to Make a Difference:– Planning– Coordination– Policy development and implementation– Program design– Evaluation

• Policy Champions and Integrative Policy Intermediaries Must Be Found and Linked Strategically

What Can Communities Do:• Facilitate / Support These Emergent
Models• Foster the New Economic Engines• Become Change Agents• Support Entrepreneurs (Public and
Private!)

Redefining the Public Metaphor and Rhetoric for Rural America

“The question is not what you look at, but what you see.”
-Henry David Thoreau