Tourism Survey-Final Report. - MCA-Vanuatu CONTENTS/MCA Environment...MCA Vanuatu – Tourism Survey...
113
MCA VANUATU TOURISM SURVEY BASELINE STUDY FINAL REPORT Prepared by: TRIP Consultants June 2008
Transcript of Tourism Survey-Final Report. - MCA-Vanuatu CONTENTS/MCA Environment...MCA Vanuatu – Tourism Survey...

MCA VANUATU
TOURISM SURVEY
BASELINE STUDY
F I N A L R E P O R T
Prepared by:
TRIP Consultants
June 2008

MCA Vanuatu – Tourism Survey – Baseline Study Final Report
TRIP Consultants www.tripconsultants.net
MCA Vanuatu
Tourism Survey – Baseline Study
T A B L E O F C O N T E N T S
Definitions and Abbreviations
EXECUTIVE SUMMARY
1 Introduction and Background 1
Introduction 1 Background 1 2 Baseline Survey Methodology 3
Introduction 3 Questionnaire Design and Piloting 3 Sampling and Response 4 Confidence Levels of the Sample Results 7 Data Review and Input 8 3 Tourism in Vanuatu 9
Vanuatu Tourism Trends 9 4 Key Findings of the Baseline Survey 12
General 12 Tourism Expenditure 13 Income from Tourism 17 Tourism Employment 20 Transport Issues 22 Other Findings 26 Summary of Baseline Figures 29 5 Conclusions and Recommendations 29
Conclusions 29 Lessons Learned and Recommendations 30

MCA Vanuatu – Tourism Survey – Baseline Study Final Report
TRIP Consultants www.tripconsultants.net
APPENDICES Appendix I: Terms of Reference
Appendix II: Survey Questionnaires
• II A - International Visitor Survey • II B – Domestic Visitor Survey • II C – Cruise Ship Visitor Survey • II D – Tourism Business Survey • IIE – Yacht Visitor Survey
Appendix III: Record of Refusals
• III A - International Visitor Survey • III B – Cruise Ship Visitor Survey
Appendix IV: Monthly Exchange Rates Used in Currency
Conversions Appendix V: Additional Data Entry Codes Appendix VI: Key Findings and Tables
• VI A – International Air Survey • VI B – International Air Survey – Santo • VI C – Cruise Visitor Survey • VI D – Yacht Visitor Survey • VI E – Domestic Tourism Survey • VI F – Background Statistics on Employment • VI G – Transport Issues • VI H – Tourism Business Survey

MCA Vanuatu – Tourism Survey – Baseline Study Final Report
TRIP Consultants www.tripconsultants.net
ABBREVIATIONS
FTE – Full Time Equivalent (jobs)
GDP – Gross Domestic Product
MCA – Millennium Challenge Account
MCC – Millennium Challenge Corporation
NSO – Vanuatu National Statistics Office
PMU – Project Management Unit
TOR – Terms of Reference
VFR – Visiting Friends and Relatives
VTO – Vanuatu Tourism Office
DEFINITIONS
BOXPLOT OUTLIERS - The boxplot gives a visual illustration of the
distribution of responses for continuous variables. It displays the median, the
interquartile range (25th to 75th percentile – the box), ‘whiskers’ that extend to
largest and smallest observed values within 1.5 box lengths. Beyond that the
sample responses are seen as ‘outliers’ between 1.5 and 3 box lengths.
Beyond 3 box lengths they are seen as ‘extreme values’.
GROSS AND NET FOREIGN EXCHANGE EARNINGS – Gross Foreign Exchange
Earnings is taken as the total expenditure by international tourists, including
the expenditures made on their behalf by tour operators/ travel agents, but
referring to the actual expenditure that takes place in Vanuatu or comes into
the Vanuatu economy.
Net Foreign Exchange Earnings deducts the amount of imports and
remittances that are seen as necessary to bring about the Gross Foreign
Exchange Earnings. This deduction, described as ‘leakage’ or ‘non-retention’,
is estimated at 30 percent.
INTERMEDIATE CONSUMPTION – Intermediate consumption includes goods
and services which are entirely used up by producers in the course of

MCA Vanuatu – Tourism Survey – Baseline Study Final Report
TRIP Consultants www.tripconsultants.net
production to produce output of goods and services during the accounting
period. Durable goods which may be classified as capital goods since they are
used as the tools of production over a number of years (saws, spades, knives,
axes, hammers and screwdrivers etc.) may be included in intermediate
consumption if their prices are below a certain low value. Intermediate
consumption excludes other production costs, such as labour cost, financial
costs and production taxes. The labour and financial costs and production
taxes are costs to business firms but are treated in the SNA (System of
National Accounts) as incomes generated for the economy in the production
process.
MULTIPLIER EFFECT – The additional spending generated from direct tourist
expenditure in the local economy. The full impact is achieved through a
process of direct, indirect and induced impacts, sometimes referred to as the
multiplier effect. Key to estimating the economic impact are the assumptions
made with respect to the breakdown of the tourist expenditure, both by
tourists themselves and by tour operators on behalf of the tourists. Equally
important is the breakdown of the costs of providers of services in order to
identify ‘value added’. Import items are especially significant for the indirect
impacts because intermediate consumption by the first round of suppliers also
translates into local value added but not for the imported items.
Direct Effects - the direct local income generation per Vatu of tourist
expenditure i.e. the factor incomes generated within businesses that directly
receive tourist expenditure.
Indirect Effects - indirect local income generation per Vatu of tourist
expenditure i.e. the factor incomes generated in other businesses whose
turnover is directly augmented with purchases made by the original businesses
Induced Effects - Induced local income generation per Vatu of tourist
expenditure i.e. factor incomes generated as a result of expenditure by local
residents whose income has been increased by direct or indirect income
generated by the original tourist expenditure.

MCA Vanuatu – Tourism Survey – Baseline Study Final Report
TRIP Consultants www.tripconsultants.net
In the context of this report the analyses have been restricted to the direct and
indirect effects.
TOTAL TOURIST EXPENDITURE – The sum of all tourist expenditure by
international visitors who arrive by air, by cruise ship and by yacht, together
with domestic tourists who travel by air.
TOTAL INTERNATIONAL TOURIST EXPENDITURE – The sum of all tourist
expenditure by international visitors who arrive by air, by cruise ship and by
yacht.
VALUE ADDED (DIRECT AND INDIRECT) – The System of National Accounts
(SNA) defines GDP and gross value added operationally, i.e., how they are
calculated. Gross value added and GDP measure the additional value of goods
and services that are newly created in the economy and are available for
domestic final uses or for exports. Output is the value of the goods and
services which are produced by an establishment in the economy that become
available for use outside that establishment. They are valued at market or
equivalent market prices. Intermediate consumption is the cost of goods and
services used in production. GDP is equal to the value of all goods and
services produced in the economy (i.e., output) less the value of all goods and
services used in the production processes (i.e., intermediate consumption).
The total gross value added after some minor adjustment for taxes and
subsidies is gross domestic product.
In the context of this report we have taken value added as the combination of
gross operating surpluses of businesses plus their wages/labour costs.
The Use of the terms ‘Direct’ and ‘Indirect’ relate to the scope of the inputs to
the Value added e.g. whether or not the estimate applies only to the first round
tourist expenditure (direct) or whether the expenditure by intermediate
suppliers to the tourist industry is also being included (indirect).
MCA Vanuatu – Tourism Survey – Baseline Study Final Report
TRIP Consultants www.tripconsultants.net
RELATIVE SAMPLING ERROR - The relative sampling error is the sampling
error divided by the ‘sample statistic’ expressed as a percentage. It provides
an easily understood indication of the range within which the ‘population
parameter’ might lie in the context of the ‘sample statistic’. For the purposes
of this report, the sampling error has been taken at the 95 percent confidence
level using the normal distribution. This is taken as 1.96 times the Standard
Error
TOTAL TOURIST EXPENDITURE – The sum of all tourist expenditure by
international visitors who arrive by air, by cruise ship and by yacht, together
with domestic tourists who travel by boat.
TOTAL INTERNATIONAL TOURIST EXPENDITURE – The sum of all tourist
expenditure by international visitors who arrive by air , by cruise ship and by
yacht.
TRIMMED MEAN - For the purposes of this report the trimmed mean has
been taken as a 5 percent trimmed mean, which involves exclusion of the top
5 percent and the bottom 5 percent of the sample values for the sample
statistic being estimated for the mean.

MCA Vanuatu – Tourism Survey – Baseline Study Final Report
TRIP Consultants www.tripconsultants.net
EXECUTIVE SUMMARY
1. This Tourism Survey project commenced on 11th June 2007 and
is being undertaken in two Phases, namely:
• Phase One – Baseline Survey - June 2007 – June 2008; and
• Phase Two – Final Survey - January 2010 – December 2010.
2. A series of five surveys have been undertaken in Phase One to
gather tourism expenditure, income, employment and transport
data in Vanuatu. The main surveys consist of:
• An international visitor survey
• A domestic tourism survey
• A yacht visitor survey
• A cruise shipping visitor survey
• A local tourism business survey
3. The questionnaires were designed for self-completion and administered by a
team of experienced enumerators. The table below indicates the sample size
for each survey together with the general confidence intervals for questions
giving proportions/percentages (in effect yes/no answers).
Table 1. Sample Sizes and Confidence Interval – 2007 Baseline Survey
Sample Sample Size General Confidence
Interval
Departing Air Passengers at
Bauerfield Airport, Efate
1542 +/- 2.5 percentage points
Departing Air Passengers at
Pekoa Airport, Santo
85 +/- 11 percentage points
Domestic Air Passengers 202 +/- 7 percentage points
Yacht Passengers 27 +/- 19 percentage points
Cruise Passengers 751 +/- 4 percentage points
MCA Vanuatu – Tourism Survey – Baseline Study Final Report
TRIP Consultants www.tripconsultants.net
Note: The mathematics of probability do not apply to the Business Survey because it is not a
random survey. The sample statistics from the Business Survey have to be seen as ‘indicative’.
4. Questionnaires were reviewed for completeness and monitored for accuracy
of recording (both manually and by using boxplots of the ‘outliers’). The
questions were pre-coded and additional coding was used for the open ended
questions and incorporated into the data entry process.
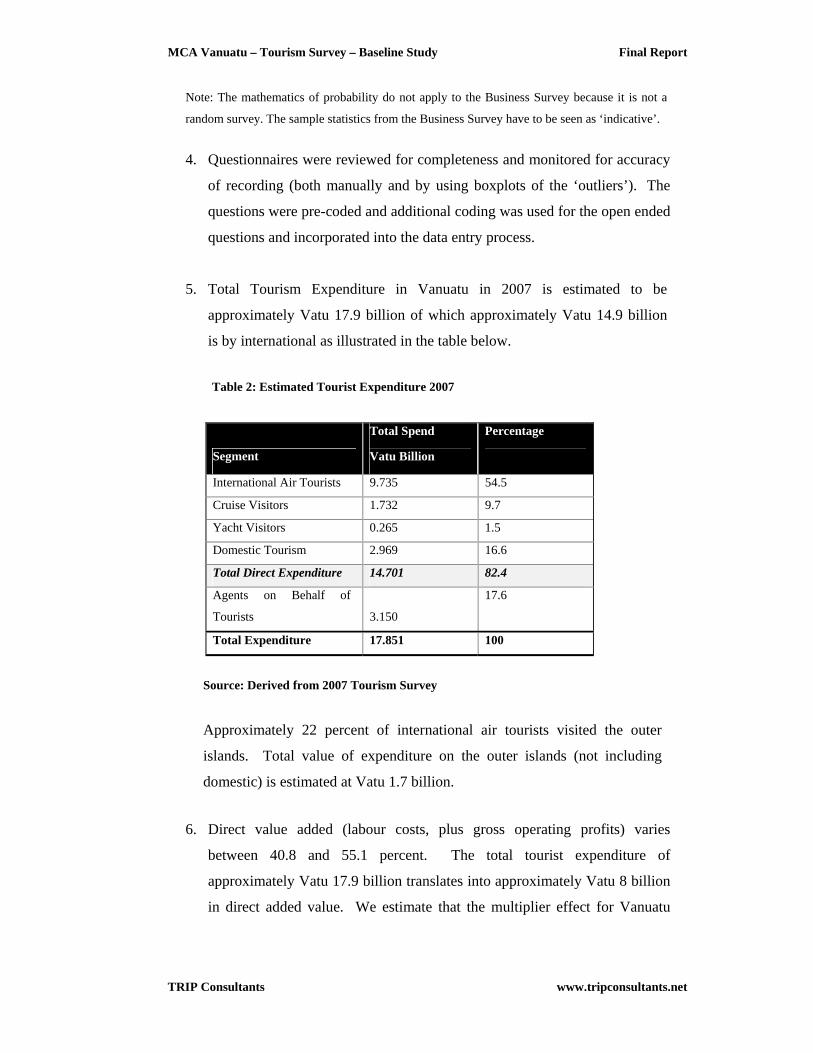
5. Total Tourism Expenditure in Vanuatu in 2007 is estimated to be
approximately Vatu 17.9 billion of which approximately Vatu 14.9 billion
is by international as illustrated in the table below.
Table 2: Estimated Tourist Expenditure 2007
Segment
Total Spend
Vatu Billion
Percentage
International Air Tourists 9.735 54.5
Cruise Visitors 1.732 9.7
Yacht Visitors 0.265 1.5
Domestic Tourism 2.969 16.6
Total Direct Expenditure 14.701 82.4
Agents on Behalf of
Tourists 3.150
17.6
Total Expenditure 17.851 100
Source: Derived from 2007 Tourism Survey
Approximately 22 percent of international air tourists visited the outer
islands. Total value of expenditure on the outer islands (not including
domestic) is estimated at Vatu 1.7 billion.
6. Direct value added (labour costs, plus gross operating profits) varies
between 40.8 and 55.1 percent. The total tourist expenditure of
approximately Vatu 17.9 billion translates into approximately Vatu 8 billion
in direct added value. We estimate that the multiplier effect for Vanuatu

MCA Vanuatu – Tourism Survey – Baseline Study Final Report
TRIP Consultants www.tripconsultants.net
equates to an additional 2.3 billion. Direct plus indirect local incomes
(value added) are therefore estimated at approximately Vatu 10.2 billion.
7. The survey results indicate that there are around 3,300 fulltime employees
and 1,400 part-time employees attributable to tourist spending;
hotel/accommodation providers account for approximately half of all
employment in the tourism sector.
8. The majority of tourists visit sites and attractions outside of the capital city
of Port Vila (almost 60 percent of international air visitors, 40 percent of
cruise ship visitors and 63 percent of yacht visitors). Approximately Vatu
3.3 billion or 22.6 percent of all tourist expenditure is spent on local
transport.
9. The results of the survey indicate that the contribution to GDP from tourism
(direct plus indirect) is approximately 20 percent. In addition, the results
indicate that 27 percent of gross revenues from tourism are used to bring in
goods and services from overseas.
10. The main Baseline Measures estimated from the results of the 2007
Tourism Survey are summarised in the table below. Table 3: Summary of Baseline Figures - 2007
Item Units Baseline Figure 2007
Total Tourist Expenditure Vatu billion 17.85
Total International Tourist Expenditure
Vatu billion 14.88
Direct Value added/ Local incomes deriving from Tourist Expenditure
Vatu billion 7.97
Direct + Indirect Value added/ Local incomes deriving from Tourist Expenditure
Vatu billion 10.2
Employment Full Time Equivalents
3,800
Contribution to GDP (Direct + Indirect) arising from Tourist Expenditure
Percent 20%
Gross Foreign Exchange Earnings Vatu billion 14.9

MCA Vanuatu – Tourism Survey – Baseline Study Final Report
TRIP Consultants www.tripconsultants.net
Net Foreign Exchange Earnings Vatu billion 10.4
Source: 2007 Sample Surveys/Consultants Estimates

MCA Vanuatu – Tourism Survey – Baseline Study Final Report - Appendices
TRIP Consultants www.tripconsultants.net
1. INTRODUCTION AND BACKGROUND
INTRODUCTION
This Report summarizes the outcomes from the initial MCA Baseline Tourism
Survey; the contents of this Report provide an overview of the Survey
methodology and work conducted, tourism trends in Vanuatu and the findings and
recommendations which emerge from the Baseline Survey. The contents are
designed to meet the reporting requirements contained within the Terms of
Reference for the assignment (Appendix I).
BACKGROUND
The Government of the Republic of Vanuatu has received a grant from the
Government of the United States of America through the Millennium Challenge
Corporation (MCC) to support a five-year Program of investments in the Transport
Sector, aimed at facilitating poverty reduction through economic growth.
The Program is designed to reduce poverty through infrastructure development.
Specifically the improvements in physical infrastructure are expected to increase
economic activity in the productive sectors and specifically in the tourism sector.
At the level of the Program Goal the Program ‘aims to reduce poverty in Vanuatu
by increasing economic activity and the incomes of men and women in rural areas,
where 80% of the population resides, through the amelioration of transport
infrastructure.’
By focusing on one of the principal factors constraining private sector development
and access to social services, namely poor roads, wharves and airstrips in the outer
islands, the program intends to reduce the transport costs of doing business in
Vanuatu. By reducing transportation costs, the program expects to stimulate
agricultural and tourism activity in the rural and outer islands, thereby contributing
to the program goal of increasing incomes.

MCA Vanuatu – Tourism Survey – Baseline Study Final Report - Appendices
TRIP Consultants www.tripconsultants.net
The cost of the MCA program is $65.69 million over five years, focused on both
the reconstruction of roads, wharves, warehouses and airstrips. The program also
includes activities related to institutional strengthening, monitoring and evaluation,
financial management and procurement management.
The Project Monitoring and Evaluation Plan identifies the requirement for a
comprehensive tourism survey to be undertaken to establish baseline data for the
tourism indicators in the Plan and then to track changes in the industry over time to
assess the Program’s impact on the tourism sector.
In line with this requirement, TRIP Consultants have been contracted by the
implementing agency MCA Vanuatu, to undertake a tourism survey in two stages;
an initial Baseline Survey and Final Survey at the end of the Program.
Specifically the Terms of Reference outlines that ‘The Baseline Survey will collect
data in three areas: tourism expenditure, tourism employment, and income from
tourism (value-added for businesses and household income). Overall, the data
collected will measure the industry’s current contribution to Vanuatu’s economy
and household welfare, track over time how that contribution changes, and, given
the nature of the MCA program, examine how changes in transport infrastructure
and services effect the development of the tourism industry and the income and
employment derived from it.’
The Terms of Reference identifies that the Tourism Survey will specifically
measure and analyse:
• Tourism Income
• Tourism Expenditure
• Income From Tourism
• Transport Issues
In addition the TOR indicates that ‘the Consultant should use this and other
existing tourism data to produce data and analysis of tourism’s impact on
household income and the economy as a whole.’

MCA Vanuatu – Tourism Survey – Baseline Study Final Report - Appendices
TRIP Consultants www.tripconsultants.net
2. BASELINE SURVEY METHODOLOGY
INTRODUCTION
This Tourism Survey project commenced on 11th June 2007 and is being
undertaken in two Phases, namely:
• Phase One – Baseline Survey - June 2007 – June 2008; and
• Phase Two – Final Survey - January 2010 – December 2010.
A series of five surveys is being undertaken during both Phases to
gather tourism expenditure, income, employment and transport data in
Vanuatu. The main surveys consist of:
• An international visitor survey
• A domestic tourism survey
• A yacht visitor survey
• A cruise shipping visitor survey
• A local tourism business survey
QUESTIONNAIRE DESIGN AND PILOTING
A series of five questionnaires were designed for self completion by respondents
and to elicit the required information on expenditure, employment, income and
transport issues. The draft questionnaires were discussed with the PMU and MCC;
comments were received from MCA on each of the questionnaires and the specific
points raised were incorporated into each of the final questionnaires. Pilot testing
was then undertaken on a sample of the final draft questionnaires in Port Vila. Pilot
responses were analysed and minor adjustments made to the questionnaires to
reflect the outcomes from the pilot testing. A further pilot test was undertaken on
the questionnaires and final adjustments made to ensure accuracy of wording, ease
of interpretation and logical response. Final questionnaires (Tourism Business and

MCA Vanuatu – Tourism Survey – Baseline Study Final Report - Appendices
TRIP Consultants www.tripconsultants.net
Domestic Tourism) were translated into Bislama to facilitate response by Ni-
Vanuatu. Copies of the final five questionnaires are attached as Appendix II.
SAMPLING AND RESPONSE
Experienced enumerators were recruited using the National Statistics Office
network; both Francophone and Anglophone enumerators were recruited and
trained in the relevant survey process.
A sampling framework was devised and endorsed by MCA based on the sample
sizes proposed within the Consultants’ proposal to undertake the Project as
follows:
Table 1: Proposed Sample Sizes – 2007 Baseline Survey
Survey International
Tourism Survey
Port Vila Santo
Domestic
Tourism
Survey
Yacht
Tourism
Survey
Cruise
Tourism
Survey
Tourism
Business
Survey
Sample
Size
1,500 100 200 30 750 100
Sample sizes were determined by reference to previous tourism surveys in
Vanuatu1 as well as the available budget and MCA requirements. Santo was
included in the International Tourism Survey as the second international port of
entry.2
A brief summary of the methodology for each survey is outlined below.
International Tourism Survey
The International Tourism Survey was conducted in the departure lounge at
Bauerfield (Efate) and Pekoa (Santo) Airports. The survey was undertaken in four
periods between 6th August 2007 and 1st March 2008 (see table below). The 1 2004 Visitor Survey Report – Vanuatu National Statistics Office and 1997 Visitor Survey Report – Vanuatu National Statistics Office 2 Santo services commenced with two flights a week from Australia in June 2007 but were reduced to one per week in August 2008; this compares with 24 international flights a week to Port Vila.
MCA Vanuatu – Tourism Survey – Baseline Study Final Report - Appendices
TRIP Consultants www.tripconsultants.net
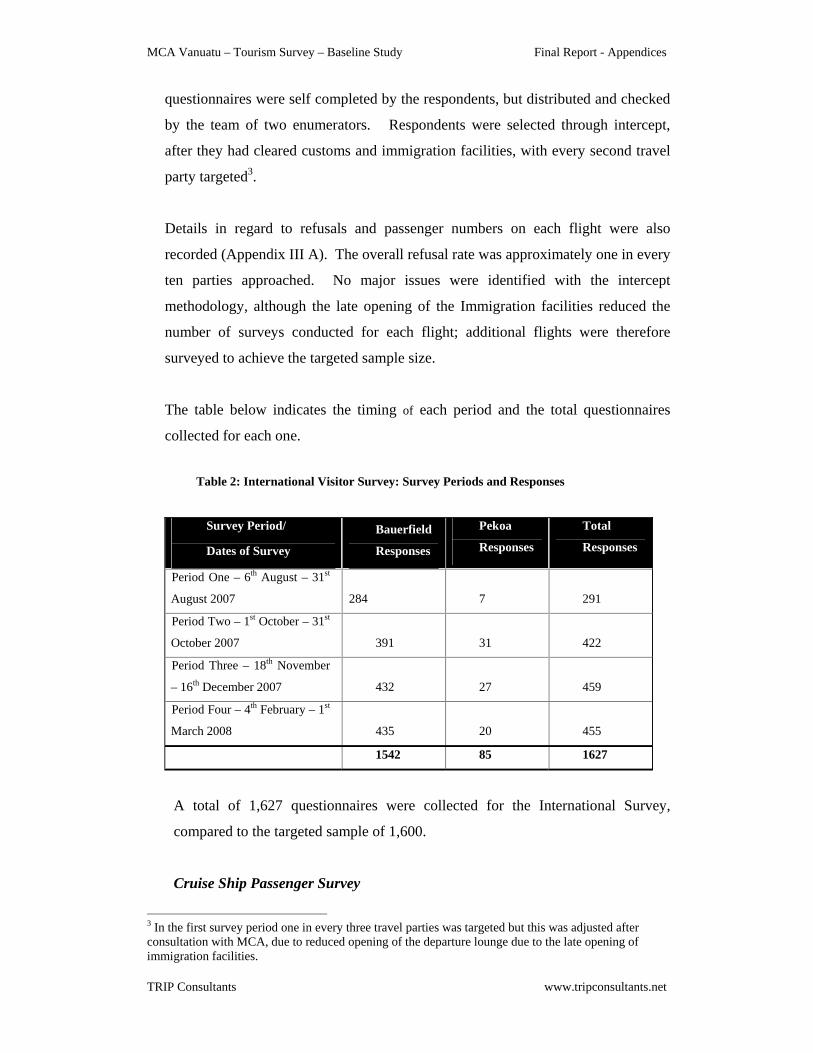
questionnaires were self completed by the respondents, but distributed and checked
by the team of two enumerators. Respondents were selected through intercept,
after they had cleared customs and immigration facilities, with every second travel
party targeted3.
Details in regard to refusals and passenger numbers on each flight were also
recorded (Appendix III A). The overall refusal rate was approximately one in every
ten parties approached. No major issues were identified with the intercept
methodology, although the late opening of the Immigration facilities reduced the
number of surveys conducted for each flight; additional flights were therefore
surveyed to achieve the targeted sample size.
The table below indicates the timing of each period and the total questionnaires
collected for each one.
Table 2: International Visitor Survey: Survey Periods and Responses
Survey Period/
Dates of Survey
Bauerfield
Responses
Pekoa
Responses
Total
Responses
Period One – 6th August – 31st
August 2007 284
7
291
Period Two – 1st October – 31st
October 2007 391
31
422
Period Three – 18th November
– 16th December 2007 432
27
459
Period Four – 4th February – 1st
March 2008 435
20
455
1542 85 1627
A total of 1,627 questionnaires were collected for the International Survey,
compared to the targeted sample of 1,600.
Cruise Ship Passenger Survey
3 In the first survey period one in every three travel parties was targeted but this was adjusted after consultation with MCA, due to reduced opening of the departure lounge due to the late opening of immigration facilities.

MCA Vanuatu – Tourism Survey – Baseline Study Final Report - Appendices
TRIP Consultants www.tripconsultants.net
The Cruise Ship Passenger Survey was undertaken between 16th September 2007
and 2nd March 2008. Surveys were conducted within the ‘Secure Area’ on the
main wharf in Port Vila and an intercept method used targeting every third
passenger group. Surveys were handed out (with every third travel group
targeted) and checked by the team of two enumerators. A total of 751
questionnaires were collected during the survey period (against a target of 750).
A record of refusals was also maintained and these are presented as Appendix III
B.
Tourism Business Survey
The Business Survey was emailed out using the Vanuatu Tourism Office database
of approximately four hundred and twenty seven companies operating in the
sector in Vanuatu. Follow up emails and telephone interviews were undertaken
between September 2007 and February 2008, to increase the response rate to the
targeted level. A total of 103 questionnaires were completed within the survey
period, against an original target of 100.
Yacht Survey
The Yacht Survey was undertaken from September 2007 to February 2008. A total
of twenty seven questionnaires were collected (out of the target of 30).
Questionnaires were distributed at key locations in Port Vila but due to the
seasonality of visitation few responses were received after October 2007, (due to
the onset of cyclone season); this high level of seasonality will need to be addressed
in Final Survey implementation
Domestic Tourism Survey
The domestic survey was undertaken between September and December 2007, with
202 questionnaires collected out of an original target of 200; samples were
collected from the domestic departure lounges of the airports on Efate, Tanna and
Santo. The surveys were conducted in the departure area of the domestic airports,

MCA Vanuatu – Tourism Survey – Baseline Study Final Report - Appendices
TRIP Consultants www.tripconsultants.net
after passengers had checked in, with every third travel group targeted.
Questionnaires were self completion, but handed out and checked by the
enumerators.
Tour Operator Interviews
Approximately five (out of a total of nine listed on the VTO database) inbound
operators were also interviewed in February 2008. A total of 23 completed
questionnaires were also received (out of a total of 103) from tour/inbound
operators under the Business Survey
CONFIDENCE LEVELS OF THE SURVEY RESULTS
Questions Giving Proportions
The convention in indicating the level of accuracy of the sample is to use the 50%
percentage to determine the confidence interval.
For our samples, the following are the general confidence intervals for questions
giving proportions/ percentages (in effect yes/no answers).
Table 4: Baseline Survey – Sample Sizes and Confidence Levels
Sample Sample Size General Confidence
Interval
Departing Air Passengers at
Bauerfield Airport, Efate
1542 +/- 2.5 percentage points
Departing Air Passengers at
Pekoa Airport, Santo
85 +/- 11 percentage points
Domestic Air Passengers 202 +/- 7 percentage points
Yacht Passengers 27 +/- 19 percentage points
Cruise Passengers 751 +/- 4 percentage points
As an example, the above data for the Bauerfield Airport Survey indicates that the
proportion of 50 percent (answering ‘yes’) in the sample will lead to the conclusion
that the proportion of the population (that will answer ‘yes’) will lie between 47.5
percent and 52.5 percent with a 95 percent confidence level.
MCA Vanuatu – Tourism Survey – Baseline Study Final Report - Appendices
TRIP Consultants www.tripconsultants.net
The key assumptions are a 95 percent confidence level using the Normal
Distribution and assuming a random sample. The mathematics of probability
shows that the size of the population is not relevant unless the size of the sample
exceeds a few percent of the total population being examined.
Questions Relating to Continuous Variables For continuous variables the confidence intervals vary according to the responses to
the particular question. At 95% confidence level (using the Normal Distribution)
the confidence interval is calculated by 1.96 times the Standard Error of the sample.
This figure is then divided by the sample statistic to give a percentage relationship
between the sample statistic and the population parameter at 95% confidence level,
often described as the Relative Sampling Error, and it has a percentage relationship
with the sample statistic, and not a percentage point relationship. So an answer of
10 from the sample (a sample statistic) with a 10% relative sampling error indicates
that the population parameter will be between 9 and 11 at a 95% confidence level.
It should be noted that the mathematics of probability do not apply to the Business
Survey because it is not a random survey. The sample statistics from the Business
Survey have to be seen as ‘indicative’.
DATA REVIEW AND INPUT
Questionnaires were reviewed for completeness and monitored for accuracy of
recording. Incomplete questionnaires were analysed to ensure that there was no
design fault that could be rectified. Non response rates were also analysed to
ascertain refusal rates for the International Visitor and Cruise Ship Surveys.
Refusal rates were approximately 10 percent and 36 percent respectively with the
higher refusal rate for the Cruise Ship Survey being attributed to late passenger
arrivals at the wharf and a less controlled interview environment than at the
international airport departure lounge. Questionnaires were then assigned a unique
code for identification and verification purposes.
A final quality audit was undertaken to ensure that there were no anomalies in the
database. This included inserting validation rules into the fields to prompt for
unusual values and setting skips (‘IF’ statements) to avoid unnecessary entry of

MCA Vanuatu – Tourism Survey – Baseline Study Final Report - Appendices
TRIP Consultants www.tripconsultants.net
values to questions which were not applicable. In cases which were highlighted
through the validation process, individual questionnaires were manually checked
and verified for the correct values.
Currency conversion into local currency (Vatu), were undertaken based on the
month of completion (resulting in an average based on the month of completion),
using the official average monthly rates supplied by the Government of Vanuatu
through the Department of Rates and Taxes. The monthly exchange rates used are
attached as Appendix IV.
The questions were pre-coded and additional coding was used for the open ended
questions and incorporated into the data entry process. A list of these additional
codes is provided as Appendix V.
A database was created in Microsoft Access for conversion to SPSS. The database
was reviewed and tested prior to the commencement of data entry.
Data input was undertaken in batches at the completion of each survey (or period).
Batches and questionnaire numbers were cross checked for consistency as part of
the quality control process. As a further quality control measure, sample results
were also checked and the boxplots of ‘outliers’ were rechecked manually to ensure
that the sample means were correct.
3. TOURISM IN VANUATU
VANUATU TOURISM TRENDS
In 2007 Vanuatu received 81,345 visitors, an increase of 19 percent on the
previous year. Holiday arrivals also increased from 53,030 in 2006 to 63,325 in
2007, an increase of 19 percent over the same period. Visitor arrivals have
increased significantly over the last four years at an average rate of 15 percent per
annum, with holiday visitors growing at a faster rate of 16 percent per annum.
With the introduction of new aircraft and additional capacity on both domestic
and international routes in 2008, this trend appears likely to continue.

MCA Vanuatu – Tourism Survey – Baseline Study Final Report - Appendices
TRIP Consultants www.tripconsultants.net
The table below illustrates the trend in arrivals for the last five years:
Table 5: Vanuatu Visitor Arrivals: 2003 – 2007
Segment 2003 2004 2005 2006 2007 % Change
Holiday 38924 46805 47865 53030 63325 62.7
VFR 3887 4593 4451 5061 6161 58.5
Business/
Conference 6746 7686 8411
9312
10837 60.6
Other 843 1527 1355 776 1022 21.2
Total 50400 60611 62082 68179 81345 61.4
Source: Vanuatu NSO
.
Vanuatu has a relatively high level of repeat visitation; according to the 2004
Vanuatu Visitor Survey of those who come on holiday approximately 29 percent
are repeat visitors, indicating that the level of visitor satisfaction is relatively high.
Australia dominates arrivals to Vanuatu and accounts for 58 percent of the market,
followed by New Zealand (17 percent), New Caledonia (10 percent), Europe (5
percent) and then North America (3 percent).
Table 6: Vanuatu Visitor Arrival by Nationality: 2007
Nationality
Number %
Australian 47,474 58.4
New Zealand 13,620 16.8
New Caledonia 8,475 10.4
Europe 3785 4.7
North America 2579 3.2
Japan 745 0.9
Other Pacific 2,900 3.6
Other/not stated 1,769 2.2
Total 81,345 100
Source: Vanuatu NSO
MCA Vanuatu – Tourism Survey – Baseline Study Final Report - Appendices
TRIP Consultants www.tripconsultants.net
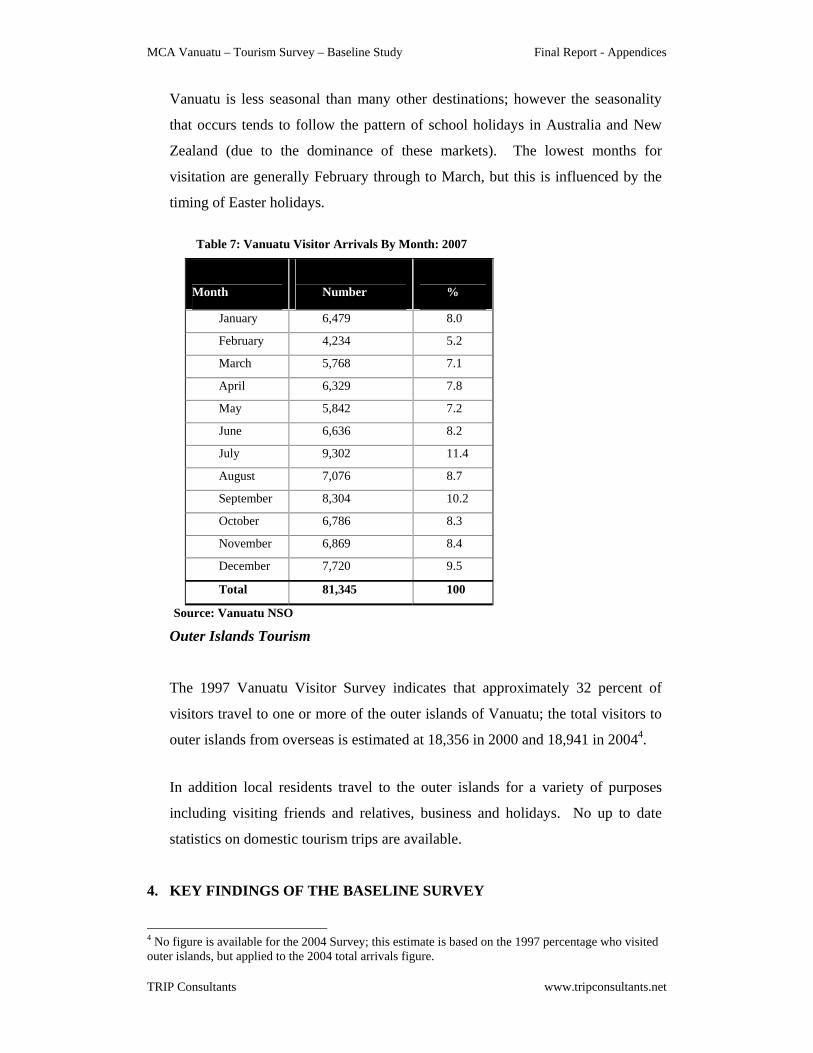
Vanuatu is less seasonal than many other destinations; however the seasonality
that occurs tends to follow the pattern of school holidays in Australia and New
Zealand (due to the dominance of these markets). The lowest months for
visitation are generally February through to March, but this is influenced by the
timing of Easter holidays.
Table 7: Vanuatu Visitor Arrivals By Month: 2007
Month
Number %
January 6,479 8.0
February 4,234 5.2
March 5,768 7.1
April 6,329 7.8
May 5,842 7.2
June 6,636 8.2
July 9,302 11.4
August 7,076 8.7
September 8,304 10.2
October 6,786 8.3
November 6,869 8.4
December 7,720 9.5
Total 81,345 100
Source: Vanuatu NSO
Outer Islands Tourism
The 1997 Vanuatu Visitor Survey indicates that approximately 32 percent of
visitors travel to one or more of the outer islands of Vanuatu; the total visitors to
outer islands from overseas is estimated at 18,356 in 2000 and 18,941 in 20044.
In addition local residents travel to the outer islands for a variety of purposes
including visiting friends and relatives, business and holidays. No up to date
statistics on domestic tourism trips are available.
4. KEY FINDINGS OF THE BASELINE SURVEY
4 No figure is available for the 2004 Survey; this estimate is based on the 1997 percentage who visited outer islands, but applied to the 2004 total arrivals figure.

MCA Vanuatu – Tourism Survey – Baseline Study Final Report - Appendices
TRIP Consultants www.tripconsultants.net
GENERAL
The five individual surveys have been undertaken to establish baseline data, which
focuses on tourism expenditure, income from tourism, tourism employment and
transport issues. The baseline year has been established as the Year 2007.
The findings on each of the individual surveys are set out in the following sub-
sections with an emphasis on providing a ‘Baseline Figure – Year 2007’ against
which estimates for future years can be measured.
More detailed findings and the relevant statistical tables from the five sample
surveys are provided in the attached Appendices (Appendix VI A to Appendix VI
E).
TOURISM EXPENDITURE
Introduction
Tourism expenditure in Vanuatu comes from a number of different sources,
including
• International visitors coming by air ( Appendix VIA and VIB)
• International visitors arriving by cruise ships (See Appendix VIC)
• International Yachtsmen (See Appendix VID)
• Domestic tourists visiting islands other than their own island (See Appendix
VIE)
The sample surveys undertaken addressed each of these different segments with a
view to finding out how long respondents stayed, how much they spent, and what
did they spend their money on in Vanuatu.
These sample survey statistics were then used to reach estimates of the
‘population/universe’ being sampled; for example, all cruise visitors in the Year
2007 and all international tourists arriving by air in 2007. As an example, the total

MCA Vanuatu – Tourism Survey – Baseline Study Final Report - Appendices
TRIP Consultants www.tripconsultants.net
expenditure calculations for the parameter applicable to the ‘population/universe’
resulted from the average spend per day (sample statistic) times average length of
stay (sample statistic) times annual number of tourist arrivals (population
parameter).
Estimates of expenditure in relation to each segment (survey) were estimated using
the formula below:
Total Visitors multiplied by the Average Length of Stay multiplied by the Average
Daily Expenditure = Total Visitor Expenditure
International estimates for expenditure using this formula, for each of the segments
surveyed (International Air, Cruise Ship, Yacht and Domestic) are set out in the
table below.
Table 8: Estimates of Tourists, Length of Stay, Average Daily Expenditure and Total Visitor
Expenditure
Segment Tourists
2007
Average
Length of
Stay (days)
Average
Daily
Expenditure
(Vatu)
Estimated
Total Direct
Expenditure
(Vatu
Billion)
International Air 81,345 7.7 15,542 9.735
Cruise Ship 85,922 1.0 20,160 1.732
Yacht 924 59.6 4,711 0.265
Domestic 75,000 10.1 3,920 2.969
Source: 2007 Tourism Survey and NSO Statistics
Total Tourism Expenditure
Total Tourism Expenditure in Vanuatu is estimated to be approximately Vatu 17.9
billion of which approximately Vatu 14.9 billion is by international tourists, either
paid directly or paid on their behalf by tour operators, cruise agents, or other travel
agents. These figures exclude payments for international air fares, some of which
will come into Vanuatu through Air Vanuatu.

MCA Vanuatu – Tourism Survey – Baseline Study Final Report - Appendices
TRIP Consultants www.tripconsultants.net
Cruise
Yachts
Agents
Domestic
International Air
Table 9: Estimated Tourist Expenditure 2007
Segment
Total Spend
Vatu Billion
Percentage
International Air Tourists 9.735 54.5
Cruise Visitors 1.732 9.7
Yacht Visitors 0.265 1.5
Domestic Tourism 2.969 16.6
Total Direct Expenditure 14.701 82.4
Agents on Behalf of
Tourists 3.150
17.6
Total Expenditure 17.851 100
Source: Derived from 2007 Tourism Survey
The ‘Baseline Figure – Year 2007’ for Total Tourist Expenditure is estimated to be
Vatu 17.85 billion.
The ‘Baseline Figure – Year 2007’ for International Tourism Expenditure is
estimated to be Vatu 14.7 billion.
The breakdown of the contribution to total tourism expenditure by individual
segment is illustrated in the figure below. Figure 1 – The Contributors to Total Tourist Expenditure in Vanuatu

MCA Vanuatu – Tourism Survey – Baseline Study Final Report - Appendices
TRIP Consultants www.tripconsultants.net
Tourist Spending on the Islands - Efate, Tanna, Santo and Malekula.
A broad estimate of the tourist expenditure in the islands other than Efate has been
undertaken for the international tourist market. Approximately 90,000 nights out
of a total of 626,000 nights were spent in islands other than Efate (i.e. 14 percent).
However daily expenditure was approximately16 percent lower. It can therefore
be estimated that approximately 12 percent of total international air tourist
expenditure took place in islands other than Efate. This gives a total figure of
approximately Vatu 1.5 billion, out of Vatu 12.6 billion. To this figure can be
added the international tourist expenditure by yacht visitors and by cruise visitors
in the outer islands.
Approximations of these figures have been made from the sample numbers who
indicated that they visited other islands, how many nights they spent there, and
how much they spent per day. These figures are illustrated in the table below. All
these are sample statistics for the Outer Islands that have been multiplied by each
other and added together, consequently the relative sampling error for the final
total is not known but is likely to be in the order of greater than +/-50%.
Table 10: Expenditure in Efate and Other Islands of Vanuatu 2007 (Vatu billion)
Segment
(Direct and Agent
Spending)
Spending on
Efate Island
Spending on
Other Islands
Total
Spending
Percentage
Total
Spending
International Air
Tourists 11.059
1.508 12.567
84.4
Cruise Ship Visitors 1.928 0.122 2.050 13.8
Yacht Visitors 0.223 0.042 0.265 1.8
Total 13.210 1.672 14.882 100.0
Source: Derived from 2007 Sample Surveys
The figures in above table for the Outer Islands are very broad approximations.
They are not robust enough to be used as Baseline Figures. However they are
broadly in accord with the distribution of tourist accommodation in the Provinces
of Vanuatu as shown in the figure below.

MCA Vanuatu – Tourism Survey – Baseline Study Final Report - Appendices
TRIP Consultants www.tripconsultants.net
Figure 2: Distribution of Tourist Accommodation by Province
Source: Vanuatu National Statistics Office INCOME FROM TOURISM Introduction
Total Tourism Expenditure is a key measure of the impact of the tourism industry
on the economy of Vanuatu. Tourism Expenditure translates into local value added
which in turn translates into local incomes.
The total tourism expenditure has been converted into value-added using:
• Total Tourism Expenditure Figures from the various sample surveys
• Estimates of value added from the Business Survey
• The National Accounts data from the National Statistical Office
In order to reach value-added, it has been necessary to break down the tourist
expenditure into different components which relate to different economic activities.
Table 11: Value Added by Total Tourist Expenditure 2007 – Vatu Billion
Category of Spending
Total Tourist
Expenditure
Value Added as
a % of tourist
expenditure Value Added
Accommodation 6.793 40.8% 2.771
Meals and Drinks 2.584 40.8% 1.054
Torba
Penama
Malampa
Shefa
Tafea Sanma
MCA Vanuatu – Tourism Survey – Baseline Study Final Report - Appendices
TRIP Consultants www.tripconsultants.net
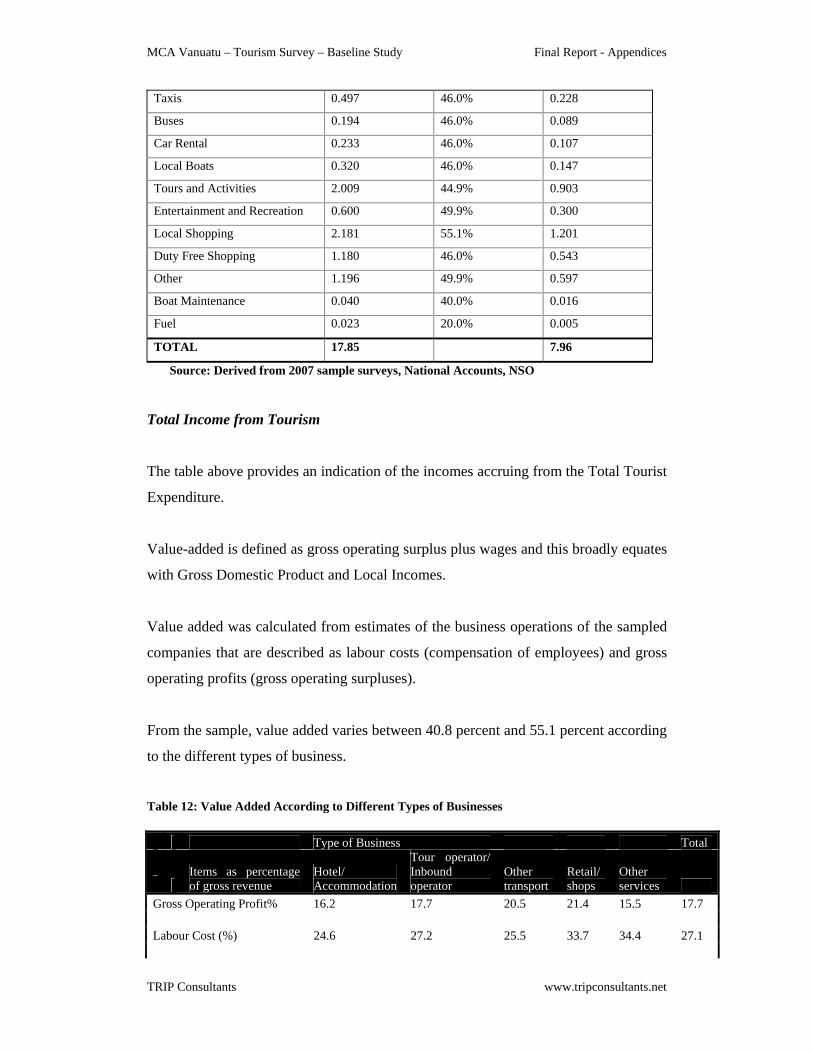
Taxis 0.497 46.0% 0.228
Buses 0.194 46.0% 0.089
Car Rental 0.233 46.0% 0.107
Local Boats 0.320 46.0% 0.147
Tours and Activities 2.009 44.9% 0.903
Entertainment and Recreation 0.600 49.9% 0.300
Local Shopping 2.181 55.1% 1.201
Duty Free Shopping 1.180 46.0% 0.543
Other 1.196 49.9% 0.597
Boat Maintenance 0.040 40.0% 0.016
Fuel 0.023 20.0% 0.005
TOTAL 17.85 7.96
Source: Derived from 2007 sample surveys, National Accounts, NSO
Total Income from Tourism
The table above provides an indication of the incomes accruing from the Total Tourist
Expenditure.
Value-added is defined as gross operating surplus plus wages and this broadly equates
with Gross Domestic Product and Local Incomes.
Value added was calculated from estimates of the business operations of the sampled
companies that are described as labour costs (compensation of employees) and gross
operating profits (gross operating surpluses).
From the sample, value added varies between 40.8 percent and 55.1 percent according
to the different types of business.
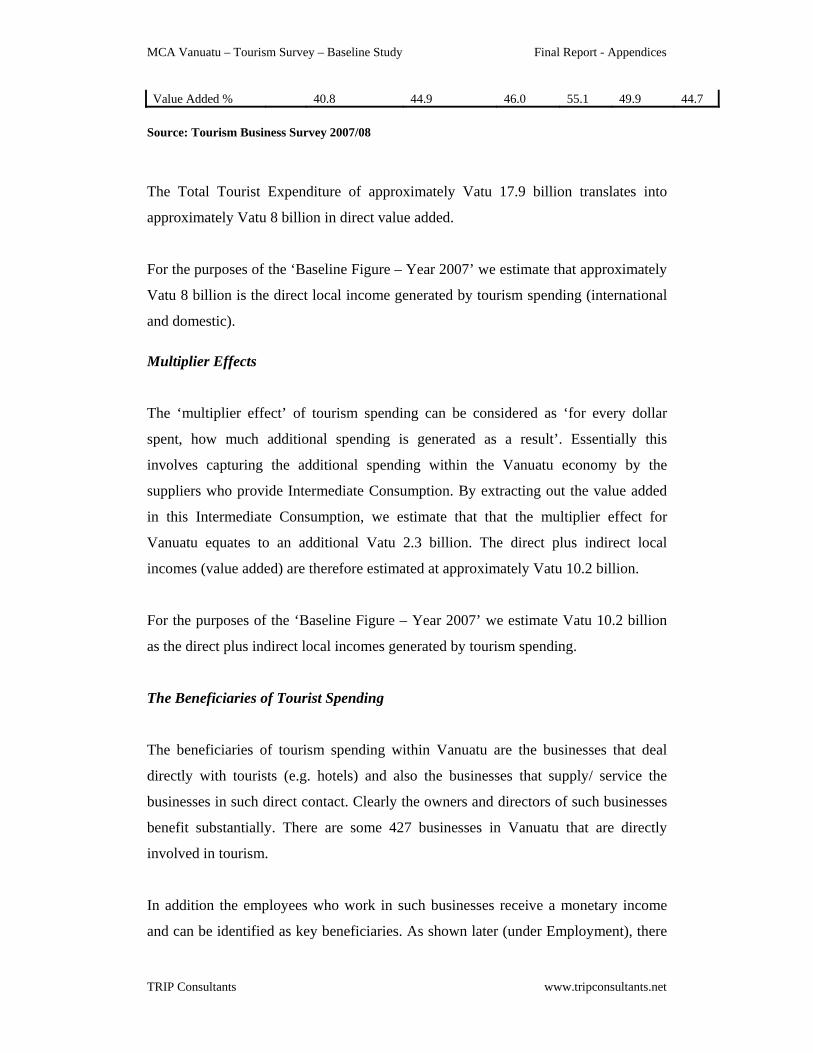
Table 12: Value Added According to Different Types of Businesses Type of Business Total
Items as percentage of gross revenue
Hotel/ Accommodation
Tour operator/ Inbound operator
Other transport
Retail/ shops
Other services
Gross Operating Profit% 16.2 17.7 20.5 21.4 15.5 17.7 Labour Cost (%) 24.6 27.2 25.5 33.7 34.4 27.1
MCA Vanuatu – Tourism Survey – Baseline Study Final Report - Appendices
TRIP Consultants www.tripconsultants.net
Value Added % 40.8 44.9 46.0 55.1 49.9 44.7 Source: Tourism Business Survey 2007/08
The Total Tourist Expenditure of approximately Vatu 17.9 billion translates into
approximately Vatu 8 billion in direct value added.
For the purposes of the ‘Baseline Figure – Year 2007’ we estimate that approximately
Vatu 8 billion is the direct local income generated by tourism spending (international
and domestic). Multiplier Effects
The ‘multiplier effect’ of tourism spending can be considered as ‘for every dollar
spent, how much additional spending is generated as a result’. Essentially this
involves capturing the additional spending within the Vanuatu economy by the
suppliers who provide Intermediate Consumption. By extracting out the value added
in this Intermediate Consumption, we estimate that that the multiplier effect for
Vanuatu equates to an additional Vatu 2.3 billion. The direct plus indirect local
incomes (value added) are therefore estimated at approximately Vatu 10.2 billion.
For the purposes of the ‘Baseline Figure – Year 2007’ we estimate Vatu 10.2 billion
as the direct plus indirect local incomes generated by tourism spending.
The Beneficiaries of Tourist Spending
The beneficiaries of tourism spending within Vanuatu are the businesses that deal
directly with tourists (e.g. hotels) and also the businesses that supply/ service the
businesses in such direct contact. Clearly the owners and directors of such businesses
benefit substantially. There are some 427 businesses in Vanuatu that are directly
involved in tourism.
In addition the employees who work in such businesses receive a monetary income
and can be identified as key beneficiaries. As shown later (under Employment), there

MCA Vanuatu – Tourism Survey – Baseline Study Final Report - Appendices
TRIP Consultants www.tripconsultants.net
are around 3,300 fulltime employees and 1,400 part-time employees (as equivalents)
attributable to the tourist spending.
The Government of Vanuatu is also a significant beneficiary from tourism
expenditure; the Government benefits from a range of direct taxes and user fees levied
specifically on the tourism sector, but also from other taxes and licences including
VAT and business licences.
TOURISM EMPLOYMENT
Employment and jobs are key statistics in terms of measuring the importance of
tourism. Our sample survey of tourism businesses gave a sample statistic of 1,483
full time employment equivalents (FTEs).
The table below illustrates the various levels of employment by the businesses
included in the Business Survey.
Table 13: Employment in the businesses in the sample by the type of business
Employment
Hotel/ Accommodation
Tour operator/ Inbound operator
Other transport
Retail/ shops Other Total
Full Time 615 206 145 98 185 1249 Part-time 182 92 25 35 205 539 FTE5 61 31 8 12 68 180 Expatriate 48 4 0 0 2 54 Total FTE 724 241 153 110 255 1483 Breakdown 48.8% 16.2% 10.3% 7.4% 17.2% 100.0% Part-time as % Full-time 29.6% 44.7% 17.2% 35.7% 110.8% 43.2% Expatriate as % FTE 6.6% 1.7% 0.0% 0.0% 0.8% 3.6%
Hotel employment makes up around half the total of Tourism employment and then to
a much smaller extent is made up by tour operators and transport operators.
The principal difficulty in estimating employment generated by tourism is that
employment is not an easily divisible unit that can be added up in different ways as
can be done with expenditure. The bank employee who spends 10 percent of his/her 5 FTEs estimated at three part time to one full time job

MCA Vanuatu – Tourism Survey – Baseline Study Final Report - Appendices
TRIP Consultants www.tripconsultants.net
working time dealing with tourism and 90 percent dealing with non-tourism activities
could be described as an 0.1 full-time job equivalent in tourism, but this is not a
feasible way to obtain such statistics.
The most reliable method for estimating employment in the tourism sector is to take
the sample statistics of 1,483 FTEs and multiply by the ratio between Total Tourist
Expenditure in Vanuatu (approx Vatu 18 billion) and the turnover in the sample
(approx Vatu 7 billion); in other words multiply 1,483 jobs by 2.57. This gives a
figure of approximately 3,800 FTEs generated by tourism spending. This method is
considered to be suitable for the establishment of a Baseline figure on employment.
Therefore using this methodology it is estimated that the ‘Baseline Figure for Year
2007’ is 3,800 FTEs in the tourism related industries. Dividing this into full-time and
part-time jobs would give a figure of around 3,300 full-time jobs and around 1,400
part-time jobs, making a total of 4,700 jobs.
Informal Employment
There have been a number of income and employment surveys by the National
Statistical Office and one of these provides detailed estimates of informal employment
(See Appendix IIIF). In the year 2000 informal employment (outside of farming) was
some 42 percent of the level of formal employment. Many of these informal workers
were concerned with activities that would touch upon tourists e.g. retail, handicrafts
etc. Such informal employment could potentially push the direct jobs (full-time
equivalent) figure over 5,000 for tourism. This would increase the employment by 32
percent but this is just an ‘indicative’ figure. The informal employment estimate
comes primarily from the Informal Sector Survey 2000 by the National Statistical
Office.
Employment in Islands Outside of Efate
It is likely that employment will broadly follow the level of tourist expenditure in
Efate and in Other Islands. It would be possible to apply a similar ratio to total
employment to obtain a very broad order of magnitude of employment in Other
MCA Vanuatu – Tourism Survey – Baseline Study Final Report - Appendices
TRIP Consultants www.tripconsultants.net
Islands, although such figures should be used with caution due to the limited data
available. The table below summarises employment by island based on the responses
from the Business Survey.
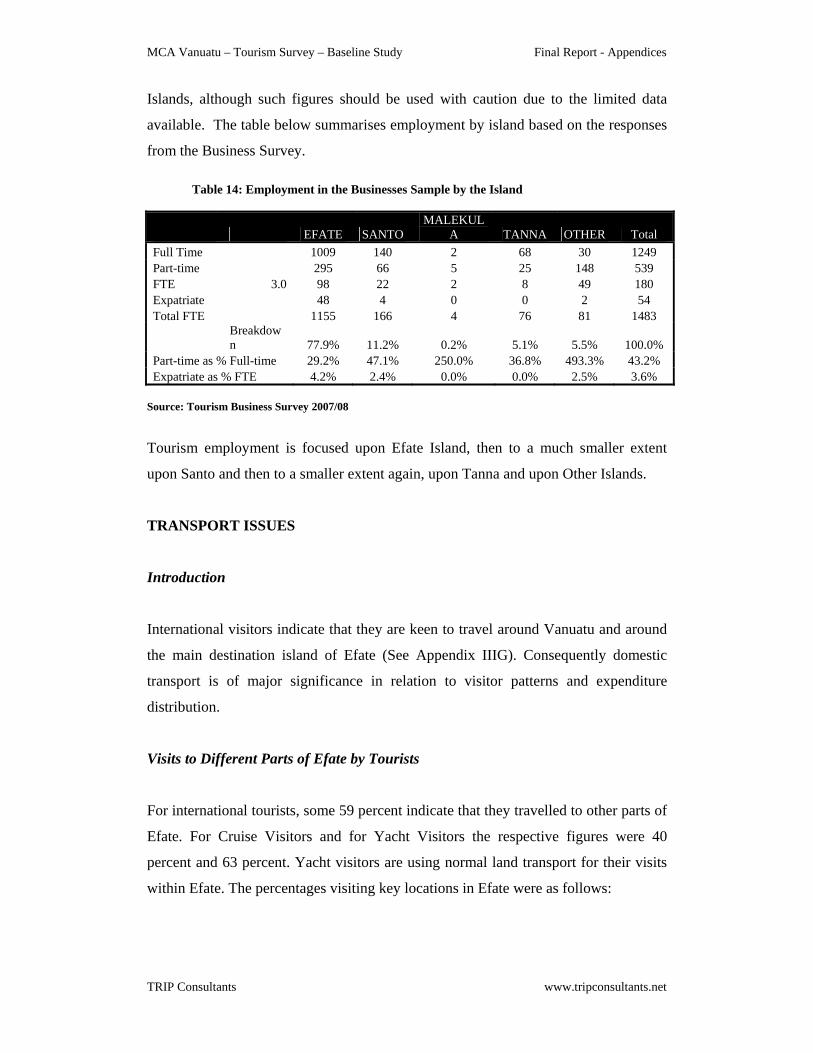
Table 14: Employment in the Businesses Sample by the Island
EFATE SANTO MALEKUL
A TANNA OTHER Total Full Time 1009 140 2 68 30 1249 Part-time 295 66 5 25 148 539 FTE 3.0 98 22 2 8 49 180 Expatriate 48 4 0 0 2 54 Total FTE 1155 166 4 76 81 1483
Breakdown 77.9% 11.2% 0.2% 5.1% 5.5% 100.0%
Part-time as % Full-time 29.2% 47.1% 250.0% 36.8% 493.3% 43.2% Expatriate as % FTE 4.2% 2.4% 0.0% 0.0% 2.5% 3.6%
Source: Tourism Business Survey 2007/08
Tourism employment is focused upon Efate Island, then to a much smaller extent
upon Santo and then to a smaller extent again, upon Tanna and upon Other Islands.
TRANSPORT ISSUES
Introduction
International visitors indicate that they are keen to travel around Vanuatu and around
the main destination island of Efate (See Appendix IIIG). Consequently domestic
transport is of major significance in relation to visitor patterns and expenditure
distribution.
Visits to Different Parts of Efate by Tourists
For international tourists, some 59 percent indicate that they travelled to other parts of
Efate. For Cruise Visitors and for Yacht Visitors the respective figures were 40
percent and 63 percent. Yacht visitors are using normal land transport for their visits
within Efate. The percentages visiting key locations in Efate were as follows:

MCA Vanuatu – Tourism Survey – Baseline Study Final Report - Appendices
TRIP Consultants www.tripconsultants.net
Table 15: Visits by International Tourists to Different Sites on Efate
Sites
Air Tourists
Percent
Cruise
Visitors
Percent
Yacht
Visitors
Percent
Hideaway Island 33 10 33
Mele Cascades 28 14 26
Round Island Tour 20 10 26
North Efate/Havannah
Harbour 13
1
0
Other sites 22 11 11
Source: 2007 Sample Surveys
In addition to the above, there were a whole range of sites quoted under ‘Other Sites’
as being visited by tourists (See Appendix IIIG). Clearly international tourists to
Vanuatu want to see different sites and attractions during their stay, with subsequent
potentially positive impacts in terms of rural income generation.
Tourism Expenditure on Transport
Tourists spend a substantial amount on transport related activities. The key activity is
tours. However taxis, buses, car rental and local boat tours are also exceptionally
important as economic activities. The table below indicates the estimated level of
tourism expenditure in 2007 by different mode of transport. Table 16: Tourist Expenditure on Different Types of Transport Related Activities 2007
(Vatu million)
Transport Activity
Total Tourist
Expenditure
Vatu Millions
Percentage of
Direct Tourist
Expenditure
Taxis 497 3.4
Buses 194 1.3
Car rental 233 1.6
Local Boats 320 2.2

MCA Vanuatu – Tourism Survey – Baseline Study Final Report - Appendices
TRIP Consultants www.tripconsultants.net
Tours and Activities6 2,009 13.7
Boat Maintenance 40 0.3
Fuel 23 0.2
Total 3,317 22.6
Source: Derived from 2007 Sample Surveys
Supporting these economic activities with appropriate infrastructure will therefore be
critical in order to support the future development of the tourism sector and a wider
geographic distribution of the benefits. . Visits to Other Islands
As well as travelling within Efate, air tourists are keen to see other islands. Some 22
percent of the sample visited these other islands. Some visited more than one other
island. Similar percentages for cruise visitors and yacht visitors are 16 percent and 74
percent. Cruise visitors are travelling on their respective cruise ships and yacht
visitors are using their yachts for visiting the other islands. Percentages visiting
individual islands are shown in the table below.
Table 17: International Visitors Travelling To Other Islands
Island Air Tourists Percent
Cruise Visitors Percent
Yacht Visitors Percent
Santo 10 13.6 30 Tanna 12 0.0 44 Malekula 2.3 9.1 48 Ambrym 1.7 n/a 46 Pentecost 0.6 n/a n/a Ambae 1.1 n/a n/a Mystery n/a 0.7 n/a Others 3.6 0.7 41
Source: 2007 Sample Surveys
Transport Costs
6 The term ‘Tours and Activities’ was left open to the interpretation of the respondents, although it is likely that as the question relates to expenditure he/she will have perceived it as commercial arrangement or organised tour.
MCA Vanuatu – Tourism Survey – Baseline Study Final Report - Appendices
TRIP Consultants www.tripconsultants.net
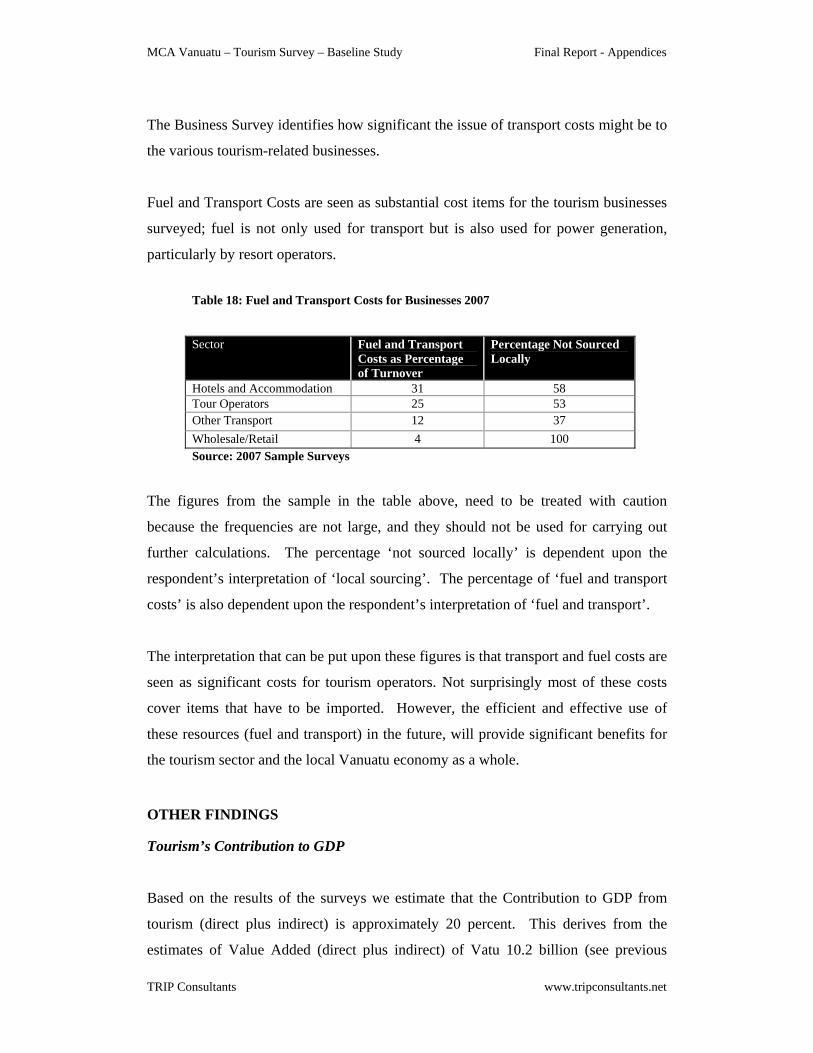
The Business Survey identifies how significant the issue of transport costs might be to
the various tourism-related businesses.
Fuel and Transport Costs are seen as substantial cost items for the tourism businesses
surveyed; fuel is not only used for transport but is also used for power generation,
particularly by resort operators.
Table 18: Fuel and Transport Costs for Businesses 2007
Sector Fuel and Transport Costs as Percentage of Turnover
Percentage Not Sourced Locally
Hotels and Accommodation 31 58 Tour Operators 25 53 Other Transport 12 37 Wholesale/Retail 4 100
Source: 2007 Sample Surveys
The figures from the sample in the table above, need to be treated with caution
because the frequencies are not large, and they should not be used for carrying out
further calculations. The percentage ‘not sourced locally’ is dependent upon the
respondent’s interpretation of ‘local sourcing’. The percentage of ‘fuel and transport
costs’ is also dependent upon the respondent’s interpretation of ‘fuel and transport’.
The interpretation that can be put upon these figures is that transport and fuel costs are
seen as significant costs for tourism operators. Not surprisingly most of these costs
cover items that have to be imported. However, the efficient and effective use of
these resources (fuel and transport) in the future, will provide significant benefits for
the tourism sector and the local Vanuatu economy as a whole. OTHER FINDINGS Tourism’s Contribution to GDP
Based on the results of the surveys we estimate that the Contribution to GDP from
tourism (direct plus indirect) is approximately 20 percent. This derives from the
estimates of Value Added (direct plus indirect) of Vatu 10.2 billion (see previous

MCA Vanuatu – Tourism Survey – Baseline Study Final Report - Appendices
TRIP Consultants www.tripconsultants.net
paragraphs under Multiplier Effect), against an estimated GDP of Vatu 50 billion for
the Year 2007. The National Accounts for 2007 have not yet been completed but we
have estimated the GDP will be around Vatu 50 billion in 2007. This figure of Vatu
50 billion is a Consultant’s estimate based upon the National Account Statistics, the
Government Budget and discussions with the National Statistical Office (National
Accounts estimates of GDP for the years 2001 – 2006 are illustrated in Attachment 1
Appendix VIH).7
Leakage
‘Leakage’ or its opposite ‘Retention’ tends to revolve around: -
• Bringing in goods and services from outside of Vanuatu as part of normal
operations
• Remissions of salaries by expatriate workers in the industry
• Remission of Profits by overseas investors
Each of these is discussed below.
Imports and Goods and Services The sample gave an indication of the goods and services that they needed to source
outside of local sources.
Table 19: Import Support for Operations – By Type of Business
Hotel/
Accommodation
Tour operator/
Inbound
operator
Other
transport
Retail/
shops
Other
services Total
Intermediate Consumption
(IC) as a percentage of gross
revenue 59.2 55.1 54.0 44.9 50.1 55.3
7 In making the estimate of GDP for 2007 the following were consulted ; the Government Budget, The Department of Economic and Social Development and the National Accounts Section in the NSO. The estimate of 50 Billion GDP was discussed with NSO National Accounts section and considered to be the most realistic at the time of calculation (April 2007).

MCA Vanuatu – Tourism Survey – Baseline Study Final Report - Appendices
TRIP Consultants www.tripconsultants.net
Import as % of IC 49% 49% 26% 24% 43% 49%
Source: 2007 Business Survey
The sample indicates a relatively high level of support from sources outside of
Vanuatu. This reflects the modest scale of the Vanuatu economy. The principal
economic impact is that money used for imports that could have circulated within the
Vanuatu economy now circulates within the economy supplying the necessary goods
and services.
The overall implication is that, according to the sample, about 27 percent of gross
revenues from tourism has to be used to bring in goods and services from overseas for
normal operations.
Remissions of expatriate salaries
According to the sample, the numbers of expatriates concerned with tourism is only
about 3.6 percent of the tourism workforce. Mostly they are management level/
specialist level/ owners of businesses. There are no significant numbers of low-cost
expatriate workers as occurs, say, in the Middle East or in London. Some of the
expatriates will be remitting parts of their salary overseas, but overall it looks unlikely
that this will exceed 1 percent of gross revenues from tourism.
Remissions of profits to overseas investors
According to the sample, the breakdown between businesses with majority of
Vanuatu shareholders and businesses with the majority of foreign shareholders is
54:46 when viewing the control over gross revenues/ turnover.
Since typical gross operating profits are only 18 percent of gross revenue to meet all
financial charges, there appears to be relatively modest scope for remitting profits to
overseas shareholders in the businesses. The maximum potential might be 1 or 2
percent of gross revenues. Of course, this can always change from year to year.

MCA Vanuatu – Tourism Survey – Baseline Study Final Report - Appendices
TRIP Consultants www.tripconsultants.net
For the purposes of the ‘Baseline Figure for Year 2007’ we estimate that the leakage
factor is approximately 30 percent (ie 27 percent (imports) plus 1 percent (expat
remissions) plus 2 percent (profit remissions)).
Clearly there would be positive local impacts if this figure could be reduced. This
will be a challenge for the Vanuatu economy, but the opening up of new areas with
infrastructure improvements (notably roads) will help to achieve this by encouraging
increased production for the local market and increased tourism supplies for local
tourism businesses. (See Business Survey – Appendix VIH)
Foreign Exchange Earnings
International tourism spending within Vanuatu is estimated to be approximately Vatu
14.7 billion in 2007, both direct expenditure by tourists and expenditure on behalf of
tourists by tour operators etc. This represents the gross foreign exchange earnings for
Vanuatu from tourism. With a 30 percent leakage, it can be estimated that the net
foreign exchange earnings are approximately Vatu 10.3 billion. We estimate these as
the key baseline figures for foreign exchange earnings associated with international
tourist expenditure.
SUMMARY OF THE BASELINE FIGURES
The main Baseline Measures estimated from the results of the 2007 Tourism Survey
are summarised in the table below.
Table 20: Summary of Baseline Figures - 2007
Item Units Baseline Figure 2007
Total Tourist Expenditure Vatu billion 17.85
Total International Tourist Expenditure
Vatu billion 14.88
Direct Value added/ Local incomes deriving from Tourist Expenditure
Vatu billion 7.97
Direct + Indirect Value added/ Local incomes deriving from Tourist Expenditure
Vatu billion 10.2

MCA Vanuatu – Tourism Survey – Baseline Study Final Report - Appendices
TRIP Consultants www.tripconsultants.net
Employment Full Time Equivalents
3,800
Contribution to GDP (Direct + Indirect) arising from Tourist Expenditure
Percent 20%
Gross Foreign Exchange Earnings Vatu billion 14.9
Net Foreign Exchange Earnings Vatu billion 10.4
Source: 2007 Sample Surveys/Consultants Estimates
5. CONCLUSIONS AND RECOMMENDATIONS
CONCLUSIONS
A number of conclusions can be drawn from the Baseline Survey as follows:
1. Tourism is a vital and significant sector in the Vanuatu economy in terms of
income and employment accounting for approximately 20 percent of GDP and
3,800 FTEs.
2. International tourist expenditure is the most important component in terms of
economic impact, accounting for 84 percent of the total; international visitors
who arrive by air have the highest level of overall expenditure, although cruise
ship visitors have the highest level of expenditure per day.
3. International visitation to Vanuatu and tourist expenditure are both highly
focussed on the capital Port Vila; international tourists do visit other parts of
the main island fairly extensively.
4. Tourist visitation and economic impact on the other islands is limited and
mainly focussed on Santo and Tanna.
5. Transportation costs are a significant part of the overall costs of operation for
tourism businesses in Vanuatu.
6. The leakage factor for tourism is high at 30 percent, which reflects the small
productive base of the Vanuatu economy.
MCA Vanuatu – Tourism Survey – Baseline Study Final Report - Appendices
TRIP Consultants www.tripconsultants.net
7. The Baseline Survey provides valuable data to not only assist with the
Monitoring and Evaluation of the MCA Project, but also to support the
development of Vanuatu Government tourism policy and marketing initiatives
by both government and the private sector.
LESSONS LEARNED AND RECOMMENDATIONS
In undertaking the Baseline Survey the following issues have been identified and
it is recommended that these are considered in the Final Survey:
1. The collection of data for the international tourism survey was hindered by
the late opening of the Immigration facilities and hence the departure lounge;
this was despite repeated requests from MCA for the Department of
Immigration to arrive at least one and a half hours before departure to enable
the enumerators to undertake the survey in a timely manner. Additional costs
were incurred by the contractor as a result and the Department of Immigration
and attempts should be made to have the departure lounge open earlier for the
Final Survey.
2. The visitation of yachts to Port Vila, has proven to be highly seasonal, with
few visits between November and March; this seasonality issue will need to
be addressed in the Final Survey.
3. There has been significant interest in the results of the survey from a wide
range of stakeholders, but specifically from the private sector operators in
Vanuatu. The results of the Baseline Tourism Survey should be disseminated
at a series of presentations for tourism industry stakeholders and incorporated
in the planning of the sector by the Government.
MCA Vanuatu – Tourism Survey – Baseline Study Final Report - Appendices
TRIP Consultants www.tripconsultants.net
MCA VANUATU
TOURISM SURVEY
BASELINE STUDY 2007
APPENDICES
Appendix I: Terms of Reference
Appendix II: Survey Questionnaires
• Appendix II A – International Visitor Survey - Questionnaire • Appendix II B – Domestic Visitor Survey - Questionnaire • Appendix II C – Cruise Ship Visitor Survey - Questionnaire • Appendix II D – Tourism Business Survey - Questionnaire • Appendix II E – Yacht Visitor Survey - Questionnaire
Appendix III: Record of Refusals
• Appendix III A - International Visitor Survey • Appendix III B – Cruise Ship Visitor Survey
Appendix IV: Monthly Exchange Rates Used in Currency
Conversions Appendix V: Additional Data Entry Codes Appendix VI: Key Findings and Tables
• Appendix VI A – International Air Survey • Appendix VI B – International Air Survey – Santo • Appendix VI C – Cruise Visitor Survey • Appendix VI D – Yacht Visitor Survey • Appendix VI E – Domestic Tourism Survey • Appendix VI F – Background Statistics on Employment • Appendix VI G – Transport Issues • Appendix VI H – Tourism Business Survey

MCA Vanuatu – Tourism Survey – Baseline Study Final Report - Appendices
TRIP Consultants www.tripconsultants.net
APPENDIX I – TERMS OF REFERENCE
Millennium Challenge Account – Vanuatu Terms of Reference
Tourism Survey
1. BACKGROUND
1.1 Introduction
The Government of the Republic of Vanuatu has received a grant from the Government of the United States of America through the Millennium Challenge Corporation (MCC) to support a five-year Program of investments in the Transport Sector, aimed at facilitating poverty reduction through economic growth. Vanuatu is now beginning the implementation phase, including setting up of performance monitoring and data collection system. The Program, which was developed by the country through a consultative process, is designed to reduce poverty through infrastructure development to enable farmers in rural areas to get their produce to the markets and to foster development of the tourism industry.
The Government of Vanuatu has established an MCA-Vanuatu Unit within the Ministry of Finance and Economic Management to work full-time on implementing and managing the Program. Given that the Compact and supplemental agreements have been signed, MCA-Vanuatu has now become a Project Management Unit charged with the responsibility of implementation and monitoring of the Program. The Project Management Unit is governed by the Compact and other Supplemental Agreements. One of the main responsibilities of the Unit is to monitor and evaluate the progress of the program, as outlined in the Monitoring and Evaluation Plan. Monitoring and evaluation of the program is essential to measure the economic and social impacts of the program on the population. Monitoring and evaluation activities also will allow both MCC and MCA-Vanuatu to determine whether the program has achieved its goals of increasing income of the rural poor, reducing poverty and increasing employment. In particular, the improvements in physical infrastructure are expected to spur growth in the tourism industry. Consequently, a tourism baseline survey and follow-up survey are needed to establish baseline data for the tourism indicators in the Monitoring and Evaluation Plan and then to track changes in the industry over time to assess the program’s impact on the tourism sector. The assignment will include a baseline survey and a follow-up survey at the end of the five-year program. The survey will collect data in three areas: tourism expenditure, tourism employment, and income from tourism (value-added for businesses and household income). Overall, the data collected will measure the industry’s current contribution to Vanuatu’s economy and household welfare, track over time how that contribution changes, and, given the nature of the MCA program, examine how changes in transport infrastructure and services effect the development of the tourism industry and the income and employment derived from it. 1.2 The Economy
Vanuatu’s economy is small, open, vulnerable and dualistic in nature, in the sense that both the formal and informal sectors play an important role in the economy. Vanuatu’s economy is dominated by subsistence farming. Its small size makes it difficult to achieve economies of

MCA Vanuatu – Tourism Survey – Baseline Study Final Report - Appendices
TRIP Consultants www.tripconsultants.net
scale, resulting in high production costs. This is reinforced by the geographic characteristics of the country. Vanuatu’s location makes the country prone to natural disasters such as earthquakes, cyclones, and volcanic eruptions, which place a lot of pressure on government finances due to constant repairs of infrastructure and social services. Given the large role that commodity exports play in the economy, the country experiences further vulnerability due to fluctuations in international commodity prices. As a small, open economy, the importance of agriculture and tourism to Vanuatu’s growth is apparent in their current contribution to foreign exchange receipts. Vanuatu’s endowment of natural tourist attractions (beaches, volcanoes, and waterfalls) suggests that there is potential for growth in the tourism sector. A substantial percentage of Vanuatu’s population are employed in the agriculture and tourism sectors. The structure of Vanuatu’s economy can broadly be summarised by looking at the share of each sector as a percentage of the overall GDP in constant prices8. Such a view yields the following for Vanuatu:
The primary sector represents 17.6% of GDP (in constant prices). Industry, including manufacturing, construction, utilities and subsistence
construction, represents about 9.2% of GDP. 73.2% of Vanuatu’s GDP is produced by the services sector, which includes retail
trade, hotels and restaurants, transport/communications, finance and insurance, real estate, government services and personal services.
Tourism, defined as foreign tourism and domestic tourism originating largely in Port Vila and Luganville, plays a large role in the service sector. Principally driven by the private sector, the tourism industry has grown substantially in the past few years. Tourism accounted for 40 percent of GDP in 2003. It is estimated that tourism generates some 75 percent of the total foreign exchange earned by Vanuatu, and an estimated 8,000 people are employed in the tourism industry. Despite having a relatively sound macroeconomic environment, economic development has failed to accelerate in recent years, and economic growth has fallen short of population growth. The government identifies the major constraints to economic development as the lack of a stable investment climate for private sector, a lack of income earning opportunities for a fast-growing population due to the high cost of doing business, and poor access to basic health and education services in rural areas. Private sector growth is limited by costly and unreliable infrastructure, land tenure constraints, and lack of a secured transactions framework. It is envisaged that improvement in infrastructure networks will greatly reduce the cost of doing business and therefore improve the environment for private sector investment, especially in tourism and agriculture. 1.3 Summary of MCA Program
Program Goal: the program aims to reduce poverty in Vanuatu by increasing economic activity and the incomes of men and women in rural areas, where 80% of the population resides, through the amelioration of transport infrastructure. Program Objectives: by focusing on one of the principal factors constraining private sector development and access to social services, namely poor roads, wharves and airstrips in the outer islands. The program intends to reduce the transport costs of doing business in Vanuatu. By reducing transportation costs, the program expects to stimulate agricultural and tourism activity in the rural and outer islands, thereby contributing to the program goal of increasing incomes. Program Activities: The cost of the MCA program is approximately $65 million over five years, focused on both the reconstruction of roads, wharves, warehouses and airstrips. The
8 Percentage of overall 2005 real GDP

MCA Vanuatu – Tourism Survey – Baseline Study Final Report - Appendices
TRIP Consultants www.tripconsultants.net
program also includes activities related to institutional strengthening, monitoring and evaluation, financial management and procurement management. 2. OBJECTIVES
The survey should measure and analyse the following, and the Consultant should use this and other existing tourism data to produce data and analysis of tourism’s impact on household income and the economy as a whole. 2.1 Tourism Expenditure
Review and discuss with relevant government counterparts (Ministry of Finance, National Statistical Office, Vanuatu Tourism Office, Vanuatu Tourism Development Office, Millennium Challenge Account, Vanuatu) current national-level estimates of percent contribution of tourism to GDP, estimated direct and indirect tourism contributions to government revenue and percentage contribution of tourism to foreign exchange receipts, and how those estimates are define and calculated.
Estimate total tourism expenditure at the national level, and total tourism expenditure at the local level for the islands of Efate, Tanna, Santo, and Malekula.
Estimate general leakage and import and export leakage at the national level, and at the local level for the islands of Efate, Tanna, Santo, and Malekula, in tourism spending.
Estimate the “multiplier effect” of tourism spending, i.e. for every dollar spent, how much additional spending is generated as a result.
Estimate the beneficiaries of tourism expenditure, disaggregated, as feasible, by gender, income, and other social categories.
Estimated tourism-related expenditure on transport 2.2 Tourism Employment
Estimate the number of tourism-related jobs and percentage of people employed in the tourism industry in both formal and informal sectors at the national level, and at the local level on the islands of Efate, Tanna, Santo, and Malekula.
2.3 Income from Tourism
Estimate average household income from tourism at the local level on the islands of Efate, Tanna, Santo, and Malekula, including informal economic activities and businesses.
Estimate value-added (defined as profits and wages) from formal tourism businesses.
Estimate the average transport costs and other key costs of doing businesses in the tourism industry at the national level.
Estimate key transport costs and other key costs of doing business in the tourism industry at the local level on the islands of Efate, Tanna, Santo, and Malekula.
Estimate transport accessibility and transport services related to tourism at the local level on the islands of Efate, Tanna, Santo, and Malekula.
Estimate and analyze the impact of changes in transport costs, transport accessibility, and transport services on changes in tourism-related income and value-added.
2.4 Sampling Methodology
Develop an appropriate, statistically significant sample size and sampling methodology for each of the survey components outlined above, in consultation with stakeholders such as the Millennium Challenge Account, National Statistics Office, Vanuatu
MCA Vanuatu – Tourism Survey – Baseline Study Final Report - Appendices
TRIP Consultants www.tripconsultants.net
Tourism Office etc. Sampling methodology also should take into account fluctuations in tourism activity between the high and low seasons, and should be representative of visitor profile and behaviour patterns, particularly nationality. Sample population should include the following:
(i) Tourists: Tourists who arrive by Air
Yachties (tourists who arrive by yacht), and
Tourists who arrive on cruise ships (excursionists or day visitors should be surveyed if necessary).
Domestic and other tourists originating in Port Vila or Luganville (users of tourism facilities in those two cities and travellers to other islands).
(ii) Tourism-Related Businesses: Hotels and resorts
Bungalows
Restaurants
Recreation facilities such as Golf course
Rental Car Agencies
Tour Operators(Adventures in Paradise, Horizon Tours)
Water sports
Game fishing
Tourism Organisations (Destination Vanuatu)
Flight operators (Air Vanuatu, Air Club, Unity Airlines, Pacific Blue)
Shop owners or managers
Employees working in the tourism sector, and
Informal businesses, including, handicrafts, etc.
Develop an appropriate sample weighting methodology such that survey results are applicable across the tourism population.
Please note: All definitions of estimates and indicators, sampling methodology, questionnaire and survey instrument development, etc., should be in keeping with best practices on tourism statistics and surveys established by leaders in the field, such as the World Tourism Organization, EuroStat, Statistics New Zealand, and the Australia Bureau of Statistics. 3. SCOPE OF WORK AND TASKS
The assignment includes the following tasks: Task 1: Initial Assessment and Work-Plan Development
The Consultant shall: Be oriented with the MCA program and its monitoring and evaluation component, and
understand the role of the tourism-related indicators and targets Review all existing statistical and survey work done on tourism in the country to date Develop a detailed work-plan and timeline for completing the assignment
Task 2: Survey Design, Planning, and Preparation
The Consultant shall:

MCA Vanuatu – Tourism Survey – Baseline Study Final Report - Appendices
TRIP Consultants www.tripconsultants.net
Consult with key government and other stakeholders to get input and feedback on survey design and preparation, including, but not limited to:
Vanuatu Tourism Office;
National Tourism Development Office;
Vanuatu Hoteliers Association;
Vanuatu Island Bungalows Association;
Tour Operators Association;
Vanuatu Chamber of Commerce and Industries; and
Ministry of Commerce, Trade and Industries
National Statistics Office
Develop an appropriate sampling methodology, survey design, instruments and questionnaires, and implementation plan in keeping with the survey scope identified above.
Develop all necessary and relevant survey documentation and manuals, including documentation of all sampling and survey methodology, interviewer training manuals, quality control procedures, data entry manual, codebooks, and other necessary documentation. Specific format and content of these manuals will be agreed upon between MCA-Vanuatu and the Consultant.
Conduct all relevant pre-testing and revisions on questionnaires.
Hire and train interviewers.
Conduct all relevant system testing and other survey preparation. Task 3: Survey Implementation (Fieldwork, data entry, and data processing)
The Consultant shall: Conduct and oversee all relevant fieldwork during all phases of the baseline and final
surveys. (For an estimated timeline of specific work phases, see Section 8.)
Conduct all relevant data quality checks and other quality control procedures in the field to ensure minimum survey error.
Conduct and oversee all data entry, coding, and data processing.
Provide interim progress reports during fieldwork to MCA-Vanuatu, including reporting on any non-sampling error or other quality issues that arise and actions taken to address them. (Specific content and format will be agreed between MCA-Vanuatu and the Consultant.)
Task 4: Data Cleaning and Analysis
The Consultant shall:
Conduct all data editing, cleaning, and imputation of missing values to create a clean data set.
Conduct analysis on all data collected (Content and methods for such analysis will be agreed upon between the Consultant and MCA-Vanuatu.)
Task 5: Reports
The Consultant shall:
Provide weekly updates by email, or through another means agreed with MCA-Vanuatu, on the assignment’s progress.

MCA Vanuatu – Tourism Survey – Baseline Study Final Report - Appendices
TRIP Consultants www.tripconsultants.net
Produce progress reports for each stage of survey including oral presentations during the Baseline and Final Surveys, so that MCA-Vanuatu is informed about survey activities and can provide input and feedback on necessary revisions, quality control, and other issues.
Produce a report at the end of each phase of work, Baseline and Final Surveys that outlines all results and includes all summary tables. Specific content and format for each report will be agreed upon between MCA-Vanuatu and the Consultant.
Produce a final report at the end of the Final Survey that covers all results and includes all summary tables of both phases of Survey. Specific content and format for each report will be agreed upon between MCA-Vanuatu and the Consultant.
4. DELIVERABLES
The Consultant will be responsible for submitting the following deliverables. All deliverables must be submitted in English, and in both hard-copy and electronic form, unless otherwise agreed to with MCA-Vanuatu. Deliverables will be submitted according to a timeline agreed to by the Consultant and MCA-Vanuatu during negotiations of the contract and included in the final contract. MCA-Vanuatu will have one (1) week to review the deliverable and notify the Consultant of any questions or concerns, and the Consultant will then make any necessary revisions. The Consultant will provide MCA-Vanuatu and MCC with the final report or deliverable no later than two weeks after the clarification meeting occurs, as outlined below.
Note: The specific content and format of all write-ups and reports will be agreed upon between the Consultant and MCA-Vanuatu.
The deliverables are as follows: Task 1: Initial Assessment and Work-Plan Development
Detailed work-plan and timeline for completing the assignment Task 2: Survey Design, Planning, and Preparation
Short report on results of assessment of existing tourism statistical work and consultations with government stakeholders on survey design.
Write-up of sampling methodology, survey design, and implementation plan in keeping with the survey scope identified above.
Survey questionnaires, including draft questionnaires for comment and feedback from MCA-Vanuatu
Survey documentation and manuals, including documentation of all sampling and survey methodology, interviewer training manuals, quality control procedures, data entry manual, codebooks, and other necessary documentation. Specific format and content of these manuals will be agreed upon between MCA-Vanuatu and the Consultant.
Oral and written updates on pre-testing and revisions on questionnaires.
Hiring and training of interviewers
Oral and written updates on all relevant system testing and other survey preparation. Task 3: Survey Implementation (Fieldwork, data entry, and data processing)
All relevant fieldwork during all phases of the baseline and final surveys. (For an estimated timeline of specific work phases, see Section 8.)
Relevant data quality checks and other quality control procedures in the field to ensure minimum survey error.

MCA Vanuatu – Tourism Survey – Baseline Study Final Report - Appendices
TRIP Consultants www.tripconsultants.net
Conduct and oversee all data entry, coding, and data processing.
Interim progress reports during fieldwork to MCA-Vanuatu, including reporting on any non-sampling error or other quality issues that arise and actions taken to address them. (Specific content and format will be agreed between MCA-Vanuatu and the Consultant.)
Task 4: Data Cleaning and Analysis
Final, clean data set.
Results and analysis on all data collected (Content and methods for such analysis will be agreed upon between the Consultant and MCA-Vanuatu.)
Task 5: Progress and Final Reports
Provide weekly updates by email, or through another means agreed with MCA-Vanuatu, on the assignment’s progress.
Produce progress reports for each stage of survey including oral presentations during the Baseline and Final Surveys, so that MCA-Vanuatu is informed about survey activities and can provide input and feedback on necessary revisions, quality control, and other issues.
Produce a report at the end of each phase of work, Baseline and Final Surveys that outlines all results and includes all summary tables. The report should contain the methodology, key findings of the survey, recommendations and conclusion. Specific content and format for each report will be agreed upon between MCA-Vanuatu and the Consultant.
Produce a final report at the end of the Final Survey that covers all results and includes all summary tables of both phases of Survey. Specific content and format for each report will be agreed upon between MCA-Vanuatu and the Consultant.
The Consultant is expected to provide three (3) hard copies of the report as well as provide the electronic copy of all reports mentioned above.
5. CONSULTANT CAPACITY.
The Consultant must demonstrate the capacity and ability to manage and carry out the Tourism Survey in terms of economic and financial capacity, general management and availability of professional staff to replace Personnel where necessary and the ability to administer and provide the necessary back-up services to support the Survey team. The ability to provide the required equipment and furnishings is also required.
A. Economic and Financial capacity
The Consultant’s financial and economic capacity and its sustainability to support the Tourism Survey Team and provide the necessary initial financing is imperative. In its Proposal the Consultant is required to provide information on its financial and economic status. The information required should be completed using the form provided in the RFP. B. General Management and Professional Staff of the Consultant
The structure of the Consultant must demonstrate the ability to manage the Survey, provide the necessary technical support and, where necessary, provide replacement staff at short notice. The Consultant is required to submit an organization chart showing the numbers of staff and their positions. In addition, the CV of the proposed home-office Project Director must be provided.

MCA Vanuatu – Tourism Survey – Baseline Study Final Report - Appendices
TRIP Consultants www.tripconsultants.net
C. Consultant’s Past Experience relevant to Tourism Survey
The Consultant should at a minimum demonstrate that it has past experience relevant to performing the services needed for this assignment.
Experience gained by the Consultant should include relevant experience of working on similar tourism projects, of working in similar countries and experience in understanding of international best practices in similar projects.
The Consultant should provide references for at least 3 completed projects. 6. KEY PERSONNEL
The staffing requirements to carry out the survey will be determined by the Consultant. The Consultant should provide an organization chart of the team structure, together with a description of the composition of the team and task assignment. The eventual total size of the team will depend on the phases and activities of the survey. Full staffing may not be required at the beginning of the project and will take place as and when the volume of work requires it. As a minimum, initial staffing should consist of a Statistician and a Survey Manager. A Tourism Expert should be readily available to provide professional advice to the team as necessary on content and analysis issues, particularly during questionnaire design and data analysis. It is also envisage that a propose home- office Project Director is identified in order to address problems should any arise. The Proposals shall include the CV of each of these key personnel and a statement of exclusivity and availability completed by each. A. Statistician
The Statistician will, as a minimum, possess the following qualifications, skills and professional experience:
Should possess an advanced degree in statistics, with approximately 10 years or more experience in survey design and management, and expertise in tourism surveys and studies.
Should have experience in conducting surveys and have an advanced knowledge in quantitative analysis.
Should possess the knowledge and ability to develop questionnaires and effectively conduct interviews.
Ability to design and undertake empirical and investigative studies on issues pertaining to tourism analysis.
Should be able to select and use a wide variety of qualitative and quantitative data to provide a reliable analysis.
Good written and verbal communication skills in English. Understanding of French and Bislama is an advantage;
Should have experience working in similar countries. Experience of working in Vanuatu or any other countries in the South Pacific is an advantage.
Computer literate B. Survey Manager
The Survey Manager will, as a minimum, possess the following qualifications, skills and professional experience:
Should possess a university degree in statistics or relevant subjects;
Should have approximately 5 years or more experience of managing and conducting

MCA Vanuatu – Tourism Survey – Baseline Study Final Report - Appendices
TRIP Consultants www.tripconsultants.net
surveys;
Should possess excellent communication skills and experience in working with a wide range of individuals in government, private sector, NGO and civil society;
Good written and verbal communication skills in English. Understanding of French and/or Bislama is an advantage;
Should have experience working in similar countries. Experience of working in Vanuatu or any other countries in the South Pacific is an advantage;
Computer literate. C. Tourism Expert
The tourism expert will, as a minimum, possess the following qualifications, skills and professional experience:
Should possess an advance degree in tourism studies or related fields;
Should have approximately 10 years or more experience in conducting tourism related studies and/or surveys;
Familiarity with the Vanuatu tourism industry or similar countries;
Good written and verbal communication skills in English. Understanding of French and/or Bislama is an advantage;
Extensive knowledge of regional and international tourist industry;
Familiarity with internationally recognise tourism indicators such as those of the World Tourism Organization;
Should have experience working in similar countries. Experience of working in Vanuatu or any other countries in the South Pacific is an advantage.
Computer literate. 7. TERMS OF SERVICE
The Consultant shall have access to all M&E documents available with MCA-Vanuatu and other available documents related to tourism done by various institutions. These documents will be provided at the start of the assignment. While the Consultant will receive the necessary government authority to undertake official data collection, the Consultant shall be bound by confidentiality and other Acts such as the National Statistics Act of 1983.
The Consultant shall ensure that experts are adequately supported and equipped. It is envisaged that the minimum provision should comprise computers with appropriate software, complementary office furniture and communication equipment. The Consultant shall ensure that there is sufficient administrative, secretarial and interpreting provision to enable experts to concentrate on their primary responsibilities. In addition, the Consultant should allow for all costs associated with the following expenses:
Costs of consumables including telecommunication, stationary, printing, office equipment consumables.
Local transport required for the experts to effectively carry out their duties.
Reproduction of the Consultant’s reports and any special or ad hoc reports requested by MCA Vanuatu or MCC.
Consultant will be responsible for providing accommodation, in Vanuatu, for key personnel and for short term Consultants and head office staff on mission in Vanuatu.
MCA Vanuatu – Tourism Survey – Baseline Study Final Report - Appendices
TRIP Consultants www.tripconsultants.net
Air fares, travel expenses and other costs relating to the travel of employees, their dependents or Consultants engaged by the Consultant shall be the responsibility of the Consultant.
The Consultant shall provide adequate medical protection (insurance cover) for all key personnel and for short term Consultants and head office staff on mission in Vanuatu.
Any other unspecified costs.
The Consultant is responsible for meeting all contract objectives, delivery of outputs and results and should provide corresponding backstopping and oversight services on its account. The Consultant will describe in its Proposal its system of quality assurance and how its head office will support the experts on site with all required logistic and technical support. The Consultant shall include a statement in its Proposal as to the arrangements for subject matter specific backstopping of all of the key experts. 8. DURATION
The Consultant is expected to carry out a baseline survey at the start of the contract and a follow-up survey in December 2009 to November 2010. The baseline survey should commence once the contract has been signed and a schedule is agreed upon between MCA-Vanuatu and the Consultant. Once the basic schedule is agreed upon, the Consultant will be expected to produce a detailed timeline with all activities and deliverables to be submitted as part of the Work-Plan. Baseline Survey Estimated Date* Consultant Mobilization Dec. 2006 Submission of Work-Plan and Detailed Schedule Jan. 2007 Survey Design, Preparation and Planning Feb. 2007 1st Round of Data Collection – Low Season Mar. – May 2007 1st Progress Report to MCA-Vanuatu June 2007 2nd Round of Data Collection – High Season June – Aug. 2007 2nd Progress Report to MCA-Vanuatu Sept. 2007 3rd Round of Data Collection – Low Season Sept. – Nov. 2007 3rd Progress Report to MCA-Vanuatu Dec 2007 4th Round of Data Collection – Holiday Season – Dec. 2007 Dec.2007 – Jan 2008 Draft Report on Baseline Survey Feb. 2008 Final Report on Baseline Survey Mar. 2008 Final Survey Consultant’s Re-mobilization, Work Plan and detail schedule including revised survey design (if any), preparation and planning
Nov. 2009
1st Round of Data Collection – Holiday Season Dec. 2009– Jan 2010 4th Progress Report to MCA-Vanuatu Feb. 2010 2nd Round of Data Collection – Low Season Mar – May. 2010 5th Progress Report to MCA-Vanuatu June. 2010 3rd Round of Data Collection – High Season June. – Aug. 2010 6th Progress Report to MCA-Vanuatu Sept 2010

MCA Vanuatu – Tourism Survey – Baseline Study Final Report - Appendices
TRIP Consultants www.tripconsultants.net
4th Round of Data Collection – Holiday Season – Dec. 2007 Sept. – Nov 2011 Draft Report on Final Survey Dec. 2010 Final Report on Final Survey Jan. 2011 Final Report on Baseline and Final Survey Feb. 2011 * The above dates are indicative only and will be finalized during negotiations and will be included in the contract agreement.
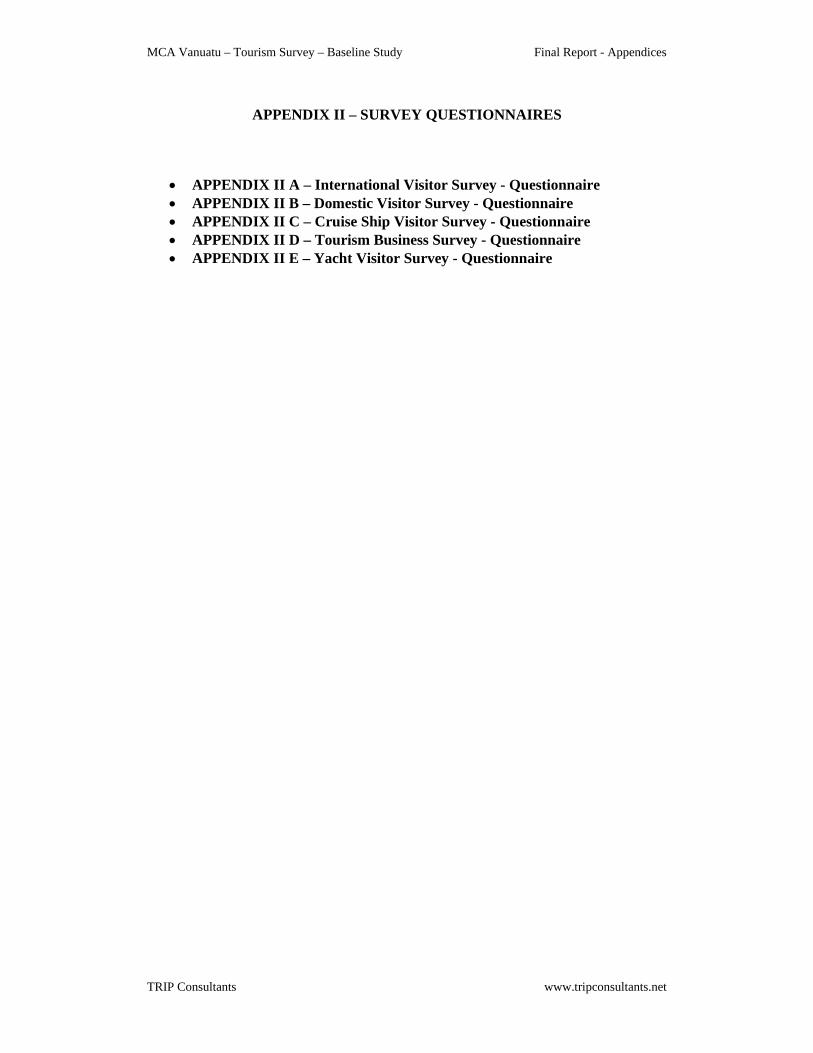
MCA Vanuatu – Tourism Survey – Baseline Study Final Report - Appendices
TRIP Consultants www.tripconsultants.net
APPENDIX II – SURVEY QUESTIONNAIRES
• APPENDIX II A – International Visitor Survey - Questionnaire • APPENDIX II B – Domestic Visitor Survey - Questionnaire • APPENDIX II C – Cruise Ship Visitor Survey - Questionnaire • APPENDIX II D – Tourism Business Survey - Questionnaire • APPENDIX II E – Yacht Visitor Survey - Questionnaire

MCA Vanuatu – Tourism Survey – Baseline Study Final Report - Appendices
TRIP Consultants www.tripconsultants.net
APPENDIX III – RECORD OF REFUSALS
APPENDIX III A – International Visitor Survey
INTERNATIONAL VISITORS SURVEY – RECORD OF REFUSALS
TO PARTICIPATE
DATE GENDER ESTIMATED AGE
08/08/07 MALE 60-70 09/08/07 MALE 25-35 10/08/07 MALE/FEMALE 50-65 10/08/07 FEMALE 25-40 10/08/07 MALE/FEMALE 50-65 13/08/07 MALE 25-35 13/08/07 MALE 45-55 16/08/07 FEMALE 45-55 17/08/07 MALE 50-65 17/08/07 FEMALE 50-60 20/08/07 FEMALE 30-40 20/08/07 FEMALE 30-40 21/08/07 MALE/FEMALE 50-65 22/08/07 MALE 25-35 22/08/07 MALE 40-55 22/08/07 MALE 30-40 25/08/07 FEMALE 45-50 27/08/07 MALE 30-45 27/08/07 FEMALE 20-30 27/08/07 MALE 35-40 29/08/07 MALE 25-35 31/08/07 FEMALE 50-60 31/08/07 FEMALE 50-60 31/08/07 FEMALE 55-65 31/08/07 MALE/FEMALE 40-50 01/10/07 FEMALE 35-40 04/10/07 MALE 30-40 05/10/07 MALE 40-50 06/10/07 MALE 50-60 08/10/07 FEMALE 50-60 08/10/07 FEMALE 50-60 10/10/07 MALE 30-40 11/10/07 MALE 50-60 12/10/07 MALE 30-40 12/10/07 MALE 30-40 15/10/07 MALE 30-40 15/10/07 MALE 30-40 15/10/07 FEMALE 30-40 15/10/07 MALE 45-55 15/10/07 MALE 45-55 19/10/07 MALE 50-60 19/10/07 MALE 50-60 22/10/07 MALE 55-65 22/10/07 MALE 45-55 22/10/07 FEMALE 20-30 24/10/07 FEMALE 45-55

MCA Vanuatu – Tourism Survey – Baseline Study Final Report - Appendices
TRIP Consultants www.tripconsultants.net
25/10/07 FEMALE 45-55 26/10/07 FEMALE 50-55 26/10/07 FEMALE 35-45 19/11/07 MALE 30-40 21/11/07 FEMALE 35-45 22/11/07 MALE 45-55 22/11/07 FEMALE 55-65 22/11/07 FEMALE 55-65 23/11/07 MALE 25-35 23/11/07 MALE 20-25 23/11/07 MALE 40-50 23/11/07 MALE 35-45 23/11/07 FEMALE 40-50 26/11/07 MALE 35-45 26/11/07 MALE 30-40 27/11/07 MALE 55-65 27/11/07 FEMALE 30-40 28/11/07 FEMALE 35-45 30/11/07 FEMALE 40-50 01/12/07 FEMALE 25-35 01/12/07 FEMALE 35-45 01/12/07 MALE 30-40 01/12/07 FEMALE 25-35 03/12/07 MALE 55-65 03/12/07 MALE 60-65 03/12/07 FEMALE 20-30 04/12/07 MALE 25-35 05/12/07 FEMALE 25-35 06/12/07 MALE 25-35 07/12/07 FEMALE 18-25 07/12/07 MALE 50-60 07/12/07 MALE 45-55 08/12/07 MALE 45-55 09/12/07 MALE 45-55 10/12/07 MALE 35-45 12/12/07 MALE 40-50 13/12/07 FEMALE 20-30 14/12/07 FEMALE 45-50 14/12/07 MALE 18-25 14/12/07 MALE 40-45 14/12/07 FEMALE 25-30 14/12/07 MALE 45-55 14/12/07 MALE 50-60 14/12/07 MALE 20-30 15/12/07 MALE 25-35 15/12/07 MALE 40-50 15/12/07 MALE 30-40 04/02/08 MALE 20-30 04/02/08 FEMALE 40-50 05/02/08 FEMALE N/K 06/02/08 FEMALE 25-30 06/02/08 MALE 55-65 06/02/08 FEMALE 35-45 06/02/08 FEMALE N/K 06/02/08 MALE N/K 08/02/08 MALE 35-45 08/02/08 MALE 60-65 08/02/08 MALE 30-40

MCA Vanuatu – Tourism Survey – Baseline Study Final Report - Appendices
TRIP Consultants www.tripconsultants.net
08/02/08 MALE 40-50 08/02/08 MALE 30-40 09/02/08 MALE 25-35 10/02/08 MALE 40-50 10/02/08 MALE N/K 11/02/08 MALE 25-35 11/02/08 MALE 40-50 11/02/08 MALE 30-40 11/02/08 MALE 35-45 12/02/08 MALE N/K 12/02/08 MALE N/K 13/02/08 FEMALE N/K 13/02/08 MALE N/K 13/02/08 MALE N/K 15/02/08 MALE 40-50 15/02/08 MALE 45-55 15/02/08 MALE 55-65 16/02/08 MALE 45-50 16/02/08 FEMALE 45-55 16/02/08 MALE N/K 16/02/08 MALE N/K 16/02/08 MALE N/K 16/02/08 FEMALE N/K 16/02/08 MALE N/K 17/02/08 MALE N/K 17/02/08 FEMALE N/K 17/02/08 FEMALE N/K 18/02/08 MALE 40-50 18/02/08 MALE 55-65 18/02/08 FEMALE 25-35 18/02/08 FEMALE 45-55 20/02/08 FEMALE 40-50 20/02/08 MALE 50-60 20/02/08 FEMALE 20-30 20/02/08 FEMALE 30-35 20/02/08 MALE 45-55 20/02/08 MALE 50-60 20/02/08 MALE 30-40 22/02/08 MALE 50-60 22/02/08 MALE 60-65 23/02/08 MALE 50-60 23/02/08 MALE 50-60 23/02/08 MALE 45-55 23/02/08 MALE 45-55 23/02/08 FEMALE 45-55 24/02/08 MALE 45-55 24/02/08 FEMALE N/K 25/02/08 MALE 55-65 25/02/08 MALE N/K 25/02/08 MALE N/K 25/02/08 MALE N/K 25/02/08 MALE N/K 25/02/08 MALE N/K 27/02/08 MALE 45-55 28/02/08 FEMALE 40-50 29/02/08 FEMALE 25-35

MCA Vanuatu – Tourism Survey – Baseline Study Final Report - Appendices
TRIP Consultants www.tripconsultants.net
APPENDIX III B – Cruise Ship Visitor Survey – Record of Refusals
CRUISE SHIP SURVEY – RECORD OF REFUSALS
DATE/SHIP GENDER AGE
03/10/07 – PAC STAR MALE 45-55 03/10/07 – PAC STAR FEMALE 55-60 03/10/07 – PAC STAR FEMALE 25-35 03/10/07 – PAC STAR FEMALE 35-40 03/10/07 – PAC STAR FEMALE 25-30 03/10/07 – PAC STAR FEMALE 30-35 03/10/07 – PAC STAR FEMALE 35-40 03/10/07 – PAC STAR MALE 25-30 03/10/07 – PAC STAR FEMALE 35-40 03/10/07 – PAC STAR MALE 40-45 03/10/07 – PAC STAR FEMALE 50-60 03/10/07 – PAC STAR FEMALE 35-40 03/10/07 – PAC STAR FEMALE 35-40 03/10/07 – PAC STAR FEMALE 35-45 03/10/07 – PAC STAR FEMALE 50-60 03/10/07 – PAC STAR MALE 50-60 03/10/07 – PAC STAR FEMALE 45-55 03/10/07 – PAC STAR FEMALE 40-50 03/10/07 – PAC STAR FEMALE 45-55 03/10/07 – PAC STAR FEMALE 50-60 03/10/07 – PAC STAR MALE 35-45 17/10/07 – PAC STAR FEMALE 55-65 17/10/07 – PAC STAR FEMALE 40-50 17/10/07 – PAC STAR FEMALE 55-65 17/10/07 – PAC STAR FEMALE 40-50 17/10/07 – PAC STAR FEMALE 40-50 17/10/07 – PAC STAR FEMALE 50-60 17/10/07 – PAC STAR FEMALE 60-65 17/10/07 – PAC STAR MALE 35-45 17/10/07 – PAC STAR FEMALE 30-35 17/10/07 – PAC STAR MALE 40-50 17/10/07 – PAC STAR FEMALE 40-50 17/10/07 – PAC STAR MALE 50-60 17/10/07 – PAC STAR FEMALE 50-60 17/10/07 – PAC STAR FEMALE 50-60 17/10/07 – PAC STAR FEMALE 30-40 17/10/07 – PAC STAR FEMALE 30-40 17/10/07 – PAC STAR FEMALE 25-35 17/10/07 – PAC STAR FEMALE 60-65 17/10/07 – PAC STAR MALE 55-65 17/10/07 – PAC STAR FEMALE 35-45 17/10/07 – PAC STAR FEMALE 30-40 17/10/07 – PAC STAR FEMALE 40-50 17/10/07 – PAC STAR FEMALE 45-55 17/10/07 – PAC STAR FEMALE 45-55 17/10/07 – PAC STAR FEMALE 40-50 17/10/07 – PAC STAR FEMALE 45-55 24/10/07 – PAC STAR FEMALE 55-65 24/10/07 – PAC STAR FEMALE 60-70

MCA Vanuatu – Tourism Survey – Baseline Study Final Report - Appendices
TRIP Consultants www.tripconsultants.net
24/10/07 – PAC STAR MALE 50-60 24/10/07 – PAC STAR FEMALE 45-55 24/10/07 – PAC STAR MALE 20-30 24/10/07 – PAC STAR MALE 25-35 24/10/07 – PAC STAR FEMALE 55-65 24/10/07 – PAC STAR FEMALE 50-60 24/10/07 – PAC STAR FEMALE 50-60 24/10/07 – PAC STAR FEMALE 30-40 24/10/07 – PAC STAR MALE 40-50 24/10/07 – PAC STAR FEMALE 45-55 24/10/07 – PAC STAR MALE 45-55 24/10/07 – PAC STAR FEMALE 45-55 24/10/07 – PAC STAR MALE 35-45 24/10/07 – PAC STAR MALE 50-60 07/11/07 – PAC STAR MALE 45-55 07/11/07 – PAC STAR MALE 45-55 07/11/07 – PAC STAR MALE 50-60 07/11/07 – PAC STAR FEMALE 20-30 07/11/07 – PAC STAR MALE 50-55 07/11/07 – PAC STAR FEMALE 25-35 07/11/07 – PAC STAR FEMALE 60-65 07/11/07 – PAC STAR FEMALE 30-35 14/11/07 – PAC SUN FEMALE 20-30 14/11/07 – PAC SUN FEMALE 18-25 14/11/07 – PAC SUN MALE 55-60 14/11/07 – PAC SUN MALE 18-25 14/11/07 – PAC SUN FEMALE 55-60 14/11/07 – PAC SUN FEMALE 55-60 14/11/07 – PAC SUN FEMALE 45-50 14/11/07 – PAC SUN FEMALE 40-45 14/11/07 – PAC SUN FEMALE 50-55 14/11/07 – PAC SUN FEMALE 25-30 14/11/07 – PAC SUN FEMALE 50-55 14/11/07 – PAC SUN FEMALE 40-50 14/11/07 – PAC SUN FEMALE 35-45 14/11/07 – PAC SUN FEMALE 40-45 21/11/07 – PAC SUN FEMALE 40-45 21/11/07 – PAC SUN MALE 20-25 21/11/07 – PAC SUN FEMALE 60-65 21/11/07 – PAC SUN FEMALE 40-45 21/11/07 – PAC SUN FEMALE 60-65 21/11/07 – PAC SUN FEMALE 55-60 21/11/07 – PAC SUN FEMALE 50-55 21/11/07 – PAC SUN FEMALE 25-30 21/11/07 – PAC SUN FEMALE 50-55 21/11/07 – PAC SUN MALE 60-65 21/11/07 – PAC SUN FEMALE 60-65 21/11/07 – PAC SUN FEMALE 40-50 21/11/07 – PAC SUN FEMALE 45-55 05/12/07 – PAC SUN FEMALE 30-40 05/12/07 – PAC SUN FEMALE 45-55 05/12/07 – PAC SUN FEMALE 50-60 05/12/07 – PAC SUN FEMALE 55-65 05/12/07 – PAC SUN MALE 50-55 05/12/07 – PAC SUN MALE 40-50 05/12/07 – PAC SUN FEMALE 30-40 05/12/07 – PAC SUN FEMALE 50-60 05/12/07 – PAC SUN FEMALE 45-55

MCA Vanuatu – Tourism Survey – Baseline Study Final Report - Appendices
TRIP Consultants www.tripconsultants.net
05/12/07 – PAC SUN FEMALE 55-65 12/12/07 – PAC DAWN MALE 60-65 12/12/07 – PAC DAWN MALE 60-65 12/12/07 – PAC DAWN FEMALE 60-65 12/12/07 – PAC DAWN FEMALE 45-55 12/12/07 – PAC DAWN FEMALE 60-65 12/12/07 – PAC DAWN FEMALE 30-40 12/12/07 – PAC DAWN FEMALE 55-65 12/12/07 – PAC DAWN FEMALE 45-50 12/12/07 – PAC DAWN FEMALE 35-45 12/12/07 – PAC DAWN FEMALE 35-45 12/12/07 – PAC DAWN MALE 30-40 12/12/07 – PAC DAWN MALE 55-65 12/12/07 – PAC DAWN MALE 55-65 12/12/07 – PAC DAWN FEMALE 40-50 12/12/07 – PAC DAWN MALE 35-45 12/12/07 – PAC DAWN FEMALE 55-65 12/12/07 – PAC DAWN FEMALE 40-45 12/12/07 – PAC DAWN FEMALE 40-50 12/12/07 – PAC DAWN FEMALE 40-50 12/12/07 – PAC DAWN FEMALE 55-60 13/12/07 – PAC SUN MALE 50-60 13/12/07 – PAC SUN FEMALE 30-40 13/12/07 – PAC SUN FEMALE 45-55 13/12/07 – PAC SUN FEMALE 55-65 13/12/07 – PAC SUN MALE 45-55 13/12/07 – PAC SUN FEMALE 60-70 13/12/07 – PAC SUN FEMALE 40-45 13/12/07 – PAC SUN FEMALE 60-65 13/12/07 – PAC SUN MALE 45-55 13/12/07 – PAC SUN FEMALE 60-65 13/12/07 – PAC SUN FEMALE 40-45 13/12/07 – PAC SUN MALE 40-50 13/12/07 – PAC SUN FEMALE 60-65 13/12/07 – PAC SUN FEMALE 30-35 13/12/07 – PAC SUN FEMALE 40-50 13/12/07 – PAC SUN MALE 40-45 13/12/07 – PAC SUN FEMALE 40-50 03/01/08 – PAC SUN MALE 50 03/01/08 – PAC SUN MALE 60 03/01/08 – PAC SUN FEMALE 45 03/01/08 – PAC SUN MALE 30 03/01/08 – PAC SUN FEMALE 60 03/01/08 – PAC SUN MALE 75 03/01/08 – PAC SUN FEMALE 65 03/01/08 – PAC SUN FEMALE 45 03/01/08 – PAC SUN MALE 35 03/01/08 – PAC SUN MALE 20 03/01/08 – PAC SUN FEMALE 60 03/01/08 – PAC SUN MALE 65 03/01/08 – PAC SUN MALE 30 03/01/08 – PAC SUN MALE 45 03/01/08 – PAC SUN MALE 60 04/01/08 – SUN P’CESSS MALE 55 04/01/08 – SUN P’CESSS FEMALE 40 04/01/08 – SUN P’CESSS FEMALE 50 04/01/08 – SUN P’CESSS MALE 50 04/01/08 – SUN P’CESSS FEMALE 40

MCA Vanuatu – Tourism Survey – Baseline Study Final Report - Appendices
TRIP Consultants www.tripconsultants.net
04/01/08 – SUN P’CESSS FEMALE 55 04/01/08 – SUN P’CESSS FEMALE 40 04/01/08 – SUN P’CESSS FEMALE 60 04/01/08 – SUN P’CESSS MALE 25 04/01/08 – SUN P’CESSS FEMALE 35 04/01/08 – SUN P’CESSS FEMALE 50 04/01/08 – SUN P’CESSS FEMALE 40 04/01/08 – SUN P’CESSS FEMALE 50 04/01/08 – SUN P’CESSS FEMALE 70 04/01/08 – SUN P’CESSS FEMALE 50 09/01/08 – PACIFIC SUN MALE 30 09/01/08 – PACIFIC SUN MALE 30 09/01/08 – PACIFIC SUN MALE 40 09/01/08 – PACIFIC SUN MALE 40 09/01/08 – PACIFIC SUN FEMALE 40 09/01/08 – PACIFIC SUN FEMALE 40 09/01/08 – PACIFIC SUN MALE 50 09/01/08 – PACIFIC SUN MALE 40 09/01/08 – PACIFIC SUN MALE 25 09/01/08 – PACIFIC SUN FEMALE 25 09/01/08 – PACIFIC SUN FEMALE 40 09/01/08 – PACIFIC SUN MALE 40 09/01/08 – PACIFIC SUN FEMALE 40 09/01/08 – PACIFIC SUN FEMALE 40 09/01/08 – PACIFIC SUN MALE 45 09/01/08 – PACIFIC SUN MALE 35 09/01/08 – PACIFIC SUN FEMALE 40 09/01/08 – PACIFIC SUN MALE 30 09/01/08 – PACIFIC SUN MALE 40 09/01/08 – PACIFIC SUN MALE 60 09/01/08 – PACIFIC SUN FEMALE 40 09/01/08 – PACIFIC SUN FEMALE 60 09/01/08 – PACIFIC SUN FEMALE 50 09/01/08 – PACIFIC SUN FEMALE 30 09/01/08 – PACIFIC SUN FEMALE 50 09/01/08 – PACIFIC SUN FEMALE 35 09/01/08 – PACIFIC SUN MALE 50 09/01/08 – PACIFIC SUN FEMALE 40 09/01/08 – PACIFIC SUN MALE 35 09/01/08 – PACIFIC SUN FEMALE 40 13/01/08 – PAC DAWN FEMALE 60 13/01/08 – PAC DAWN MALE 40 13/01/08 – PAC DAWN FEMALE 40 13/01/08 – PAC DAWN MALE 30 13/01/08 – PAC DAWN MALE 30 13/01/08 – PAC DAWN FEMALE 45 13/01/08 – PAC DAWN FEMALE 45 13/01/08 – PAC DAWN FEMALE 25 13/01/08 – PAC DAWN MALE 35 13/01/08 – PAC DAWN FEMALE 50 13/01/08 – PAC DAWN MALE 45 13/01/08 – PAC DAWN FEMALE 60 06/02/08 – PACIFIC SUN FEMALE 40-45 06/02/08 – PACIFIC SUN MALE 50-60 06/02/08 – PACIFIC SUN FEMALE 30-40 06/02/08 – PACIFIC SUN FEMALE 55-60 06/02/08 – PACIFIC SUN MALE 60-65 06/02/08 – PACIFIC SUN FEMALE 20-25

MCA Vanuatu – Tourism Survey – Baseline Study Final Report - Appendices
TRIP Consultants www.tripconsultants.net
06/02/08 – PACIFIC SUN FEMALE 60-65 06/02/08 – PACIFIC SUN MALE 30-35 06/02/08 – PACIFIC SUN FEMALE 55-65 06/02/08 – PACIFIC SUN FEMALE 35-45 06/02/08 – PACIFIC SUN FEMALE 50-60 06/02/08 – PACIFIC SUN FEMALE 40-45 06/02/08 – PACIFIC SUN FEMALE 55-65 06/02/08 – PACIFIC SUN FEMALE 20-25 06/02/08 – PACIFIC SUN MALE 50-55 10/02/08 – PAC DAWN MALE 25 10/02/08 – PAC DAWN MALE 25 10/02/08 – PAC DAWN FEMALE 50 10/02/08 – PAC DAWN MALE 30 10/02/08 – PAC DAWN FEMALE 50 10/02/08 – PAC DAWN FEMALE 30 10/02/08 – PAC DAWN FEMALE 20 10/02/08 – PAC DAWN MALE 50 10/02/08 – PAC DAWN MALE 40 10/02/08 – PAC DAWN FEMALE 40 10/02/08 – PAC DAWN FEMALE 30 10/02/08 – PAC DAWN FEMALE 30 10/02/08 – PAC DAWN FEMALE 30 10/02/08 – PAC DAWN FEMALE 40 10/02/08 – PAC DAWN FEMALE 40 10/02/08 – PAC DAWN FEMALE 20 10/02/08 – PAC DAWN MALE 40 10/02/08 – PAC DAWN FEMALE 40 10/02/08 – PAC DAWN FEMALE 20 10/02/08 – PAC DAWN MALE 40 10/02/08 – PAC DAWN FEMALE 50 10/02/08 – PAC DAWN FEMALE 20 10/02/08 – PAC DAWN FEMALE 30 10/02/08 – PAC DAWN MALE 40 10/02/08 – PAC DAWN FEMALE 30 10/02/08 – PAC DAWN MALE 50 13/02/08 – PACIFIC SUN FEMALE 45-55 13/02/08 – PACIFIC SUN FEMALE 30-40 13/02/08 – PACIFIC SUN FEMALE 40-50 13/02/08 – PACIFIC SUN FEMALE 40-50 13/02/08 – PACIFIC SUN MALE 30-40 13/02/08 – PACIFIC SUN FEMALE 20-30 13/02/08 – PACIFIC SUN FEMALE 45-55 13/02/08 – PACIFIC SUN FEMALE 50-60 02/03/08 – PACIFIC SUN FEMALE 60-65 02/03/08 – PACIFIC SUN FEMALE 40-45 02/03/08 – PACIFIC SUN FEMALE 55-65 02/03/08 – PACIFIC SUN FEMALE 30-35 02/03/08 – PACIFIC SUN FEMALE 50-60 02/03/08 – PACIFIC SUN FEMALE 60-70 02/03/08 – PACIFIC SUN FEMALE 60-70 02/03/08 – PACIFIC SUN FEMALE 18-25 02/03/08 – PACIFIC SUN MALE 60-65

MCA Vanuatu – Tourism Survey – Baseline Study Final Report - Appendices
TRIP Consultants www.tripconsultants.net
APPENDIX IV – Monthly Exchange Rates Used in Currency Conversions - June 2007 – February 2008
TO CONVERT TO VATU MULTIPLY BY COUNTRY
CURRENCY Jun-07 Jul-07 Aug-07 Sep-07 Oct-07 Nov-07 Dec-07 Jan-08 Feb-08
AUSTRALIA AUD 8935 89.87 89.36 89.61 91.5 93.89 90.85 91.21 90.85 ENGLAND GBP 208.48 208.04 206.68 211.61 206.37 204.31 208.03 198.13 198.79 USA USD 108.2 106.95 104.8 108.05 105.2 102.05 103.6 103.4 103.1 NZ NZD 79.91 81.48 79.99 78.39 78.37 78.53 78.72 79.81 79.38 FIJI FIJD 66.46 66.51 66.17 66.59 66.61 66.23 66.5 66.52 66.33 JAPAN JPY 0.8955 0.8787 0.8903 0.9334 0.922 0.8943 0.9526 0.9476 0.9653 HONGKONG HKD 13.91 13.74 13.45 13.91 13.59 13.22 13.36 13.3 13.25 ITAHITI XPF 1.2004 1.1895 1.1826 1.21 99 1.2269 1.2119 1.2653 1.2544 1.2467 PNG PGK 38.36 38.95 39.76 40.93 39.9 38.68 40.26 40.54 40.57 SINGAPORE SGD 70.33 69.14 68.76 70.66 69.69 69.75 71.29 71.42 71.68 SWITZERL.AND CHF 86.71 85.51 85.61 88.34 88.41 85.83 91.6 91.01 92 CANADA CAD 98.75 97.54 95.84 100.23 102.05 104.11 101.26 101.72 99.41 SWEDEN SEK. 15.2 14.77 14.8 15.48 15.38 15.17 16.17 15.17 15.18 DENMARK DICK 18.89 18.31 18.31 19.18 18.97 18.74 20.07 19.27 19.27 INDIA INR 2.5903 2.5012 2.5036 2.5467 2.52 2.46 2.485 2.4968 2.48 GREECE GRD 0.2695 0.268 0.2607 0.2698 0.2588 0.2506 0.2546 0.2541 0.2534 MALAYSIA MYR 30.62 29.32 28.99 29.88 29.11 29.03 29.65 29.65 29.89 SOUTH AFRICA ZAR 14.73 14.35 1410 14.64 14.43 14.9 14.64 14.36 13.66 CHINA CNY 13.74 13.36 13.29 13.76 13.31 12.95 13.82 13.5 13.57 THAILAND THB 3.203 3.2822 3.3871 3.1499 3.12 3.06 3.17 3.27 3.13 MORROCO MAD 12.53 12.2 12.28 12.2 12.51 12.32 12.76 12.72 12.63 PHILIPPINES P1W 2.274 2.2119 2.2182 2.2332 2.21 2.21 2.3118 2.3829 2.39 TAIWAN TWD 3.1496 3.1016 3.0604 3.1565 3.0359 2.9901 3.0465 3.0271 3.0266 INDONESIA IDR 0.01185 0.01131 109 0.0111 0.01093 0.01065 0.01097 0.01046 0.0104 NORWAY NOK 17.42 17.05 17.26 17.93 18.17 18.12 18.5 17.99 17.87 SOLOMON ISLANDS SBD 17.13 16.65 16.56 17.53 17.3 16.82 16.86 16.27 15.88 EURO EUR 142.88 141.26 140.54 144.98 145.73 144.01 150.2 149.15 148.21
Source: Department of Customs and Inland Revenue

MCA Vanuatu – Tourism Survey – Baseline Study Final Report - Appendices
TRIP Consultants www.tripconsultants.net
APPENDIX V – Additional Data Entry Codes
code country CurrID Currency 1 Australia 1 Vatu 2 New Zealand 2 AUD 3 Japan 3 NZD 4 Pacific 4 CFP 5 USA 5 USD 6 Canada 6 EURO 7 European Union 7 YEN 8 Other Asia 8 FJD 9 Other Europe 9 Not stated
10 Other 10 GBP 11 Not stated 11 FRANC
12 HKD 13 Solomon Dollar
code Transport 14 PNG Kina 1 Taxi 2 Bus Code Whom 3 Rental Car 1 Alone 4 Boat 2 Spouse/partner only 5 Private Car 3 Family 6 Airplane 4 Group/friends 7 Other 5 Not stated 8 Not stated
Yes/noID Yes/no code Purpose 1 Yes
1 Holiday 2 No 2 Business 3 Not stated 3 Friends/Relatives 4 Others 5 Not stated
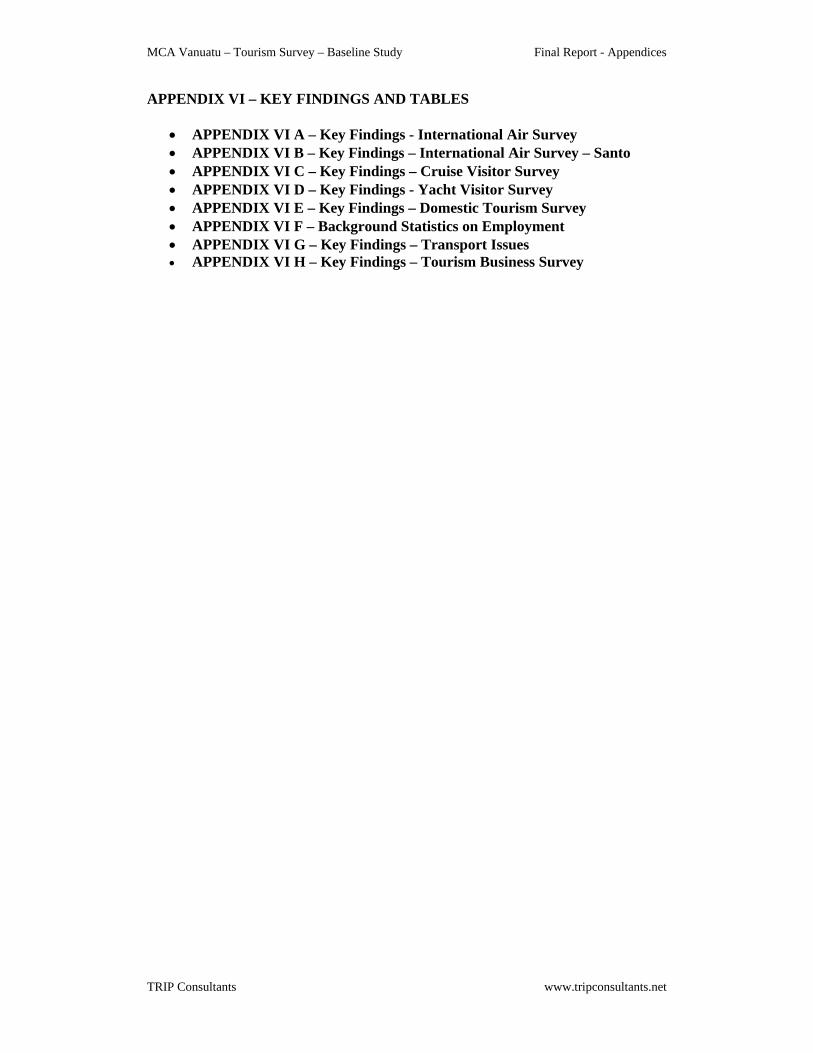
MCA Vanuatu – Tourism Survey – Baseline Study Final Report - Appendices
TRIP Consultants www.tripconsultants.net
APPENDIX VI – KEY FINDINGS AND TABLES
• APPENDIX VI A – Key Findings - International Air Survey • APPENDIX VI B – Key Findings – International Air Survey – Santo • APPENDIX VI C – Key Findings – Cruise Visitor Survey • APPENDIX VI D – Key Findings - Yacht Visitor Survey • APPENDIX VI E – Key Findings – Domestic Tourism Survey • APPENDIX VI F – Background Statistics on Employment • APPENDIX VI G – Key Findings – Transport Issues • APPENDIX VI H – Key Findings – Tourism Business Survey

MCA Vanuatu – Tourism Survey – Baseline Study Final Report - Appendices
TRIP Consultants www.tripconsultants.net
APPENDIX III A: KEY FINDINGS FROM THE AIR DEPARTURES SAMPLE SURVEY
1. General The main sample survey of departing tourists by air took place at the Bauerfield Airport near Port Vila
(1542 respondents) through the months of August, October, November and December 2007, and
February 2008. It was supplemented by a small sample survey of departing tourists by air at Pekoa
Airport on Santo (85 respondents) in the same period as a check against differences. The latter survey
is commented upon in detail in Appendix IIIB The intention in this main survey was to take into
account seasonal variations. The sample size was 1,542 respondents selected on a random basis. The
overall sample was in line with the numbers of travellers by country of residence and by main purpose
of visit.
The breakdowns are illustrated in Table 1 and a comparison is drawn with the last sample survey in
2004. Previous to that, sample surveys of air visitors had taken place in 1997 and 1991.
Table 1 – Breakdown of Sample by Market Area
Country of
Residence
Visitor Survey
1997 Percent
Visitor Survey
2004 Percent
Visitor Survey 2007
Frequency
Visitor Survey
2007 Percent
Australia 64.6 67.4 1022 66.3
New Zealand 20.1 13.8 270 17.5
Pacific 0.7 7.5 87 5.6
USA 6.9 1.8 24 1.6
Europe 2.7 7.1 89 5.7
Other 5.0 2.4 50 3.3
Total 100.0 100.0 1542 100.0
Source: Visitor Sample Survey 2007 and Visitor Surveys for 2004 and 1997
The Market profile has remained relatively similar through the years; Australia, New Zealand, Pacific
and Europe are the main market areas, though Australia is by far the major market.
Table 2 – Breakdown of Sample by Main Purpose of Visit
Main Purpose of
Visit
Visitor Survey
1997 Percent
Visitor Survey
2004 Percent
Visitor Survey 2007
Frequency
Visitor Survey
2007 Percent
Holiday 73.7 82.8 1102 71.5
Business 9.4 9.9 299 19.4
Visiting Friends and
Relatives VFR
3.4 4.6 72 4.7
Other 8.3 2.7 69 4.4

MCA Vanuatu – Tourism Survey – Baseline Study Final Report - Appendices
TRIP Consultants www.tripconsultants.net
Total 100.0 100.0 1542 100.0
Source: Visitor Sample Survey 2007 and Visitor Surveys for 2004 and 1997
Again there is not a large change in the composition of the samples by purpose of trip (Table 2) with
the exception that the 2007 sample has brought in more business travellers than in 2004 or 1997. Partly
this change is associated with increased economic activity.
The composition of the Travel Party to Vanuatu has changed a little in that there are more respondents
travelling alone, which possibly reflects the increase in business travel. A Travel Party involving a
‘group/friends’ is more frequent now, and first time visitors appear to be more prevalent. However
there are no dramatic changes in the visitor profile.
2. Length of Stay The sample results indicate an average length of stay of visitors to be 7.73 nights. This is comparable
with the results from previous visitor surveys, suggesting that there has been little change through the
years (Table 3).
Table 3 – Length of Stay (Nights) of Sample
Average Length
of Stay
Visitor Survey
1991
Visitor Survey
1997
Visitor Survey 2004 Visitor Survey
2007/08
Nights 7.8 8.2 8.2 7.7
Source: Visitor Sample Survey 2007 and Visitor Surveys for 2004, 1997 and 1991
Length of stay was investigated in more detail for 2007/08 and the Relative Sampling Error was only
+/- 3%. The length of stay varies relatively little for the different main markets with Australia at 7.5
nights, New Zealand 6.9 nights, and the Pacific 7.1 nights. The European Union visitors have a longer
length of stay at 11.5 nights but their relative sampling error is higher at 22%.
An illustration of the frequencies of the responses is shown for the major market of Australia in Figure
1.

MCA Vanuatu – Tourism Survey – Baseline Study Final Report - Appendices
TRIP Consultants www.tripconsultants.net
Figure 1 – Australian Market – Average Length of Stay (Nights) Source: Visitor Sample Survey 2007
0 10 20 30 40 50
Nights spent in Vanuatu (Q8)
0
100
200
300
Freq
uenc
y
Mean = 7.51Std. Dev. = 4.294N = 1,022
for Country of Residence = Australia
Histogram
There are variations in length of stay according to the main purpose of visit but these are not large. Table 4 – Length of Stay by Main Purpose of Visit
Main Purpose of
Visit
Nights
Holiday 7.8
Business 6.3
VFR 9.7
Other 10.5
Total 7.7
Source: Visitor Sample Survey 2007
Because of the importance of length of stay in the overall calculations of total nights and the influence
of total nights on total expenditure, the sample results were investigated and the boxplot of ‘outliers’
was rechecked to ensure that the sample means are reasonably correct.
Visitors in 2007 were 81,345 and applying the figure of 7.7 nights stay estimates Total Visitor Nights
of approximately 626,000 in the Year 2007.

MCA Vanuatu – Tourism Survey – Baseline Study Final Report - Appendices
TRIP Consultants www.tripconsultants.net
3. Expenditure by the Visitor Average Daily Direct Expenditure by the visitor is estimated at 15,542 Vatu. This is the direct
expenditure by the visitor and does not include for the spending made on behalf of the visitor by the
tour operator. The expenditure by tour operators on behalf of tourists is estimated below.
Direct spending per day varies marginally between the different source markets but Australia is the
highest spending market.
Total direct spending by visitors in 2007 will have been 81,345 visitors spending 15,542 Vatu per day
(24 hours), and staying 7.7 nights making a total direct spend of Vatu 9.7 billion.
4. Expenditure by Tour Operators on Behalf of Visitors
A substantial part of the tourism business to Vanuatu involves package tours sold through tour
operators or agents who take prepayment for the package and then cover the costs of air fares and the
costs of accommodation, tours etc.
The tourist or visitor does not directly pay for the expenditure when he/she is in Vanuatu. Rather the
tour operator/ agent pays on behalf of the visitor. The largest part of this expenditure tends to be for
accommodation in Vanuatu.
In the sample survey we sought out the expenditures that the respondent had already made for different
services. The broad picture is as shown on Table 5.
Table 5: Elements of the Package
Components Frequency Percentage of Sample
On Prepaid Package/ Air ticket 1449 94.0
Includes Air Ticket 1397 90.6
Includes Accommodation 866 56.2
Includes All Meals 196 12.7
Includes Tours/ Cruises 121 7.8
Includes Breakfast only 568 36.8
Includes Transfers 664 43.1
Includes Others 109 7.1
Approximately 56% of visitors were on a package that included air fare and accommodation. The
average package price was Vatu 176,973 with the packages from Australia being higher in price than
the packages from New Zealand.

MCA Vanuatu – Tourism Survey – Baseline Study Final Report - Appendices
TRIP Consultants www.tripconsultants.net
Deducting the air fare and the administrative and marketing costs from the package indicates that
around 30-40% of the prices comes into Vanuatu to pay for accommodation and transfers etc. This is
based upon anecdotal evidence in discussions with the travel trade.
We have assumed that 35%, as halfway between 30% and 40% will come into Vanuatu and that this
will divide into 90% accommodation and 10% other costs.
This adds another Vatu 4,505 per day to the direct spending, making a total of direct spending by the
visitor and the spending by the tour operator on behalf of the visitor to be around Vatu 20,047.

MCA Vanuatu – Tourism Survey – Baseline Study Final Report - Appendices
TRIP Consultants www.tripconsultants.net
ATTACHMENT 1 - STATISTICAL TABLES FOR VISITOR AIR DEPARTURES SAMPLE SURVEY Country/Region of Residence (Q1)
Frequency Percent Cumulative
Percent Australia 1022 66.3 66.3 New Zealand 270 17.5 83.8 Japan 11 .7 84.5 Pacific 87 5.6 90.1 USA 24 1.6 91.7 Canada 6 .4 92.1 European Union 76 4.9 97.0 Other Asia 22 1.4 98.4 Other Europe 13 .8 99.3 Other 11 .7 100.0 Total 1542 100.0
Main Purpose of Visit (Q2)
Frequency Percent Cumulative
Percent Holiday 1102 71.5 71.5 Business 299 19.4 90.9 Visit friends and relatives 72 4.7 95.5 Other 68 4.4 99.9 Not stated 1 .1 100.0 Total 1542 100.0
Country/Region of Residence (Q1) by Main Purpose of Visit (Q2) Cross tabulation
Country/Region of Residence (Q1) Main Purpose of Visit (Q2) Total
Holiday Business Visit friends and relatives Other
Not stated
Australia Count 817 138 40 27 0 1022 % by Residence 79.9% 13.5% 3.9% 2.6% .0% 100.0% New Zealand Count 169 79 7 14 1 270 % by Residence 62.6% 29.3% 2.6% 5.2% .4% 100.0% Pacific Count 23 43 3 18 0 87 % by Residence 26.4% 49.4% 3.4% 20.7% .0% 100.0% European Union Count 52 9 12 3 0 76 % by Residence 68.4% 11.8% 15.8% 3.9% .0% 100.0%Total Count 1102 299 72 68 1 1542 71.5% 19.4% 4.7% 4.4% .1% 100.0%

MCA Vanuatu – Tourism Survey – Baseline Study Final Report - Appendices
TRIP Consultants www.tripconsultants.net
Travel Party (Q3A)
Frequency Percent Cumulative
Percent alone 337 21.9 21.9 spouse/partner only 641 41.6 63.4 family 255 16.5 80.0 group/friends 308 20.0 99.9 Not stated 1 .1 100.0 Total 1542 100.0
First Visit to Vanuatu (Q4)
Frequency Percent Cumulative
Percent Yes 1020 66.1 66.1 No 517 33.5 99.7 Not Stated 5 .3 100.0 Total 1542 100.0
Length of Stay (Q8)
Statistic Std. Error Mean 7.73 .137
Lower Bound 7.46 95% Confidence Interval for Mean Upper Bound 8.00 5% Trimmed Mean 7.11 Median 7.00 Interquartile Range 4 Skewness 3.808 .062
Nights spent in Vanuatu (Q8)
Kurtosis 29.684 .125
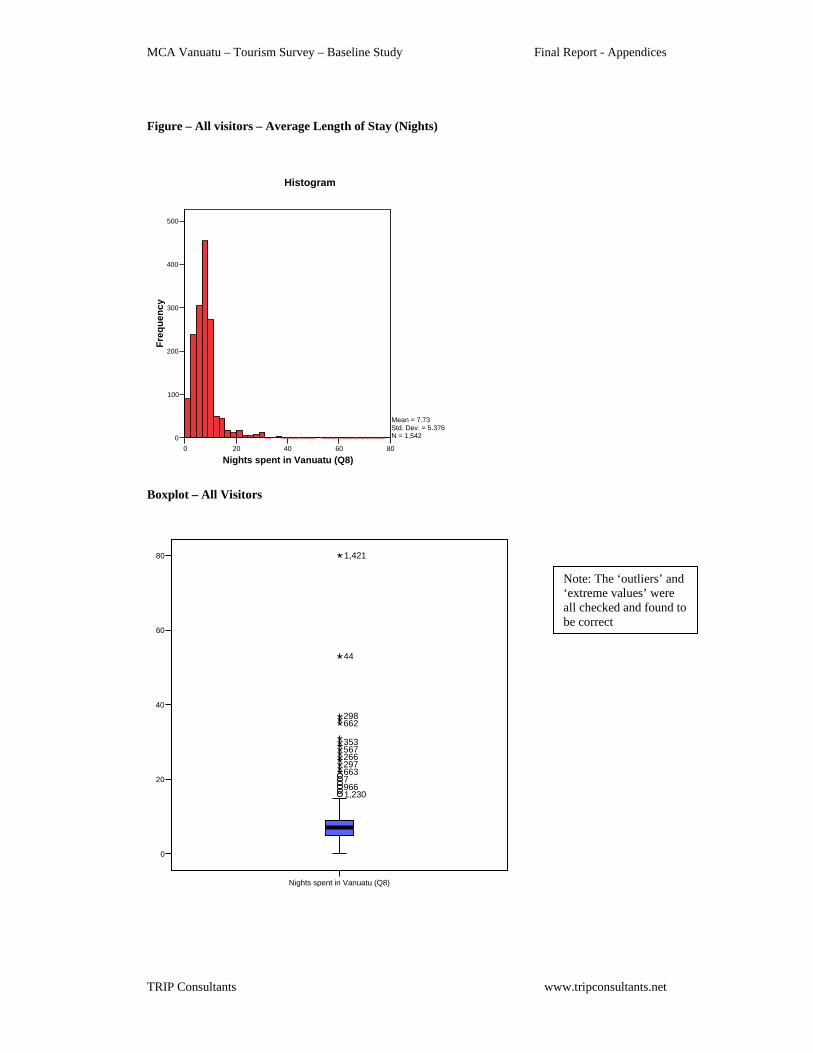
MCA Vanuatu – Tourism Survey – Baseline Study Final Report - Appendices
TRIP Consultants www.tripconsultants.net
Note: The ‘outliers’ and ‘extreme values’ were all checked and found to be correct
Nights spent in Vanuatu (Q8)
0
20
40
60
80
1,2309667663297266567353
662298
44
1,421
Figure – All visitors – Average Length of Stay (Nights)
0 20 40 60 80
Nights spent in Vanuatu (Q8)
0
100
200
300
400
500
Freq
uenc
y
Mean = 7.73Std. Dev. = 5.376N = 1,542
Histogram
Boxplot – All Visitors

MCA Vanuatu – Tourism Survey – Baseline Study Final Report - Appendices
TRIP Consultants www.tripconsultants.net
Proportions of Visitors spending on different items in Vanuatu
ITEMS Frequency ‘Yes’
Frequency ‘No’
‘Not Stated’
Other Percent ‘Yes’
Accommodation 822 398 319 3 53.5 Meals & Drinks 1077 201 261 3 70.0 Taxis 735 459 345 3 47.9 Buses 595 540 404 3 38.8 Car Rentals 122 907 510 3 8.1 Boats 96 932 511 3 6.4 Tours and Activities 736 436 367 3 47.9 Duty Free Shopping 482 641 415 3 31.5
Local Shopping 788 412 339 3 51.3
Domestic Airfares 122 917 499 4 8.2 All Other 199 855 480 8 13.4
Total Direct Spend Per Day
Statistic Std. Error Mean 15541.76 287.755
Lower Bound 14977.30 95% Confidence Interval for Mean Upper Bound 16106.22 5% Trimmed Mean 14902.33 Median 13298.25 Interquartile Range 14973 Skewness .794 .064
Spend per day
Kurtosis .170 .128
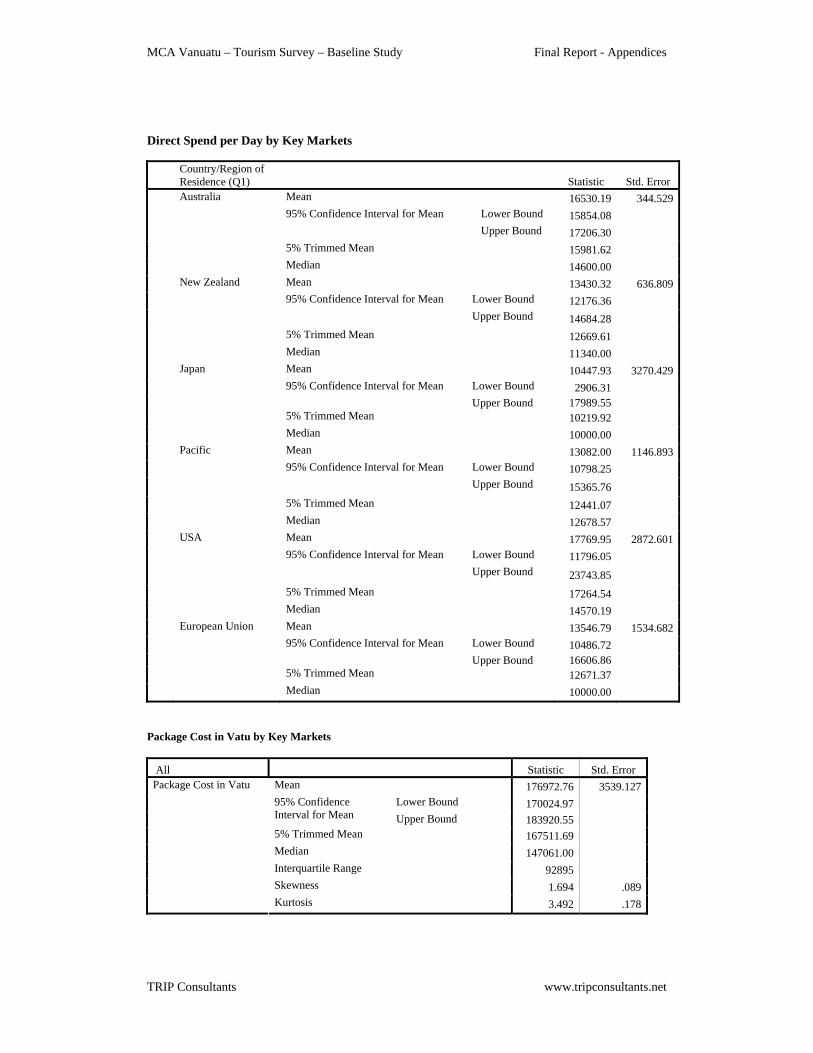
MCA Vanuatu – Tourism Survey – Baseline Study Final Report - Appendices
TRIP Consultants www.tripconsultants.net
Direct Spend per Day by Key Markets
Country/Region of Residence (Q1) Statistic Std. Error
Australia Mean 16530.19 344.529 95% Confidence Interval for Mean Lower Bound 15854.08 Upper Bound 17206.30 5% Trimmed Mean 15981.62 Median 14600.00 New Zealand Mean 13430.32 636.809 95% Confidence Interval for Mean Lower Bound 12176.36 Upper Bound 14684.28 5% Trimmed Mean 12669.61 Median 11340.00 Japan Mean 10447.93 3270.429 95% Confidence Interval for Mean Lower Bound 2906.31 Upper Bound 17989.55 5% Trimmed Mean 10219.92 Median 10000.00 Pacific Mean 13082.00 1146.893 95% Confidence Interval for Mean Lower Bound 10798.25 Upper Bound 15365.76 5% Trimmed Mean 12441.07 Median 12678.57 USA Mean 17769.95 2872.601 95% Confidence Interval for Mean Lower Bound 11796.05 Upper Bound 23743.85 5% Trimmed Mean 17264.54 Median 14570.19 European Union Mean 13546.79 1534.682 95% Confidence Interval for Mean Lower Bound 10486.72 Upper Bound 16606.86 5% Trimmed Mean 12671.37 Median 10000.00
Package Cost in Vatu by Key Markets
All Statistic Std. Error Mean 176972.76 3539.127
Lower Bound 170024.97 95% Confidence Interval for Mean Upper Bound 183920.55 5% Trimmed Mean 167511.69 Median 147061.00 Interquartile Range 92895 Skewness 1.694 .089
Package Cost in Vatu
Kurtosis 3.492 .178

MCA Vanuatu – Tourism Survey – Baseline Study Final Report - Appendices
TRIP Consultants www.tripconsultants.net
(Note: This analysis has been confined to the concept of a package that includes at least the air fare
plus the accommodation. It excludes ‘extreme values’ of over Vatu 600000 million, which tended to
include persons departing by air from Vanuatu when they left an expensive multi-destination tour or
cruise).
Package Cost by Source Market Breakdown of Direct Expenditure by different components Items Percent Accommodation 38.5%Meals & Drinks 20.6%Taxis 3.0%Buses 0.4%Car Rentals 1.4%Local Boat Transport 3.0%Tours and Activities 13.7%Entertainment/Recreation 5.7%Local Shopping 8.7%Duty Free Shopping 2.5%All Other 2.5%
Country/Region of Residence (Q1) Statistic Std. Error
Australia Mean 182405.33 4071.206 95% Confidence Interval for Mean Lower Bound 174408.76 Upper Bound 190401.91 5% Trimmed Mean 173383.29 Median 155550.00 New Zealand Mean 162558.11 7144.310 95% Confidence Interval for Mean Lower Bound 148443.88 Upper Bound 176672.34 5% Trimmed Mean 151824.62 Median 142290.00
MCA Vanuatu – Tourism Survey – Baseline Study Final Report - Appendices
TRIP Consultants www.tripconsultants.net
APPENDIX III B: AIR DEPARTURES SAMPLE SURVEY IN SANTO – KEY FINDINGS AND TABLES 1. General An international service (once a week) from Brisbane to Santo was introduced by Air Vanuatu in mid
2007. The sample survey of departing tourists by air in Espiritu Santo took place at the Pekoa Airport
near Luganville through the months of August 2007 to February 2008. The intention was to take into
account seasonal variations. The sample size was 85 respondents selected on a random basis. The
overall sample was in line with the numbers of travellers by country of residence and by main purpose
of visit. The intention with this relatively small sample was to check for any substantive differences in
the travel patterns, The results show that whilst there are small differences, these are not substantive for
the purposes of macro-economic analysis.
Compared with Port Vila, in Santo there is a greater concentration on the Australian market (94%) but
the purpose of visit is relatively similar with 75% being holiday travellers in Santo.
The composition of the Travel Party to Santo is different to the sample results in Efate in that there is a
greater focus on travelling in ‘groups/friends’.
2. Length of Stay The sample results indicate an average length of stay of visitors to be 9 nights. (5% trimmed mean),
This slightly longer length of stay may be related to the fact that flights are only once a week.
3. Average Daily Expenditure Average Daily Expenditure was around Vatu 13,046 (5% trimmed mean). However about 52% of
travellers were on a package that included air fares and accommodation, so the add-on for expenditure
on the tourist’s behalf by a tour operator/ travel agent will be similar to Visitors to Port Vila. An
addition of 30% would be similar, making a total daily expenditure of approximately Vatu 17,000.

MCA Vanuatu – Tourism Survey – Baseline Study Final Report - Appendices
TRIP Consultants www.tripconsultants.net
ATTACHMENT 1 - STATISTICAL TABLES FOR VISITOR AIR DEPARTURES SAMPLE SURVEY IN SANTO Country/Region of Residence (Q1)
Frequency Percent Cumulative
Percent Australia 80 94.1 94.1 USA 1 1.2 95.3 Canada 1 1.2 96.5 European
Union 3 3.5 100.0
Total 85 100.0 Main Purpose of Visit (Q2)
Frequency Percent Cumulative
Percent Holiday 64 75.3 75.3 Business 7 8.2 83.5 Visit friends and relatives 7 8.2 91.8 Other 7 8.2 100.0 Total 85 100.0
Travel Party (Q3A) Travel Party (Q3A)
Frequency Percent Cumulative
Percent Alone 14 16.5 16.5 spouse/partner only 33 38.8 55.3 Family 6 7.1 62.4 group/friends 32 37.6 100.0 Total 85 100.0
First Visit to Vanuatu (Q4)
Frequency Percent Cumulative
Percent Yes 43 50.6 50.6 No 42 49.4 100.0 Total 85 100.0

MCA Vanuatu – Tourism Survey – Baseline Study Final Report - Appendices
TRIP Consultants www.tripconsultants.net
Length of Stay (Q8)
Statistic Std. Error Mean 9.59 .544
Lower Bound 8.51 95% Confidence Interval for Mean Upper Bound 10.67 5% Trimmed Mean 8.97
Nights (Q8)
Median 8.00 APPENDIX III C: CRUISE VISITOR SAMPLE SURVEY 2007 - KEY FINDINGS
1. General The Cruise Ship Passenger sample survey took place between September 2007 and March 2008 and involved
questionnaires at the main wharf in Port Vila. The final sample was 748.
The sample indicated the predominance of holiday travel (98%) and indicated that the bulk of the market is from
Australia (95%). New Zealand is the only other sizeable market at 3.5% of the total.
The travel parties comprise couples (30%), family groups (38%) and groups of friends (29%). Travelling alone on the
cruise is only a small segment (2%).
The Cruise ship basically stays for one day in Port Vila.
2. Breakdown of Expenditure The sample results indicate that the mean of the total expenditure on the one day trip in Port Vila was Vatu 20,160.
Cruise ship passengers do spend on a range of items which are illustrated in Figure 1 below..
Figure 1: Proportions of Cruise Ship Passengers spending on different items Source: Cruise Ship Passenger Sample Survey 2007
0
10
20
30
40
50
60
70
80
Perc
ent
Other M
eals
& Drin
ks
Taxi/B
us
Car Ren
tal
Boats
Tours
(Dire
ct)
Tours
(thro'
Ship)
Enterta
inmen
t
Shopp
ing
Duty Free
Other

MCA Vanuatu – Tourism Survey – Baseline Study Final Report - Appendices
TRIP Consultants www.tripconsultants.net
Cruise ship passengers participate in buying meals and drinks on shore, and take taxis and buses. Their other main
participation is in shopping, both local and duty free (Figure 1). Tours directly purchased onshore are taken by 18% of
cruise ship visitors, and a further 44% purchase tours either through the ship or in a prepaid package.
Expenditure levels reflect the participation levels but also re-emphasise the significance of shopping (Figure 2).
Figure 2: Average Expenditure by Cruise Ship Passengers on different items Source: Cruise Ship Passenger Sample Survey 2007 Shopping (local and duty free) comprises 53% of the expenditure by the cruise ship passengers. A further 29% is spent
on tours (either direct or prepaid).
4. Estimating the total cruise visitor expenditure The Sample Survey indicates an estimated average total spend of Vatu 26,334 per Cruise Ship passenger (applicable
2007), including the spending for tours bought on the ship or prepaid. The breakdown is Vatu 20,160 for direct
spending and Vatu 6174 paid to the ship/tour operator.
Direct Expenditure by the Cruise Ship Visitor, assuming the numbers in 2007 are the same as 2006, (namely 85,922),
is estimated by multiplying this visitor figure and the above expenditure figure (Vatu 20,160) to give an approximate
order of magnitude figure of around Vatu 1.7 billion for the direct expenditure of cruise ship visitors in Vanuatu.
In addition the agents of the ship/ tour operator pay a proportion of the visitor’s spend on tours into the Vanuatu
economy, which has been estimated at 60% making a total estimate of Vatu 0.3 billion for these additional payments.
0100020003000400050006000700080009000
Vatu
Other M
eals
& Drin
ks
Taxi/B
us
Car Ren
tal
Boats
Tours
(Dire
ct)
Tours
(thro
Ship)
Enterta
inmen
t
Shopp
ing
Duty Free
Other

MCA Vanuatu – Tourism Survey – Baseline Study Final Report - Appendices
TRIP Consultants www.tripconsultants.net
Photo: Interviewing took place in a secure area next to the ship, beyond the hustle and bustle of the port area
ATTACHMENT1 : KEY STATISTICAL TABLES FROM THE CRUISE VISITOR SAMPLE SURVEY Country of Residence (Q1)
Frequency Percent Cumulative
Percent Australia 708 94.7 94.7 New Zealand 26 3.5 98.1 USA 2 .3 98.4 European Union 2 .3 98.7 Other 1 .1 98.8 11 9 1.2 100.0 Total 748 100.0
Main Purpose of Visit (Q2)
Frequency Percent Cumulative
Percent Holiday 734 98.1 98.1 Business 2 .3 98.4 Visit friends and relatives 4 .5 98.9 Not stated 8 1.1 100.0 Total 748 100.0
Travel Party (Q3A)
Frequency Percent Cumulative
Percent Alone 14 1.9 1.9 spouse/partner only 221 29.5 31.4 Family 281 37.6 69.0 group/friends 220 29.4 98.4 Not stated 12 1.6 100.0

MCA Vanuatu – Tourism Survey – Baseline Study Final Report - Appendices
TRIP Consultants www.tripconsultants.net
Total 748 100.0 Days Spent in Port Vila (Q4)
Frequency Percent Cumulative
Percent 0 9 1.2 1.2 1 739 98.8 100.0 Total 748 100.0
Proportions of Cruise Visitors spending on different items in Vanuatu (Q6)
ITEMS Frequency ‘Yes’
Frequency ‘No’
‘Not Stated’
Percent ‘Yes’
Meals & Drinks 340 324 84 45.5 Taxi/Bus 587 104 57 78.5 Car Rentals 18 610 120 2.4 Boat 28 601 121 3.5 Tours and Activities Paid for On Shore 133 508 107 17.8 Tours and Activities Paid for Prior to Arrival (i.e. purchased on the boat or as a prepaid package)
331 336 81 44.3
Entertainment/Recreation (water sports, diving etc)
31 601 116 4.1
Local Shopping (i.e. souvenirs and handicrafts)
545 147 56 72.9
Duty Free Shopping 443 234 71 59.2 All Other 35 596 117 4.7
Average Spending on different items in Vanuatu by those who spent (Q6)
ITEMS Frequency ‘Yes’
Percent ‘Yes’
Mean Vatu
Relative Sampling Error %
5% Trimmed Mean
Median Vatu
Meals & Drinks 340 45.5 3717 22% 2422 1715 Taxi/Bus 587 78.5 2942 11% 2363 1817 Car Rentals 18 2.4 6436 39% 6197 6023 Boat 28 3.5 11443 58% 8519 7739 Tours and Activities Paid for On Shore
133 17.8 10603 17% 9417 6385
Tours and Activities Paid for Prior to Arrival (i.e. purchased on the boat or as a prepaid package)
331 44.3 16964 16% 14465 12769
Entertainment/Recreation (water sports, diving etc)
31 4.1 7330 36% 6450 5088
Local Shopping (i.e. souvenirs and handicrafts)
545 72.9 9427 9% 8211 6360
Duty Free Shopping 443 59.2 17246 12% 14233 9389 All Other 35 4.7 14337 73% 8962 3654
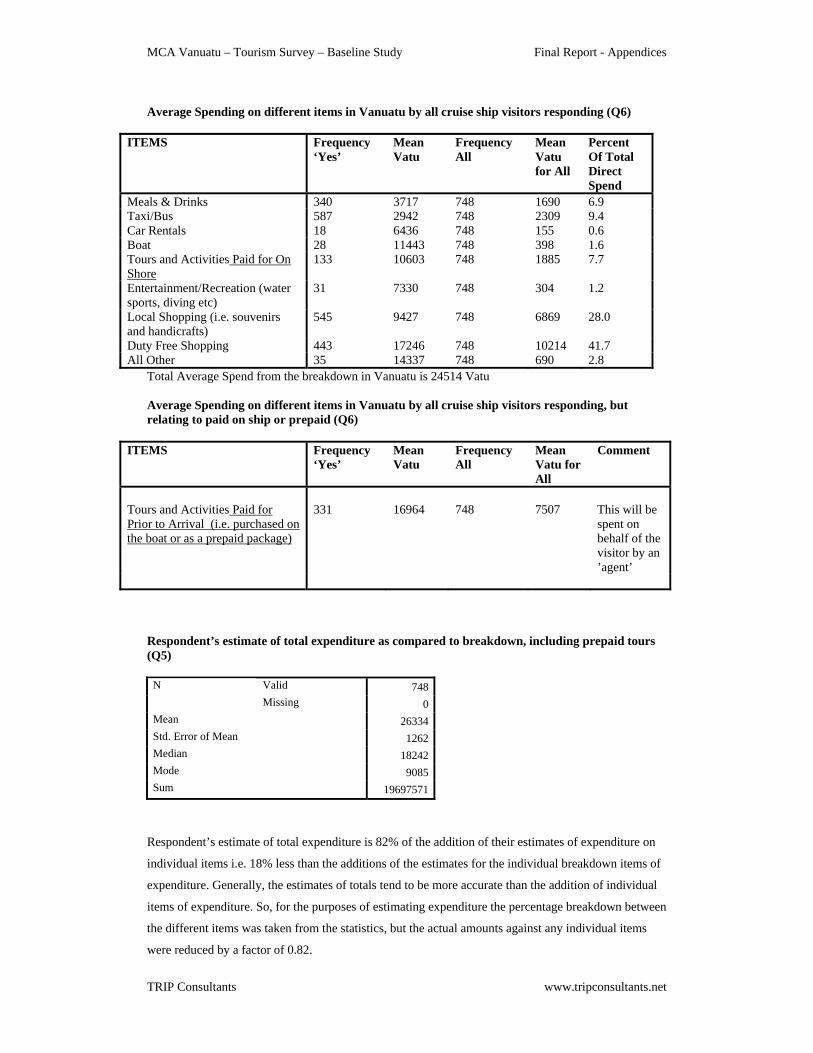
MCA Vanuatu – Tourism Survey – Baseline Study Final Report - Appendices
TRIP Consultants www.tripconsultants.net
Average Spending on different items in Vanuatu by all cruise ship visitors responding (Q6)
ITEMS Frequency ‘Yes’
Mean Vatu
Frequency All
Mean Vatu for All
Percent Of Total Direct Spend
Meals & Drinks 340 3717 748 1690 6.9 Taxi/Bus 587 2942 748 2309 9.4 Car Rentals 18 6436 748 155 0.6 Boat 28 11443 748 398 1.6 Tours and Activities Paid for On Shore
133 10603 748 1885 7.7
Entertainment/Recreation (water sports, diving etc)
31 7330 748 304 1.2
Local Shopping (i.e. souvenirs and handicrafts)
545 9427 748 6869 28.0
Duty Free Shopping 443 17246 748 10214 41.7 All Other 35 14337 748 690 2.8
Total Average Spend from the breakdown in Vanuatu is 24514 Vatu Average Spending on different items in Vanuatu by all cruise ship visitors responding, but relating to paid on ship or prepaid (Q6)
ITEMS Frequency ‘Yes’
Mean Vatu
Frequency All
Mean Vatu for All
Comment
Tours and Activities Paid for Prior to Arrival (i.e. purchased on the boat or as a prepaid package)
331 16964 748 7507 This will be spent on behalf of the visitor by an ’agent’
Respondent’s estimate of total expenditure as compared to breakdown, including prepaid tours (Q5)
Valid 748N Missing 0
Mean 26334Std. Error of Mean 1262Median 18242Mode 9085Sum 19697571
Respondent’s estimate of total expenditure is 82% of the addition of their estimates of expenditure on
individual items i.e. 18% less than the additions of the estimates for the individual breakdown items of
expenditure. Generally, the estimates of totals tend to be more accurate than the addition of individual
items of expenditure. So, for the purposes of estimating expenditure the percentage breakdown between
the different items was taken from the statistics, but the actual amounts against any individual items
were reduced by a factor of 0.82.
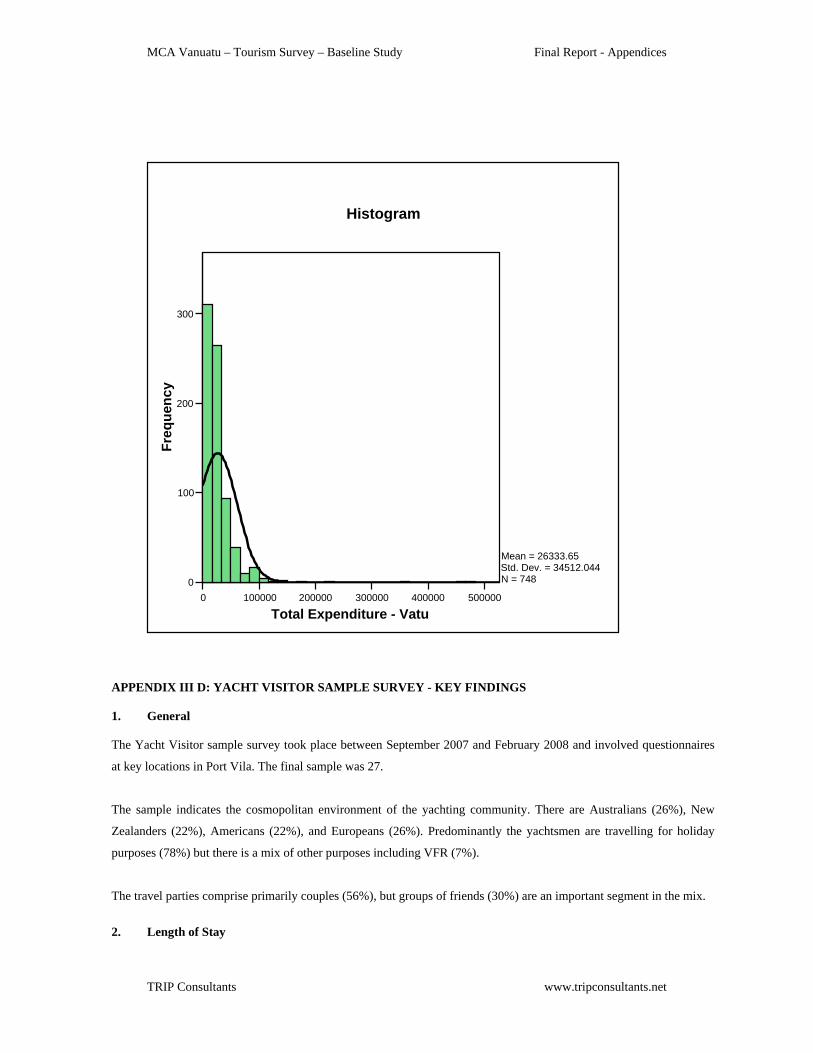
MCA Vanuatu – Tourism Survey – Baseline Study Final Report - Appendices
TRIP Consultants www.tripconsultants.net
0 100000 200000 300000 400000 500000
Total Expenditure - Vatu
0
100
200
300
Freq
uenc
y
Mean = 26333.65Std. Dev. = 34512.044N = 748
Histogram
APPENDIX III D: YACHT VISITOR SAMPLE SURVEY - KEY FINDINGS
1. General The Yacht Visitor sample survey took place between September 2007 and February 2008 and involved questionnaires
at key locations in Port Vila. The final sample was 27.
The sample indicates the cosmopolitan environment of the yachting community. There are Australians (26%), New
Zealanders (22%), Americans (22%), and Europeans (26%). Predominantly the yachtsmen are travelling for holiday
purposes (78%) but there is a mix of other purposes including VFR (7%).
The travel parties comprise primarily couples (56%), but groups of friends (30%) are an important segment in the mix.
2. Length of Stay

MCA Vanuatu – Tourism Survey – Baseline Study Final Report - Appendices
TRIP Consultants www.tripconsultants.net
Reflecting the ambiance of the yachting community, the length of stay in Vanuatu is substantial. The sample indicated a
mean of the stay to date plus the expected further days stay to be 59.6 nights with a Relative Sampling Error of +/- 26%.
This length of stay is very much greater than the length of stay either for international visitors (7.7 nights) or for
domestic travellers (10.1 nights), and is characteristic of the yachting community.
3. Breakdown of Expenditure The sample has indicated the breakdown of their expenditure on their visit to date. So far 36 nights have been
completed out of an expected average of 60 nights – approximately 60% of the trip visit.
Figure 1: Breakdown of Yacht Passenger Spending on different items Source: Yacht Visitor Sample Survey 2007 Expenditure by Yacht visitors reflects their particular needs (Figure 1). Spending has to occur on boat maintenance and
fuel. They spend relatively little on items such as car rental or tours. Duty free shopping is not a high priority for them.
They do spend on local meals and drinks and have a range of other items on which they spend.
The sample indicated that their expected expenditure per day for the remainder of their stay would be Vatu 5,600, which
is some 36% higher than their expenditure to date. Allowing for this expected extra expenditure, the daily spend per
yachtsman can be estimated at Vatu 4,711. This is a relatively low daily spend when compared with Cruise Visitors
and indeed lower on a daily basis than domestic travellers.
4. Estimating the total yacht visitor expenditure The Sample Survey has given estimates for the average spend of Vatu 4,711 per day per yachtsman who on average will
stay 60 days, giving a substantial total expenditure of 282,660 Vatu per yachtsman.
0
5
10
15
20
25
Perc
ent
Boat M
ainten
ance Fu
el
Accommoda
tion
Other Mea
ls & D
rinks
Taxi/B
us
Car Ren
tal
Boats
Tours
Enter ta
inmen
t
Shoppin
g
Duty F
reeOthe
r

MCA Vanuatu – Tourism Survey – Baseline Study Final Report - Appendices
TRIP Consultants www.tripconsultants.net
Assuming an occupancy of 3.1 yachtsmen per yacht, an average yacht would bring in Vatu 876,246.
Using the 2006 figures, some 304 yachts came for the season with 954 yachtsmen (3.1 occupancy), then the total
expenditure would be around Vatu 0.27 billion, assuming the same for 2007.
ATTACHMENT 1: KEY STATISTICAL TABLES FROM THE YACHT VISITOR SAMPLE SURVEY Country of Residence (Q1)
Frequency Percent Cumulative
Percent Australia 7 25.9 25.9 New Zealand 6 22.2 48.1 USA 6 22.2 70.4 European Union 5 18.5 88.9 Other Europe 2 7.4 96.3 Other 1 3.7 100.0 Total 27 100.0
Main Purpose of Visit (Q3)
Frequency Percent Cumulative
Percent Holiday 21 77.8 77.8 Visit friends and relatives 2 7.4 85.2 Other 4 14.8 100.0 Total 27 100.0
Travel Party (Q4)
Frequency Percent Cumulative
Percent spouse/partner only 15 55.6 55.6 Family 4 14.8 70.4 group/friends 8 29.6 100.0 Total 27 100.0
Length of Stay (Q6 & Q7)
Statistic Std. Error Mean 59.56 7.982
Lower Bound 43.15 95% Confidence Interval for Mean Upper Bound 75.96 5% Trimmed Mean 58.51 Median 52.00 Interquartile Range 73 Skewness .475 .448
Total Nights so far plus expected further nights
Kurtosis -1.131 .872

MCA Vanuatu – Tourism Survey – Baseline Study Final Report - Appendices
TRIP Consultants www.tripconsultants.net
0 20 40 60 80 100 120
Nights Stayed in Vanuatu so far on this trip (Q6)
0
2
4
6
8
10
12
Freq
uenc
y
Mean = 36.4Std. Dev. = 34.793N = 25
Histogram
Average Spending on different items in Vanuatu by all yacht visitors on their stay to date (Average was 36.4 nights) (Q9) ITEMS Mean
Vatu Percent Of Total
Boat Maintenance 22,900 15.3 Fuel 13,113 8.7 Accommodation 20,675 13.8 Meals & Drinks 34,170 22.8 Taxis/Buses 8,445 5.6 Car Rentals 631 0.4 Local Boat Transport 179 0.1 Tours and Activities 4,938 3.3 Entertainment/Recreation 4,359 2.9 Local Shopping 13,200 8.8 Duty Free Shopping 2,343 1.6 All Other 24,980 16.7 Expected expenditure per day (Q10)
Statistic Std. Error Mean 5600.43 1863.633
Lower Bound 1735.50 95% Confidence Interval for Mean Upper Bound 9465.37 5% Trimmed Mean 3980.68 Median 3500.00
Expected Daily Expenditure per person for remainder of your stay (Vatu)

MCA Vanuatu – Tourism Survey – Baseline Study Final Report - Appendices
TRIP Consultants www.tripconsultants.net
APPENDIX III E: DOMESTIC SAMPLE SURVEY - KEY FINDINGS
1. General The Domestic sample survey took place between September and December 2007 and involved questionnaires in the
domestic departure lounges in the airports of Efate, Tanna and Santo. The final sample was 202.
Business was the predominant motive for the trip (38%), whilst a series of other purposes (26%) was significant.
Holiday (23%) and VFR travel (14%) were minority segments (Figure 1).
Figure 1: Main purpose of visit - Domestic Travel (Q1)
05
10152025303540
Perc
ent
Holiday Business VFR Other
Source: Domestic sample survey 2007 The majority of domestic travellers are travelling alone (63%). Travelling with family represents only 16% of travellers,
and travelling in a group or with friends involves only 12% of travellers.
The prime routes for domestic travel are between Efate and Santo and between Efate and Tanna.
2. Length of Stay The average trip is for 10.1 nights with a Relative Sampling Error of +/- 13%. Length of stay according to purpose of
trip varies with Holiday travellers staying 12.7 nights, VFR travellers staying 13.2 nights and Other purpose travellers
staying 13.7 nights. Business travellers make a much shorter trip averaging 4.9 nights.
3. Breakdown of Expenditure The sample results indicate that the mean of the total expenditure on the trip was Vatu 39,596 with a relative sampling
error of +/- 11%. On an average trip of 10.1 nights, this would give a daily spend of around 3,920 Vatu.
Domestic travellers focus their spending on shopping and a variety of other items (Figure 2 and Table 1). Items such as
tours and entertainment/ recreation are enjoyed neither by substantial proportions of the domestic travellers, nor is their
average spend high on these items, in contrast to international holiday travellers.

MCA Vanuatu – Tourism Survey – Baseline Study Final Report - Appendices
TRIP Consultants www.tripconsultants.net
Figure 2: Proportions of Domestic Travellers spending on different items Source: Domestic Sample Survey 2007 Table 1 - Proportions spending on different items, and breakdown of spending between the different items
Items of Expenditure Percent
Spending Percent
Accommodation (Including meals & drinks at hotel)
50.5
15.2
Other Meals & Drinks (Other than in the hotel)
89.1
13.5
Taxi/Car Rentals
84.2
9.0
Tours
4.0
0.4
Entertainment/Recreation (water sports, diving etc)
10.4
0.7
Shopping (Including Duty Free and Handicrafts)
89.6
34.8
All Other (Including departure tax)
84.7
26.4
Source: Domestic Sample Survey 2007
4. Estimating the total domestic tourism expenditure The Sample Survey has given estimates for the average length of stay and for the expenditure breakdown for trips by
domestic travellers.
Numbers of domestic travellers multiplied by the average spend per trip would give an indication of the scale of
domestic tourism.
The numbers of the resident domestic population are relatively small, and those in a position to make domestic tourism
trips are few.
0102030405060708090
Perc
ent
Accom
modati
on
Other M
eals
& Drin
ks
Taxi/C
ar Ren
tal
Tours
Enterta
inmen
t
Shopp
ingOthe
r

MCA Vanuatu – Tourism Survey – Baseline Study Final Report - Appendices
TRIP Consultants www.tripconsultants.net
Total population in 2006 is as follows: -
Vanuatu 221,507
Urban 50,692
Rural 170,815
Province
Malampa 34,925
Penama 33,180
Sanma 41,595
Shefa 68,706
Tafea 33,848
Torba 9,253
Number of Households 43,312
GDP Per capita – 2005 Vatu 185,000
Source: National Statistics Office Domestic trips in 2007 have been estimated at 75,000 and total domestic tourism (air) expenditure has been estimated at
approximately Vatu 3 billion.
ATTACHMENT 1 - STATISTICAL TABLES FOR THE DOMESTIC SAMPLE SURVEY Island of Residence of Respondent
Frequency Percent Cumulative
Percent Efate 52 25.7 25.7 Santo 70 34.7 60.4 Tanna 22 10.9 71.3 Malekula 9 4.5 75.7 Ambrym 1 .5 76.2 Others 24 11.9 88.1 Not Stated 24 11.9 100.0 Total 202 100.0
Main purpose of visit (Q1)
Frequency Percent Cumulative
Percent Holiday 46 22.8 22.8 Business 76 37.6 60.4 Visit friends and relatives 28 13.9 74.3 Other 51 25.2 99.5

MCA Vanuatu – Tourism Survey – Baseline Study Final Report - Appendices
TRIP Consultants www.tripconsultants.net
Not stated 1 .5 100.0 Total 202 100.0
Island of Residence by Main purpose of visit (Q1) Crosstabulation
Main purpose of visit (Q1) Total Island of Residence Holiday Business
Visit friends and relatives Other Not stated
Efate Count 10 17 11 13 1 52 % 19.2% 32.7% 21.2% 25.0% 1.9% 100.0% Santo Count 18 31 5 16 0 70 % 25.7% 44.3% 7.1% 22.9% .0% 100.0% Tanna Count 4 14 3 1 0 22 % 18.2% 63.6% 13.6% 4.5% .0% 100.0% Malekula Count 3 3 0 3 0 9 % 33.3% 33.3% .0% 33.3% .0% 100.0% Ambrym Count 0 0 0 1 0 1 % .0% .0% .0% 100.0% .0% 100.0% Others Count 3 6 4 11 0 24 % 12.5% 25.0% 16.7% 45.8% .0% 100.0% Not Stated Count 8 5 5 6 0 24 % 33.3% 20.8% 20.8% 25.0% .0% 100.0%Total Count 46 76 28 51 1 202 % 22.8% 37.6% 13.9% 25.2% .5% 100.0%
Travel Party (Q2A)
Frequency Percent Cumulative
Percent Alone 127 62.9 62.9 Spouse/partner only 17 8.4 71.3 Family 33 16.3 87.6 Group/friends 24 11.9 99.5 Not stated 1 .5 100.0 Total 202 100.0
Length of Stay - Nights (Q3)
Statistic Std. Error Mean 10.06 .681 95% Confidence Interval for Mean Lower Bound 8.72 Upper Bound 11.41 5% Trimmed Mean 8.98 Median 7.00 Minimum 1 Maximum 74 Range 73 Interquartile Range 10 Skewness 2.737 .171
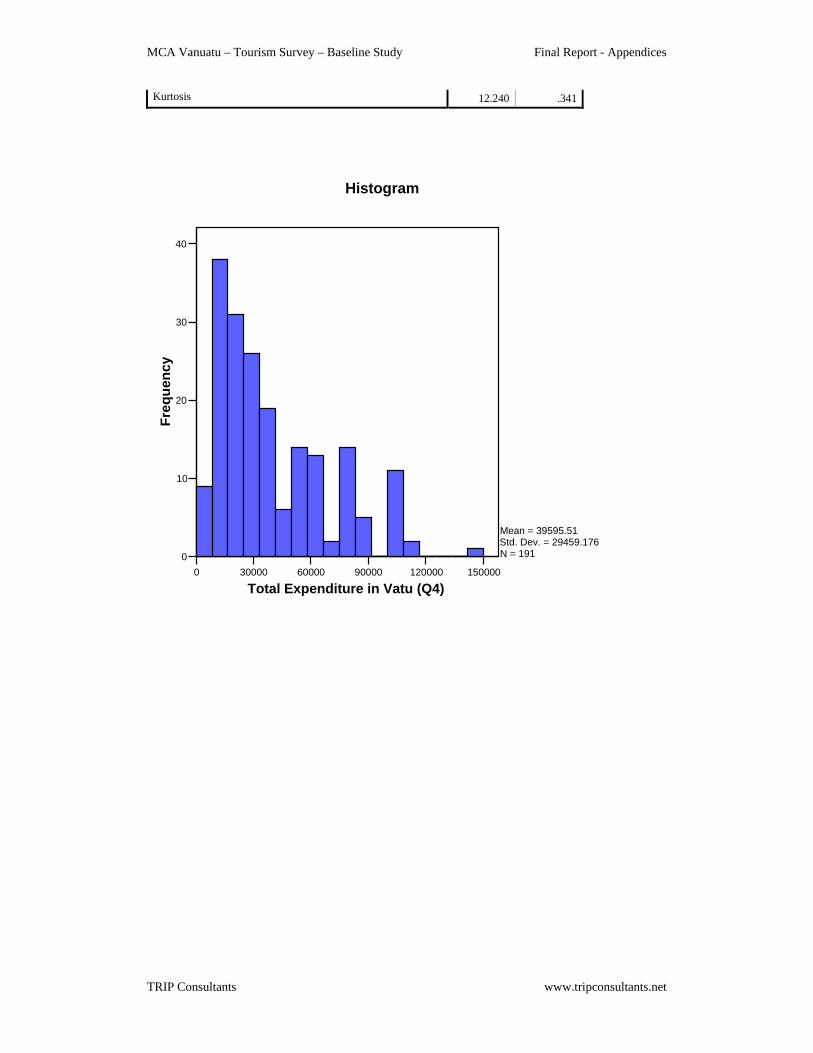
MCA Vanuatu – Tourism Survey – Baseline Study Final Report - Appendices
TRIP Consultants www.tripconsultants.net
Kurtosis 12.240 .341
0 30000 60000 90000 120000 150000
Total Expenditure in Vatu (Q4)
0
10
20
30
40
Freq
uenc
y
Mean = 39595.51Std. Dev. = 29459.176N = 191
Histogram

MCA Vanuatu – Tourism Survey – Baseline Study Final Report - Appendices
TRIP Consultants www.tripconsultants.net
APPENDIX III F: BACKGROUND STATISTICS ON EMPLOYMENT
FORMAL SECTOR EMPLOYMENT BY INDUSTRY
1999 2000 2001 2003 2004 2005 2006
Industry (a) (b) ( c) (e) (e) (e) (e)
Agriculture, forestry and fishing 706 748 836
Manufacturing 1,199 1,273 1,423
Electricity, gas and water 147 156 174
Construction 790 838 937
Wholesale and retail trade 2,327 2,466 2,758
Hotels and restaurants 1,539 1,631 1,824
Transport and communication 969 1,027 1,152
Finance and insurance 429 455 510
Other business services 502 532 790
Other services 633 671 750
Government services 4,861 4,475 3,894
Non-agricultural wage employment Total 14,102 14,272 15,048 17297 17222 17702 20538
INFORMAL SECTOR EMPLOYMENT
1999 2000
Sector (d)
Transport 754 758
Nakamals 684 687
Retail 3,510 3,529
Cooperatives 53 54
Manufacturing 480 485
Fishing 150 152
Handicraft 279 277
Open air vendors 70 70
Subsistence Farmers 51,309 52,335
Total 57,289 58,347
excluding Farmers 5,980 6,012
Source: National Statistical Office
Sources: (a) 1999 Population and Housing Census
(b) Labour Market Survey 2000
( c) Estimates Based on VNPF Data
(d) Informal Sector Survey 2000
(e) Derived from Vanuatu National Provident Fund
MCA Vanuatu – Tourism Survey – Baseline Study Final Report - Appendices
TRIP Consultants www.tripconsultants.net
APPENDIX III G: TRANSPORT ISSUES - KEY FINDINGS 1. GENERAL This Appendix gives background information from the various sample surveys on a number of the
transport issues with which the development of tourism has become involved that are internal to the
country.
These issues concern:
• Visits to different parts of Efate by tourists
• The use of tourism transport facilities by tourists
• Visits to the Other Islands other than Efate by tourists
• Transport costs for businesses
Each of these issues is discussed in the following sub-sections under the different sample surveys.
2. INTERNATIONAL TOURISTS Visits to different parts of Efate by tourists For international tourists, some 59% indicate that they travelled to other parts of Efate. Percentages
visiting key locations in Efate were as follows: -
Hideaway Island 32.9%
Mele Cascades 28.3%
Round Island Tour 19.8%
North Efate/ Havannah Harbour 13.0%
Other sites 22.2%
In addition to the above, there were a whole range of sites quoted under ‘Other Sites’ as being visited
by tourists (See Attachment). Clearly international tourists to Vanuatu want to see different sites. It is
not a ‘stay in the resort hotel’ style of tourist destination.
The use of tourism transport facilities by tourists The sample survey showed a substantial number of tourists using buses and taxis for travelling to
different parts of Efate Island, a combined percentage of 41%. Car rental is modestly used at 6% (Table
1).
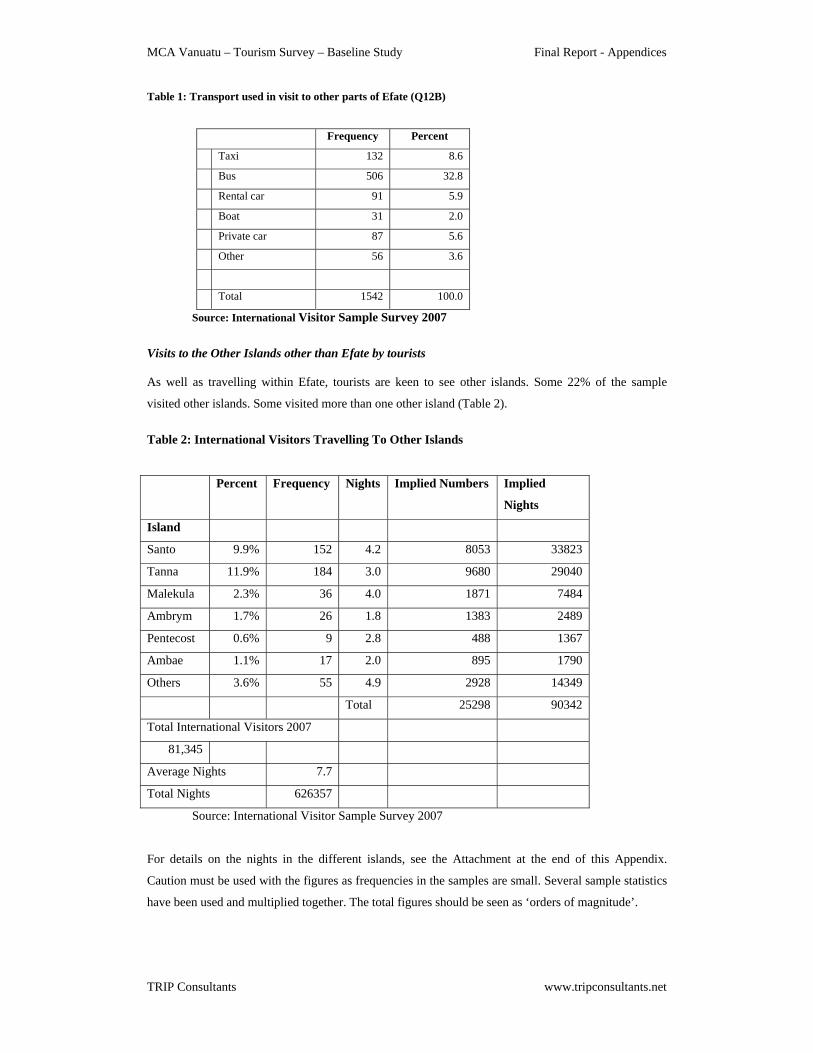
MCA Vanuatu – Tourism Survey – Baseline Study Final Report - Appendices
TRIP Consultants www.tripconsultants.net
Table 1: Transport used in visit to other parts of Efate (Q12B)
Frequency Percent
Taxi 132 8.6
Bus 506 32.8
Rental car 91 5.9
Boat 31 2.0
Private car 87 5.6
Other 56 3.6
Total 1542 100.0
Source: International Visitor Sample Survey 2007
Visits to the Other Islands other than Efate by tourists As well as travelling within Efate, tourists are keen to see other islands. Some 22% of the sample
visited other islands. Some visited more than one other island (Table 2).
Table 2: International Visitors Travelling To Other Islands
Percent Frequency Nights Implied Numbers Implied
Nights
Island
Santo 9.9% 152 4.2 8053 33823
Tanna 11.9% 184 3.0 9680 29040
Malekula 2.3% 36 4.0 1871 7484
Ambrym 1.7% 26 1.8 1383 2489
Pentecost 0.6% 9 2.8 488 1367
Ambae 1.1% 17 2.0 895 1790
Others 3.6% 55 4.9 2928 14349
Total 25298 90342
Total International Visitors 2007
81,345
Average Nights 7.7
Total Nights 626357
Source: International Visitor Sample Survey 2007
For details on the nights in the different islands, see the Attachment at the end of this Appendix.
Caution must be used with the figures as frequencies in the samples are small. Several sample statistics
have been used and multiplied together. The total figures should be seen as ‘orders of magnitude’.

MCA Vanuatu – Tourism Survey – Baseline Study Final Report - Appendices
TRIP Consultants www.tripconsultants.net
3. CRUISE VISITORS
Visits to different parts of Efate by Cruise Visitors
For Cruise Visitors, some 36.9% indicate that they travelled to other parts of Efate. Percentages visiting
key locations in Efate were as follows: -
Hideaway Island 10.4%
Mele Cascades 13.8%
Round Island Tour 10.4%
North Efate/ Havannah Harbour 0.9%
Eton Beach 1.7%
Blue White Sands 3.1%
Other sites 10.6%
In addition to the above, there were a whole range of sites quoted under ‘Other Sites’ as being visited
by Cruise Visitors. Clearly Cruise Visitors to Vanuatu do want to see different sites and get around the
island as well as finding time for their shopping activities.
The use of tourism transport facilities by Cruise Visitors
The sample survey showed a substantial number of tourists using buses and taxis for travelling to
different parts of Efate Island, a combined percentage of 32%. Car rental is modestly used at 2% (Table
3).
Table 3: Transport used in visits to other parts of Efate by Cruise Visitors
Source: Cruise Visitor Sample Survey 2007 Visits to the Other Islands other than Efate by Cruise Visitors
Some 15.9% of Cruise Visitors indicated that they had visited Other islands in Vanuatu other than
Efate. Some had visited more than one island (Table 4).
Frequency Percent Taxi 101 13.5 Bus 138 18.4 Rental car 18 2.4 Boat 5 .7 private car 3 .4 Other 14 1.9 Total 748 100.0

MCA Vanuatu – Tourism Survey – Baseline Study Final Report - Appendices
TRIP Consultants www.tripconsultants.net
Table 4: Cruise Visitors Travelling to Other Islands
Percent Frequency Days Implied Numbers Implied Days
Island
Santo 13.6% 102 1.3 11,685 15,190
Tanna 0.0% 0 0 0 0
Malekula 9.1% 68 1.0 7,819 7,819
Mystery 0.7% 5 1.0 601 601
Others 0.7% 5 1.0 601 601
Total 20,706 24,211
Total Cruise Visitors 2007
85,922
Average Days 1.0
Total Days in Efate 85,922
Source: Cruise Visitor Sample Survey 2007
Expenditure in the Other Islands by Cruise Visitors The sample survey indicates that expenditure on the other islands is much less than on Efate. Partly this
may be because of the lack of spending opportunities on Other Islands
The Frequencies are small for information on expenditure on Other islands so the figures must be
treated with some caution (Table 5). Several sample statistics have been used and multiplied together.
The total figures should be seen as ‘orders of magnitude’.
Table 5: Total Expenditure by Cruise Visitors in Other Islands
Spending Item Frequency Percent
spending
on this
item
Implied
Numbers
Spend by
those
Spending -
Vatu
Total
Expenditure
Vatu m
Meals & Drinks 32 27% 5568 3301 18.4
Taxis & Buses 16 13% 2784 4530 12.6
Car Rental 0 0% 0 0 0.0
Local Boat Trips 2 2% 348 1136 0.4
Tours bought on shore 23 19% 4002 4856 19.4
Tours bought Beforehand 15 13% 2610 10621 27.7
Entertainment/ Recreation 3 3% 522 2036 1.1
Local Shopping 37 31% 6438 5077 32.7
Duty Free Shopping 4 3% 696 13554 9.4
Other 2 2% 348 894 0.3

MCA Vanuatu – Tourism Survey – Baseline Study Final Report - Appendices
TRIP Consultants www.tripconsultants.net
Total 122.0
Total Frequency Visiting Other Islands 119
Source: Cruise Visitor Sample Survey 2007
Several sample statistics have been used and multiplied together. The total expenditure figure should be
seen as an ‘order of magnitude’.
4. YACHT VISITORS Visits to different parts of Efate by Yacht Visitors For Yacht Visitors, some 63% indicate that they travelled to other parts of Efate. Percentages visiting
key locations in Efate were as follows: -
Hideaway Island 33%
Mele Cascades 26%
Round Island Tour 26%
North Efate/ Havannah Harbour 0%
Eton Beach 7%
Blue Water Resort/ White Sands 0%
Other sites 11%
In addition to the above, only Irriki and Emau Island are mentioned apart from a couple of the leading
hotels.
The use of tourism transport facilities by Yacht Visitors
The sample survey showed a substantial number of yacht visitors using buses for travelling to different
parts of Efate Island. Car rental and taxis appear to be of minimal interest to Yachties, probably
reflecting their long length of stay and modest daily expenditure levels (Table 6).
Table 6: Transport used in visits to other parts of Efate by Yacht Visitors Frequency Percent
Bus 11 40.7 rental car 1 3.7 Boat 2 7.4 Private car 2 7.4 Other 1 3.7 Total 27 100.0
Source: Yacht Visitor Sample Survey 2007

MCA Vanuatu – Tourism Survey – Baseline Study Final Report - Appendices
TRIP Consultants www.tripconsultants.net
Visits to the Other Islands other than Efate by Yacht Visitors
The sample indicates that the Yachtsmen do travel around the islands. Some 74% indicated that they had visited other
islands in Vanuatu including the following (Table 7): -
Table 7: Yachtsmen’s Visits to Islands other than Efate
Other Island Visited Percentage of all Yachtsmen visi Approximate Stay in Nights
Santo 30% 13 – 20 nights
Tanna 44% 4 - 21 nights
Malekula 48% 4 – 20 nights
Ambrym 46% 4 – 15 nights
Others 41% 2 – 30 nights
Source: Yacht Visitor Sample Survey 2007
Expenditure in the Other Islands by Yacht Visitors The sample survey indicates that expenditure on the other islands is less than on Efate. Partly this may
be because of the lack of spending opportunities on Other Islands
The Frequencies are small for information on expenditure on Other islands so the figures must be
treated with extreme caution (Table 8). Several sample statistics have been used and multiplied
together. The total figure should be seen as an ‘order of magnitude’.
Table 8: Total Expenditure by Cruise Visitors in Other Islands
954 Yachtsmen
Other
Island
Visited
Percentage of all
Yachtsmen
visiting
Average
Length of Stay
Implied
Numbers
Implied
Nights
Spend Vatu
Millions
Santo 30% 17 286 4722 10.4
Tanna 44% 8 420 3218 7.1
Malekula 48% 11 458 4865 10.7
Ambrym 46% 7 439 3072 6.8
Others 41% 9 391 3364 7.4
Average
Spend
2200 Vatu per day Total 19242 42.3
Source: Yacht Visitor Sample Survey 2007

MCA Vanuatu – Tourism Survey – Baseline Study Final Report - Appendices
TRIP Consultants www.tripconsultants.net
5. DOMESTIC TOURISTS Visits to different Islands by Domestic Tourists The sample was drawn from domestic tourists departing from the airports in Efate, Santo and Tanna so
inevitably this colours the pattern of travel recorded, but this captures the main flows between islands
(Table 9).
Table 9: Domestic Travel from and to in the sample
Island of
Residence Frequency
Visiting
Santo
Visiting
Tanna
Visiting
Malekula
Visiting
Ambrym
Visiting
Others
Efate 52 21 31 0 0 2
Santo 70 0 2 0 0 69
Tanna 22 1 2 0 0 19
Malekula 9 6 0 0 0 3
Ambrym 1 0 0 0 0 1
Others 24 0 13 0 0 11
Not Stated 24 23 1 0 0 0
Total 202 51 49 0 0 105
In Table 9, ‘Visiting Others’ will mainly involve Efate for Residents of Santo, Tanna, Malekula and
Ambrym.
Table 10: Transport used in travelling in destination
Frequency Percent
Taxi 95 47.0
Bus 63 31.2
rental car 6 3.0
Private car 25 12.4
Other 12 5.9
Total 202 100.0
Domestic tourists heavily use taxis and buses (combined 78%), though a significant proportion have
access to private cars (12%) (Table 10).

MCA Vanuatu – Tourism Survey – Baseline Study Final Report - Appendices
TRIP Consultants www.tripconsultants.net
6. BUSINESS SURVEY The Business Survey attempted to ascertain how significant the issue of transport costs might be to the
various tourism-related businesses.
Fuel and Transport Costs are seen as really substantial items for the tourism businesses, but it is
reasonable to say that fuel is not only used for transport purposes, it can be used for power generation
etc.
Table 11: Transport and Fuel Costs for Businesses
Fuel and Transport Costs as
percentage of turnover
Not sourced locally
Hotels and Accommodation 31% 58%
Tour Operators 25% 53%
Other Transport 12% 37%
Wholesale/retail 4% 100%
The figures from the sample have to be treated with caution because the frequencies are not large
(Table11), and they should not be used for carrying out further calculations.
The interpretation that can be put upon these figures is that transport and fuel costs are seen as
significant costs in the tourism operations. Not surprisingly most of these costs cover items that have to
be imported. So, the efficient and effective use of these resources is mandatory for the benefit of the
local Vanuatu economy.

MCA Vanuatu – Tourism Survey – Baseline Study Final Report - Appendices
TRIP Consultants www.tripconsultants.net
ATTACHMENT 1 - STATISTICAL TABLES ON TRANSPORT INTERNATIONAL Other Places in Efate specified, included: - Banana Bay
Beachcomber
Benjor
Bethel Village
Black Sands
Blue Water Island
Bukura Devils Point.
Cagoola
Castaway Snorkeling
Club Hippique
Congoola Cruise
Coonies Place
Coral Island
Ekasup Cultural Village
Emua Village
Erakor
Eratap Resort
Eratap, Pango
Eton Beach
Hat Island
Honey Bay
Iririki Island
Lelepa Day Tour
Lololima Falls
Moso Island
Nguna Island
Pango Point
Paradise Cove
Pele Island
Survivor Island
Tamanu Beach
Tara Beach
Tranquility Island
Turtle Bay
Undine Bay
Whitesands
WW2 Caves

MCA Vanuatu – Tourism Survey – Baseline Study Final Report - Appendices
TRIP Consultants - 1 - www.tripconsultants.net
0 10 20 30 40
Number of Nights spent on Santo
0
20
40
60
80
Freq
uenc
y
Mean = 4.2Std. Dev. = 5.549N = 152
Histogram
0 10 20 30 40
Number of Nights spent on Tanna
0
20
40
60
80
100
Freq
uenc
y
Mean = 2.97Std. Dev. = 4.613N = 184
Histogram
0 5 10 15 20 25 30
Number of Nights spent on Malekula
0
5
10
15
20
25
30
Freq
uenc
y
Mean = 4Std. Dev. = 7.227N = 36
Histogram
0 2 4 6 8 10
Number of Nights spent on Ambryn
0
5
10
15
20
Freq
uenc
y
Mean = 1.85Std. Dev. = 2.618N = 26
Histogram
ATTACHMENT 2- INTERNATIONAL – LENGTH OF STAY IN OTHER ISLANDS

MCA Vanuatu – Tourism Survey – Baseline Study Final Report - Appendices
TRIP Consultants - 2 - www.tripconsultants.net
0 1 2 3 4 5 6 7
Number of Nights spent on Pentecost
0.0
0.5
1.0
1.5
2.0
2.5
3.0
Freq
uenc
y
Mean = 2.78Std. Dev. = 2.108N = 9
Histogram
0 2 4 6 8 10
Number of Nights spent on Ambae
0
2
4
6
8
10
Freq
uenc
y
Mean = 2Std. Dev. = 2.424N = 17
Histogram
0 5 10 15 20 25
Number of Nights spent on Other Islands
0
5
10
15
20
Freq
uenc
y
Mean = 4.91Std. Dev. = 5.365N = 55
Histogram

MCA Vanuatu – Tourism Survey – Baseline Study Final Report - Appendices
TRIP Consultants - 3 - www.tripconsultants.net
APPENDIX III H: KEY FINDINGS FROM THE TOURISM BUSINESS SURVEY 1. General The Tourism Business Survey took place from September 2007 to February 2008. Some 103
questionnaires and telephone interviews were completed out of an initial contact database of 350
companies connected to the tourism sector.
Businesses in islands other than Efate were interviewed but the sample is too small to distinguish
between the islands (Table 1).
Table 1: Type of Business by Island on which business is located – Cross-tabulation
Type of Business Island on which business is located Total
EFATE SANTO MALEKULA TANNA OTHER Hotel/ Accommodation 32 5 1 6 3 47 Tour operator/Inbound
operator 14 7 0 2 0 23
Other transport 3 1 0 0 1 5 Retail/shops 6 2 0 0 0 8 Other 18 0 0 0 2 20Total 73 15 1 8 6 103
Source: Tourism Business Survey 2007/08 The broad intention of the Tourism Business Survey was to try to understand the operations of the
businesses with a view to assessing various economic variables, including the value added that they
are achieving, the employment that they are generating and various aspects associated with what is
called ‘leakage’ or ‘retention’.
A reasonable coverage according to the size of the businesses was achieved as can be seen in the
Tables in the Attachment at the end of this Appendix. Businesses had turnovers of between ‘< I
million Vatu’ through to more than ‘Vatu 400 million’. Overall the sample businesses covered a
turnover of more than Vatu 7 billion.
2. Value Added Value added was calculated from estimates of the business operations of the sampled companies
that are described as labour costs (compensation of employees) and gross operating profits (gross
operating surpluses).
From the sample, value added varies between 40.8% and 55.1% according to the different types of
business (Table 2)

MCA Vanuatu – Tourism Survey – Baseline Study Final Report - Appendices
TRIP Consultants - 4 - www.tripconsultants.net
Table 2: Value Added according to different types of businesses Type of Business Total
Items as percentage of gross revenue
Hotel/ Accommodation
Tour operator/ Inbound operator
Other transport
Retail/ shops
Other services
Gross Operating Profit% 16.2 17.7 20.5 21.4 15.5 17.7 Labour Cost (%) 24.6 27.2 25.5 33.7 34.4 27.1 Value Added % 40.8 44.9 46.0 55.1 49.9 44.7
Source: Tourism Business Survey 2007/08 Value-added is the key contribution to Gross Domestic Product. Whilst the businesses interviewed
are a sample of the businesses the frequencies are very small and the responses are percentages
given by the respondents on behalf of their businesses. The averages are simple averages of the
various responses by the businesses. As such these averages should be seen as indicative. On
balance, our judgement is that the estimates for value-added appear reasonable when considered
against the National Accounts and other sources.
3. Employment Our sample of businesses covered full time employment of more than 1200 and part-time
employment of more than 500.
Whilst employees in hotels and tour operations could be described as employees wholly dedicated
to tourism employment, this may not be the case in some of the other industries such as retail
shops, banking services etc.
Table 3: Employment in the businesses in the sample by the islands EFATE SANTO MALEKULA TANNA OTHER Total Full Time 1009 140 2 68 30 1249Part-time 295 66 5 25 148 539FTE 3.0 98 22 2 8 49 180Expatriate 48 4 0 0 2 54Total FTE 1155 166 4 76 81 1483 Breakdown 77.9% 11.2% 0.2% 5.1% 5.5% 100.0% Part-time as % Full-time 29.2% 47.1% 250.0% 36.8% 493.3% 43.2%Expatriate as % FTE 4.2% 2.4% 0.0% 0.0% 2.5% 3.6%
Source: Tourism Business Survey 2007/08 There is no simple way to extend the numbers from the sample into an estimate of employment for
the ‘population’. A crude extrapolation by 3.5 to allow for a sample of 103:350 would give a full-
time equivalent number of 5,000 approximately. The principal difficulty in estimating employment

MCA Vanuatu – Tourism Survey – Baseline Study Final Report - Appendices
TRIP Consultants - 5 - www.tripconsultants.net
generated by tourism is that employment is not an easily divisible unit that can be added up in
different ways as can be done with money. The bank employee who spends 10 percent of his/her
working time dealing with tourism and 90 percent dealing with non-tourism activities could be
described as an 0.1 full-time job equivalent in tourism, but this is not a feasible way to obtain such
statistics.
Another method of estimating employment is to take the sample statistics of 1483 FTEs and gross
up by the ratio between Total Tourist Expenditure in Vanuatu (approx Vatu 18 billion) and the
turnover in the sample (approx Vatu 7 billion). This gives a figure of approximately 3,800 full time
equivalent employment generated by tourism spending. This method is considered to be suitable
for the establishment of a Baseline figure on employment.
Table 4: Employment in the businesses in the sample by the type of business
Employment
Hotel/ Accommodation
Tour operator/ Inbound operator
Other transport
Retail/ shops Other Total
Full Time 615 206 145 98 185 1249Part-time 182 92 25 35 205 539FTE 3.0 61 31 8 12 68 180Expatriate 48 4 0 0 2 54Total FTE 724 241 153 110 255 1483Breakdown 48.8% 16.2% 10.3% 7.4% 17.2% 100.0% Part-time as % Full-time 29.6% 44.7% 17.2% 35.7% 110.8% 43.2%Expatriate as % FTE 6.6% 1.7% 0.0% 0.0% 0.8% 3.6%
Tourism employment is focused upon Efate Island, then to a much smaller extent upon Santo and
then to a smaller extent again, upon Tanna and upon Other Islands. Hotel employment makes up
around half the total of Tourism employment and then to a much smaller extent is made up by tour
operators and transport operators.
Expatriate employment is focused upon Efate Island and upon the Hotel Industry.
4. ‘Leakage’ or ‘Retention’
‘Leakage’ or its opposite ‘Retention’ tends to revolve around: -
• Bringing in goods and services from outside of Vanuatu as part of normal operations
• Remissions of salaries by expatriate workers in the industry
• Remission of Profits by overseas investors
Each of these is discussed below.
Imports and Goods and Services

MCA Vanuatu – Tourism Survey – Baseline Study Final Report - Appendices
TRIP Consultants - 6 - www.tripconsultants.net
The sample gave an indication of the goods and services that they needed to source outside of local
sources (Table 5).
Table 5: Import Support for Operations
Type of Business Total
Hotel/
Accommodation
Tour operator/
Inbound
operator
Other
transport
Retail/
shops
Other
services Total
Intermediate Consumption
(IC) as a percentage of gross
revenue 59.2 55.1 54.0 44.9 50.1 55.3
Import as % of IC 49% 49% 26% 24% 43% 49%
The sample indicates a relatively high level of support from sources outside of Vanuatu. This
reflects the modest scale of the Vanuatu economy. The principal economic impact is that money
used for imports that could have circulated within the Vanuatu economy now circulates within the
economy supplying the necessary goods and services.
The overall implication is that, according to the sample, about 27% of gross revenues from tourism
is used to bring in goods and services from overseas for normal operations. (Calculated as 49% of
55.3% = approx 27%)
Remissions of expatriate salaries
According to the sample, the numbers of expatriates concerned with tourism is only about 3.6% of
the tourism workforce. Mostly they are management level/ specialist level/ owners of businesses.
There are no significant numbers of low-cost expatriate workers as occurs, say, in the Middle East
or in London. Some of the expatriates will be remitting parts of their salary overseas, but overall it
looks unlikely that this will exceed 1% of gross revenues from tourism.
Remissions of profits to overseas investors
According to the sample, the breakdown between businesses with majority of Vanuatu
shareholders and businesses with the majority of foreign shareholders is 54:46 when viewing the
control over gross revenues/ turnover.

MCA Vanuatu – Tourism Survey – Baseline Study Final Report - Appendices
TRIP Consultants - 7 - www.tripconsultants.net
Since typical gross operating profits are only 18% of gross revenue to meet all financial charges,
there appears to be relatively modest scope for remitting profits to overseas shareholders in the
businesses. The maximum potential might be 1 or 2% of gross revenues. Of course, this can
always change from year to year.
The total ‘leakage’ figure is estimated to be 30%, as a broad order of magnitude.
Overall, this issue of ‘leakage’ or ‘non-retention’ is an important one and can be seen as a
challenge to be addressed by the Vanuatu Government.
The scope for reducing salary remissions is relatively small. Nonetheless more training of local
people for tourism jobs at all levels looks to be something which could reduce such ‘non-retention’
in the future and should not be overlooked.
Bringing more local people into ownership of tourism businesses may be a way of offsetting any
necessary remissions to pay for overseas capital.
The big opportunity for the Vanuatu Government is in trying to seek ways in which supplies to the
local tourism industry could be met by local producers.

MCA Vanuatu – Tourism Survey – Baseline Study Final Report - Appendices
TRIP Consultants - 8 - www.tripconsultants.net
ATTACHMENT 1 - STATISTICAL TABLES FOR THE BUSINESS SURVEY Gross Revenue in the last financial year by Island on which business is located – Cross-tabulation (Unit is businesses)
Gross Revenue in the last financial year Island on which business is located Total
EFATE SANTO MALEKULA TANNA OTHER < 1 million VT 4 2 0 2 1 9 1 - 5 million VT 15 4 0 1 0 20 6 - 10 million VT 7 1 0 0 2 10 10 - 20 million VT 9 1 0 2 1 13 20 - 30 million VT 4 0 0 0 0 4 30 - 40 million VT 4 1 0 1 1 7 40 - 50 Million VT 5 0 0 0 0 5 50 - 100 million VT 8 1 0 1 1 11 100 - 200 million VT 6 4 1 1 0 12 200 300 million VT 4 0 0 0 0 4 300 - 400 million VT 3 0 0 0 0 3 >400 million VT 2 1 0 0 0 3 Not Stated 2 0 0 0 0 2Total 73 15 1 8 2 103
Gross Revenue in the last financial year by Type of Business - Cross-tabulation (Unit is businesses)
Gross Revenue Hotel/
Accommodation
Tour operator/ Inbound operator
Other transport
Retail/ shops Other Total
< 1 million VT 4 1 1 1 2 9 1 - 5 million VT 8 8 1 1 2 20 6 - 10 million VT 2 4 0 2 2 10 10 - 20 million VT 10 3 0 0 0 13 20 - 30 million VT 3 0 0 0 1 4 30 - 40 million VT 4 1 0 0 2 7 40 - 50 Million VT 3 0 1 0 1 5 50 - 100 million VT 4 2 1 0 4 11 100 - 200 million VT 5 3 0 2 2 12 200 300 million VT 0 0 0 2 1 4 300 - 400 million VT 1 0 0 0 2 3 >400 million VT 1 1 1 0 0 3 Not Stated 2 0 0 0 0 2Total 47 23 5 8 20 103

MCA Vanuatu – Tourism Survey – Baseline Study Final Report - Appendices
TRIP Consultants - 9 - www.tripconsultants.net
Gross Operating Profit (Unit is businesses)
Frequency Percent Cumulative
Percent 0 - 5% 16 15.5 15.5 6 - 10% 17 16.5 32.0 11 -15% 17 16.5 48.5 16 - 20% 12 11.7 60.2 21 - 25% 6 5.8 66.0 26 - 30% 14 13.6 79.6 31 - 35% 7 6.8 86.4 40%+ 7 6.8 93.2 Not stated 7 6.8 100.0 Total 103 100.0
Number of years business has been operating (Unit is businesses)
Frequency Percent Cumulative
Percent < 1 year 2 1.9 1.9 1 - 2 yrs 11 10.7 12.6 3 years 12 11.7 24.3 4 years 20 19.4 43.7 5 years 5 4.9 48.5 6 - 7 yrs 9 8.7 57.3 8 - 9 yrs 7 6.8 64.1 >10 years 36 35.0 99.0 Not stated 1 1.0 100.0 Total 103 100.0

MCA Vanuatu – Tourism Survey – Baseline Study Final Report - Appendices
TRIP Consultants - 10 - www.tripconsultants.net
Breakdown of the Business Operations Type of Business Total
Hotel/ Accommodation
Tour operator/ Inbound operator
Other transport
Retail/ shops
Other services Total
Gross Operating Profit (% of total revenue) 16.2 17.7 20.5 21.4 15.5 17.7 Labour Cost (% of total revenue) 24.6 27.2 25.5 33.7 34.4 27.1 Value Added (% of total revenue) 40.8 44.9 46.0 55.1 49.9 44.7 Intermediate Consumption (IC) (% of total revenue) 59.2 55.1 54.0 44.9 50.1 55.3 Import as % of IC 49% 49% 26% 24% 43% 49%
Table: Numbers of employees in the sample broken down by Islands
Number of full time employees in the sample EFATE SANTO MALEKULA TANNA OTHER Total Number of full-time employees 1009 140 2 68 30 1249 Breakdown 80.8% 11.2% 0.2% 5.4% 2.4% 100.0% Number of part-time employees in the sample Breakdown 295 66 5 25 148 539 54.7% 12.2% 0.9% 4.6% 27.4% 100.0%Number of expatriate employees Breakdown 48 4 0 0 2 54 88.9% 7.4% 0.0% 0.0% 3.7% 100.0%

MCA Vanuatu – Tourism Survey – Baseline Study Final Report - Appendices
TRIP Consultants - 11 - www.tripconsultants.net
Figure: Tourism Business Ownership and Level of Gross Operating Profits
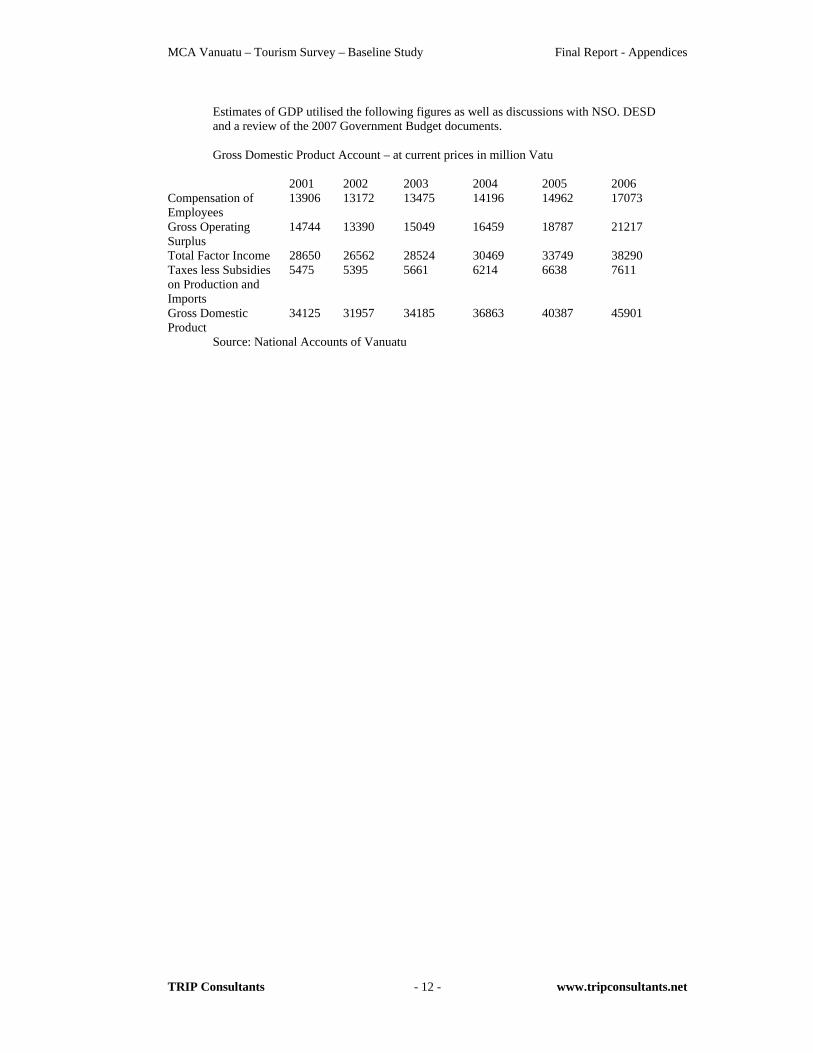
MCA Vanuatu – Tourism Survey – Baseline Study Final Report - Appendices
TRIP Consultants - 12 - www.tripconsultants.net
Estimates of GDP utilised the following figures as well as discussions with NSO. DESD and a review of the 2007 Government Budget documents. Gross Domestic Product Account – at current prices in million Vatu
2001 2002 2003 2004 2005 2006 Compensation of Employees
13906 13172 13475 14196 14962 17073
Gross Operating Surplus
14744 13390 15049 16459 18787 21217
Total Factor Income 28650 26562 28524 30469 33749 38290 Taxes less Subsidies on Production and Imports
5475 5395 5661 6214 6638 7611
Gross Domestic Product
34125 31957 34185 36863 40387 45901
Source: National Accounts of Vanuatu