
Tourism Pocketbook Preface FINAL
144
ISSN 1831-1865 Tourism statistics 2008 edition Pocketbooks
Transcript of Tourism Pocketbook Preface FINAL

ISSN 1831-1865
Tourism statistics
2008 edition
Pocketbooks


Tourism statistics
2008 edition
Pocketbooks

Europe Direct is a service to help you find answers to your questions about the European Union
Freephone number (*):
00 800 6 7 8 9 10 11(*) Certain mobile telephone operators do not allow access
to 00 800 numbers or these calls may be billed.
More information on the European Union is available on the Internet (http://europa.eu).
Luxembourg: Office for Official Publications of the European Communities, 2008
ISBN 978-92-79-09451-4
ISSN 1831-1865
DOI 10.2785/10446
Cat. No. KS-DS-08-001-EN-N
(Cat. No. printed publication KS-DS-08-001-EN-C)
Theme: Population and social conditions - Industry, trade and servicesCollection: Pocketbooks
© European Communities, 2008
© Cover photo: Christophe Demunter
PrefaceThis Pocketbook is the third in a series of Eurostat pocketbookscontaining statistics on tourism. It provides key facts andfigures on tourism in Europe. To further enrich the relevance ofthe Pocketbook for its users, additional tables and graphs havebeen selected for this edition.
The data have been directly taken or derived from Eurostatdatabases. They are collected according to Council Directive95/57/EC on the collection of statistical information in thefield of tourism (the “Tourism Directive”) or other official datacollections such as Structural Business Statistics, the LabourForce Survey, National Accounts, etc. The data cover theperiod from 2000 to 2006 and include information on all EUMember States, Candidate countries and EFTA countries.
The data are presented from two main viewpoints. The firstpart contains the general information needed to evaluate theimportance of the tourism sector in relation to the economy asa whole. The second part contains data that are specific totourism and presents detailed information by country. It coversthe tourism market, including both domestic and outboundtourism and provides country profiles for 34 countries, whichinclude data on recent trends and figures on supply anddemand in tourism.
Methodological notes, a list of data sources and other usefulinformation for understanding tourism statistics are supplied inan annex.
Michael Skaliotis
Head of UnitEurostat F6 “Information Society and Tourism Statistics”
I

II
Table oof CContentsPreface
1. GGeneral DData - DDemographic aand EEconomic IIndicators1.1. Population, ssurface aand ppopulation ddensity .. .. .. .. .. ..21.2. Gross ddomestic pproduct aat ccurrent mmarket pprices
GDP (total in mio. Euro) . . . . . . . . . . . . . . . . . . . .3GDP as % of EU total . . . . . . . . . . . . . . . . . . . . .3GDP per capita (in Euro) . . . . . . . . . . . . . . . . . . .4
1.3 Gross ddomestic pproduct aat cconstant ppricesGDP (total in mio. Euro) chain-linked volumes . . . .4
1.4 Labour FForce sstatistics - EEmployment2000 . . . . . . . . . . . . . . . . . . . . . . . . . . . . . . . . .52006 . . . . . . . . . . . . . . . . . . . . . . . . . . . . . . . . .6
2. TTourism IIndustry2.1 Tourism sstatistics - NNumber oof eenterprises2.1.1 Collective tourist accommodation establishments . .82.1.2 Hotels and similar establishments . . . . . . . . . . . . .92.1.3 Other collective accommodation establishments .102.2 Tourism sstatistics - NNumber oof bbed pplaces2.2.1 Collective tourist accommodation establishments .112.2.2 Hotels and similar establishments . . . . . . . . . . . .122.2.3 Other collective accommodation establishments .132.3 Enterprise SStatistics - NNumber oof eenterprises
Travel agencies and tour operators . . . . . . . . . . .142.4 Labour FForce SStatistics - EEmployment2.4.1 Percentage of persons employed in hotels and
restaurants and persons employed in tourist accommodation establishments as percentageof all persons employed, EU-27 . . . . . . . . . . . . .15
2.4.2 Employment in hotels and restaurants (NACEdivision 55) . . . . . . . . . . . . . . . . . . . . . . . . . . . .16
2.4.3 Employment in the tourist accommodation sector(NACE groups 55.1+55.2) . . . . . . . . . . . . . . . .17
2.4.4 Characteristics of employment in tourism inthe EU-27 . . . . . . . . . . . . . . . . . . . . . . . . . . . . . . .Share of full-time/part-time . . . . . . . . . . . . . . . . .18Share of male/female . . . . . . . . . . . . . . . . . . . .18Share of education levels . . . . . . . . . . . . . . . . . .18

3. TTourism MMarket3.1 Some kkey ffigures oon ggrowth oof ttourism3.1.1 Evolution of the number of tourism nights in
collective accommodation establishments in theEU-27 compared to the economic activity . . . . . .20
3.1.2 Evolution of tourism receipts in the EU-27compared to the economic activity . . . . . . . . . . .21
3.2 Nights sspent bby rresidents aand nnon-rresidents3.2.1 Nights spent by residents and non-residents, by
type of collective accommodation establishment . .223.2.2 Nights spent by residents, by type of collective
accommodation establishment . . . . . . . . . . . . . .243.2.3 Nights spent by non-residents, by type of
collective accommodation establishment . . . . . . .263.2.4 Nights spent by residents and non-residents in
collective accommodation establishments, bycountry of origin of the guests (share of residents,share of other EU-Member States’ residents, share of non-EU residents) . . . . . . . . . . . . . . . . .28
3.2.5 Tourism intensity: Number of nights spent byresidents and non-residents in collective accom-modation establishments compared to the population of the Member States . . . . . . . . . . . .30
3.2.6 Gross occupancy rate of bed places in hotels and similar establishments, annual average . . . . .31
3.3 Tourism rreceipts aand eexpenditure .. .. .. .. .. .. .. .. .. .. .. ..323.4 Holiday ttrips mmade bby rresidents3.4.1 Share of the population aged 15 and over that
takes part in tourism (i.e. at least one holiday tripof at least 4 nights) . . . . . . . . . . . . . . . . . . . . . .34
3.4.2 Number of holiday trips (at least one overnightstay) by EU residents aged 15 and over, by lengthof stay . . . . . . . . . . . . . . . . . . . . . . . . . . . . . . . .35
3.4.3 Number of long holiday trips (at least 4 nights) byEU residents aged 15 and over, by destination . . .35
3.4.4 Number of holiday trips (at least 1 overnight stay)by residents aged 15 and over, by length of stay .36
III
IV
3.4 Holiday ttrips mmade bby rresidents (Continued)3.4.5 Number of holiday trips (at least 1 overnight stay)
by residents aged 15 and over, by destination . . .383.4.6 Number of long holiday trips (at least 4 nights)
by residents aged 15 and over, by destination . . .403.4.7 Share of short holiday trips in the total number of
holiday trips by residents aged 15 and over . . . . .423.4.8 Share of domestic trips in the total number of
long holiday trips (at least 4 nights) by residentsaged 15 and over . . . . . . . . . . . . . . . . . . . . . . .43
3.4.9 Share of nights spent in private accommodationin the total number of nights spent on long holidaytrips (at least 4 nights) in the country and abroadby residents aged 15 and over . . . . . . . . . . . . . .44
4. CCountry PProfilesBelgium . . . . . . . . . . . . . . . . . . . . . . . . . . . . . . . . . . .46Bulgaria . . . . . . . . . . . . . . . . . . . . . . . . . . . . . . . . . . .48Czech Republic . . . . . . . . . . . . . . . . . . . . . . . . . . . . . .50Denmark . . . . . . . . . . . . . . . . . . . . . . . . . . . . . . . . . .52Germany . . . . . . . . . . . . . . . . . . . . . . . . . . . . . . . . . .54Estonia . . . . . . . . . . . . . . . . . . . . . . . . . . . . . . . . . . . .56Ireland . . . . . . . . . . . . . . . . . . . . . . . . . . . . . . . . . . . .58Greece . . . . . . . . . . . . . . . . . . . . . . . . . . . . . . . . . . .60Spain . . . . . . . . . . . . . . . . . . . . . . . . . . . . . . . . . . . .62France . . . . . . . . . . . . . . . . . . . . . . . . . . . . . . . . . . . .64Italy . . . . . . . . . . . . . . . . . . . . . . . . . . . . . . . . . . . .66Cyprus . . . . . . . . . . . . . . . . . . . . . . . . . . . . . . . . . . . .68Latvia . . . . . . . . . . . . . . . . . . . . . . . . . . . . . . . . . . . .70Lithuania . . . . . . . . . . . . . . . . . . . . . . . . . . . . . . . . . .72Luxembourg . . . . . . . . . . . . . . . . . . . . . . . . . . . . . . . .74Hungary . . . . . . . . . . . . . . . . . . . . . . . . . . . . . . . . . . .76Malta . . . . . . . . . . . . . . . . . . . . . . . . . . . . . . . . . . . .78The Netherlands . . . . . . . . . . . . . . . . . . . . . . . . . . . . .80Austria . . . . . . . . . . . . . . . . . . . . . . . . . . . . . . . . . . . .82Poland . . . . . . . . . . . . . . . . . . . . . . . . . . . . . . . . . . . .84Portugal . . . . . . . . . . . . . . . . . . . . . . . . . . . . . . . . . . .86
V
1) In tables and figures the code “MK” is used. This is a provisionalcode which does not prejudge in any way the definitive nomenclaturefor this country, which will be agreed following the conclusion ofnegotiations currently taking place on this subject at the UnitedNations.
4. CCountry PProfiles (Continued)Romania . . . . . . . . . . . . . . . . . . . . . . . . . . . . . . . . . .88Slovenia . . . . . . . . . . . . . . . . . . . . . . . . . . . . . . . . . . .90Slovakia . . . . . . . . . . . . . . . . . . . . . . . . . . . . . . . . . . .92Finland . . . . . . . . . . . . . . . . . . . . . . . . . . . . . . . . . . .94Sweden . . . . . . . . . . . . . . . . . . . . . . . . . . . . . . . . . . .96United Kingdom . . . . . . . . . . . . . . . . . . . . . . . . . . . . .98Croatia . . . . . . . . . . . . . . . . . . . . . . . . . . . . . . . . . .100
The former Yugoslav Republic of Macedonia1 . . . . . . .102Turkey . . . . . . . . . . . . . . . . . . . . . . . . . . . . . . . . . . .104Iceland . . . . . . . . . . . . . . . . . . . . . . . . . . . . . . . . . .106Liechtenstein . . . . . . . . . . . . . . . . . . . . . . . . . . . . . . .108Norway . . . . . . . . . . . . . . . . . . . . . . . . . . . . . . . . . .110Switzerland . . . . . . . . . . . . . . . . . . . . . . . . . . . . . . . .112
Annex - TTechnical NNotesA. General information . . . . . . . . . . . . . . . . . . . . .116B. Terms and definitions . . . . . . . . . . . . . . . . . . . .118C. Signs and abbreviations . . . . . . . . . . . . . . . . . .122D. Nace Rev. 1 classification (relevant to tourism) . .124E. Data sources . . . . . . . . . . . . . . . . . . . . . . . . . .125
VI
Acknowledgments
This publication has been managed by the Information Societyand Tourism Statistics Unit (F-6) of Eurostat, under the Head ofUnit, Mr. Michael Skaliotis.
Coordinator
Christophe Demunter (Eurostat, Unit F-6)
Production
The data processing, statistical analysis, design and desktoppublishing for this pocketbook has been carried out by thefollowing team at Artemis Information Management S.A. and itsconsultants from CISET (International Center of Studies on theTourist Economy).
Christiane GenglerMara ManenteValeria MinghettiMario ColantonioVolker Stabernak
Data eextraction
Date of data extraction: 29 February 2008.
Chapter 11 - GGeneral DData - DDemographic aand EEconomic IIndicators
1

Demographic aand EEconomic IIndicators
2
1.1 PPopulation, ssurface aand ppopulation ddensity, 22000 aand 2200620001 EU-227 EU-225 BE BG CZ DK DE EE IE EL ES FR IT CY LV LT LU HU
Population iin 11 0000 482 213 452 114 10 239 8 191 10 278 5 330 82 163 1 372 3 778 10 904 40 050 60 538 56 924 690 2 382 3 512 434 10 222
Surface kkm2 4 304 295 3 963 370 30 328 110 971 77 272 43 096 357 020 43 431 68 394 130 714 505 997 632 834 295 111 9 250 62 290 62 678 2 586 93 030
Population ddensity(inhabitants pper kkm2)
112 114 338 74 133 124 230 32 55 83 79 96 193 75 38 56 168 110
MT NL AT PL PT RO SI SK FI SE UK HR MK2 TR IS LI NO CH
Population iin 11 0000 380 15 864 8 002 38 654 10 195 21 908 1 988 5 399 5 171 8 861 58 785 4 442 2 022 66 889 279 32 4 478 7 164
Surface kkm2 316 33 873 82 478 312 685 92 126 229 954 20 141 49 035 304 530 410 335 243 820 56 542 25 713 769 604 100 250 160 306 253 39 996
Population ddensity(inhabitants pper kkm2)
1 203 468 97 124 111 95 99 110 17 22 241 79 79 87 3 203 15 179
20063 EU-227 EU-225 BE BG CZ DK DE EE IE EL ES FR IT CY LV LT LU HU
Population iin 11 0000 492 975 463 646 10 511 7 719 10 251 5 427 82 438 1 345 4 209 11 125 43 758 62 999 58 752 766 2 295 3 403 469 10 077
Surface kkm2 4 303 402 3 962 423 30 328 111 002 77 258 43 098 357 093 43 432 68 394 130 820 505 987 632 834 295 114 9 250 62 290 62 678 2 586 93 028
Population ddensity(inhabitants pper kkm2)
115 117 347 70 133 126 231 31 62 85 86 100 199 83 37 54 181 108
MT NL AT PL PT RO SI SK FI SE UK HR MK2 TR IS LI NO CH
Population iin 11 0000 405 16 334 8 266 38 157 10 570 21 610 2 003 5 389 5 256 9 048 60 393 4 443 2 039 72 520 300 35 4 640 7 459
Surface kkm2 316 33 783 83 214 312 685 92 118 229 977 20 141 49 034 304 112 410 335 242 495 56 594 25 713 769 604 100 250 160 304 280 39 996
Population ddensity(inhabitants pper kkm2)
1 282 484 99 122 115 94 99 110 17 22 249 79 79 94 3 218 15 186
1) Surface: 2002 data for ES and PL. 2) Provisional code which does not prejudge in any way the definitive nomenclature for this country, which will be agreed following the conclusion of negotiations currentlytaking place on this subject at the United Nations. 3) Surface: 2004 data for UK and 2005 data for BE and BG.
Demographic aand EEconomic IIndicators3
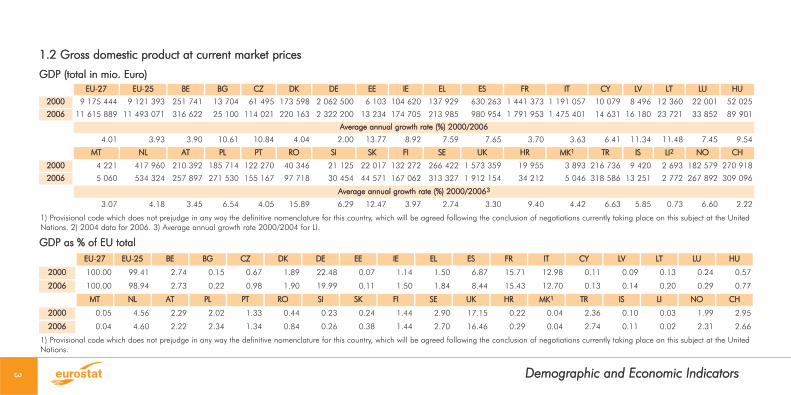
1.2 GGross ddomestic pproduct aat ccurrent mmarket pprices
GDP ((total iin mmio. EEuro)
GDP aas %% oof EEU ttotalEU-227 EU-225 BE BG CZ DK DE EE IE EL ES FR IT CY LV LT LU HU
2000 100.00 99.41 2.74 0.15 0.67 1.89 22.48 0.07 1.14 1.50 6.87 15.71 12.98 0.11 0.09 0.13 0.24 0.57
2006 100.00 98.94 2.73 0.22 0.98 1.90 19.99 0.11 1.50 1.84 8.44 15.43 12.70 0.13 0.14 0.20 0.29 0.77
MT NL AT PL PT RO SI SK FI SE UK HR MK1 TR IS LI NO CH
2000 0.05 4.56 2.29 2.02 1.33 0.44 0.23 0.24 1.44 2.90 17.15 0.22 0.04 2.36 0.10 0.03 1.99 2.95
2006 0.04 4.60 2.22 2.34 1.34 0.84 0.26 0.38 1.44 2.70 16.46 0.29 0.04 2.74 0.11 0.02 2.31 2.66
1) Provisional code which does not prejudge in any way the definitive nomenclature for this country, which will be agreed following the conclusion of negotiations currently taking place on this subject at the UnitedNations.
EU-227 EU-225 BE BG CZ DK DE EE IE EL ES FR IT CY LV LT LU HU
2000 9 175 444 9 121 393 251 741 13 704 61 495 173 598 2 062 500 6 103 104 620 137 929 630 263 1 441 373 1 191 057 10 079 8 496 12 360 22 001 52 025
2006 11 615 889 11 493 071 316 622 25 100 114 021 220 163 2 322 200 13 234 174 705 213 985 980 954 1 791 953 1 475 401 14 631 16 180 23 721 33 852 89 901
Average aannual ggrowth rrate ((%) 22000/2006
4.01 3.93 3.90 10.61 10.84 4.04 2.00 13.77 8.92 7.59 7.65 3.70 3.63 6.41 11.34 11.48 7.45 9.54
MT NL AT PL PT RO SI SK FI SE UK HR MK1 TR IS LI2 NO CH
2000 4 221 417 960 210 392 185 714 122 270 40 346 21 125 22 017 132 272 266 422 1 573 359 19 955 3 893 216 736 9 420 2 693 182 579 270 918
2006 5 060 534 324 257 897 271 530 155 167 97 718 30 454 44 571 167 062 313 327 1 912 154 34 212 5 046 318 586 13 251 2 772 267 892 309 096
Average aannual ggrowth rrate ((%) 22000/20063
3.07 4.18 3.45 6.54 4.05 15.89 6.29 12.47 3.97 2.74 3.30 9.40 4.42 6.63 5.85 0.73 6.60 2.22
1) Provisional code which does not prejudge in any way the definitive nomenclature for this country, which will be agreed following the conclusion of negotiations currently taking place on this subject at the UnitedNations. 2) 2004 data for 2006. 3) Average annual growth rate 2000/2004 for LI.

Demographic aand EEconomic IIndicators
4
1.2 GGross ddomestic pproduct aat ccurrent mmarket pprices ((continued)GDP pper ccapita ((in EEuro)
1.3 GGross ddomestic pproduct aat cconstant pprices
EU-227 EU-225 BE BG CZ DK DE EE IE EL ES FR IT CY LV LT LU HU
2000 19 028 20 175 24 586 1 673 5 983 32 570 25 102 4 448 27 694 12 650 15 737 23 809 20 924 14 596 3 567 3 519 50 739 5 0902006 23 563 24 788 30 122 3 252 11 123 40 565 28 169 9 841 41 507 19 234 22 418 28 444 25 112 19 090 7 051 6 970 72 167 8 922
MT NL AT PL PT RO SI SK FI SE UK HR MK1 TR IS LI2 NO CH
2000 11 102 26 347 26 292 4 805 11 993 1 842 10 628 4 078 25 578 30 065 26 765 4 493 1 926 3 240 33 759 83 041 40 768 37 8142006 12 494 32 712 31 200 7 116 14 681 4 522 15 201 8 271 31 788 34 630 31 662 7 700 2 475 4 393 44 187 79 410 57 733 41 439
1) Provisional code which does not prejudge in any way the definitive nomenclature for this country, which will be agreed following the conclusion of negotiations currently taking place on this subject at the UnitedNations. 2) 2004 data for 2006
GDP ((total iin mmio. EEuro) cchain-llinked vvolumes ((2000 eexchange rrates)EU-227 EU-225 BE BG CZ DK DE EE IE EL ES FR IT CY LV LT LU HU
2000 9 175 444 9 121 393 251 741 13 704 6 1495 173 598 2 062 500 6 103 104 620 137 929 630 263 1 441 371 1 191 057 10 079 8 496 12 360 22 001 52 025
2006 10 328 804 10 250 819 280 089 18 811 7 8627 192 006 2 182 950 10 092 144 561 177 963 768 700 1 593 724 1 266 471 12 289 14 094 19 390 28 020 66 745
Average aannual ggrowth rrate ((%) 22000/2006
1.99 1.96 1.79 5.42 4.18 1.69 0.95 8.74 5.54 4.34 3.36 1.69 1.03 3.36 8.80 7.79 4.11 4.24
MT NL AT PL PT RO SI SK FI SE UK HR MK1 TR IS LI NO CH
2000 4 221 417 960 210 392 185 714 122 270 40 346 21 125 22 017 132 272 266 422 1 573 359 19 955 3 893 216 736 9 420 : 182 579 270 918
2006 4 553 457 278 233 550 229 678 129 427 57 510 26 693 30 404 157 081 314 612 1 828 061 26 141 4 308 284 140 12 073 : 208 121 297 830
Average aannual ggrowth rrate ((%) 22000/2006
1.27 1.51 1.76 3.60 0.95 6.09 3.98 5.53 2.91 2.81 2.53 4.60 1.70 4.62 4.22 : 2.21 1.59
1) Provisional code which does not prejudge in any way the definitive nomenclature for this country, which will be agreed following the conclusion of negotiations currently taking place on this subject at the UnitedNations.

Demographic aand EEconomic IIndicators5
1.4 LLabour FForce sstatistics - EEmployment, 22000
2000 EU-227 EU-225 BE BG CZ DK DE EE IE EL ES FR1 IT CY LV LT LU HU
Total ((in 11 0000) 201 871 188 101 4 120 2 872 4 675 2 716 36 324 568 1 671 4 098 15 440 23 123 20 930 294 942 1 419 181 3 807
Agriculture aas %% oof ttotal 7.95 5.71 1.91 13.12 5.21 3.66 2.64 6.83 7.95 17.40 6.69 4.14 5.23 5.41 14.92 19.24 2.43 6.46
Industry aas %% oof ttotal 29.33 29.49 25.81 32.66 39.91 25.26 33.53 34.52 28.46 22.60 30.83 26.26 31.79 23.77 26.76 26.78 20.73 33.77
Services aas %% oof ttotal 62.41 64.48 72.28 53.68 54.79 70.76 63.83 58.66 63.59 60.00 62.48 69.56 62.98 70.82 58.32 53.98 76.62 59.76
Tourist aaccom. aas %% oof ttotal : : : : : : : : : : : : : : : : : :
Tourist aaccom. aas %% oof sservices : : : : : : : : : : : : : : : : : :
MT NL AT PL PT RO SI SK FI SE UK HR2 MK3 TR IS LI NO CH
Total ((in 11 0000) 143 7 860 3 712 14 518 5 003 10 898 894 2 083 2 367 4 125 27 088 1 521 : : 157 : 2 271 3 879
Agriculture aas %% oof ttotal 2.03 3.08 5.86 18.67 12.52 45.20 9.53 6.94 6.19 2.90 1.54 15.55 : : 8.68 : 4.29 4.66
Industry aas %% oof ttotal 32.68 20.21 30.16 31.06 34.41 25.79 37.41 37.24 27.88 24.36 25.12 29.82 : : 22.09 : 21.77 24.05
Services aas %% oof ttotal 65.15 70.40 63.98 50.27 53.06 29.00 52.41 55.80 65.68 72.68 73.09 54.61 : : 69.16 : 73.86 67.47
Tourist aaccom. aas %% oof ttotal : : : : : : : : : : : : : : : : : :
Tourist aaccom. aas %% oof sservices : : : : : : : : : : : : : : : : : :
1) First quarter data is used. 2) 2002 data. 3) Provisional code which does not prejudge in any way the definitive nomenclature for this country, which will be agreed following the conclusion of negotiations cur-rently taking place on this subject at the United Nations.Note: The shares of agriculture, industry and services for NL and CH do not add up to 100% because there is non-response in the labour force survey.

Demographic aand EEconomic IIndicators
6
1.4 LLabour FForce sstatistics - EEmployment, 22006
2006 EU-227 EU-225 BE BG CZ DK DE EE IE EL ES FR IT CY LV LT LU HU
Total ((in 11 0000) 214 091 201 503 4 216 3 139 4 826 2 792 37 270 650 2 017 4 453 19 693 24 986 23 187 3 564 1 072 1 502 195 3 934
Agriculture aas %% oof ttotal 5.89 4.68 2.11 8.50 3.84 2.94 2.19 5.29 5.68 12.04 4.86 3.73 4.22 4.26 12.94 13.32 1.84 4.74
Industry aas %% oof ttotal 27.55 27.30 24.96 33.62 39.99 23.39 29.79 33.20 27.33 22.03 29.50 23.98 29.82 22.67 25.80 29.53 16.69 32.31
Services aas %% oof ttotal 66.33 67.77 72.92 57.88 56.15 73.56 68.02 61.43 67.00 65.93 65.64 72.13 65.96 73.06 61.10 57.15 81.41 62.95
Tourist aaccom. aas %% oof ttotal : : : 1.15 0.95 0.64 0.98 1.23u : 1.59 1.65 1.00 1.03 : : : : 0.92
Tourist aaccom. aas %% oof sservices : : : 1.98 1.70 0.88 1.45 2.00u : 2.42 2.51 1.38 1.56 : : : : 1.45
MT NL AT PL PT RO SI SK FI SE UK HR MK1 TR IS LI NO CH
Total ((in 11 0000) 152 8 241 3 917 14 459 5 181 9 449 969 2 295 2 461 4 426 28 253 1 548 : 22 860 170 : 2 346 4 051
Agriculture aas %% oof ttotal 1.78u 3.18 5.64 15.84 11.87 30.65 9.59 4.46 4.81 2.28 1.29 14.72 : : : : 3.36 3.79
Industry aas %% oof ttotal 28.59 19.49 28.06 30.02 30.38 30.89 34.92 38.72 25.65 21.91 21.97 30.23 : : : : 20.51 22.51
Services aas %% oof ttotal 69.63 72.93 66.30 54.11 57.75 38.47 55.15 56.73 69.38 75.59 76.49 54.94 : : : : 76.07 73.09
Tourist aaccom. aas %% oof ttotal 3.95 0.89 1.99 0.52 1.00 0.38 : 1.09 0.57 0.81 : 2.26 : : : : 1.07 1.21
Tourist aaccom. aas %% oof sservices 5.68 1.21 3.00 0.96 1.74 0.99 : 1.92 0.82 1.08 : 4.11 : : : : 1.40 1.65
1) Provisional code which does not prejudge in any way the definitive nomenclature for this country, which will be agreed following the conclusion of negotiations currently taking place on this subject at the UnitedNations.Note: The shares of agriculture, industry and services for NL do not add up to 100% because there is non-response in the labour force survey.

Chapter 22 - TTourism IIndustry
2

Tourism IIndustry
8
2.1 TTourism sstatistics - NNumber oof eenterprises
EU-227 EU-225 BE BG CZ DK DE EE IE EL ES FR IT CY LV LT LU HU
2000 381 719 377 762 3 633 836 7 469 1 095 55 583 350 7 931 8 692 21 746 28 743 117 219 618 232 494 606 2 965
2004 408 675 403 469 3 538 1 306 7 640 1 103 55 278 609 8 787 9 230 33 068 29 378 114 527 935 343 529 560 3 001
2005 404 817 399 036 3 449 1 555 7 605 1 090 55 349 784 8 865 9 377 34 758 29 008 129 936 919 418 524 545 3 117
2006 422 434 415 880 3 485 1 844 7 616 1 076 54 793 951 9 101 9 444 36 199 28 778 134 713 894 393 515 536 3 056
Average aannual ggrowth rrate ((%) 22000/2006
1.70 1.62 -0.69 14.09 0.33 -0.29 -0.24 18.13 2.32 1.39 8.86 0.02 2.35 6.35 9.18 0.70 -2.02 0.51
MT NL AT PL PT RO SI SK FI SE UK HR1 MK2 TR IS LI NO CH
2000 249 6 444 21 082 7 818 2 049 3 121 846 1 559 1 528 3 491 75 320 1 221 321 : 648 : 2 379 99 809
2004 199 7 080 20 609 6 972 2 239 3 900 721 2 062 1 413 3 890 89 758 1 465 : : 692 159 2 177 :
2005 179 7 160 20 548 6 723 2 300 4 226 702 2 016 1 397 3 946 68 321 1 530 : : 613 158 2 257 :
2006 179 7 154 20 457 6 694 2 324 4 710 707 2 043 1 381 4 008 79 383 1 643 : : 595 157 2 282 :
Average aannual ggrowth rrate ((%) 22000/20063
-5.35 1.76 -0.50 -2.55 2.12 7.10 -2.95 4.61 -1.67 2.33 0.88 5.07 : : -1.41 -0.63 -0.69 :
1) Change in methodology from 2006 onwards. 2) Provisional code which does not prejudge in any way the definitive nomenclature for this country, which will be agreed following the conclusion of negotiationscurrently taking place on this subject at the United Nations. 3) Average annual growth rate 2004/2006 for LI.Note: There is a lack of comparability due to methodological differences in the coverage of enterprises between countries (f.i. data collection thresholds in terms of minimum number of bed places).
2.1.1 CCollective ttourist aaccommodation eestablishments ((=hotels aand ssimilar eestablishments pplus oother ccollective aaccommodation eestablishments)

Tourism IIndustry9
2.1.2 HHotels aand ssimilar eestablishments
EU-227 EU-225 BE BG CZ DK DE EE1 IE EL ES FR IT CY LV LT LU HU
2000 205 451 202 270 1 998 648 3 960 472 38 551 350 5 449 8 342 16 287 18 773 33 361 583 166 227 315 1 928
2004 205 343 201 026 1 922 1 016 4 311 485 36 839 267 4 554 8 899 17 402 18 689 33 518 803 278 317 297 1 952
2005 193 889 189 051 1 899 1 230 4 278 482 36 593 317 4 407 9 036 17 607 18 361 33 527 785 337 331 293 2 061
2006 200 949 195 476 1 955 1 348 4 314 473 36 201 341 4 296 9 111 18 304 18 135 33 768 753 321 338 284 2 032
Average aannual ggrowth rrate ((%) 22000/2006
-0.37 -0.57 -0.36 12.98 1.44 0.04 -1.04 -0.43 -3.88 1.48 1.96 -0.57 0.20 4.36 11.62 6.86 -1.71 0.88
MT NL AT PL PT RO SI SK FI SE UK HR2 MK3 TR IS LI NO CH
2000 246 2 835 15 517 1 449 1 786 2 533 448 582 1 011 1 906 45 728 733 145 1 814 244 50 1 166 5 754
2004 194 3 129 14 435 2 139 1 954 3 301 350 873 961 1 833 44 625 940 : : 303 45 1 079 :
2005 173 3 135 14 267 2 200 2 012 3 608 344 885 938 1 857 32 926 1 015 : : 319 46 1 136 :
2006 173 3 099 14 051 2 301 2 028 4 125 358 922 923 1 888 39 107 762 : : 308 46 1 119 :
Average aannual ggrowth rrate ((%) 22000/2006
-5.70 1.50 -1.64 8.01 2.14 8.47 -3.67 7.97 -1.51 -0.16 -2.57 0.65 : : 3.96 -1.38 -0.68 :
1) For 2000 other collective establishments included. 2) Change in methodology from 2006 onwards. 3) Provisional code which does not prejudge in any way the definitive nomenclature for this country, whichwill be agreed following the conclusion of negotiations currently taking place on this subject at the United Nations.Note: There is a lack of comparability due to methodological differences in the coverage of enterprises between countries (f.i. data collection thresholds in terms of minimum number of bed places).
Tourism IIndustry
10
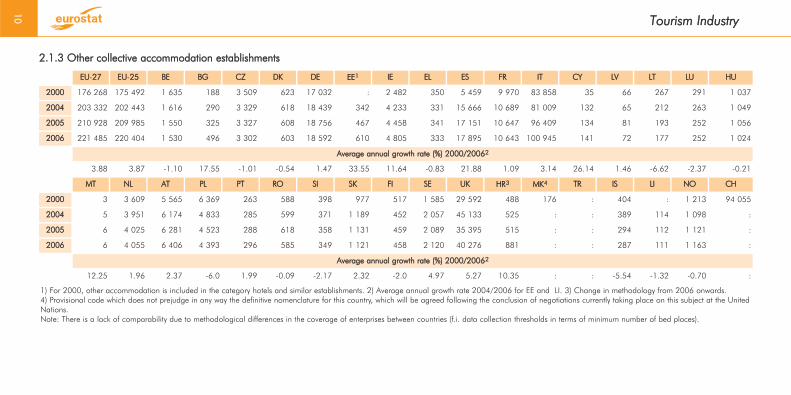
2.1.3 OOther ccollective aaccommodation eestablishments
EU-227 EU-225 BE BG CZ DK DE EE1 IE EL ES FR IT CY LV LT LU HU
2000 176 268 175 492 1 635 188 3 509 623 17 032 : 2 482 350 5 459 9 970 83 858 35 66 267 291 1 037
2004 203 332 202 443 1 616 290 3 329 618 18 439 342 4 233 331 15 666 10 689 81 009 132 65 212 263 1 049
2005 210 928 209 985 1 550 325 3 327 608 18 756 467 4 458 341 17 151 10 647 96 409 134 81 193 252 1 056
2006 221 485 220 404 1 530 496 3 302 603 18 592 610 4 805 333 17 895 10 643 100 945 141 72 177 252 1 024
Average aannual ggrowth rrate ((%) 22000/20062
3.88 3.87 -1.10 17.55 -1.01 -0.54 1.47 33.55 11.64 -0.83 21.88 1.09 3.14 26.14 1.46 -6.62 -2.37 -0.21
MT NL AT PL PT RO SI SK FI SE UK HR3 MK4 TR IS LI NO CH
2000 3 3 609 5 565 6 369 263 588 398 977 517 1 585 29 592 488 176 : 404 : 1 213 94 055
2004 5 3 951 6 174 4 833 285 599 371 1 189 452 2 057 45 133 525 : : 389 114 1 098 :
2005 6 4 025 6 281 4 523 288 618 358 1 131 459 2 089 35 395 515 : : 294 112 1 121 :
2006 6 4 055 6 406 4 393 296 585 349 1 121 458 2 120 40 276 881 : : 287 111 1 163 :
Average aannual ggrowth rrate ((%) 22000/20062
12.25 1.96 2.37 -6.0 1.99 -0.09 -2.17 2.32 -2.0 4.97 5.27 10.35 : : -5.54 -1.32 -0.70 :
1) For 2000, other accommodation is included in the category hotels and similar establishments. 2) Average annual growth rate 2004/2006 for EE and LI. 3) Change in methodology from 2006 onwards. 4) Provisional code which does not prejudge in any way the definitive nomenclature for this country, which will be agreed following the conclusion of negotiations currently taking place on this subject at the UnitedNations.Note: There is a lack of comparability due to methodological differences in the coverage of enterprises between countries (f.i. data collection thresholds in terms of minimum number of bed places).

Tourism IIndustry11
2.2 TTourism sstatistics - NNumber oof bbed pplaces
2.2.1 CCollective ttourist aaccommodation eestablishments ((=hotels aand ssimilar eestablishments pplus oother ccollective aaccommodation eestablishments)
EU-227 EU-225 BE BG CZ DK DE EE IE EL ES FR IT CY LV LT LU HU
2000 24 220 843 23 804 812 632 729 136 026 437 440 383 271 3 078 994 16 292 196 575 703 445 2 622 238 5 415 495 3 909 998 88 423 17 145 27 088 64 635 312 714
2004 25 838 083 25 372 102 442 946 190 040 433 214 391 987 3 292 221 32 899 205 223 760 948 2 973 442 5 759 099 4 205 577 96 277 22 171 32 286 66 568 336 494
2005 26 305 388 25 801 050 415 169 221 144 433 211 392 826 3 316 853 38 088 207 127 777 610 3 063 734 5 703 754 4 350 533 95 392 24 045 31 254 66 499 329 290
2006 27 350 390 26 816 216 367 866 247 016 441 968 391 430 3 331 311 40 850 208 478 786 891 3 074 833 5 736 966 4 499 671 93 721 24 489 31 871 66 286 315 284
Average aannual ggrowth rrate ((%) 22000/2006
2.05 2.01 -8.64 10.45 0.17 0.35 1.32 16.56 0.98 1.89 2.69 0.97 2.37 0.97 6.12 2.75 0.42 0.14
MT NL AT PL PT RO SI SK FI SE UK HR1 MK2 TR IS LI NO CH
2000 40 930 1 138 636 929 838 651 729 484 907 280 005 64 341 143 173 223 137 633 963 1 587 676 484 963 42 221 : : : 500 860 1 071 331
2004 41 221 11 76 239 928 217 584 623 433 160 275 941 63 841 162 000 214 349 682 278 2 034 822 496 532 : : : : 541 579 :
2005 38 016 1 189 734 926 078 569 896 446 470 283 194 64 627 160 195 210 213 734 851 2 215 585 499 142 : : : : 487 197 :
2006 40 202 1 186 893 934 671 574 612 455 143 287 158 66 183 144 601 213 807 758 507 3 029 682 481 919 : : : : 493 126 :
Average aannual ggrowth rrate ((%) 22000/2006
-0.30 0.69 0.09 -2.08 -1.05 0.42 0.47 0.17 -0.71 3.03 11.37 -0.10 : : : : -0.26 :
1) Change in the methodology from 2006 onwards. 2) Provisional code which does not prejudge in any way the definitive nomenclature for this country, which will be agreed following the conclusion of negotia-tions currently taking place on this subject at the United Nations.Note: There is a lack of comparability due to methodological differences in the coverage of enterprises between countries (f.i. data collection thresholds in terms of minimum number of bed places).

Tourism IIndustry
12
2.2.2 HHotels aand ssimilar eestablishments
EU-227 EU-225 BE BG CZ DK DE EE1 IE EL ES FR IT CY LV LT LU HU
2000 10 367 055 10 046 500 119 165 121 222 217 664 62 905 1 590 332 16 292 138 579 607 614 1 315 697 1 213 686 1 854 101 84 479 11 890 11 489 14 352 143 573
2004 11 163 626 10 784 860 122 043 170 956 229 689 70 293 1 609 027 22 673 144 632 668 271 1 511 592 1 266 325 1 999 729 92 239 17 933 18 630 14 237 157 970
2005 11 190 018 10 772 579 120 668 200 940 232 211 70 049 1 621 118 25 228 148 653 682 050 1 579 965 1 258 294 2 028 452 91 264 19 229 19 940 14 427 162 235
2006 11 537 218 11 099 270 123 775 211 565 236 104 70 769 1 631 530 26 058 148 077 693 252 1 614 545 1 253 962 2 086 942 89 490 19 650 21 504 14 349 158 762
Average aannual ggrowth rrate ((%) 22000/2006
1.80 1.67 0.63 9.73 1.36 1.98 0.43 8.14 1.11 2.22 3.47 0.55 1.99 0.97 8.73 11.01 0.00 1.69
MT NL AT PL PT RO SI SK FI SE UK HR2 MK3 TR IS LI NO CH
2000 40 782 173 066 588 213 120 280 222 958 199 333 30 576 43 763 117 322 188 289 1 119 433 199 474 15 950 322 334 12 471 1 184 140 580 259 721
2004 40 779 189 835 570 785 165 311 253 927 207 810 29 668 56 296 119 941 189 988 1 223 047 199 033 : : 15 223 1 176 141 095 :
2005 37 322 192 215 571 377 169 609 263 814 216 499 29 971 57 071 117 605 197 470 1 062 342 203 464 : : 16 639 1 189 143 568 :
2006 39 518 192 067 572 514 178 056 264 037 226 383 31 145 57 985 118 170 201 316 1 255 693 163 168 : : 16 849 1 263 151 252 :
Average aannual ggrowth rrate ((%) 22000/2006
-0.52 1.75 -0.45 6.76 2.86 2.14 0.31 4.80 0.12 1.12 1.93 -3.29 : : 5.14 1.08 1.23 :
1) For 2000 other collective establishments included. 2) Change in methodology from 2006 onwards. 3) Provisional code which does not prejudge in any way the definitive nomenclature for this country, which willbe agreed following the conclusion of negotiations currently taking place on this subject at the United Nations.Note: There is a lack of comparability due to methodological differences in the coverage of enterprises between countries (f.i. data collection thresholds in terms of minimum number of bed places).

Tourism IIndustry13
2.2.3 OOther ccollective aaccommodation eestablishments
EU-227 EU-225 BE BG CZ DK DE EE1 IE EL ES FR IT CY LV LT LU HU
2000 13 853 788 13 758 312 513 564 14 804 219 776 320 366 1 488 662 : 57 996 95 831 1 306 541 4 201 809 2 055 897 3 944 5 255 15 599 50 283 169 141
2004 14 674 457 14 587 242 320 903 19 084 203 525 321 694 1 683 194 10 226 60 591 92 677 1 461 850 4 492 774 2 205 848 4 038 4 238 13 656 52 331 178 524
2005 15 115 370 15 028 471 294 501 20 204 201 000 322 777 1 695 735 12 860 58 474 95 560 1 483 769 4 445 460 2 322 081 4 128 4 816 11 314 52 072 167 055
2006 15 813 172 15 716 946 244 091 35 451 205 864 320 661 1 699 781 14 792 60 401 93 639 1 460 288 4 483 004 2 412 729 4 231 4 839 10 367 51 937 156 522
Average aannual ggrowth rrate ((%) 22000/20062
2.23 2.24 -11.66 15.67 -1.08 0.02 2.23 20.27 0.68 -0.38 1.87 1.09 2.70 1.18 -1.37 -6.58 0.54 -1.28
MT NL AT PL PT RO SI SK FI SE UK HR3 MK4 TR IS LI NO CH
2000 148 965 570 341 625 531 449 261 949 80 672 33 765 99 410 105 815 445 674 468 243 285 489 26 271 : : : 360 280 811 610
2004 442 986 404 357 432 419 312 179 233 68 131 34 173 105 704 94 408 492 290 811 775 297 499 : : : : 400 484 :
2005 694 997 519 354 701 400 287 182 656 66 695 34 656 103 124 92 608 537 381 1 153 243 295 678 : : : : 343 629 :
2006 684 994 826 362 157 396 556 191 106 60 775 35 038 86 616 95 637 557 191 1 773 989 318 751 : : : : 341 874 :
Average aannual ggrowth rrate ((%) 22000/2006
29.06 0.50 0.98 -4.76 -5.12 -4.61 0.62 -2.27 -1.67 3.79 24.86 1.85 : : : : -0.87 :
1) For 2000 other accommodation is included in the category hotels and similar establishments. 2) Average annual growth rate 2004/2006 for EE. 3) Change in methodology from 2006 onwards. 4) Provisionalcode which does not prejudge in any way the definitive nomenclature for this country, which will be agreed following the conclusion of negotiations currently taking place on this subject at the United Nations.Note: There is a lack of comparability due to methodological differences in the coverage of enterprises between countries (f.i. data collection thresholds in terms of minimum number of bed places).
Tourism IIndustry
14
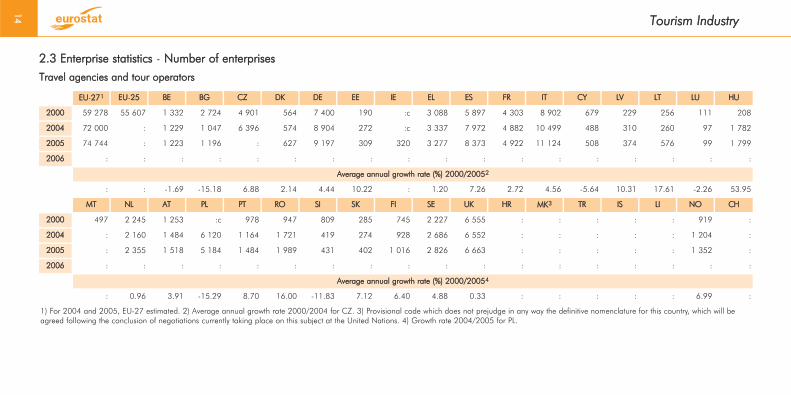
2.3 EEnterprise sstatistics - NNumber oof eenterprises
Travel aagencies aand ttour ooperators
EU-2271 EU-225 BE BG CZ DK DE EE IE EL ES FR IT CY LV LT LU HU
2000 59 278 55 607 1 332 2 724 4 901 564 7 400 190 :c 3 088 5 897 4 303 8 902 679 229 256 111 208
2004 72 000 : 1 229 1 047 6 396 574 8 904 272 :c 3 337 7 972 4 882 10 499 488 310 260 97 1 782
2005 74 744 : 1 223 1 196 : 627 9 197 309 320 3 277 8 373 4 922 11 124 508 374 576 99 1 799
2006 : : : : : : : : : : : : : : : : : :
Average aannual ggrowth rrate ((%) 22000/20052
: : -1.69 -15.18 6.88 2.14 4.44 10.22 : 1.20 7.26 2.72 4.56 -5.64 10.31 17.61 -2.26 53.95
MT NL AT PL PT RO SI SK FI SE UK HR MK3 TR IS LI NO CH
2000 497 2 245 1 253 :c 978 947 809 285 745 2 227 6 555 : : : : : 919 :
2004 : 2 160 1 484 6 120 1 164 1 721 419 274 928 2 686 6 552 : : : : : 1 204 :
2005 : 2 355 1 518 5 184 1 484 1 989 431 402 1 016 2 826 6 663 : : : : : 1 352 :
2006 : : : : : : : : : : : : : : : : : :
Average aannual ggrowth rrate ((%) 22000/20054
: 0.96 3.91 -15.29 8.70 16.00 -11.83 7.12 6.40 4.88 0.33 : : : : : 6.99 :
1) For 2004 and 2005, EU-27 estimated. 2) Average annual growth rate 2000/2004 for CZ. 3) Provisional code which does not prejudge in any way the definitive nomenclature for this country, which will beagreed following the conclusion of negotiations currently taking place on this subject at the United Nations. 4) Growth rate 2004/2005 for PL.
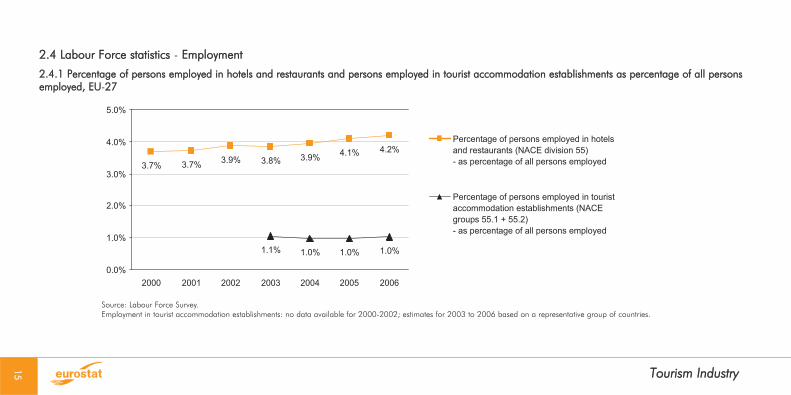
Tourism IIndustry15
2.4 LLabour FForce sstatistics - EEmployment
2.4.1 PPercentage oof ppersons eemployed iin hhotels aand rrestaurants aand ppersons eemployed iin ttourist aaccommodation eestablishments aas ppercentage oof aall ppersonsemployed, EEU-227
Source: Labour Force Survey.Employment in tourist accommodation establishments: no data available for 2000-2002; estimates for 2003 to 2006 based on a representative group of countries.

Tourism IIndustry
16
2.4.2 EEmployment iin hhotels aand rrestaurants ((NACE ddivision 555) ((in 11 0000)
EU-227 EU-225 BE BG CZ DK DE EE IE EL ES FR1 IT CY LV LT LU HU
2000 7 453 7 194 136 142 159 68 1 210 17 108 273 1 019 795 773 28 22 26 9 135
2004 8 130 7 853 128 138 178 60 1 209 17 108 280 1 199 826 1 040 31 22 32 7 149
2005 8 586 8 280 146 152 185 59 1 316 22 111 304 1 334 854 1 100 29 33 31 7 160
2006 8 986 8 683 138 158 189 77 1 371 26 116 301 1 424 906 1 163 26 34 38 7 164
Average aannual ggrowth rrate ((%) 22000/2006
3.17 3.18 0.24 1.80 2.92 2.09 2.10 7.34 1.20 1.64 5.74 3.13 7.05 -1.23 7.52 6.53 -4.10 3.30
MT NL AT PL PT RO SI SK FI SE UK HR2 MK3 TR IS LI NO CH
2000 10 287 207 244 259 117 34 63 78 117 1 117 87 : : 7 : 74 118
2004 12 311 212 226 264 139 38 82 75 131 1 216 87 : : 6 : 72 151
2005 11 314 246 233 269 154 41 86 79 117 1 193 84 : : 6 : 71 148
2006 11 335 242 266 277 145 38 103 76 134 1 221 84 : 1 053 6 : 69 160
Average aannual ggrowth rrate ((%) 22000/2006
1.60 2.61 2.64 1.45 1.13 3.64 1.87 8.54 -0.43 2.29 1.49 -0.87 : : -2.54 : -1.16 5.21
1) 2003 data used for 2000. Average annual growth rate 2003/2006. 2) 2002 data used for 2000. Average annual growth rate 2002/2006. 3) Provisional code which does not prejudge in any way the defini-tive nomenclature for this country, which will be agreed following the conclusion of negotiations currently taking place on this subject at the United Nations.

Tourism IIndustry17
2.4.3 EEmployment iin tthe ttourist aaccommodation ssector ((NACE ggroups 555.1 ++ 555.2) ((in 11 0000)
EU-227 EU-225 BE BG CZ DK DE EE IE EL ES FR IT CY LV LT LU HU
2000 : : : : : : : : : : : : : : : : : :
2004 : : : 28 53 : 311 : : : 298 232 221 : : 8u : 31
2005 : : : 29 45 : 327 : : : 327 234 221 : : : : 35
2006 : : : 36 46 18 367 8u : 71 325 249 239 : : : : 36
Average aannual ggrowth rrate ((%) 22004/2006
: : : 13.39 -6.84 : 8.63 : : : 4.43 3.60 3.99 : : : : 7.76
MT NL AT PL PT RO SI SK FI SE UK HR MK1 TR IS LI NO CH
2000 : : : : : : : : : : : : : : : : : :
2004 7 63 82 74 52 33 : 17 : : : 29 : : 2 : : 50
2005 7 63 81 79 53 41 : 19 14 29 : 25 : : 2 : 28 47
2006 6 73 78 75 52 36 : 25 14 36 : 35 : : : : 25 49
Average aannual ggrowth rrate ((%) 22004/20062
-7.42 7.64 -2.47 0.67 0.00 4.45 : 21.27 0.00 24.14 : 9.86 : : 0.00 : -10.71 -1.01
1) Provisional code which does not prejudge in any way the definitive nomenclature for this country, which will be agreed following the conclusion of negotiations currently taking place on this subject at the UnitedNations. 2) Growth rate 2005/2006 for FI, SE and NO and growth rate 2004/2005 for IS.
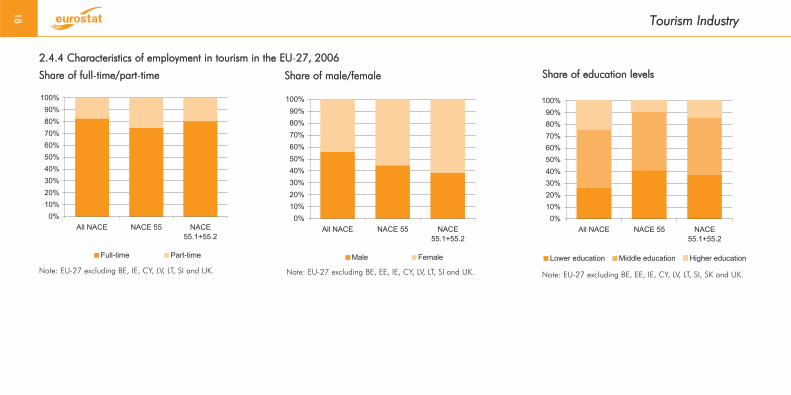
2.4.4 CCharacteristics oof eemployment iin ttourism iin tthe EEU-227, 22006
Tourism IIndustry
18
Note: EU-27 excluding BE, IE, CY, LV, LT, SI and UK. Note: EU-27 excluding BE, EE, IE, CY, LV, LT, SI and UK. Note: EU-27 excluding BE, EE, IE, CY, LV, LT, SI, SK and UK.
Share oof ffull-ttime/part-ttime Share oof mmale/female Share oof eeducation llevels

Chapter 33 - TTourism MMarket
3

3.1.1 Evolution oof tthe nnumber oof ttourism nnights1 in ccollective aaccommodation eestablishments iin tthe EEU-227 ccompared tto tthe eeconomic aactivity, ((1995=100)
Tourism MMarket
20
3.1 Some kkey ffigures oon ggrowth oof ttourism
1) Nights spent: include estimates for RO for 2002-2005.Parts of the basic data can be found in tables 1.3 and 3.2.1.

Tourism MMarket21
3.1.2 EEvolution oof ttourism rreceipts1 in tthe EEU-227 ccompared tto tthe eeconomic aactivity ((1995 == 1100)
1) Tourism receipts: EL 2005 data is used for 2006.Parts of the basic data can be found in tables 1.2 and 3.3.

EU-2271 22 EU-2251 BE BG CZ DK DE EE3 IE EL ES FR IT CY LV LT LU HU
Total 2000 2 154 379 2 128 178 29 215 8 554 44 199 25 165 298 488 2 696 29 657 62 186 344 664 284 646 338 885 17 419 1 484 1 406 2 596 20 430
2004 2 150 535 2 117 383 28 495 14 160 40 780 26 119 338 769 3 757 32 436 52 554 344 269 283 017 345 616 14 717 2 066 2 168 2 722 18 899
2005 2 249 334 2 214 271 28 380 16 071 40 321 26 227 343 981 4 111 32 097 55 264 353 392 295 593 355 017 15 058 2 634 2 623 2 682 19 737
2006 2 304 499 2 268 152 29 371 17 355 41 448 27 267 351 224 4 543 33 655 57 797 379 276 297 482 366 764 14 438 3 114 2 936 2 611 19 652
Average aannual ggrowth rrate ((%), 22000/20064
1.13 1.07 0.09 12.51 -1.07 1.35 2.75 13.93 2.13 -1.21 1.61 0.74 1.33 -3.08 13.15 13.06 0.10 -0.64
Hotels aand similar establishments
2000 1 438 854 1 414 767 14 229 8 140 25 574 9 200 198 070 2 337 24 160 60 840 227 144 191 073 233 613 17 388 1 360 882 1 263 13 541
2004 1 417 436 1 385 776 14 405 13 562 24 931 9 695 195 047 3 292 25 442 51 590 234 697 188 524 234 020 14 623 1 875 1 642 1 280 14 662
2005 1 482 106 1 448 580 14 610 15 428 25 209 10 100 200 767 3 542 25 198 54 017 245 637 198 039 240 320 14 939 2 303 2 062 1 360 15 749
2006 1 524 990 1 490 774 15 371 16 118 25 889 10 647 208 176 3 761 26 812 56 708 267 028 197 420 248 255 14 341 2 600 2 385 1 361 15 808
Average aannual ggrowth rrate ((%), 22000/20064
0.97 0.88 1.29 12.06 0.20 2.46 0.83 12.63 1.75 -1.17 2.73 0.55 1.02 -3.16 11.41 18.03 1.25 2.61
Other ccollectiveaccommodationestablishments
2000 715 525 713 411 14 986 414 18 625 15 965 100 418 359 5 497 1 346 117 520 93 573 105 272 31 124 524 1 333 6 889
2004 733 099 731 607 14 090 598 15 849 16 424 143 722 465 6 994 964 109 572 94 493 111 596 94 191 526 1 442 4 237
2005 767 228 765 691 13 770 643 15 112 16 127 143 214 569 6 899 1 247 107 755 97 554 114 697 119 331 561 1 322 3 988
2006 779 509 777 378 14 000 1 237 15 559 16 620 143 048 782 6 843 1 089 112 248 100 062 118 509 97 514 551 1 250 3 844
Average aannual ggrowth rrate ((%), 22000/20064
1.44 1.44 -1.13 20.01 -2.95 0.67 6.07 21.49 3.72 -3.47 -0.76 1.12 1.99 20.94 26.74 0.84 -1.07 -9.27
1) EU-27 and EU-25: for MT 2004 data is used for 2000. 2) EU-27: for RO 2006 data is used for 2004-2005. 3) 2002 data used for 2000. 4) Average annual growth rate 2002/2006 for EE.
Tourism MMarket
22
3.2.1 Nights sspent bby residents and non-rresidents, by ttype oof ccollective aaccommodation eestablishment ((in 11 0000)
3.2 Nights sspent bby residents and non-rresidents

MT NL AT PL PT RO SI SK FI SE UK1 HR MK2 TR IS LI NO CH
Total 2000 : 81 263 90 711 48 794 41 956 17 647 6 509 10 464 16 042 39 809 281 756 30 858 1 420 : 1 736 186 24 271 68 777
2004 7 738 80 913 95 259 46 657 41 723 : 7 301 10 632 16 699 42 666 231 411 35 991 : : 2 134 161 25 274 :
2005 7 567 80 161 97 031 48 618 43 265 : 7 307 10 622 17 259 44 940 280 384 37 292 : : 2 189 165 26 272 :
2006 7 407 83 943 98 130 51 235 45 521 18 992 7 448 11 012 18 168 47 697 266 013 37 345 : : 2 411 170 27 489 :
Average aannual ggrowth rrate ((%), 22000/20063
-2.16 0.54 1.32 0.82 1.37 1.23 2.27 0.85 2.10 3.06 -0.95 3.23 : : 5.63 -1.49 2.10 :
Hotels aand similar establishments
2000 : 29 722 71 649 14 297 33 795 15 947 4 618 5 604 13 347 21 264 192 131 18 074 882 44 728 1 186 133 16 365 33 928
2004 7 666 28 386 74 014 18 448 34 141 : 4 965 6 716 13 812 21 526 160 377 19 972 : : 1 469 104 16 360 :
2005 7 464 29 519 76 073 20 333 35 521 : 4 975 6 833 14 275 22 900 176 835 21 277 : : 1 569 111 17 110 :
2006 7 290 31 759 77 391 21 820 37 566 18 098 5 147 7 054 15 014 24 210 166 961 20 693 : : 1 728 118 17 755 :
Average aannual ggrowth rrate ((%), 22000/20063
-2.48 1.11 1.29 7.30 1.78 2.13 1.82 3.91 1.98 2.19 -2.31 2.28 : : 6.47 -1.97 1.37 :
Other ccollectiveaccommodationestablishments
2000 : 51 541 19 062 34 497 8 161 1 700 1 891 4 860 2 695 18 545 89 625 12 784 538 : 550 53 7 906 34 849
2004 72 52 527 21 245 28 209 7 582 : 2 336 3 916 2 887 21 140 71 034 16 019 : : 665 57 8 914 :
2005 103 50 642 20 958 28 285 7 744 : 2 332 3 789 2 984 22 040 103 549 16 015 : : 620 54 9 162 :
2006 117 52 184 20 739 29 415 7 955 894 2 301 3 958 3 154 23 487 99 052 16 652 : : 683 52 9 734 :
Average aannual ggrowth rrate ((%), 22000/20063
27.48 0.21 1.42 -2.62 -0.43 -10.16 3.32 -3.36 2.66 4.02 1.68 4.50 : : 3.68 -0.32 3.53 :
1) Change in methodology for residents from 2005 onwards. 2) Provisional code which does not prejudge in any way the definitive nomenclature for this country, which will be agreed following the conclusion ofnegotiations currently taking place on this subject at the United Nations. 3) Average annual growth rate 2004/2006 for MT.
Tourism MMarket23
3.2.1 Nights sspent bby residents and non-rresidents, by ttype oof ccollective aaccommodation eestablishment ((in 11 0000) ((continued)

EU-2271 22 EU-2251 BE BG CZ DK DE EE3 IE EL ES FR IT CY LV LT LU HU
Total 2000 1 254 244 1 235 362 13 689 3 384 28 602 15 159 256 068 698 9 148 15 163 110 763 174 981 198 528 603 787 771 217 9 219
2004 1 270 459 1 250 852 12 950 3 857 21 800 16 553 293 395 1 011 12 200 13 758 135 188 178 840 204 447 1 081 865 971 228 8 391
2005 1 338 921 1 318 724 12 827 4 447 20 725 16 872 295 735 1 129 12 670 14 529 143 874 187 642 206 726 1 052 1 021 1 222 230 8 958
2006 1 349 199 1 328 039 13 332 5 410 21 358 17 814 298 277 1 523 12 003 14 741 154 757 191 616 209 904 1 128 1 242 1 422 211 9 606
Average aannual ggrowth rrate ((%), 22000/20064
1.22 1.21 -0.44 8.13 -4.75 2.73 2.58 21.54 4.63 -0.47 5.73 1.53 0.93 11.00 7.90 10.74 -0.47 0.69
Hotels aand similar establishments
2000 785 888 768 990 4 045 3 036 12 655 4 592 163 429 450 6 786 14 628 83 382 114 059 136 392 597 669 303 67 5 479
2004 773 553 755 201 4 090 3 423 9 051 4 918 158 416 691 7 800 13 280 100 044 118 134 136 845 1 069 717 511 85 5 933
2005 810 247 791 361 4 313 3 957 8 601 5 316 161 895 751 8 174 13 942 106 875 125 216 138 222 1 040 796 728 85 6 622
2006 819 705 800 434 4 737 4 342 8 854 5 840 165 355 989 7 978 14 249 115 088 127 869 140 397 1 114 855 934 77 7 284
Average aannual ggrowth rrate ((%), 22000/20064
0.70 0.67 2.67 6.14 -5.78 4.09 0.20 21.76 2.73 -0.44 5.52 1.92 0.48 10.96 4.17 20.64 2.35 4.86
Other ccollectiveaccommodationestablishments
2000 468 356 466 372 9 644 348 15 947 10 567 92 639 248 2 362 535 27 381 60 922 62 136 6 118 468 150 3 740
2004 496 906 495 651 8 860 434 12 749 11 635 134 979 320 4 400 478 35 144 60 706 67 602 12 148 460 143 2 458
2005 528 674 527 363 8 514 490 12 124 11 556 133 840 378 4 496 587 36 999 62 426 68 504 12 225 494 145 2 336
2006 529 494 527 605 8 595 1 068 12 504 11 974 132 922 534 4 025 492 39 669 63 747 69 507 14 387 488 134 2 322
Average aannual ggrowth rrate ((%), 22000/20064
2.07 2.08 -1.90 20.55 -3.97 2.11 6.20 21.14 9.29 -1.39 6.37 0.76 1.89 15.17 21.89 0.70 -1.86 -7.64
1) EU-27 and EU-25: for MT 2004 data is used for 2000. 2) EU-27: for RO 2006 data is used for 2004-2005. 3) 2002 data used for 2000. 4) Average annual growth rate 2002/2006 for EE.
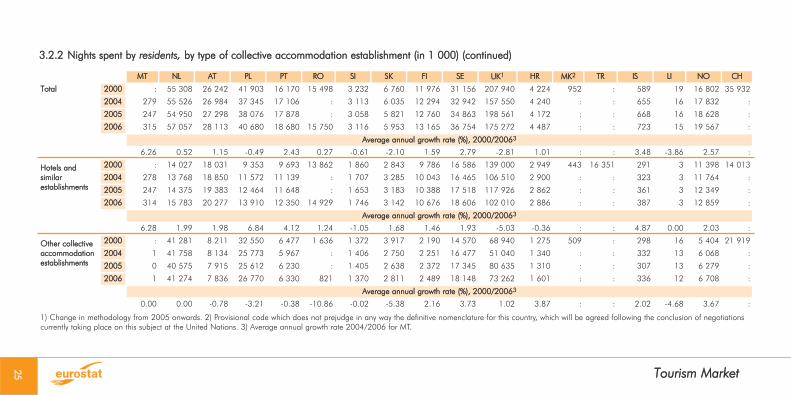
3.2.2 Nights sspent bby residents, by ttype oof ccollective aaccommodation eestablishment ((in 11 0000)
Tourism MMarket
24
MT NL AT PL PT RO SI SK FI SE UK1 HR MK2 TR IS LI NO CH
Total 2000 : 55 308 26 242 41 903 16 170 15 498 3 232 6 760 11 976 31 156 207 940 4 224 952 : 589 19 16 802 35 932
2004 279 55 526 26 984 37 345 17 106 : 3 113 6 035 12 294 32 942 157 550 4 240 : : 655 16 17 832 :
2005 247 54 950 27 298 38 076 17 878 : 3 058 5 821 12 760 34 863 198 561 4 172 : : 668 16 18 628 :
2006 315 57 057 28 113 40 680 18 680 15 750 3 116 5 953 13 165 36 754 175 272 4 487 : : 723 15 19 567 :
Average aannual ggrowth rrate ((%), 22000/20063
6.26 0.52 1.15 -0.49 2.43 0.27 -0.61 -2.10 1.59 2.79 -2.81 1.01 : : 3.48 -3.86 2.57 :
Hotels aand similar establishments
2000 : 14 027 18 031 9 353 9 693 13 862 1 860 2 843 9 786 16 586 139 000 2 949 443 16 351 291 3 11 398 14 013
2004 278 13 768 18 850 11 572 11 139 : 1 707 3 285 10 043 16 465 106 510 2 900 : : 323 3 11 764 :
2005 247 14 375 19 383 12 464 11 648 : 1 653 3 183 10 388 17 518 117 926 2 862 : : 361 3 12 349 :
2006 314 15 783 20 277 13 910 12 350 14 929 1 746 3 142 10 676 18 606 102 010 2 886 : : 387 3 12 859 :
Average aannual ggrowth rrate ((%), 22000/20063
6.28 1.99 1.98 6.84 4.12 1.24 -1.05 1.68 1.46 1.93 -5.03 -0.36 : : 4.87 0.00 2.03 :
Other ccollectiveaccommodationestablishments
2000 : 41 281 8 211 32 550 6 477 1 636 1 372 3 917 2 190 14 570 68 940 1 275 509 : 298 16 5 404 21 919
2004 1 41 758 8 134 25 773 5 967 : 1 406 2 750 2 251 16 477 51 040 1 340 : : 332 13 6 068 :
2005 0 40 575 7 915 25 612 6 230 : 1 405 2 638 2 372 17 345 80 635 1 310 : : 307 13 6 279 :
2006 1 41 274 7 836 26 770 6 330 821 1 370 2 811 2 489 18 148 73 262 1 601 : : 336 12 6 708 :
Average aannual ggrowth rrate ((%), 22000/20063
0.00 0.00 -0.78 -3.21 -0.38 -10.86 -0.02 -5.38 2.16 3.73 1.02 3.87 : : 2.02 -4.68 3.67 :
1) Change in methodology from 2005 onwards. 2) Provisional code which does not prejudge in any way the definitive nomenclature for this country, which will be agreed following the conclusion of negotiationscurrently taking place on this subject at the United Nations. 3) Average annual growth rate 2004/2006 for MT.
Tourism MMarket25
3.2.2 Nights sspent bby residents, by ttype oof ccollective aaccommodation eestablishment ((in 11 0000) ((continued)
EU-2271 22 EU-2251 BE BG CZ DK DE EE3 IE EL ES FR IT CY LV LT LU HU
Total 2000 899 762 892 443 15 527 5 170 15 597 10 006 42 420 1 998 20 509 47 023 233 901 109 664 140 357 16 815 697 636 2 379 11 211
2004 880 078 866 533 15 544 10 303 18 981 9 566 45 373 2 747 20 236 38 796 209 082 104 178 141 169 13 636 1 201 1 197 2 494 10 508
2005 910 419 895 553 15 553 11 624 19 595 9 356 48 246 2 983 19 427 40 735 209 519 107 952 148 291 14 006 1 613 1 401 2 452 10 779
2006 955 302 940 115 16 039 11 945 20 090 9 453 52 948 3 020 21 652 43 056 224 518 105 865 156 862 13 310 1 872 1 514 2 400 10 046
Average aannual ggrowth rrate ((%), 22000/20064
1.00 0.87 0.54 14.98 4.31 -0.94 3.76 10.88 0.91 -1.46 -0.68 -0.59 1.87 -3.82 17.90 15.55 0.15 -1.81
Hotels aand similar establishments
2000 652 594 645 405 10 184 5 104 12 919 4 608 34 641 1 887 17 374 46 212 143 762 77 014 97 221 16 790 691 579 1 196 8 062
2004 643 886 630 578 10 315 10 139 15 881 4 776 36 631 2 602 17 642 38 310 134 654 70 391 97 175 13 554 1 158 1 131 1 195 8 729
2005 671 859 657 219 10 297 11 471 16 607 4 784 38 872 2 791 17 024 40 075 138 762 72 824 102 098 13 899 1 507 1 334 1 275 9 127
2006 705 287 690 342 10 633 11 776 17 035 4 807 42 821 2 772 18 834 42 459 151 940 69 551 107 859 13 227 1 745 1 451 1 284 8 524
Average aannual ggrowth rrate ((%), 22000/20064
1.30 1.13 0.72 14.95 4.72 0.71 3.60 10.09 1.35 -1.40 0.93 -1.68 1.75 -3.90 16.70 16.55 1.19 0.93
Other ccollectiveaccommodationestablishments
2000 247 168 247 038 5 343 66 2 678 5 398 7 779 111 3 135 811 90 139 32 650 43 136 25 6 57 1 183 3 149
2004 236 192 235 955 5 229 164 3 100 4 790 8 742 145 2 594 486 74 428 33 787 43 994 82 43 66 1 299 1 779
2005 238 560 238 334 5 256 153 2 988 4 572 9 374 192 2 403 660 70 757 35 128 46 193 107 106 67 1 177 1 652
2006 250 015 249 773 5 406 169 3 055 4 646 10 127 248 2 818 597 72 578 36 314 49 003 83 127 63 1 116 1 522
Average aannual ggrowth rrate ((%), 22000/20064
0.19 0.18 0.20 16.97 2.22 -2.47 4.49 22.26 -1.76 -4.98 -3.55 1.79 2.15 22.14 66.32 1.68 -0.97 -11.41
1) EU-27 and EU-25: for MT 2004 data is used for 2000 ("Total" and "Other collective accommodation establishments"). 2) EU-27: for RO 2006 data is used for 2004-2005. 3) 2002 data used for 2000. 4) Average annual growth rate 2002/2006 for EE.
Tourism MMarket
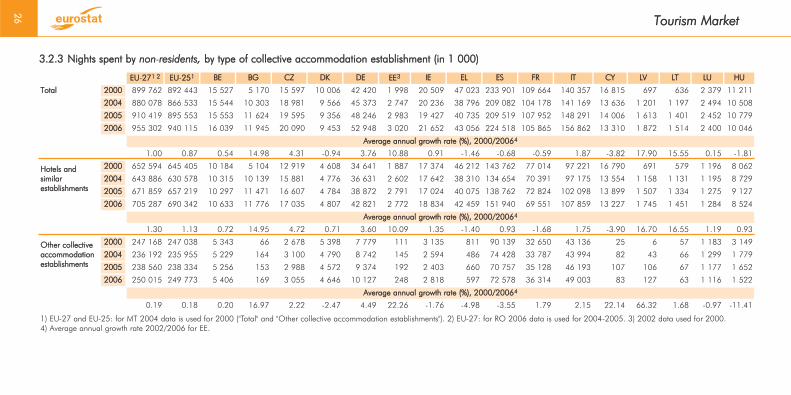
26
3.2.3 Nights sspent bby non-rresidents, by ttype oof ccollective aaccommodation eestablishment ((in 11 0000)

MT NL AT PL PT RO SI SK FI SE UK HR MK1 TR IS LI NO CH
Total 2000 : 25 955 64 468 6 892 25 785 2 149 3 277 3 704 4 066 8 654 73 816 26 634 468 : 1 147 169 7 469 32 844
2004 7 459 25 386 68 274 9 313 24 617 : 4 188 4 597 4 406 9 724 73 861 31 751 : : 1 479 145 7 442 :
2005 7 321 25 210 69 732 10 543 25 388 : 4 250 4 801 4 499 10 078 81 823 33 120 : : 1 521 149 7 644 :
2006 7 093 26 886 70 017 10 555 26 842 3 242 4 332 5 058 5 004 10 943 90 740 32 858 : : 1 688 155 7 922 :
Average aannual ggrowth rrate ((%), 22000/20062
-2.48 0.59 1.39 7.36 0.67 7.09 4.76 5.33 3.52 3.99 3.50 3.56 : : 6.65 -1.43 0.99 :
Hotels aand similar establishments
2000 7 015 15 695 53 617 4 945 24 102 2 085 2 758 2 761 3 562 4 679 53 131 15 125 439 28 377 895 131 4 967 19 914
2004 7 388 14 618 55 163 6 876 23 002 : 3 258 3 432 3 769 5 061 53 867 17 072 : : 1 146 101 4 596 :
2005 7 218 15 143 56 690 7 869 23 873 : 3 322 3 650 3 887 5 382 58 909 18 415 : : 1 208 108 4 761 :
2006 6 977 15 976 57 114 7 911 25 216 3 169 3 401 3 911 4 339 5 604 64 951 17 807 : : 1 341 115 4 896 :
Average aannual ggrowth rrate ((%), 22000/2006
-0.09 0.30 1.06 8.15 0.76 7.23 3.55 5.98 3.34 3.05 3.40 2.76 : : 6.97 -2.15 -0.24 :
Other ccollectiveaccommodationestablishments
2000 : 10 260 10 851 1 947 1 683 64 519 943 504 3 975 20 685 11 509 29 : 252 38 2 502 12 930
2004 71 10 768 13 111 2 437 1 615 : 930 1 165 637 4 663 19 994 14 679 : : 333 44 2 846 :
2005 103 10 067 13 042 2 674 1 515 : 928 1 151 612 4 696 22 914 14 705 : : 313 41 2 883 :
2006 116 10 910 12 903 2 644 1 626 73 931 1 147 665 5 339 25 789 15 051 : : 347 40 3 026 :
Average aannual ggrowth rrate ((%), 22000/20062
27.82 1.03 2.93 5.23 -0.57 2.22 10.23 3.32 4.73 5.04 3.74 4.57 : : 5.48 0.86 3.22 :
1) Provisional code which does not prejudge in any way the definitive nomenclature for this country, which will be agreed following the conclusion of negotiations currently taking place on this subject at the UnitedNations. 2) Average annual growth rate 2004/2006 for MT for "Total" and "Other collective accommodation establishments".
Tourism MMarket27
3.2.3 NNights sspent bby non-rresidents, by ttype oof ccollective aaccommodation eestablishment ((in 11 0000) ((continued)

Tourism MMarket
28
3.2.4 NNights sspent bby residents and non-rresidents in ccollective aaccommodation eestablishments, bby ccountry oof oorigin oof tthe gguests ((share oof rresidents, sshare oofother EEU MMember SStates' rresidents, sshare oof nnon-EEU rresidents)
EU-2271 22 EU-2251 BE BG3 CZ4 DK DE EE4 IE EL ES FR IT CY LV5 LT4 LU HU3
Share oof rresidents2000 56.5 56.6 46.1 30.2 53.7 59.5 84.8 24.0 20.8 23.2 31.5 66.3 56.7 3.5 37.7 42.3 8.2 27.4
2004 56.0 56.3 44.6 23.8 49.4 62.4 85.5 25.1 : 24.6 38.7 62.6 57.3 7.5 34.8 36.5 8.2 41.1
2005 59.6 59.8 45.2 26.5 50.7 63.8 86.0 27.3 : 25.7 40.6 63.3 57.7 6.9 37.0 45.2 8.6 44.0
2006 58.8 58.8 45.4 29.7 50.8 64.9 84.9 33.3 : 24.9 40.7 64.4 56.8 7.8 38.8 46.6 8.1 47.3
Share oof oother EEUMember SStates'residents
2000 32.7 32.6 44.0 41.0 30.3 28.5 8.6 56.5 52.4 59.7 60.1 29.6 30.1 79.8 23.1 22.3 80.8 57.1
2004 29.6 29.5 45.1 50.6 32.7 25.1 8.1 58.0 : 56.7 53.8 27.6 28.2 77.1 25.8 28.0 81.2 38.6
2005 31.0 30.8 46.3 55.0 36.3 24.6 8.7 62.7 : 59.6 53.1 26.9 29.6 79.1 42.0 36.5 83.1 39.8
2006 31.3 31.3 46.0 48.6 34.7 23.7 9.2 55.4 : 58.4 52.5 27.3 30.1 76.6 40.7 34.6 82.9 36.1
Share oof nnon-EEUresidents
2000 10.8 10.8 9.9 28.8 16.0 12.0 6.6 19.5 26.8 17.1 8.4 4.2 13.2 16.7 39.2 35.5 11.0 15.6
2004 14.4 14.3 10.3 25.6 17.9 12.5 6.4 16.9 : 18.7 7.5 9.8 14.5 15.5 39.4 35.6 10.7 20.3
2005 9.4 9.4 8.5 18.5 13.0 11.6 5.3 10.0 : 14.7 6.3 9.8 12.7 13.9 21.1 18.4 8.4 16.2
2006 9.9 9.9 8.6 21.7 14.4 11.4 5.9 11.3 : 16.7 6.8 8.3 13.2 15.6 20.5 18.8 9.0 16.6
1) EU-27 and EU-25: for 2004-2006 excluding IE. 2) EU-27: for 2000, 2004 and 2005 excluding RO. 3) 2001 data used for 2000. 4) 2002 data used for 2000. 5) 2003 data used for 2000.

Tourism MMarket29
3.2.4 NNights sspent bby residents and non-rresidents in ccollective aaccommodation eestablishments, bby ccountry oof oorigin oof tthe gguests ((share oof rresidents, sshare oofother EEU MMember SStates' rresidents, sshare oof nnon-EEU rresidents) ((continued)
MT NL AT PL1 PT RO SI2 SK1 FI SE UK3 HR1 MK4 TR IS LI NO CH
Share oof rresidents2000 3.9 69.9 28.1 80.4 38.4 : 42.2 47.2 71.5 77.2 73.1 9.3 : : 33.3 9.7 68.4 51.6
2004 3.7 72.8 27.3 77.8 40.4 : 38.2 45.5 70.5 76.1 51.1 9.2 : : 29.8 10.0 69.5 :
2005 3.9 72.8 28.0 78.0 41.3 : 39.4 54.0 74.2 77.2 71.3 11.0 : : 29.9 9.9 70.6 :
2006 5.1 72.5 28.5 79.1 41.0 81.8 39.3 53.3 72.8 76.7 65.9 11.8 : : 29.3 8.9 70.8 :
Share oof oother EEUMember SStates'residents
2000 92.5 25.6 60.4 12.2 53.1 : 37.3 28.2 13.8 12.0 10.5 54.4 : : 46.1 52.6 25.2 37.3
2004 81.6 25.4 60.1 14.4 50.7 : 39.5 29.3 15.0 11.9 11.1 55.5 : : 47.1 46.1 24.0 :
2005 86.3 25.4 62.2 16.7 51.6 : 42.4 37.9 16.5 12.3 15.2 79.9 : : 46.8 49.5 24.3 :
2006 82.2 26.0 61.1 15.6 51.7 11.3 41.2 37.9 16.6 12.6 17.8 77.8 : : 45.7 50.8 23.9 :
Share oof nnon-EEUresidents
2000 3.6 4.5 11.5 7.4 8.5 : 20.5 24.6 14.7 10.7 16.4 36.3 : : 20.6 37.8 6.4 11.1
2004 14.7 1.8 12.6 7.8 8.9 : 22.2 25.2 14.5 12.0 37.8 35.3 : : 23.1 43.9 6.4 :
2005 9.8 1.8 9.8 5.3 7.1 : 18.2 8.1 9.3 10.5 13.5 9.2 : : 23.2 40.6 5.2 :
2006 12.8 1.5 10.4 5.3 7.3 6.9 19.5 8.8 10.6 10.6 16.3 10.4 : : 25.1 40.3 5.2 :
1) 2003 data used for 2000. 2) 2001 data used for 2000. 3) Change in methodology for residents from 2005 onwards. 4) Provisional code which does not prejudge in any way the definitive nomenclature forthis country, which will be agreed following the conclusion of negotiations currently taking place on this subject at the United Nations.

Tourism MMarket
30
3.2.5 TTourism iintensity: NNumber oof nnights sspent bby residents and non-rresidents in ccollective aaccommodation eestablishments ccompared tto tthe ppopulation oof ttheMember SStates
EU-2271 22 EU-2251 BE BG CZ DK DE EE IE EL ES FR IT CY LV LT LU HU
2000 4.5 4.7 2.9 1.0 4.3 4.7 3.6 2.0 7.9 5.7 8.6 4.7 6.0 25.2 0.6 0.4 6.0 2.0
2004 4.4 4.6 2.7 1.8 4.0 4.8 4.1 2.8 8.1 4.8 8.1 4.5 6.0 20.2 0.9 0.6 6.0 1.9
2005 4.6 4.8 2.7 2.1 3.9 4.8 4.2 3.1 7.8 5.0 8.2 4.7 6.1 20.1 1.1 0.8 5.9 2.0
2006 4.7 4.9 2.8 2.2 4.0 5.0 4.3 3.4 8.0 5.2 8.7 4.7 6.2 18.8 1.4 0.9 5.6 2.0
Average aannual ggrowth rrate ((%), 22000/20063
0.73 0.70 -0.58 14.04 -1.20 1.04 3.01 14.19 0.31 -1.52 0.19 0.00 0.55 -4.77 15.17 14.47 -1.14 0.00
MT NL AT PL PT RO SI SK FI SE UK4 HR MK5 TR IS LI NO CH
2000 : 5.1 11.3 1.3 4.1 0.8 3.3 1.9 3.1 4.5 4.8 6.9 0.7 : 6.2 5.8 5.4 9.6
2004 19.3 5.0 11.7 1.2 4.0 : 3.7 2.0 3.2 4.8 3.9 8.1 : : 7.3 4.7 5.5 :
2005 18.8 4.9 11.8 1.3 4.1 : 3.7 2.0 3.3 5.0 4.7 8.4 : : 7.5 4.8 5.7 :
2006 18.3 5.1 11.9 1.3 4.3 0.9 3.7 2.0 3.5 5.3 4.4 8.4 : : 8.0 4.9 5.9 :
Average aannual ggrowth rrate ((%), 22000/20063
-2.63 0.00 0.87 0.00 0.80 1.98 1.93 0.86 3.08 2.76 -1.44 3.33 : : 4.34 -2.77 1.49 :
1) EU-27 and EU-25: for MT 2004 data is used for 2000. 2) EU-27: for RO 2006 data is used for 2004-2005. 3) Average annual growth rate 2002/2006 for EE and 2004/2006 for MT. 4) For nights spent byresidents, change in methodology from 2005 onwards. 5) Provisional code which does not prejudge in any way the definitive nomenclature for this country, which will be agreed following the conclusion of negoti-ations currently taking place on this subject at the United Nations.

Tourism MMarket31
3.2.6 GGross ooccupancy rrate oof bbed pplaces iin hhotels aand ssimilar eestablishments, aannual aaverage
EU-2271 EU-225 BE BG CZ DK DE EE IE EL ES FR IT CY LV LT LU HU
2000 38.0 38.5 32.7 18.4 32.2 40.1 34.1 28.8 47.8 27.4 47.3 43.1 34.5 56.4 31.3 21.0 24.1 25.8
2004 34.8 35.7 32.3 21.7 29.7 37.8 33.2 39.8 49.2 21.2 42.5 40.8 32.1 43.4 28.6 24.1 24.6 25.4
2005 36.3 37.3 33.2 21.0 29.7 39.5 33.9 38.5 46.4 21.7 42.6 43.1 32.5 44.8 32.8 28.3 25.8 26.6
2006 36.2 36.8 34.0 20.9 30.0 41.2 35.0 39.5 49.6 22.4 45.3 43.1 32.6 43.9 36.2 30.4 26.0 27.3
MT NL AT PL PT RO SI SK FI SE UK2 HR MK3 TR IS LI NO CH
2000 47.1 47.1 33.4 32.6 41.5 21.9 41.4 35.1 31.2 30.9 47.0 24.8 15.1 38.0 26.1 30.9 31.9 35.8
2004 51.5 41.0 35.5 30.6 36.8 : 45.9 32.7 31.5 31.0 35.9 27.5 : : 26.4 24.2 31.8 :
2005 54.8 42.1 36.5 32.8 36.9 : 45.5 32.8 33.3 31.8 45.6 28.7 : : 25.8 25.6 32.7 :
2006 50.5 45.3 37.0 33.6 39.0 21.9 45.3 33.3 34.8 32.9 36.4 34.7 : : 28.1 25.6 32.2 :
1) EU-27: for RO 2006 data is used for 2004-2005. 2) For nights spent by residents, change in methodology from 2005 onwards. 3) Provisional code which does not prejudge in any way the definitive nomen-clature for this country, which will be agreed following the conclusion of negotiations currently taking place on this subject at the United Nations.
Tourism MMarket
32
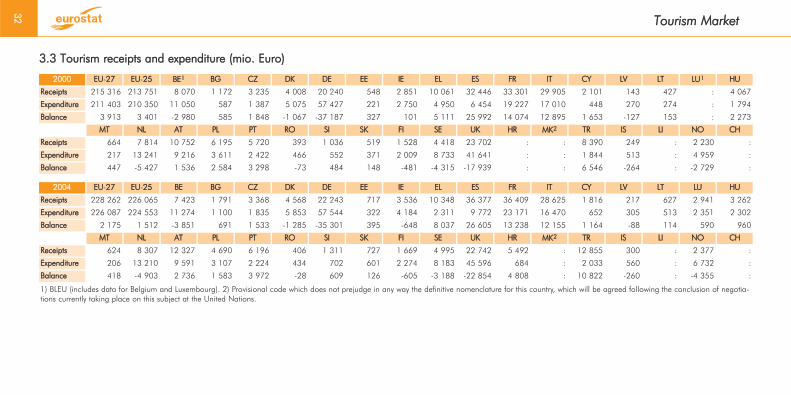
3.3 TTourism rreceipts aand eexpenditure ((mio. EEuro)
2000 EU-227 EU-225 BE1 BG CZ DK DE EE IE EL ES FR IT CY LV LT LU1 HU
Receipts 215 316 213 751 8 070 1 172 3 235 4 008 20 240 548 2 851 10 061 32 446 33 301 29 905 2 101 143 427 : 4 067
Expenditure 211 403 210 350 11 050 587 1 387 5 075 57 427 221 2 750 4 950 6 454 19 227 17 010 448 270 274 : 1 794
Balance 3 913 3 401 -2 980 585 1 848 -1 067 -37 187 327 101 5 111 25 992 14 074 12 895 1 653 -127 153 : 2 273
MT NL AT PL PT RO SI SK FI SE UK HR MK2 TR IS LI NO CH
Receipts 664 7 814 10 752 6 195 5 720 393 1 036 519 1 528 4 418 23 702 : : 8 390 249 : 2 230 :
Expenditure 217 13 241 9 216 3 611 2 422 466 552 371 2 009 8 733 41 641 : : 1 844 513 : 4 959 :
Balance 447 -5 427 1 536 2 584 3 298 -73 484 148 -481 -4 315 -17 939 : : 6 546 -264 : -2 729 :
2004 EU-227 EU-225 BE BG CZ DK DE EE IE EL ES FR IT CY LV LT LU HU
Receipts 228 262 226 065 7 423 1 791 3 368 4 568 22 243 717 3 536 10 348 36 377 36 409 28 625 1 816 217 627 2 941 3 262
Expenditure 226 087 224 553 11 274 1 100 1 835 5 853 57 544 322 4 184 2 311 9 772 23 171 16 470 652 305 513 2 351 2 302
Balance 2 175 1 512 -3 851 691 1 533 -1 285 -35 301 395 -648 8 037 26 605 13 238 12 155 1 164 -88 114 590 960
MT NL AT PL PT RO SI SK FI SE UK HR MK2 TR IS LI NO CH
Receipts 624 8 307 12 327 4 690 6 196 406 1 311 727 1 669 4 995 22 742 5 492 : 12 855 300 : 2 377 :
Expenditure 206 13 210 9 591 3 107 2 224 434 702 601 2 274 8 183 45 596 684 : 2 033 560 : 6 732 :
Balance 418 -4 903 2 736 1 583 3 972 -28 609 126 -605 -3 188 -22 854 4 808 : 10 822 -260 : -4 355 :
1) BLEU (includes data for Belgium and Luxembourg). 2) Provisional code which does not prejudge in any way the definitive nomenclature for this country, which will be agreed following the conclusion of negotia-tions currently taking place on this subject at the United Nations.
Tourism MMarket33
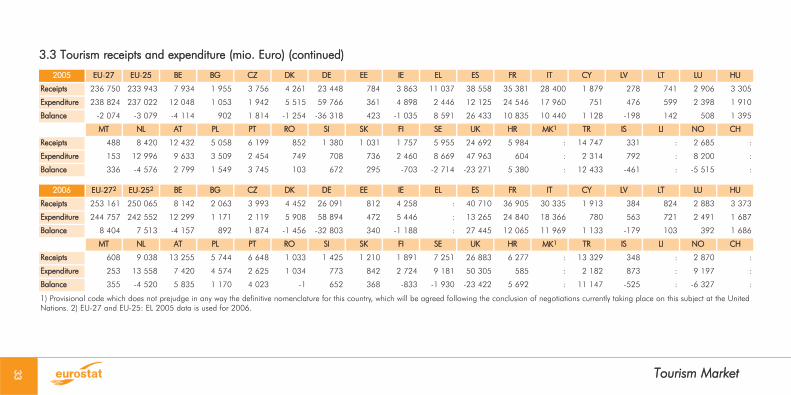
3.3 TTourism rreceipts aand eexpenditure ((mio. EEuro) ((continued)
2005 EU-227 EU-225 BE BG CZ DK DE EE IE EL ES FR IT CY LV LT LU HU
Receipts 236 750 233 943 7 934 1 955 3 756 4 261 23 448 784 3 863 11 037 38 558 35 381 28 400 1 879 278 741 2 906 3 305
Expenditure 238 824 237 022 12 048 1 053 1 942 5 515 59 766 361 4 898 2 446 12 125 24 546 17 960 751 476 599 2 398 1 910
Balance -2 074 -3 079 -4 114 902 1 814 -1 254 -36 318 423 -1 035 8 591 26 433 10 835 10 440 1 128 -198 142 508 1 395
MT NL AT PL PT RO SI SK FI SE UK HR MK1 TR IS LI NO CH
Receipts 488 8 420 12 432 5 058 6 199 852 1 380 1 031 1 757 5 955 24 692 5 984 : 14 747 331 : 2 685 :
Expenditure 153 12 996 9 633 3 509 2 454 749 708 736 2 460 8 669 47 963 604 : 2 314 792 : 8 200 :
Balance 336 -4 576 2 799 1 549 3 745 103 672 295 -703 -2 714 -23 271 5 380 : 12 433 -461 : -5 515 :
2006 EU-2272 EU-2252 BE BG CZ DK DE EE IE EL ES FR IT CY LV LT LU HU
Receipts 253 161 250 065 8 142 2 063 3 993 4 452 26 091 812 4 258 : 40 710 36 905 30 335 1 913 384 824 2 883 3 373
Expenditure 244 757 242 552 12 299 1 171 2 119 5 908 58 894 472 5 446 : 13 265 24 840 18 366 780 563 721 2 491 1 687
Balance 8 404 7 513 -4 157 892 1 874 -1 456 -32 803 340 -1 188 : 27 445 12 065 11 969 1 133 -179 103 392 1 686
MT NL AT PL PT RO SI SK FI SE UK HR MK1 TR IS LI NO CH
Receipts 608 9 038 13 255 5 744 6 648 1 033 1 425 1 210 1 891 7 251 26 883 6 277 : 13 329 348 : 2 870 :
Expenditure 253 13 558 7 420 4 574 2 625 1 034 773 842 2 724 9 181 50 305 585 : 2 182 873 : 9 197 :
Balance 355 -4 520 5 835 1 170 4 023 -1 652 368 -833 -1 930 -23 422 5 692 : 11 147 -525 : -6 327 :
1) Provisional code which does not prejudge in any way the definitive nomenclature for this country, which will be agreed following the conclusion of negotiations currently taking place on this subject at the UnitedNations. 2) EU-27 and EU-25: EL 2005 data is used for 2006.
Tourism MMarket
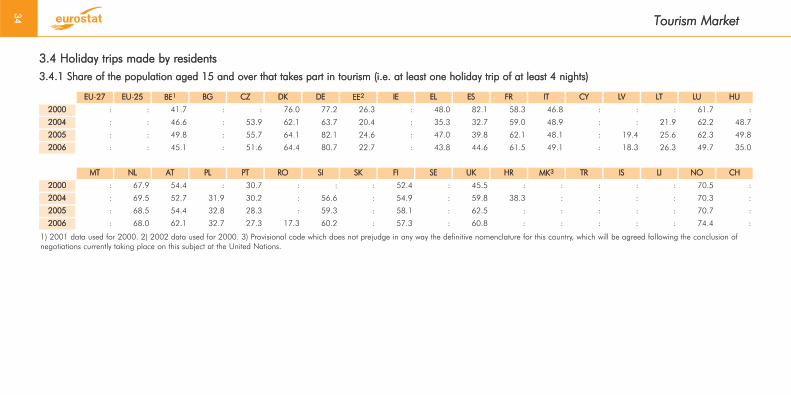
34
3.4 HHoliday ttrips mmade bby rresidents3.4.1 SShare oof tthe ppopulation aaged 115 aand oover tthat ttakes ppart iin ttourism ((i.e. aat lleast oone hholiday ttrip oof aat lleast 44 nnights)
EU-227 EU-225 BE1 BG CZ DK DE EE2 IE EL ES FR IT CY LV LT LU HU
2000 : : 41.7 : : 76.0 77.2 26.3 : 48.0 82.1 58.3 46.8 : : : 61.7 :
2004 : : 46.6 : 53.9 62.1 63.7 20.4 : 35.3 32.7 59.0 48.9 : : 21.9 62.2 48.7
2005 : : 49.8 : 55.7 64.1 82.1 24.6 : 47.0 39.8 62.1 48.1 : 19.4 25.6 62.3 49.8
2006 : : 45.1 : 51.6 64.4 80.7 22.7 : 43.8 44.6 61.5 49.1 : 18.3 26.3 49.7 35.0
MT NL AT PL PT RO SI SK FI SE UK HR MK3 TR IS LI NO CH
2000 : 67.9 54.4 : 30.7 : : : 52.4 : 45.5 : : : : : 70.5 :
2004 : 69.5 52.7 31.9 30.2 : 56.6 : 54.9 : 59.8 38.3 : : : : 70.3 :
2005 : 68.5 54.4 32.8 28.3 : 59.3 : 58.1 : 62.5 : : : : : 70.7 :
2006 : 68.0 62.1 32.7 27.3 17.3 60.2 : 57.3 : 60.8 : : : : : 74.4 :
1) 2001 data used for 2000. 2) 2002 data used for 2000. 3) Provisional code which does not prejudge in any way the definitive nomenclature for this country, which will be agreed following the conclusion ofnegotiations currently taking place on this subject at the United Nations.

3.4.2 NNumber oof hholiday ttrips ((at lleast oone oovernight sstay) bby EEU rresidentsaged 115 aand oover, bby llength oof sstay, 22000-22006 ((in 11 0000)
Tourism MMarket35
3.4.3 NNumber oof llong hholiday ttrips ((at lleast 44 nnights) bby EEU rresidents aaged15 aand oover, bby ddestination, 22000-22006 ((in 11 0000)
Note: EU-27 based on data for BE (incl. estimate for short trips in 2000), DK, DE, IE, EL, ES, FR (incl.estimate for short trips in 2001), IT, LU (incl. estimate for short trips in 2002), NL, AT, PT, FI and UK(incl. estimate for short trips in 2005). Since this estimate does not include trips made by residentsfrom BG, CZ, EE, CY, LV, LT, HU, MT, PL, RO, SI, SK and SE (due to incomplete data for the period2000-2006), the absolute values imply an underestimation of the actual EU-27 figure. However, theyear-to-year comparisons are reliable as the subset of Member States used for the EU-27 figure rep-resents about 85% of the total number of trips made by EU residents (in 2006).
Note: EU-27 based on data for BE, DK, DE, IE, EL, ES, FR, IT, LU, NL, AT, PT, FI and UK. Since thisestimate does not include trips made by residents from BG, CZ, EE, CY, LV, LT, HU, MT, PL, RO, SI, SKand SE (due to incomplete data for the period 2000-2006), the absolute values imply an underesti-mation of the actual EU-27 figure. However, the year-to-year comparisons are reliable as the subsetof Member States used for the EU-27 figure represents 85 to 90% of the total number of trips (of atleast 4 nights) made by EU residents (in 2006).

3.4.4 NNumber oof hholiday ttrips ((at lleast 11 oovernight sstay) bby rresidents aaged 115 aand oover, bby llength oof sstay ((in 11 0000)
Tourism MMarket
36
EU-227 EU-225 BE1 BG CZ DK2 DE EE IE EL ES3 FR IT CY LV LT LU HU
Total ttrips 2000 : : 9 256 : : 7 789 127 979 : 5 019 6 359 120 480 157 176 64 519 : : : 820 :
2004 : : 11 162 : 27 769 7 072 137 849 1 050 7 780 11 295 109 580 183 249 68 638 : : 3 115 1 125 17 267
2005 : : 11 929 : 28 335 8 227 156 157 1 093 7 685 13 322 125 021 185 810 76 342 : 4 528 3 271 1 202 22 799
2006 : : 9 836 : 26 755 10 631 153 276 864 9 797 15 883 120 901 188 157 78 055 : 4 701 3 476 1 099 24 684
Average aannual ggrowth rrate ((%), 22000/20064
: : 1.02 : -1.84 5.32 3.05 -9.29 18.20 16.48 0.06 3.04 3.23 : 3.82 5.64 5.00 19.56
Short ttrips 1-33 nnights)
2000 : : 2 882 : : 3 233 22 329 : 2 254 1 606 92 492 81 424 29 062 : : : 250 :
2004 : : 4 179 : 18 186 2 642 33 902 803 3 843 4 272 85 818 102 177 31 501 : : 2 188 444 11 810
2005 : : 4 214 : 18 394 3 163 42 471 775 3 387 4 688 86 627 101 586 36 285 : 3 768 2 192 477 15 684
2006 : : 3 189 : 17 821 4 735 47 845 585 5 007 7 305 81 302 105 020 36 920 : 3 792 2 386 420 17 973
Average aannual ggrowth rrate ((%), 22000/20064
: : 1.70 : -1.01 6.57 13.54 -14.65 22.08 28.72 -2.13 4.33 4.07 : 0.64 4.43 9.03 23.36
Long ttrips ((4nights oor mmore)
2000 : : 6 374 : : 4 556 105 650 : 2 765 4 753 27 988 75 752 35 457 : : : 570 :
2004 : : 6 983 : 9 583 4 430 103 947 247 3 937 7 023 23 762 81 072 37 137 719 : 927 681 5 457
2005 : : 7 715 : 9 941 5 064 113 686 318 4 298 8 634 38 394 84 224 40 057 : 760 1 079 725 7 115
2006 : : 6 647 : 8 934 5 896 105 431 279 4 790 8 578 39 599 83 137 41 135 : 909 1 090 679 6 711
Average aannual ggrowth rrate ((%), 22000/20064
: : 0.70 : -3.45 4.39 -0.03 6.28 14.73 10.34 5.95 1.56 2.51 : 19.61 8.44 2.96 10.90
1) 2001 data used for 2000 for short trips. 2) Change in methodology from 2006 onwards. 3) Change in methodology from 2005 onwards. 4) Average annual growth rate 2001/2006 for BE. Average annualgrowth rate 2004/2006 for CZ, EE, LT and HU. Growth rate 2005/2006 for LV.

3.4.4 NNumber oof hholiday ttrips ((at lleast 11 oovernight sstay) bby rresidents aaged 115 aand oover, bby llength oof sstay ((in 11 0000) ((continued)
Tourism MMarket37
MT NL AT PL PT RO SI SK FI SE UK HR MK1 TR IS LI NO CH
Total ttrips 2000 : 25 354 15 621 : 10 621 : : : 23 109 : 152 700 : : : : : : :
2004 : 28 712 13 202 40 288 10 816 10 376 3 982 6 370 28 124 : 122 975 : : : : : 16 430 :
2005 : 27 872 13 709 35 500 11 417 8 738 3 901 6 067 29 611 : : : : : : : 16 391 :
2006 : 28 265 15 771 38 283 10 265 6 892 4 765 6 420 28 161 : 112 695 : : : : : 17 312 :
Average aannual ggrowth rrate ((%), 22000/20062
: 1.83 0.16 -2.52 -0.57 -18.50 9.39 0.39 5.07 : -4.94 : : : : : 2.65 :
Short ttrips (1-33 nnights)
2000 : 9 825 9 932 : 6 933 : : : 17 848 : 74 700 : : : : : : :
2004 : 10 237 5 361 23 649 6 651 6 127 2 447 1 861 21 924 : 56 975 : : : : : 10 637 :
2005 : 9 824 6 241 18 978 7 481 4 881 2 258 1 868 23 168 : : : : : : : 10 519 :
2006 : 9 881 7 026 20 475 6 602 3 505 2 958 1 865 21 541 : 50 874 : : : : : 11 331 :
Average aannual ggrowth rrate ((%), 22000/20062
: 0.09 -5.61 -6.95 -0.81 -24.37 9.95 0.11 4.81 : -6.20 : : : : : 3.21 :
Long ttrips ((4nights oor mmore)
2000 : 15 529 5 689 : 3 688 : : : 5 261 : 78 000 : : : : : 5 096 :
2004 : 18 475 7 841 16 639 4 165 4 249 1 535 4 509 6 200 : 66 000 1 798 : : : : 5 793 :
2005 : 18 048 7 468 16 522 3 936 3 857 1 643 4 199 6 443 : 66 420 : : : : : 5 872 :
2006 : 18 384 8 745 17 808 3 663 3 387 1 807 4 555 6 620 : 61 821 : : : : : 5 981 :
Average aannual ggrowth rrate ((%), 22000/20062
: 2.85 7.43 3.45 -0.11 -10.72 : : 5.91 : -3.80 : : : : : 2.70 :
1) Provisional code which does not prejudge in any way the definitive nomenclature for this country, which will be agreed following the conclusion of negotiations currently taking place on this subject at the UnitedNations. 2) Average annual growth rate 2004/2006 for PL, RO, SI, SK and NO (except long trips).

3.4.5 NNumber oof hholiday ttrips ((at lleast 11 oovernight sstay) bby rresidents aaged 115 aand oover, bby ddestination ((in 11 0000)
Tourism MMarket
38
EU-227 EU-225 BE1 BG CZ DK2 DE EE IE EL ES3 FR IT CY LV LT LU HU
Total ttrips 2000 : : 9 256 : : 7 789 127 979 : 5 019 6 359 120 480 157 176 64 519 : : : 820 :
2004 : : 11 162 : 27 769 7 072 137 849 1 050 7 780 11 295 109 580 183 249 68 638 : : 3 115 1 125 17 267
2005 : : 11 929 : 28 335 8 227 156 157 1 093 7 685 13 322 125 021 185 810 76 342 : 4 528 3 271 1 202 22 799
2006 : : 9 836 : 26 755 10 631 153 276 864 9 797 15 883 120 901 188 157 78 055 : 4 701 3 476 1 099 24 684
Average aannual ggrowth rrate ((%), 22000/20064
: : 1.22 : -1.84 5.32 3.05 -9.29 18.20 16.48 0.06 3.04 3.23 : 3.82 5.64 5.00 19.56
Domestic ttrips 2000 : : 2 794 : : 4 500 53 587 : 3 178 5 898 116 737 140 645 54 448 : : : 10 :
2004 : : 3 847 : 22 666 3 382 65 516 876 4 145 10 401 105 539 163 576 57 154 : : 2 024 25 15 104
2005 : : 3 762 : 22 939 3 951 78 743 844 3 765 12 227 117 876 166 030 63 977 : 3 923 2 108 17 17 835
2006 : : 2 843 : 21 768 5 619 82 035 585 4 758 14 846 113 387 168 196 64 834 : 3 937 2 233 15 20 577
Average aannual ggrowth rrate ((%), 22000/20064
: : 0.35 : -2.00 3.77 7.36 -18.28 10.62 16.63 -0.48 3.03 2.95 : 0.36 5.04 6.99 16.72
Outbound ttrips2000 : : 6 462 : : 3 289 74 392 : 1 841 461 3 743 16 531 10 071 : : : 810 :
2004 : : 7 315 : 5 103 3 690 72 333 174 3 635 894 4 041 19 673 11 484 570 462 1 091 1 100 2 163
2005 : : 8 167 : 5 396 4 276 77 414 249 3 920 1 095 7 145 19 780 12 365 595 605 1 163 1 185 4 964
2006 : : 6 993 : 4 987 5 012 71 241 279 5 039 1 037 7 514 19 961 13 221 605 764 1 243 1 084 4 107
Average aannual ggrowth rrate ((%), 22000/20064
: : 1.59 -19.96 -1.14 7.27 -0.72 26.63 28.62 14.47 12.32 3.19 4.64 : 28.60 6.74 4.98 37.80
1) 2001 data used for 2000. 2) Change in methodology from 2006 onwards. 3) Change in methodology from 2005 onwards. 4) Average annual growth rate 2001/2006 for BE. Average annual growth rate2004/2006 for CZ, EE, LV (only "Outbound trips"), LT and HU. Growth rate 2005/2006 for LV ("Total trips" and "Domestic trips").

3.4.5 NNumber oof hholiday ttrips ((at lleast 11 oovernight sstay) bby rresidents aaged 115 aand oover, bby ddestination ((in 11 0000) ((continued)
Tourism MMarket39
MT NL AT PL PT RO SI SK FI SE UK HR MK1 TR IS LI NO CH
Total ttrips 2000 : 25 354 15 621 : 10 621 : : : 23 109 : 152 700 : : : : : : :
2004 : 28 712 13 202 40 288 10 816 : 3 982 6 370 28 124 : 122 975 : : : : : 16 430 :
2005 : 27 872 13 709 35 500 11 417 : 3 901 6 067 29 611 : : : : : : : 16 391 :
2006 : 28 265 15 771 38 283 10 265 6 892 4 765 6 420 28 161 : 112 695 : : : : : 17 312 :
Average aannual ggrowth rrate ((%), 22000/20062
: 1.83 0.16 -2.52 -0.57 : 9.39 0.39 5.07 : -4.94 : : : : : 2.65 :
Domestic ttrips 2000 : 13 388 8 722 : 9 774 : : : 18 332 : 106 100 : : : : : : :
2004 : 14 133 6 404 36 669 9 633 : 1 841 4 088 23 580 : 74 772 : : : : : 11 600 :
2005 : 13 579 7 145 30 920 10 130 : 1 780 3 848 25 073 : 77 132 : : : : : 11 744 :
2006 : 14 096 8 087 33 102 9 244 6 441 2 569 3 934 23 554 : 68 722 : : : : : 11 949 :
Average aannual ggrowth rrate ((%), 22000/20062
: 0.86 -1.25 -4.99 -0.92 : 18.13 -1.90 6.47 : -6.98 : : : : : 1.49 :
Outbound ttrips2000 : 11 966 6 899 : 847 : : : 4 777 : 46 600 : : : : : : :
2004 : 14 579 6 798 3 619 1 183 : 2 141 2 282 4 544 : 48 203 : : : : : 4 830 :
2005 : 14 293 6 564 4 580 1 287 : 2 121 2 219 4 538 : : : : : : : 4 647 :
2006 : 14 169 7 684 5 181 1 021 451 2 196 2 486 4 607 : 43 973 : : : : : 5 363 :
Average aannual ggrowth rrate ((%), 22000/20062
: 2.86 1.81 19.65 3.16 : 1.28 4.37 -0.90 : -0.96 : : : : : 5.37 :
1) Provisional code which does not prejudge in any way the definitive nomenclature for this country, which will be agreed following the conclusion of negotiations currently taking place on this subject at the UnitedNations. 2) Average annual growth rate 2004/2006 for PL, SI, SK and NO.

3.4.6 NNumber oof llong hholiday ttrips ((at lleast 44 nnights) bby rresidents aaged 115 aand oover, bby ddestination ((in 11 0000)
Tourism MMarket
40
EU-227 EU-225 BE BG CZ DK1 DE EE IE EL ES2 FR IT CY LV LT LU HU
Total ttrips 2000 : : 6 374 : : 4 556 105 650 : 2 765 4 753 27 988 75 752 35 457 : : : 570 :
2004 : : 6 983 : 9 583 4 430 103 947 247 3 937 7 023 23 762 81 072 37 137 719 : 927 681 5 457
2005 : : 7 715 : 9 941 5 064 113 686 318 4 298 8 634 38 394 84 224 40 057 : 760 1 079 725 7 115
2006 : : 6 647 : 8 934 5 896 105 431 279 4 790 8 578 39 599 83 137 41 135 : 909 1 090 679 6 711
Average aannual ggrowth rrate ((%), 22000/20063
: : 0.70 : -3.45 4.39 -0.03 6.28 9.59 10.34 5.95 1.56 2.51 : 19.61 8.44 2.96 10.90
Domestic ttrips 2000 : : 1 142 : : 1 406 35 898 : 1 104 4 330 25 108 63 025 27 382 : : : 2 :
2004 : : 1 478 : 5 552 1 368 37 388 125 1 078 6 227 20 942 67 216 27 905 231 : 360 5 3 976
2005 : : 1 549 : 5 567 1 532 45 933 160 1 075 7 639 33 260 69 721 29 745 : 389 381 4 4 112
2006 : : 1 265 : 4 985 1 842 40 453 91 1 084 7 632 34 110 69 386 31 030 : 429 411 2 4 288
Average aannual ggrowth rrate ((%), 22000/20063
: : 1.72 : -5.24 4.60 2.01 -14.68 -0.30 9.91 5.24 1.62 2.11 : 10.28 6.85 0.00 3.85
Outbound ttrips 2000 : : 5 232 : : 3 150 69 752 : 1 661 423 2 880 12 727 8 075 : : : 568 :
2004 : : 5 505 : 4 031 3 062 66 559 122 2 859 796 2 820 13 856 9 232 488 270 567 676 1 481
2005 : : 6 166 : 4 374 3 532 67 753 158 3 223 995 5 134 14 503 10 312 516 371 698 721 3 003
2006 : : 5 382 : 3 949 4 054 64 978 188 3 706 946 5 489 13 751 10 105 533 480 679 677 2 423
Average aannual ggrowth rrate ((%), 22000/20063
: : 0.47 : -1.02 4.29 -1.17 24.14 14.31 14.36 11.35 1.30 3.81 4.51 33.33 9.43 2.97 27.91
1) Change in methodology from 2006 onwards. 2) Change in methodology from 2005 onwards. 3) Average annual growth rate 2004/2006 for CZ, EE, CY (only "Outbound trips"), LV (only "Outbound trips"), LTand HU. Growth rate 2005/2006 for LV ("Total trips" and "Domestic trips").
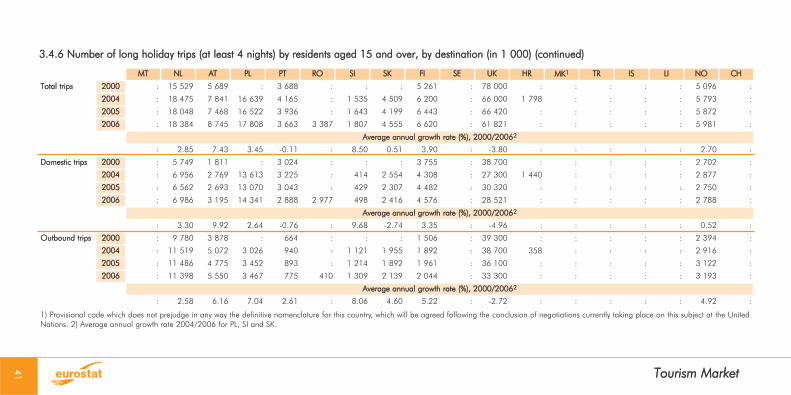
3.4.6 NNumber oof llong hholiday ttrips ((at lleast 44 nnights) bby rresidents aaged 115 aand oover, bby ddestination ((in 11 0000) ((continued)
Tourism MMarket41
MT NL AT PL PT RO SI SK FI SE UK HR MK1 TR IS LI NO CH
Total ttrips 2000 : 15 529 5 689 : 3 688 : : : 5 261 : 78 000 : : : : : 5 096 :
2004 : 18 475 7 841 16 639 4 165 : 1 535 4 509 6 200 : 66 000 1 798 : : : : 5 793 :
2005 : 18 048 7 468 16 522 3 936 : 1 643 4 199 6 443 : 66 420 : : : : : 5 872 :
2006 : 18 384 8 745 17 808 3 663 3 387 1 807 4 555 6 620 : 61 821 : : : : : 5 981 :
Average aannual ggrowth rrate ((%), 22000/20062
: 2.85 7.43 3.45 -0.11 : 8.50 0.51 3.90 : -3.80 : : : : : 2.70 :
Domestic ttrips 2000 : 5 749 1 811 : 3 024 : : : 3 755 : 38 700 : : : : : 2 702 :
2004 : 6 956 2 769 13 613 3 225 : 414 2 554 4 308 : 27 300 1 440 : : : : 2 877 :
2005 : 6 562 2 693 13 070 3 043 : 429 2 307 4 482 : 30 320 : : : : : 2 750 :
2006 : 6 986 3 195 14 341 2 888 2 977 498 2 416 4 576 : 28 521 : : : : : 2 788 :
Average aannual ggrowth rrate ((%), 22000/20062
: 3.30 9.92 2.64 -0.76 : 9.68 -2.74 3.35 : -4.96 : : : : : 0.52 :
Outbound ttrips 2000 : 9 780 3 878 : 664 : : : 1 506 : 39 300 : : : : : 2 394 :
2004 : 11 519 5 072 3 026 940 : 1 121 1 955 1 892 : 38 700 358 : : : : 2 916 :
2005 : 11 486 4 775 3 452 893 : 1 214 1 892 1 961 : 36 100 : : : : : 3 122 :
2006 : 11 398 5 550 3 467 775 410 1 309 2 139 2 044 : 33 300 : : : : : 3 193 :
Average aannual ggrowth rrate ((%), 22000/20062
: 2.58 6.16 7.04 2.61 : 8.06 4.60 5.22 : -2.72 : : : : : 4.92 :
1) Provisional code which does not prejudge in any way the definitive nomenclature for this country, which will be agreed following the conclusion of negotiations currently taking place on this subject at the UnitedNations. 2) Average annual growth rate 2004/2006 for PL, SI and SK.

3.4.7 SShare oof sshort hholiday ttrips iin tthe ttotal nnumber oof hholiday ttrips bby rresidents aaged 115 aand oover, 220061
Tourism MMarket
42
1) EU-27 and EU-25 excluding CY, MT and SE. EU-27 excluding BG.For MK: Provisional code which does not prejudge in any way the definitive nomenclature for this country, which will be agreed following the conclusion of negotiations currently taking place on this subjectat the United Nations.

3.4.8 SShare oof ddomestic ttrips iin tthe ttotal nnumber oof llong hholiday ttrips ((at lleast 44 nnights) bby rresidents aaged 115 aand oover, 220061
Tourism MMarket43
1) EU-27 and EU-25 excluding CY, MT and SE. EU-27 excluding BG. 2004 data for HR.For MK: Provisional code which does not prejudge in any way the definitive nomenclature for this country, which will be agreed following the conclusion of negotiations currently taking place on this subjectat the United Nations.

3.4.9 SShare oof nnights sspent iin pprivate aaccommodation iin tthe ttotal nnumber oof nnights sspent oon llong hholiday ttrips ((at lleast 44 nnights) iin tthe ccountry aand aabroad bbyresidents aaged 115 aand oover, 220061
Tourism MMarket
44
1) EU-27 and EU-25 excluding CY, MT and SE. EU-27 excluding BG. 2005 data for IT and HU.For MK: Provisional code which does not prejudge in any way the definitive nomenclature for this country, which will be agreed following the conclusion of negotiations currently taking place on this subjectat the United Nations.

Chapter 44 - CCountry PProfiles
4
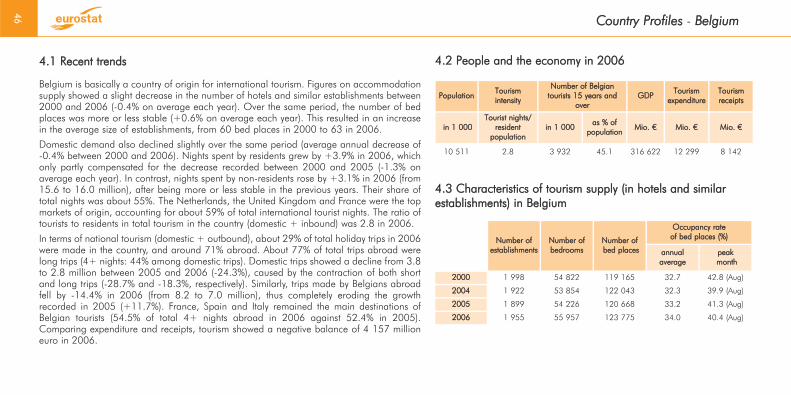
4.1 RRecent ttrends 4.2 PPeople aand tthe eeconomy iin 22006
Country PProfiles - BBelgium
46
Belgium is basically a country of origin for international tourism. Figures on accommodationsupply showed a slight decrease in the number of hotels and similar establishments between2000 and 2006 (-0.4% on average each year). Over the same period, the number of bedplaces was more or less stable (+0.6% on average each year). This resulted in an increasein the average size of establishments, from 60 bed places in 2000 to 63 in 2006.
Domestic demand also declined slightly over the same period (average annual decrease of-0.4% between 2000 and 2006). Nights spent by residents grew by +3.9% in 2006, whichonly partly compensated for the decrease recorded between 2000 and 2005 (-1.3% onaverage each year). In contrast, nights spent by non-residents rose by +3.1% in 2006 (from15.6 to 16.0 million), after being more or less stable in the previous years. Their share oftotal nights was about 55%. The Netherlands, the United Kingdom and France were the topmarkets of origin, accounting for about 59% of total international tourist nights. The ratio oftourists to residents in total tourism in the country (domestic + inbound) was 2.8 in 2006.
In terms of national tourism (domestic + outbound), about 29% of total holiday trips in 2006were made in the country, and around 71% abroad. About 77% of total trips abroad werelong trips (4+ nights: 44% among domestic trips). Domestic trips showed a decline from 3.8to 2.8 million between 2005 and 2006 (-24.3%), caused by the contraction of both shortand long trips (-28.7% and -18.3%, respectively). Similarly, trips made by Belgians abroadfell by -14.4% in 2006 (from 8.2 to 7.0 million), thus completely eroding the growthrecorded in 2005 (+11.7%). France, Spain and Italy remained the main destinations ofBelgian tourists (54.5% of total 4+ nights abroad in 2006 against 52.4% in 2005).Comparing expenditure and receipts, tourism showed a negative balance of 4 157 millioneuro in 2006.
4.3 CCharacteristics oof ttourism ssupply ((in hhotels aand ssimilarestablishments) iin BBelgium
PopulationTourism intensity
Number oof BBelgiantourists 115 yyears aand
overGDP
Tourismexpenditure
Tourismreceipts
in 11 0000Tourist nnights/
residentpopulation
in 11 0000as %% oof
populationMio. €€ Mio. €€ Mio. €€
10 511 2.8 3 932 45.1 316 622 12 299 8 142
Number oofestablishments
Number oofbedrooms
Number oofbed pplaces
Occupancy rrate of bbed pplaces ((%)
annualaverage
peakmonth
2000 1 998 54 822 119 165 32.7 42.8 (Aug)
2004 1 922 53 854 122 043 32.3 39.9 (Aug)
2005 1 899 54 226 120 668 33.2 41.3 (Aug)
2006 1 955 55 957 123 775 34.0 40.4 (Aug)

Country PProfiles - BBelgium
47
4.4 CCharacteristics oof ttourism ddemand iin BBelgium ((domestic aand iinbound)
4.5 CCharacteristics oof BBelgian ttourists aaged 115 aand oover ((domestic aand aabroad)
Nights sspent iin ccollective aaccommodation Nights sspent bby nnon-rresidents, bby mmain ccountries oof oorigin(as %% oof aall nnights sspent bby nnon-rresidents iin ccollective aaccommodation)Total by rresidents by nnon-rresidents
in 11 0000 in 11 0000 as %% oof ttotal in 11 0000 as %% oof ttotal 1st mmarket 2nd mmarket 3rd mmarket Share oof ttop 33
2000 29 215 13 689 46.9 15 526 53.1 NL 31.1 UK 16.1 DE 14.9 62.1
2004 28 495 12 950 45.4 15 545 54.6 NL 32.0 UK 15.0 DE 12.7 59.7
2005 28 380 12 827 45.2 15 553 54.8 NL 31.7 UK 14.1 DE 12.6 58.4
2006 29 371 13 332 45.4 16 039 54.6 NL 32.1 UK 13.7 FR 12.9 58.7
Holiday ttrips bby rresident ttourists Holiday ttrips aabroad oof 44+ nnights ((in %%) bby mmain ccountries oof ddestination
Total ((domestic aand aabroad) Domestic Abroad
1st mmarket 2nd mmarket 3rd mmarketShare oof
top 33Total 1-33 nnights 4+ nnights Total 1-33 nnights1 4+ nnights Total 1-33 nnights1 4+ nnights
in 11 0000 in 11 0000 in 11 0000 in 11 0000 in 11 0000 in 11 0000 in 11 0000 in 11 0000 in 11 0000
2000 9 256 2 882 6 374 2 794 1 652 1 142 6 462 1 230 5 232 FR 33.1 ES 14.9 IT 7.9 55.9
2004 11 162 4 179 6 983 3 847 2 369 1 478 7 315 1 810 5 505 FR 31.0 ES 14.8 IT 8.1 53.9
2005 11 929 4 214 7 715 3 762 2 213 1 549 8 167 2 001 6 166 FR 30.8 ES 13.4 IT 8.2 52.4
2006 9 836 3 189 6 647 2 843 1 578 1 265 6 993 1 611 5 382 FR 30.4 ES 14.9 IT 9.2 54.5
1) 2001 data used for 2000.

4.1 RRecent ttrends 4.2 PPeople aand tthe eeconomy iin 22006
Country PProfiles - BBulgaria
48
Along with Romania, Bulgaria joined the EU in 2007 and is an emerging country of tourismorigin and destination. Accommodation supply recorded further growth in 2006, after aboom in the first five years of the 21st century. The number of establishments increased by+9.6% in 2006 and at an average rate of +13.7% each year from 2000 to 2005. Over thesame period, bed places rose by +10.6% on average each year and by +5.3% in 2006.Consequently, the average size of hotels and similar establishments decreased from 187 bedplaces in 2000 to 157 in 2006.
Like supply, tourism demand also grew rapidly over that period. Nights spent by residentsrecorded average growth of +8.1% each year (from 3.4 million in 2000 to 5.4 million in2006), while nights spent by international tourists rose by +15.0% on average each year(from 5.2 million in 2000 to 11.9 million in 2006). In 2006, foreign tourism accounted forabout 69% of total tourism nights in the country, against around 60% in 2000. Germany, theUnited Kingdom and Sweden were the top markets of origin, accounting for about 50% oftotal international tourism nights (about 56% in 2000). The ratio of tourists to residents ininternal tourism (domestic + inbound) was 2.2 in 2006.
Comparing expenditure and receipts, tourism presented a positive balance of 892 millioneuro in 2006.
4.3 CCharacteristics oof ttourism ssupply ((in hhotels aand ssimilarestablishments) iin BBulgaria
PopulationTourismintensity
Number oof BBulgariantourists 115 yyears aand
overGDP
Tourismexpenditure
Tourismreceipts
in 11 0000Tourist nnights/
residentpopulation
in 11 0000as %% oof
populationtotal
Mio. €€Mio. €€ Mio. €€
7 719 2.2 : : 25 100 1 171 2 063
Number oofestablishments
Number oofbedrooms
Number oofbed pplaces
Occupancy rrate of bbed pplaces ((%)
annualaverage
peakmonth
2000 648 : 121 222 18.4 :
2004 1 016 80 149 170 956 21.7 :
2005 1 230 90 593 200 940 21.0 50.7 (Jul-Sep)
2006 1 348 95 632 211 565 20.9 45.7 (Jul-Sep)

Country PProfiles - BBulgaria
49
4.4 CCharacteristics oof ttourism ddemand iin BBulgaria ((domestic aand iinbound)
4.5 CCharacteristics oof BBulgarian ttourists aaged 115 aand oover ((domestic aand aabroad)
Holiday ttrips bby rresident ttourists Holiday ttrips aabroad oof 44+ nnights ((in %%) bby mmain ccountries oof ddestination
Total ((domestic aand aabroad) Domestic Abroad
1st mmarket 2nd mmarket 3rd mmarketShare oof
top 33Total 1-33 nnights 4+ nnights Total 1-33 nnights 4+ nnights Total 1-33 nnights 4+ nnights
in 11 0000 in 11 0000 in 11 0000 in 11 0000 in 11 0000 in 11 0000 in 11 0000 in 11 0000 in 11 0000
2000 : : : : : : : : : : : : : : : :
2004 : : : : : : : : : : : : : : : :
2005 : : : : : : : : : : : : : : : :
2006 : : : : : : : : : : : : : : : :
Nights sspent iin ccollective aaccommodation Nights sspent bby nnon-rresidents, bby mmain ccountries oof oorigin(as %% oof aall nnights sspent bby nnon-rresidents iin ccollective aaccommodation)Total by rresidents by nnon-rresidents
in 11 0000 in 11 0000 as %% oof ttotal in 11 0000 as %% oof ttotal 1st mmarket 2nd mmarket 3rd mmarket Share oof ttop 33
2000 8 554 3 384 39.6 5 170 60.4 DE1 44.7 UK1 6.3 CH1 4.8 55.8
2004 14 161 3 857 27.2 10 304 72.8 DE 40.8 UK 14.8 SE 4.0 59.6
2005 16 071 4 447 27.7 11 624 72.3 DE 34.7 UK 16.4 SE 4.0 55.1
2006 17 356 5 411 31.2 11 945 68.8 DE 30.7 UK 15.0 SE 3.8 49.5
1) 2001 data for 2000.

4.1 RRecent ttrends 4.2 PPeople aand tthe eeconomy iin 22006
Country PProfiles - CCzech RRepublic
50
The Czech Republic is an emerging destination for international tourism in Europe.Accommodation supply has shown good results since 2000. Establishments grew by +2.1%on average between 2000 and 2004, recorded a slight decrease in 2005 (-0.8%), but madeup for this in full in 2006 (+0.8%). Over the same six years, bed places revealed an averageannual increase of +1.4%. Consequently, the average size of hotels remained relativelystable, at around 55 bed places.
As regards tourism demand, domestic nights grew by +3.0% in 2006, partly making up forthe decline recorded from 2000 to 2005 (-6.2% on average each year). Conversely, nightsspent by non-residents continued to increase (+4.7% on average each year between 2000and 2005, +2.5% in 2006), and made for about 49% of total nights in 2006 (35.3% in2000). Germany, the United Kingdom and Italy were the top markets of origin, accountingfor about 43% of total international tourist nights. The ratio of tourists to residents in totaltourism in the country (domestic + inbound) was 4.0 in 2006.
Czech tourists themselves still make more than 81% of total holiday trips in the country. In2006, domestic trips showed a decline of -5.1%, after an increase of +1.2% in 2005,caused by a contraction of both 1-3 night and 4+ night trips (-3.4% and -10.4%,respectively). In the same year, trips abroad also fell, by -7.6%, mainly due to a slump in longtrips (-9.7%), representing about 80% of total trips abroad. Slovakia, Italy and Greece werethe preferred destinations of Czech tourists (about 34% of 4+ night trips abroad in 2006),with Greece overtaking Austria in 2005.
Comparing expenditure and receipts, tourism showed a positive balance of 1 874 millioneuro in 2006.
4.3 CCharacteristics oof ttourism ssupply ((in hhotels aand ssimilarestablishments) iin tthe CCzech RRepublic
PopulationTourism intensity
Number oof CCzech ttourists15 yyears aand oover
GDPTourism
expenditureTourismreceipts
in 11 0000Tourist nnights/
residentpopulation
in 11 0000as %% oof
populationMio. €€ Mio. €€ Mio. €€
10 251 4.0 4 515 51.6 114 021 2 119 3 993
Number oofestablishments
Number oofbedrooms
Number oofbed pplaces
Occupancy rrate of bbed pplaces ((%)
annualaverage
peakmonth
2000 3 960 95 365 217 664 32.2 :
2004 4 311 98 764 229 689 29.7 44.0 (Aug)
2005 4 278 99 916 232 211 29.7 43.7 (Aug)
2006 4 314 101 563 236 104 30.0 42.9 (Aug)

Country PProfiles - CCzech RRepublic
51
4.4 CCharacteristics oof ttourism ddemand iin tthe CCzech RRepublic ((domestic aand iinbound)
4.5 CCharacteristics oof CCzech ttourists aaged 115 aand oover ((domestic aand aabroad)
Nights sspent iin ccollective aaccommodation Nights sspent bby nnon-rresidents, bby mmain ccountries oof oorigin(as %% oof aall nnights sspent bby nnon-rresidents iin ccollective aaccommodation)Total by rresidents by nnon-rresidents
in 11 0000 in 11 0000 as %% oof ttotal in 11 0000 as %% oof ttotal 1st mmarket 2nd mmarket 3rd mmarket Share oof ttop 33
2000 44 200 28 603 64.7 15 597 35.3 : : : : : : :
2004 40 780 21 800 53.5 18 980 46.5 DE 31.1 UK 9.6 IT 6.1 46.8
2005 40 320 20 725 51.4 19 595 48.6 DE 30.0 UK 9.2 IT 6.0 45.2
2006 41 447 21 357 51.5 20 090 48.5 DE 30.1 UK 7.6 IT 5.7 43.4
Holiday ttrips bby rresident ttourists Holiday ttrips aabroad oof 44+ nnights ((in %%) bby mmain ccountries oof ddestination
Total ((domestic aand aabroad) Domestic Abroad
1st mmarket 2nd mmarket 3rd mmarketShare oof
top 33Total 1-33 nnights 4+ nnights Total 1-33 nnights 4+ nnights Total 1-33 nnights 4+ nnights
in 11 0000 in 11 0000 in 11 0000 in 11 0000 in 11 0000 in 11 0000 in 11 0000 in 11 0000 in 11 0000
2000 : : : : : : : : : : : : : : : :
2004 27 769 18 186 9 583 22 666 17 114 5 552 5 103 1 072 4 031 SK 12.4 IT 10.8 AT 6.8 30.0
2005 28 335 18 394 9 941 22 939 17 372 5 567 5 396 1 022 4 374 SK 18.2 IT 12.9 EL 6.6 37.7
2006 26 755 17 821 8 934 21 768 16 783 4 985 4 987 1 038 3 949 SK 14.3 IT 11.9 EL 7.5 33.7

4.1 RRecent ttrends 4.2 PPeople aand tthe eeconomy iin 22006
Country PProfiles - DDenmark
52
Denmark is more of a generator of outbound tourism than an international tourismdestination. In 2006, accommodation supply displayed a decrease in the number of hotelsand similar establishments (-1.9%), after slight growth between 2000 and 2005 (+0.4% onaverage each year). In the same period, bed places recorded steady expansion: +2.2% onaverage each year between 2000 and 2005 and +1.0% in 2006. This meant an increasein the average size of establishments: from 133 bed places in 2000 to 150 in 2006. Tourism in the country increased significantly in 2006 (+4.0% in terms of nights), after anaverage annual increase of +0.8% between 2000 and 2005. This data hid a different trendfor domestic and international tourism. Nights spent by residents (about 65% of total nights)rose by +5.6% in 2006 and by +2.2% on average in the first five years of the 21st century.In contrast, nights spent by non-residents declined between 2000 and 2005 (-1.3% onaverage each year), but recovered in part in 2006 (+1.0%). Germany, Norway and Swedenwere the top markets of origin, accounting for about 62% of international tourist nights(about 69% in 2000). The ratio of tourists to residents in total tourism in the country (domestic+ inbound) was 5.0 in 2006. In terms of national tourism, domestic holiday trips in 2006 accounted for about 53% of totaltrips made by Danish tourists, against nearly 58% in 2000. Trips in the country showed aboom in 2005 (+16.8%) and above all in 2006 (+42.2% – this increase is also influencedby a methodological change in data collection), following the downturn between 2000 and2004 (-6.9% on average each year). Conversely, outbound tourism showed steady growthbetween 2000 and 2006 (+7.3% on average each year), with peaks in 2005 and 2006(+15.9% and +17.2%, respectively). Spain, France and Italy were the main destinations ofDanish tourists (about 30% of 4+ night trips abroad in 2006), with Spain overtaking Francein 2005. Comparing expenditure and receipts, tourism presented a negative balance of1 456 million euro in 2006.
4.3 CCharacteristics oof ttourism ssupply ((in hhotels aand ssimilarestablishments) iin DDenmark
PopulationTourismintensity
Number oof DDanishtourists 115 yyears aand
overGDP
Tourismexpenditure
Tourismreceipts
in 11 0000Tourist nnights/
residentpopulation
in 11 0000as %% oof
populationMio. €€ Mio. €€ Mio. €€
5 427 5.0 2 839 64.4 220 163 5 908 4 452
Number oofestablishments
Number oofbedrooms
Number oofbed pplaces
Occupancy rrate of bbed pplaces ((%)
annualaverage
peakmonth
2000 472 32 014 62 905 40.1 71.2 (Jul)
2004 485 35 671 70 293 37.8 65.2 (Jul)
2005 482 35 718 70 049 39.5 65.0 (Jul)
2006 473 36 049 70 769 41.2 66.0 (Jul)

Country PProfiles - DDenmark
53
4.4 CCharacteristics oof ttourism ddemand iin DDenmark ((domestic aand iinbound)
4.5 CCharacteristics oof DDanish ttourists aaged 115 aand oover ((domestic aand aabroad)
Nights sspent iin ccollective aaccommodation Nights sspent bby nnon-rresidents, bby mmain ccountries oof oorigin(as %% oof aall nnights sspent bby nnon-rresidents iin ccollective aaccommodation)Total by rresidents by nnon-rresidents
in 11 0000 in 11 0000 as %% oof ttotal in 11 0000 as %% oof ttotal 1st mmarket 2nd mmarket 3rd mmarket Share oof ttop 33
2000 25 165 15 159 60.2 10 006 39.8 DE 34.0 SE 20.8 NO 13.8 68.6
2004 26 119 16 553 63.4 9 566 36.6 DE 30.5 SE 17.5 NO 15.8 63.8
2005 26 228 16 872 64.3 9 356 35.7 DE 29.7 SE 16.6 NO 16.4 62.7
2006 27 267 17 814 65.3 9 453 34.7 DE 28.4 NO 16.7 SE 16.4 61.5
Holiday ttrips bby rresident ttourists Holiday ttrips aabroad oof 44+ nnights ((in %%) bby mmain ccountries oof ddestination
Total ((domestic aand aabroad) Domestic Abroad
1st mmarket 2nd mmarket 3rd mmarketShare oof
top 33Total 1-33 nnights 4+ nnights Total 1-33 nnights 4+ nnights Total 1-33 nnights 4+ nnights
in 11 0000 in 11 0000 in 11 0000 in 11 0000 in 11 0000 in 11 0000 in 11 0000 in 11 0000 in 11 0000
2000 7 789 3 233 4 556 4 500 3 094 1 406 3 289 139 3 150 FR 13.1 ES 13.1 EL 8.5 34.7
2004 7 072 2 642 4 430 3 382 2 014 1 368 3 690 628 3 062 FR 13.5 ES 11.6 IT 8.6 33.7
2005 8 227 3 163 5 064 3 951 2 419 1 532 4 276 744 3 532 ES 12.8 FR 10.2 IT 7.7 30.7
2006 10 631 4 735 5 896 5 619 3 777 1 842 5 012 958 4 054 ES 11.9 FR 9.4 IT 8.9 30.2

4.1 RRecent ttrends 4.2 PPeople aand tthe eeconomy iin 22006
Country PProfiles - GGermany
54
Germany is one of the main generators of international tourism at world level. The trend inaccommodation supply between 2000 and 2006 showed a small average annual decreaseof -1.0% in the number of hotels and similar establishments and little increase in the numberof bed places (+0.4%), which resulted in a small increase in the average size perestablishment (41 bed places in 2000, as against 45 in 2006).
Tourism demand in the country showed steady growth in the same period, with a peakbetween 2000 and 2004 (+3.2% on average each year). In 2005 and 2006, the increasewas +1.5% and +2.1%, respectively. Nights spent by residents, accounting for about 85%of total nights, rose by +0.8% both in 2005 and in 2006, after expansion of +3.5% onaverage each year between 2000 and 2004. Nights spent by non-residents have recordeda steady increase since 2000 (+3.8% on average each year), with a peak of +9.7% from2005 to 2006. The Netherlands, the United States and the United Kingdom were the topmarkets of origin, accounting for 34.0% of total international tourist nights in 2006. The ratioof tourists to residents in total tourism in the country (domestic + inbound) was 4.3 in 2006.
In terms of national tourism (domestic + outbound), German tourists made 153.3 millionholiday trips in 2006, about 54% of them in the country. Domestic trips expanded during theinitial years of the 21st century, in particular between 2004 and 2005 (from 65.5 to 78.7million, +20.2%), followed by further growth in 2006 (+4.2%). Outbound trips recorded aslight decline from 2000 to 2004 (-0.7% on average each year), followed by a strongrecovery in 2005 (+7.0%) and a new fall in 2006 (-8.0%). Spain, Italy and Austria were themain destinations for long trips (46.2% of 4+ night trips abroad). Comparing expenditureand receipts, tourism presented a negative balance of 32 803 million euro in 2005.
4.3 CCharacteristics oof ttourism ssupply ((in hhotels aand ssimilarestablishments) iin GGermany
PopulationTourism intensity
Number oof GGermantourists 115 yyears aand
overGDP
Tourismexpenditure
Tourismreceipts
in 11 0000Tourist nnights/
residentpopulation
in 11 0000as %% oof
populationMio. €€ Mio. €€ Mio. €€
82 438 4.3 57 111 80.7 2 322 200 58 894 26 091
Number oofestablishments
Number oofbedrooms
Number oofbed pplaces
Occupancy rrate of bbed pplaces ((%)
annualaverage
peakmonth
2000 38 551 877 070 1 590 332 34.1 45.1 (Sep)
2004 36 839 888 672 1 609 027 33.2 42.6 (Sep)
2005 36 593 890 153 1 621 118 33.9 43.1 (Sep)
2006 36 201 896 980 1 631 530 35.0 44.9 (Sep)

Country PProfiles - GGermany
55
4.4 CCharacteristics oof ttourism ddemand iin GGermany ((domestic aand iinbound)
4.5 CCharacteristics oof GGerman ttourists aaged 115 aand oover ((domestic aand aabroad)
Nights sspent iin ccollective aaccommodation Nights sspent bby nnon-rresidents, bby mmain ccountries oof oorigin(as %% oof aall nnights sspent bby nnon-rresidents iin ccollective aaccommodation)Total by rresidents by nnon-rresidents
in 11 0000 in 11 0000 as %% oof ttotal in 11 0000 as %% oof ttotal 1st mmarket 2nd mmarket 3rd mmarket Share oof ttop 33
2000 298 488 256 068 85.8 42 420 14.2 NL 17.3 US 11.9 UK 9.6 38.8
2004 338 769 293 395 86.6 45 374 13.4 NL 17.7 US 9.5 UK 8.3 35.5
2005 343 981 295 735 86.0 48 246 14.0 NL 17.5 US 9.2 UK 8.2 34.9
2006 351 224 298 277 84.9 52 947 15.1 NL 16.6 US 8.8 UK 8.6 34.0
Holiday ttrips bby rresident ttourists Holiday ttrips aabroad oof 44+ nnights ((in %%) bby mmain ccountries oof ddestination
Total ((domestic aand aabroad) Domestic Abroad
1st mmarket 2nd mmarket 3rd mmarketShare oof
top 33Total 1-33 nnights 4+ nnights Total 1-33 nnights 4+ nnights Total 1-33 nnights 4+ nnights
in 11 0000 in 11 0000 in 11 0000 in 11 0000 in 11 0000 in 11 0000 in 11 0000 in 11 0000 in 11 0000
2000 127 979 22 329 105 650 53 587 17 689 35 898 74 392 4 640 69 752 ES 19.2 IT 13.6 AT 12.5 45.3
2004 137 849 33 902 103 947 65 516 28 128 37 388 72 333 5 774 66 559 ES 15.2 IT 14.3 AT 14.0 43.5
2005 156 157 42 471 113 686 78 743 32 810 45 933 77 414 9 661 67 753 ES 15.9 IT 14.4 AT 14.4 44.7
2006 153 276 47 845 105 431 82 035 41 582 40 453 71 241 6 263 64 978 ES 15.7 IT 15.5 AT 15.0 46.2

4.1 RRecent ttrends 4.2 PPeople aand tthe eeconomy iin 22006
Country PProfiles - EEstonia
56
Estonia, one of the new Member States, is an emerging country of origin and destination oftourism in Europe. The 2006 figures for accommodation supply revealed a further increasein both the number of establishments and bed places (+7.6% and +3.3%, respectively),consolidating the boom of the previous year (+18.7% and +11.3%, respectively). The highergrowth of establishments explains the decline in the average size of hotels in comparison to2005 (from 80 to 76). This is in contrast with the development between 2000 and 2004,where the number of hotels decreased by -6.5% while bed places grew by +8.6% onaverage each year (85 bed places per hotel in 2004).
Like supply, tourism demand in Estonia has expanded at a steady rate in terms of nights sincethe country’s accession to the EU (2004). Total nights rose by +10.5% in 2006 (from 4.1 to4.5 million), after +9.4% in 2005. This growth was caused by both domestic andinternational tourists. Nights spent by residents (about 34% of total nights) grew by +34.9%in 2006, after +11.7% in 2005. In those same years, nights spent by non-residents rose by+1.3% and +8.6%, respectively. Finland, Sweden and Germany were the top markets oforigin, accounting for about 64% of total international tourist nights. Finland alone generatesabout 50% of total nights. The ratio of tourists to residents in total tourism in the country(domestic + inbound) was 3.4 in 2006.
In terms of tourist trips made by Estonians in the country and abroad, domestic holiday trips,which make up about 68% of total trips, fell by -30.7% in 2006 (from 844 000 to 585 000),after a decline of -3.6% in 2005. In contrast, trips abroad showed a further increase of+12.1% in 2006 (from 249 000 to 279 000), consolidating the boom recorded in 2005(+43.1%), as a consequence of entry to the EU. Comparing expenditure and receipts,tourism presented a positive balance of 340 million euro in 2006.
4.3 CCharacteristics oof ttourism ssupply ((in hhotels aand ssimilarestablishments) iin EEstonia
PopulationTourism intensity
Number oof EEstoniantourists 115 yyears aand
overGDP
Tourismexpenditure
Tourismreceipts
in 11 0000Tourist nnights/
residentpopulation
in 11 0000as %% oof
populationMio. €€ Mio. €€ Mio. €€
1 345 3.4 259 22.7 13 234 472 812
Number oofestablishments
Number oofbedrooms
Number oofbed pplaces
Occupancy rrate of bbed pplaces ((%)
annualaverage
peakmonth
2000 350 7 599 16 292 28.8 :
2004 267 11 314 22 673 39.8 70.0 (Jul)
2005 317 12 312 25 228 38.5 68.0 (Jul)
2006 341 12 826 26 058 39.5 63.0 (Jul)

Country PProfiles - EEstonia
4.4 CCharacteristics oof ttourism ddemand iin EEstonia ((domestic aand iinbound)
4.5 CCharacteristics oof EEstonian ttourists aaged 115 aand oover ((domestic aand aabroad)
57
Nights sspent iin ccollective aaccommodation Nights sspent bby nnon-rresidents, bby mmain ccountries oof oorigin(as %% oof aall nnights sspent bby nnon-rresidents iin ccollective aaccommodation)Total by rresidents by nnon-rresidents
in 11 0000 in 11 0000 as %% oof ttotal in 11 0000 as %% oof ttotal 1st mmarket 2nd mmarket 3rd mmarket Share oof ttop 33
2000 1 712 459 26.8 1 253 73.2 : : : : : : :
2004 3 758 1 011 26.9 2 747 73.1 FI 60.6 SE 6.7 DE 6.0 73.3
2005 4 111 1 129 27.5 2 982 72.5 FI 53.0 SE 7.9 DE 7.2 68.1
2006 4 543 1 523 33.5 3 020 66.5 FI 49.7 SE 7.8 DE 6.1 63.6
Holiday ttrips bby rresident ttourists Holiday ttrips aabroad oof 44+ nnights ((in %%) bby mmain ccountries oof ddestination
Total ((domestic aand aabroad) Domestic Abroad
1st mmarket 2nd mmarket 3rd mmarketShare oof
top 33Total 1-33 nnights 4+ nnights Total 1-33 nnights 4+ nnights Total 1-33 nnights 4+ nnights
in 11 0000 in 11 0000 in 11 0000 in 11 0000 in 11 0000 in 11 0000 in 11 0000 in 11 0000 in 11 0000
2000 : : : : : : : : : : : : : : : :
2004 1 050 803 247 876 751 125 174 52 122 : : : : : : :
2005 1 093 775 318 844 684 160 249 91 158 : : : : : : :
2006 864 585 279 585 494 91 279 91 188 : : : : : : :
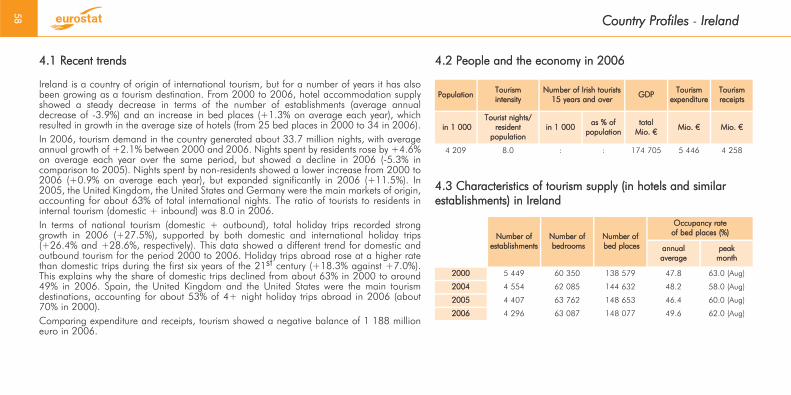
4.1 RRecent ttrends 4.2 PPeople aand tthe eeconomy iin 22006
Country PProfiles - IIreland
58
Ireland is a country of origin of international tourism, but for a number of years it has alsobeen growing as a tourism destination. From 2000 to 2006, hotel accommodation supplyshowed a steady decrease in terms of the number of establishments (average annualdecrease of -3.9%) and an increase in bed places (+1.3% on average each year), whichresulted in growth in the average size of hotels (from 25 bed places in 2000 to 34 in 2006).In 2006, tourism demand in the country generated about 33.7 million nights, with averageannual growth of +2.1% between 2000 and 2006. Nights spent by residents rose by +4.6%on average each year over the same period, but showed a decline in 2006 (-5.3% incomparison to 2005). Nights spent by non-residents showed a lower increase from 2000 to2006 (+0.9% on average each year), but expanded significantly in 2006 (+11.5%). In2005, the United Kingdom, the United States and Germany were the main markets of origin,accounting for about 63% of total international nights. The ratio of tourists to residents ininternal tourism (domestic + inbound) was 8.0 in 2006.In terms of national tourism (domestic + outbound), total holiday trips recorded stronggrowth in 2006 (+27.5%), supported by both domestic and international holiday trips(+26.4% and +28.6%, respectively). This data showed a different trend for domestic andoutbound tourism for the period 2000 to 2006. Holiday trips abroad rose at a higher ratethan domestic trips during the first six years of the 21st century (+18.3% against +7.0%).This explains why the share of domestic trips declined from about 63% in 2000 to around49% in 2006. Spain, the United Kingdom and the United States were the main tourismdestinations, accounting for about 53% of 4+ night holiday trips abroad in 2006 (about70% in 2000). Comparing expenditure and receipts, tourism showed a negative balance of 1 188 millioneuro in 2006.
4.3 CCharacteristics oof ttourism ssupply ((in hhotels aand ssimilarestablishments) iin IIreland
PopulationTourism intensity
Number oof IIrish ttourists15 yyears aand oover
GDPTourism
expenditureTourismreceipts
in 11 0000Tourist nnights/
residentpopulation
in 11 0000as %% oof
populationtotal
Mio. €€Mio. €€ Mio. €€
4 209 8.0 : : 174 705 5 446 4 258
Number oofestablishments
Number oofbedrooms
Number oofbed pplaces
Occupancy rrate of bbed pplaces ((%)
annualaverage
peakmonth
2000 5 449 60 350 138 579 47.8 63.0 (Aug)
2004 4 554 62 085 144 632 48.2 58.0 (Aug)
2005 4 407 63 762 148 653 46.4 60.0 (Aug)
2006 4 296 63 087 148 077 49.6 62.0 (Aug)
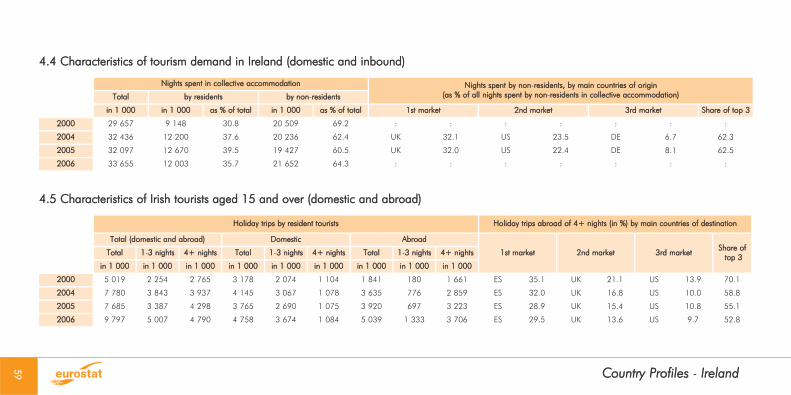
Country PProfiles - IIreland
59
4.4 CCharacteristics oof ttourism ddemand iin IIreland ((domestic aand iinbound)
4.5 CCharacteristics oof IIrish ttourists aaged 115 aand oover ((domestic aand aabroad)
Nights sspent iin ccollective aaccommodation Nights sspent bby nnon-rresidents, bby mmain ccountries oof oorigin(as %% oof aall nnights sspent bby nnon-rresidents iin ccollective aaccommodation)Total by rresidents by nnon-rresidents
in 11 0000 in 11 0000 as %% oof ttotal in 11 0000 as %% oof ttotal 1st mmarket 2nd mmarket 3rd mmarket Share oof ttop 33
2000 29 657 9 148 30.8 20 509 69.2 : : : : : : :
2004 32 436 12 200 37.6 20 236 62.4 UK 32.1 US 23.5 DE 6.7 62.3
2005 32 097 12 670 39.5 19 427 60.5 UK 32.0 US 22.4 DE 8.1 62.5
2006 33 655 12 003 35.7 21 652 64.3 : : : : : : :
Holiday ttrips bby rresident ttourists Holiday ttrips aabroad oof 44+ nnights ((in %%) bby mmain ccountries oof ddestination
Total ((domestic aand aabroad) Domestic Abroad
1st mmarket 2nd mmarket 3rd mmarketShare oof
top 33Total 1-33 nnights 4+ nnights Total 1-33 nnights 4+ nnights Total 1-33 nnights 4+ nnights
in 11 0000 in 11 0000 in 11 0000 in 11 0000 in 11 0000 in 11 0000 in 11 0000 in 11 0000 in 11 0000
2000 5 019 2 254 2 765 3 178 2 074 1 104 1 841 180 1 661 ES 35.1 UK 21.1 US 13.9 70.1
2004 7 780 3 843 3 937 4 145 3 067 1 078 3 635 776 2 859 ES 32.0 UK 16.8 US 10.0 58.8
2005 7 685 3 387 4 298 3 765 2 690 1 075 3 920 697 3 223 ES 28.9 UK 15.4 US 10.8 55.1
2006 9 797 5 007 4 790 4 758 3 674 1 084 5 039 1 333 3 706 ES 29.5 UK 13.6 US 9.7 52.8

4.1 RRecent ttrends 4.2 PPeople aand tthe eeconomy iin 22006
Country PProfiles - GGreece
60
Greece is one of the most popular tourism destinations in Europe. Hotel accommodationsupply has shown steady growth in the last six years. From 2000 to 2006, the number ofhotels grew by +1.5% on average each year (from 8 342 to 9 111), bed places by +2.2%(from 607 614 to 693 252). This means an increase in the average size of establishmentsfrom 73 in 2000 to 76 in 2006. Nights spent in collective accommodation recorded a decrease from 2000 to 2004 (the yearof the Olympics Games: -4.1% on average each year), followed by strong expansion from2004 to 2006 (+5.2% in 2005, +4.6% in 2006). This was mainly due to the trend ofinternational nights, accounting for about 74% of total nights spent in the country. Theseshowed an average annual fall of -4.7% between 2000 and 2004 and growth of +5.0%and +5.7% in 2005 and 2006, respectively. Domestic nights fared the same, but with lowergrowth in 2006 (+1.5%). Germany, the United Kingdom and Italy are the top markets oforigin, accounting for about 45% of total international tourist nights (around 54% in 2000).The ratio of tourists to residents in total tourism in the country (domestic + inbound) was 5.2in 2006. In terms of national tourism (domestic + outbound), Greek tourists made about 15.9 milliontrips in 2006, of which 93.5% in the country. Figures showed double-digit growth in bothdomestic and outbound trips from 2000 to 2005 (+15.7% and +18.9%, respectively, onaverage each year). Domestic trips recorded further expansion in 2006 (+21.4%), whileoutbound trips declined by -5.3%. Germany, Italy and the United Kingdom were thepreferred holiday destinations of Greeks (25.9% of total trips abroad). Comparingexpenditure and receipts, tourism presented a positive balance of 8 591 million euro in2005.
4.3 CCharacteristics oof ttourism ssupply ((in hhotels aand ssimilarestablishments) iin GGreece
PopulationTourism intensity
Number oof GGreektourists 115 yyears aand
overGDP
Tourismexpenditure1
Tourismreceipts1
in 11 0000Tourist nnights/
residentpopulation
in 11 0000as %% oof
populationMio. €€ Mio. €€ Mio. €€
11 125 5.2 4 179 43.8 213 985 2 446 11 037
1) 2005 data.
Number oofestablishments
Number oofbedrooms
Number oofbed pplaces
Occupancy rrate of bbed pplaces ((%)
annualaverage
peakmonth
2000 8 342 320 159 607 614 27.4 96.3 (Aug)
2004 8 899 351 891 668 271 21.2 80.8 (Aug)
2005 9 036 358 721 682 050 21.7 91.4 (Aug)
2006 9 111 364 179 693 252 22.4 89.9 (Aug)

Country PProfiles - GGreece
61
4.4 CCharacteristics oof ttourism ddemand iin GGreece ((domestic aand iinbound)
4.5 CCharacteristics oof GGreek ttourists aaged 115 aand oover ((domestic aand aabroad)
Nights sspent iin ccollective aaccommodation Nights sspent bby nnon-rresidents, bby mmain ccountries oof oorigin(as %% oof aall nnights sspent bby nnon-rresidents iin ccollective aaccommodation)Total by rresidents by nnon-rresidents
in 11 0000 in 11 0000 as %% oof ttotal in 11 0000 as %% oof ttotal 1st mmarket 2nd mmarket 3rd mmarket Share oof ttop 33
2000 62 186 15 162 24.4 47 024 75.6 DE 30.7 UK 17.6 IT 5.8 54.1
2004 52 554 13 758 26.2 38 796 73.8 DE 24.2 UK 19.4 IT 6.9 50.5
2005 55 264 14 530 26.3 40 734 73.7 DE 22.9 UK 18.8 IT 7.4 49.1
2006 57 796 14 741 25.5 43 055 74.5 DE 21.2 UK 16.7 IT 7.5 45.4
Holiday ttrips bby rresident ttourists Holiday ttrips aabroad oof 44+ nnights ((in %%) bby mmain ccountries oof ddestination
Total ((domestic aand aabroad) Domestic Abroad
1st mmarket 2nd mmarket 3rd mmarketShare oof
top 33Total 1-33 nnights 4+ nnights Total 1-33 nnights 4+ nnights Total 1-33 nnights 4+ nnights
in 11 0000 in 11 0000 in 11 0000 in 11 0000 in 11 0000 in 11 0000 in 11 0000 in 11 0000 in 11 0000
2000 6 359 1 606 4 753 5 898 1 568 4 330 461 38 423 DE 12.3 IT 8.5 UK 7.1 27.9
20041 11 295 4 272 7 023 10 401 4 174 6 227 894 98 796 IT 11.4 DE 9.7 UK 9.0 30.1
2005 13 322 4 688 8 634 12 227 4 588 7 639 1 095 100 995 IT 10.5 DE 9.9 FR 6.6 27.0
2006 15 883 7 305 8 578 14 846 7 214 7 632 1 037 91 946 DE 9.1 IT 8.4 UK 8.4 25.9
1) The break in series from 2004 onwards is due to a change in the methodology in 2004.

4.1 RRecent ttrends 4.2 PPeople aand tthe eeconomy iin 22006
Country PProfiles - SSpain
62
Spain is the most popular tourism destination in Europe, but in the last three years it has alsoincreased its role as an origin of outbound tourism. The 2006 figures showed further growthin the number of hotels and similar establishments (+4.0%), which was consistent with thetrend in previous years (+1.6% on average each year from 2000 to 2005). Bed placesfollowed the same trend but at a higher rate between 2000 and 2005 (+3.7% on averageeach year) and at a lower rate in 2006 (+2.2%). This meant an increase in the average sizeof establishments from 2000 to 2005 (from 81 to 90 bed places), followed by a slightdecrease in 2006 (88 bed places). In 2006, tourism demand revealed strong expansion in terms of nights (+7.3%), caused byboth domestic and international demand (+7.6% and +7.2%, respectively). Domestic nightsconsolidated the positive trend of previous years (+5.3% on average each year from 2000to 2005). Conversely, nights spent by non-residents showed a recovery after the declinerecorded from 2000 to 2004 (-2.8% on average each year). The United Kingdom, Germanyand France were the top markets of origin, accounting for about 64% of total internationaltourism nights. The ratio of tourists to residents in total tourism in the country (domestic +inbound) was 8.7 in 2005.In terms of national tourism (domestic + outbound), the change of methodology in thedemand-side survey in 2005 created a discontinuity in data, ruling out any comparison withprevious years. In 2006, Spanish tourists made about 120.9 million holiday trips (-3.3%compared to 2005). The decline is caused by the fall in the number of domestic trips (-3.8%)– especially 1-3 night trips – accounting for about 70% of total trips. Conversely, trips abroadrecorded an increase of +5.2%, supported by the growth in 4+ night trips (+6.9%),accounting for about 73% of total trips abroad. France, Portugal and Italy were the maintourism destinations, making for about 35% of total tourism trips abroad (around 43% in2000), with Portugal overtaking Italy in 2006. Comparing expenditures and receipts, tourismpresented a positive balance of 27 445 million euro in 2006.
4.3 CCharacteristics oof ttourism ssupply ((in hhotels aand ssimilarestablishments) iin SSpain
PopulationTourism intensity
Number oof SSpanishtourists 115 yyears aand
overGDP
Tourismexpenditure
Tourismreceipts
in 11 0000Tourist nnights/
residentpopulation
in 11 0000as %% oof
populationMio. €€ Mio. €€ Mio. €€
43 758 8.7 16 702 44.6 980 954 13 265 40 710
Number oofestablishments
Number oofbedrooms
Number oofbed pplaces
Occupancy rrate of bbed pplaces ((%)
annualaverage
peakmonth
2000 16 287 677 134 1 315 697 47.3 72.4 (Aug)
2004 17 402 766 952 1 511 592 42.5 71.4 (Aug)
2005 17 607 797 339 1 579 965 42.6 71.6 (Aug)
2006 18 304 814 890 1 614 545 45.3 72.3 (Aug)

Country PProfiles - SSpain
63
4.4 CCharacteristics oof ttourism ddemand iin SSpain ((domestic aand iinbound)
4.5 CCharacteristics oof SSpanish ttourists aaged 115 aand oover ((domestic aand aabroad)
Nights sspent iin ccollective aaccommodation Nights sspent bby nnon-rresidents, bby mmain ccountries oof oorigin(as %% oof aall nnights sspent bby nnon-rresidents iin ccollective aaccommodation)Total by rresidents by nnon-rresidents
in 11 0000 in 11 0000 as %% oof ttotal in 11 0000 as %% oof ttotal 1st mmarket 2nd mmarket 3rd mmarket Share oof ttop 33
2000 344 664 110 763 32.1 233 901 67.9 UK 31.3 DE 29.9 NL 6.2 67.4
2004 344 269 135 188 39.3 209 081 60.7 UK 34.3 DE 25.9 FR 6.1 66.3
2005 353 392 143 874 40.7 209 518 59.3 UK 33.0 DE 26.1 FR 6.4 65.5
2006 379 275 154 757 40.8 224 518 59.2 UK 31.1 DE 26.8 FR 6.2 64.1
Holiday ttrips bby rresident ttourists Holiday ttrips aabroad oof 44+ nnights ((in %%) bby mmain ccountries oof ddestination
Total ((domestic aand aabroad) Domestic Abroad
1st mmarket 2nd mmarket 3rd mmarketShare oof
top 33Total 1-33 nnights 4+ nnights Total 1-33 nnights 4+ nnights Total 1-33 nnights 4+ nnights
in 11 0000 in 11 0000 in 11 0000 in 11 0000 in 11 0000 in 11 0000 in 11 0000 in 11 0000 in 11 0000
2000 120 480 92 492 27 988 116 737 91 629 25 108 3 743 863 2 880 FR 21.7 IT 10.7 PT 10.3 42.7
2004 109 580 85 818 23 762 105 539 84 597 20 942 4 041 1 221 2 820 FR 18.6 PT 11.8 IT 9.2 39.6
2005 125 021 86 627 38 394 117 876 84 616 33 260 7 145 2 011 5 134 FR 17.1 IT 9.8 PT 8.8 35.7
2006 120 901 81 302 39 599 113 387 79 277 34 110 7 514 2 025 5 489 FR 16.2 PT 9.6 IT 9.3 35.1

4.1 RRecent ttrends 4.2 PPeople aand tthe eeconomy iin 22006
Country PProfiles - FFrance
64
France is both one of the prime tourism destinations in the world and a producer ofinternational tourism. Figures on hotel accommodation supply showed a small decrease inthe number of establishments (-0.6% an average each year), but a slight increase in thenumber of bed places (+0.5% on yearly average) between 2000 and 2006. Consequently,the number of bed places per establishment increased from 65 in 2000 to 69 in 2006.
Tourism in the country rose by +0.6% in 2006, consolidating the growth recorded in 2005(+4.4%). The figures illustrated a different trend for domestic and outbound tourism. Nightsspent by residents, accounting for about 64% of total nights, rose by +4.9% in 2005 and by+2.1% in 2006. In contrast, nights spent by non-residents decreased by -1.9% in 2006, aftera growth of +3.6% in 2005. The United Kingdom, the Netherlands and Germany were thetop markets of origin, accounting for about 50% of total international tourism nights in 2006.The ratio of tourists to residents in total tourism in the country (domestic + inbound) was 4.7in 2006.
In terms of national tourism, French tourists made 188.2 million trips in 2006, of which89.4% were made in their country. Domestic trips recorded an increase of +1.3% in 2006,after average annual expansion of +3.4% between 2000 and 2005. Outbound trips alsoincreased steadily (+0.9% in 2006 and +3.6% on average in the first five years of the 21stcentury). Spain, Italy and Greece were the main tourism destinations, accounting for about32% of 4+ night trips abroad in 2006 (30.5% in 2000).
Comparing expenditure and receipts, tourism presented a positive balance of 12 065 millioneuro in 2006.
4.3 CCharacteristics oof ttourism ssupply ((in hhotels aand ssimilarestablishments) iin FFrance
PopulationTourism intensity
Number oof FFrenchtourists 115 yyears aand
overGDP
Tourismexpenditure
Tourismreceipts
in 11 0000Tourist nnights/
residentpopulation
in 11 0000as %% oof
populationMio. €€ Mio. €€ Mio. €€
62 999 4.7 31 515 61.5 1 791 953 24 840 36 905
Number oofestablishments
Number oofbedrooms
Number oofbed pplaces
Occupancy rrate of bbed pplaces ((%)
annualaverage
peakmonth
2000 18 773 606 843 1 213 686 43.1 71.3 (Aug)
2004 18 689 633 162 1 266 325 40.8 58.6 (Aug)
2005 18 361 629 147 1 258 294 43.1 61.1 (Aug)
2006 18 135 626 981 1 253 962 43.1 59.3 (Sep)

Country PProfiles - FFrance
65
4.4 CCharacteristics oof ttourism ddemand iin FFrance ((domestic aand iinbound)
4.5 CCharacteristics oof FFrench ttourists aaged 115 aand oover ((domestic aand aabroad)
Nights sspent iin ccollective aaccommodation Nights sspent bby nnon-rresidents, bby mmain ccountries oof oorigin(as %% oof aall nnights sspent bby nnon-rresidents iin ccollective aaccommodation)Total by rresidents by nnon-rresidents
in 11 0000 in 11 0000 as %% oof ttotal in 11 0000 as %% oof ttotal 1st mmarket 2nd mmarket 3rd mmarket Share oof ttop 33
2000 284 646 174 982 64.5 109 664 38.5 UK 20.0 DE 13.5 NL 15.7 49.2
2004 283 018 178 840 63.2 104 178 36.8 UK 21.7 NL 16.9 DE 12.7 51.3
2005 295 594 187 642 63.5 107 952 36.5 UK 20.8 NL 16.2 DE 12.1 49.1
2006 297 481 191 616 64.4 105 865 35.6 UK 20.5 NL 17.5 DE 12.2 50.2
Holiday ttrips bby rresident ttourists Holiday ttrips aabroad oof 44+ nnights ((in %%) bby mmain ccountries oof ddestination
Total ((domestic aand aabroad) Domestic Abroad
1st mmarket 2nd mmarket 3rd mmarketShare oof
top 33Total 1-33 nnights 4+ nnights Total 1-33 nnights 4+ nnights Total 1-33 nnights 4+ nnights
in 11 0000 in 11 0000 in 11 0000 in 11 0000 in 11 0000 in 11 0000 in 11 0000 in 11 0000 in 11 0000
2000 157 176 81 424 75 752 140 645 77 620 63 025 16 531 3 804 12 727 ES 16.0 IT 9.8 US 4.7 30.5
2004 183 249 102 177 81 072 163 576 96 360 67 216 19 673 5 817 13 856 ES 15.0 IT 9.6 UK 4.0 28.6
2005 185 810 101 586 84 224 166 030 96 309 69 721 19 780 5 277 14 503 ES 14.9 IT 8.9 EL 3.7 27.5
2006 188 157 105 020 83 137 168 196 98 810 69 386 19 961 6 210 13 751 ES 16.3 IT 10.9 EL 4.6 31.8

4.1 RRecent ttrends 4.2 PPeople aand tthe eeconomy iin 22006
Country PProfiles - IItaly
66
Italy is one of the main tourism destinations in Europe, but its role as a country of origin ofinternational tourism has also been growing rapidly in recent years. Figures on hotelaccommodation supply showed a relatively stable number of establishments between 2000and 2006 and an increase in bed places (+2.0% on average each year). This resulted in ahigher average size of hotels and similar establishments: 56 bed places in 2000 and 62 in2006.In 2006, tourism demand in the country increased compared to 2000 (+1.3 on averageeach year). The biggest expansion was recorded between 2004 and 2006 (+3.0% onaverage each year) and was mainly driven by international tourism. Nights spent by residents(about 57% of total tourist nights) rose by +1.3% annually between 2004 and 2006, whilenights spent by non-residents by +5.4%, after an average annual increase of +0.7% forresidents and +0.1% for non-residents between 2000 and 2004. Germany, the UnitedKingdom and the United States were the main countries of origin, accounting for about 45%of total international nights in 2006 (about 51% in 2000). The ratio of tourists to residentsin total tourism in the country (domestic + inbound) was 6.2 in 2006. In terms of national tourism (domestic + outbound), Italian tourists made 78.1 millionholiday trips in 2006 (+1.2% compared to 2005), of which about 83% were in their owncountry. The number of trips made abroad increased during the first six years of the 21stcentury (average annual increase of +4.6% from 2000 to 2006), with a peak increase of+7.7% in 2005. Spain, France, and Greece were the main tourism destinations, with Spainovertaking France in 2006. They accounted for about 38% of total tourism trips abroad.Comparing expenditure and receipts, tourism showed a positive balance of 11 969 millioneuro in 2006.
4.3 CCharacteristics oof ttourism ssupply ((in hhotels aand ssimilarestablishments) iin IItaly
PopulationTourism intensity
Number oof IItaliantourists 115 yyears aand
overGDP
Tourismexpenditure
Tourismreceipts
in 11 0000Tourist nnights/
residentpopulation
in 11 0000as %% oof
populationMio. €€ Mio. €€ Mio. €€
58 752 6.2 24 782 49.1 1 475 401 18 366 30 335
Number oofestablishments
Number oofbedrooms
Number oofbed pplaces
Occupancy rrateof bbed pplaces ((%)
annualaverage
peakmonth
2000 33 361 966 138 1 854 101 34.5 69.8 (Aug)
2004 33 518 1 011 773 1 999 729 32.1 62.8 (Aug)
2005 33 527 1 020 478 2 028 452 32.5 62.7 (Aug)
2006 33 768 1 034 682 2 086 942 32.6 :

Country PProfiles - IItaly
67
4.4 CCharacteristics oof ttourism ddemand iin IItaly ((domestic aand iinbound)
4.5 CCharacteristics oof IItalian ttourists aaged 115 aand oover ((domestic aand aabroad)
Holiday ttrips bby rresident ttourists Holiday ttrips aabroad oof 44+ nnights ((in %%) bby mmain ccountries oof ddestination
Total ((domestic aand aabroad) Domestic Abroad
1st mmarket 2nd mmarket 3rd mmarketShare oof
top 33Total 1-33 nnights 4+ nnights Total 1-33 nnights 4+ nnights Total 1-33 nnights 4+ nnights
in 11 0000 in 11 0000 in 11 0000 in 11 0000 in 11 0000 in 11 0000 in 11 0000 in 11 0000 in 11 0000
2000 64 519 29 062 35 457 54 448 27 066 27 382 10 071 1 996 8 075 FR 14.7 ES 13.0 EL 6.6 34.3
2004 68 638 31 501 37 137 57 154 29 249 27 905 11 484 2 252 9 232 FR 13.6 ES 13.4 EL 7.2 34.2
2005 76 342 36 285 40 057 63 977 34 232 29 745 12 365 2 053 10 312 FR 15.8 ES 13.2 EL 8.2 37.2
2006 78 055 36 920 41 135 64 834 33 804 31 030 13 221 3 116 10 105 ES 15.9 FR 12.9 EL 9.5 38.3
Nights sspent iin ccollective aaccommodation Nights sspent bby nnon-rresidents, bby mmain ccountries oof oorigin(as %% oof aall nnights sspent bby nnon-rresidents iin ccollective aaccommodation)Total by rresidents by nnon-rresidents
in 11 0000 in 11 0000 as %% oof ttotal in 11 0000 as %% oof ttotal 1st mmarket 2nd mmarket 3rd mmarket Share oof ttop 33
2000 338 885 198 528 58.6 140 357 41.4 DE 37.3 UK 6.8 US 6.7 50.8
2004 345 616 204 447 59.2 141 169 40.8 DE 32.0 UK 8.1 US 7.4 47.5
2005 355 017 206 727 58.2 148 290 41.8 DE 30.0 UK 8.6 US 7.7 46.3
2006 366 764 209 903 57.2 156 861 42.8 DE 29.6 UK 8.1 US 7.7 45.4

4.1 RRecent ttrends 4.2 PPeople aand tthe eeconomy iin 22006
Country PProfiles - CCyprus
68
Cyprus is mainly a destination for international tourism. Hotel accommodation supply hasshown a decline in recent years. After average annual growth of +8.3% from 2000 to 2004,the number of establishments decreased by -3.2% on average each year between 2004 and2006 (from 803 to 753). Similarly, bed places recorded steady expansion from 2000 to2004 (+2.2% on average each year), followed by a decline from 2004 to 2006 (-1.5% onaverage each year, from 92 239 to 89 490). This meant a fall in the number of bed placesper establishment from 2000 to 2004 (from 145 to 115), followed by a slight recovery from2004 to 2006 (from 115 to 119). Tourism demand showed no clear trend over the same period. Domestic nights recordeddouble-digit growth from 2000 to 2004 (+15.7% on average each year), followed by a dropof -2.7% in 2005 and a rise in 2006 (+7.2%). Conversely, nights spent by non-residents(about 92% of total nights) showed a decline from 2000 to 2004 (-5.1% on average eachyear), followed by a recovery in 2005 (+2.7%) and a new fall in 2006 (-5.0%). The UnitedKingdom, Germany and Sweden were the main markets of origin, with the United Kingdomaccounting for more than 55% of total international tourist nights. The ratio of tourists toresidents in internal tourism (domestic + inbound) was very high in 2006: 18.8 tourists perresident.As regards outbound tourism, Cypriot tourists made 605 000 holiday trips abroad in 2006(+1.7% in comparison to 2005), of which about 88% were for 4 nights and more. Greece,the United Kingdom and France were the main destinations, Greece accounting for morethan 40% of total tourist trips abroad. Comparing expenditure and receipts, tourism presented a positive balance of 1 133 millioneuro in 2006.
4.3 CCharacteristics oof ttourism ssupply ((in hhotels aand ssimilarestablishments) iin CCyprus
PopulationTourism intensity
Number oof CChypriottourists 115 yyears aand
overGDP
Tourismexpenditure
Tourismreceipts
in 11 0000Tourist nnights/
residentpopulation
in 11 0000as %% oof
populationMio. €€ Mio. €€ Mio. €€
766 18.8 : : 14 631 780 1 913
Number oofestablishments
Number oofbedrooms
Number oofbed pplaces
Occupancy rrate of bbed pplaces ((%)
annualaverage
peakmonth
2000 583 44 464 84 479 56.4 :
2004 803 45 535 92 239 43.4 75.7 (Aug)
2005 785 45 209 91 264 44.8 85.4 (Aug)
2006 753 44 404 89 490 43.9 83.4 (Aug)

Country PProfiles - CCyprus
69
4.4 CCharacteristics oof ttourism ddemand iin CCyprus ((domestic aand iinbound)
4.5 CCharacteristics oof CChypriot ttourists aaged 115 aand oover ((domestic aand aabroad)
Nights sspent iin ccollective aaccommodation Nights sspent bby nnon-rresidents, bby mmain ccountries oof oorigin(as %% oof aall nnights sspent bby nnon-rresidents iin ccollective aaccommodation)Total by rresidents by nnon-rresidents
in 11 0000 in 11 0000 as %% oof ttotal in 11 0000 as %% oof ttotal 1st mmarket 2nd mmarket 3rd mmarket Share oof ttop 33
2000 17 419 603 3.5 16 816 96.5 UK 53.3 DE 12.2 SE 5.3 70.8
2004 14 718 1 081 7.3 13 637 92.7 UK 56.2 DE 9.5 SE 4.9 70.6
2005 15 058 1 052 7.0 14 006 93.0 UK 55.8 DE 10.5 SE 5.5 71.8
2006 14 438 1 128 7.8 13 310 92.2 UK 55.4 DE 8.9 SE 5.5 69.8
Holiday ttrips bby rresident ttourists Holiday ttrips aabroad oof 44+ nnights ((in %%) bby mmain ccountries oof ddestination
Total ((domestic aand aabroad) Domestic Abroad
1st mmarket 2nd mmarket 3rd mmarketShare oof
top 33Total 1-33 nnights 4+ nnights Total 1-33 nnights 4+ nnights Total 1-33 nnights 4+ nnights
in 11 0000 in 11 0000 in 11 0000 in 11 0000 in 11 0000 in 11 0000 in 11 0000 in 11 0000 in 11 0000
2000 : : : : : : : : : : : : : : : :
2004 : : 719 : : 231 570 82 488 EL 41.8 UK 14.6 FR 2.8 59.2
2005 : : : : : : 595 79 516 EL 40.9 UK 15.2 FR 2.7 58.8
2006 : : : : : : 605 72 533 EL 40.3 UK 20.4 FR 2.6 63.3

4.1 RRecent ttrends 4.2 PPeople aand tthe eeconomy iin 22006
Country PProfiles - LLatvia
70
Along with Estonia and Lithuania, Latvia is one of the new Member States which areemerging countries of origin and destination of international tourism in Europe.Accommodation supply expanded rapidly from 2000 to 2005, in terms of both the numberof establishments and the number of bed places (an average annual increase of +12.5%and +10.1%, respectively). This resulted in drop in the average size of establishments (from72 in 2000 to 61 in 2006). This indicator showed a new increase in 2006 (61 bed placesin 2006), while the decline in the number of establishments (-4.7%) was accompanied bygrowth in the number of bed places (+2.2%).Tourism demand in the country showed strong growth in the same period (+13.1% onaverage each year in terms of nights). Nights spent by residents grew by +7.9% on averageeach year between 2000 and 2006. But greater expansion was recorded for nights spent bynon-residents, which rose from 697 000 in 2000 to 1 872 000 in 2006 (+17.9% onaverage each year). Consequently, their share in total nights climbed from 47.0% to 60.1%.Germany, Finland and the United Kingdom were the main countries of origin, accounting forabout 32% of total international nights. The ratio of tourists to residents in internal tourism(domestic + inbound) was 1.4 in 2006.In terms of national tourism, Latvian tourists made 4.7 million trips in 2006 (+3.8% incomparison to 2005), of which about 84% were in their own country. The increase recordedfor total trips was generated by double-digit growth in outbound trips (+26.3%), whiledomestic trips were more or less stable. Germany, the United Kingdom and Sweden were themain tourism destinations, accounting for about 24% of 4+ night tourist trips abroad, withthe United Kingdom replacing Turkey in second position in 2006. Comparing expenditureand receipts, tourism showed a negative balance of 179 million euro in 2006.
4.3 CCharacteristics oof ttourism ssupply ((in hhotels aand ssimilarestablishments) iin LLatvia
PopulationTourism intensity
Number oof LLatviantourists 115 yyears aand
overGDP
Tourismexpenditure
Tourismreceipts
in 11 0000Tourist nnights/
residentpopulation
in 11 0000as %% oof
populationMio. €€ Mio. €€ Mio. €€
2 295 1.4 360 18.3 16 180 563 384
Number oofestablishments
Number oofbedrooms
Number oofbed pplaces
Occupancy rrate of bbed pplaces ((%)
annualaverage
peakmonth
2000 166 6 431 11 890 31.3 :
2004 278 8 826 17 933 28.6 47.4 (Jul)
2005 337 9 219 19 229 32.8 54.3 (Jul)
2006 321 9 706 19 650 36.3 59.5 (Aug)

Country PProfiles - LLatvia
71
4.4 CCharacteristics oof ttourism ddemand iin LLatvia ((domestic aand iinbound)
4.5 CCharacteristics oof LLatvian ttourists aaged 115 aand oover ((domestic aand aabroad)
Nights sspent iin ccollective aaccommodation Nights sspent bby nnon-rresidents, bby mmain ccountries oof oorigin(as %% oof aall nnights sspent bby nnon-rresidents iin ccollective aaccommodation)Total by rresidents by nnon-rresidents
in 11 0000 in 11 0000 as %% oof ttotal in 11 0000 as %% oof ttotal 1st mmarket 2nd mmarket 3rd mmarket Share oof ttop 33
2000 1 484 787 53.0 697 47.0 : : : : : : :
2004 2 066 865 51.9 1 201 58.1 DE 15.1 FI 10.4 UK 5.8 31.3
2005 2 635 1 022 38.8 1 613 61.2 DE 15.8 FI 11.0 UK 8.2 35.0
2006 3 113 1 241 39.9 1 872 60.1 DE 12.7 FI 10.0 UK 9.2 31.9
Holiday ttrips bby rresident ttourists Holiday ttrips aabroad oof 44+ nnights ((in %%) bby mmain ccountries oof ddestination
Total ((domestic aand aabroad) Domestic Abroad
1st mmarket 2nd mmarket 3rd mmarketShare oof
top 33Total 1-33 nnights 4+ nnights Total 1-33 nnights 4+ nnights Total 1-33 nnights 4+ nnights
in 11 0000 in 11 0000 in 11 0000 in 11 0000 in 11 0000 in 11 0000 in 11 0000 in 11 0000 in 11 0000
2000 : : : : : : : : : : : : : : : :
2004 : : : : : : 462 192 270 DE 8.6 SE 6.7 TR 6.0 21.3
2005 4 528 3 768 760 3 923 3 534 389 605 234 371 DE 10.4 TR 7.6 AT 5.7 23.7
2006 4 701 3 792 909 3 937 3 508 429 764 284 480 DE 11.1 UK 6.3 SE 6.2 23.6
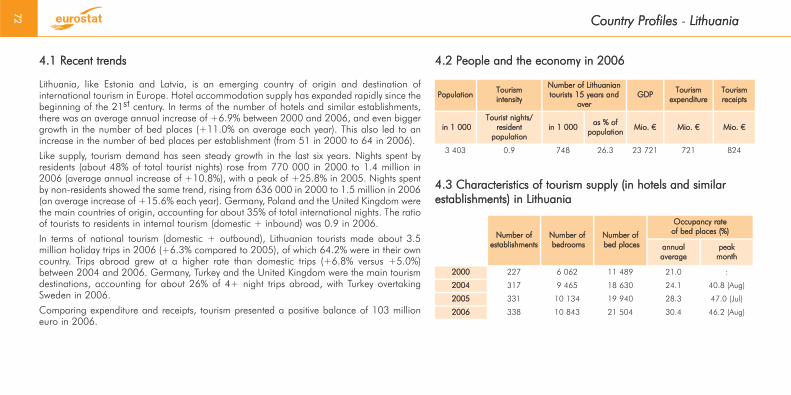
4.1 RRecent ttrends 4.2 PPeople aand tthe eeconomy iin 22006
Country PProfiles - LLithuania
72
Lithuania, like Estonia and Latvia, is an emerging country of origin and destination ofinternational tourism in Europe. Hotel accommodation supply has expanded rapidly since thebeginning of the 21st century. In terms of the number of hotels and similar establishments,there was an average annual increase of +6.9% between 2000 and 2006, and even biggergrowth in the number of bed places (+11.0% on average each year). This also led to anincrease in the number of bed places per establishment (from 51 in 2000 to 64 in 2006).
Like supply, tourism demand has seen steady growth in the last six years. Nights spent byresidents (about 48% of total tourist nights) rose from 770 000 in 2000 to 1.4 million in2006 (average annual increase of +10.8%), with a peak of +25.8% in 2005. Nights spentby non-residents showed the same trend, rising from 636 000 in 2000 to 1.5 million in 2006(an average increase of +15.6% each year). Germany, Poland and the United Kingdom werethe main countries of origin, accounting for about 35% of total international nights. The ratioof tourists to residents in internal tourism (domestic + inbound) was 0.9 in 2006.
In terms of national tourism (domestic + outbound), Lithuanian tourists made about 3.5million holiday trips in 2006 (+6.3% compared to 2005), of which 64.2% were in their owncountry. Trips abroad grew at a higher rate than domestic trips (+6.8% versus +5.0%)between 2004 and 2006. Germany, Turkey and the United Kingdom were the main tourismdestinations, accounting for about 26% of 4+ night trips abroad, with Turkey overtakingSweden in 2006.
Comparing expenditure and receipts, tourism presented a positive balance of 103 millioneuro in 2006.
4.3 CCharacteristics oof ttourism ssupply ((in hhotels aand ssimilarestablishments) iin LLithuania
PopulationTourism intensity
Number oof LLithuaniantourists 115 yyears aand
overGDP
Tourismexpenditure
Tourismreceipts
in 11 0000Tourist nnights/
residentpopulation
in 11 0000as %% oof
populationMio. €€ Mio. €€ Mio. €€
3 403 0.9 748 26.3 23 721 721 824
Number oofestablishments
Number oofbedrooms
Number oofbed pplaces
Occupancy rrate of bbed pplaces ((%)
annualaverage
peakmonth
2000 227 6 062 11 489 21.0 :
2004 317 9 465 18 630 24.1 40.8 (Aug)
2005 331 10 134 19 940 28.3 47.0 (Jul)
2006 338 10 843 21 504 30.4 46.2 (Aug)

Country PProfiles - LLithuania
73
4.4 CCharacteristics oof ttourism ddemand iin LLithuania ((domestic aand iinbound)
4.5 CCharacteristics oof LLithuanian ttourists aaged 115 aand oover ((domestic aand aabroad)
Nights sspent iin ccollective aaccommodation Nights sspent bby nnon-rresidents, bby mmain ccountries oof oorigin(as %% oof aall nnights sspent bby nnon-rresidents iin ccollective aaccommodation)Total by rresidents by nnon-rresidents
in 11 0000 in 11 0000 as %% oof ttotal in 11 0000 as %% oof ttotal 1st mmarket 2nd mmarket 3rd mmarket Share oof ttop 33
2000 1 406 770 54.8 636 45.2 : : : : : : :
2004 2 168 971 44.8 1 197 55.2 DE 17.8 PL 13.5 UK 5.3 36.6
2005 2 623 1 222 46.6 1 401 53.4 DE 18.7 PL 13.1 UK 5.7 37.5
2006 2 936 1 422 48.4 1 514 51.6 DE 15.7 PL 13.4 UK 5.8 34.9
Holiday ttrips bby rresident ttourists Holiday ttrips aabroad oof 44+ nnights ((in %%) bby mmain ccountries oof ddestination
Total ((domestic aand aabroad) Domestic Abroad
1st mmarket 2nd mmarket 3rd mmarketShare oof
top 33Total 1-33 nnights 4+ nnights Total 1-33 nnights 4+ nnights Total 1-33 nnights 4+ nnights
in 11 0000 in 11 0000 in 11 0000 in 11 0000 in 11 0000 in 11 0000 in 11 0000 in 11 0000 in 11 0000
2000 : : : : : : : : : : : : : : : :
2004 3 115 2 188 927 2 024 1 664 360 1 091 524 567 DE 16.0 SE 6.3 PL/TR 6.1 28.4
2005 3 271 2 192 1 079 2 108 1 727 381 1 163 465 698 DE 14.0 SE 7.5 TR 5.5 27.0
2006 3 476 2 386 1 090 2 233 1 822 411 1 243 564 679 DE 11.0 TR 7.7 UK 7.5 26.2
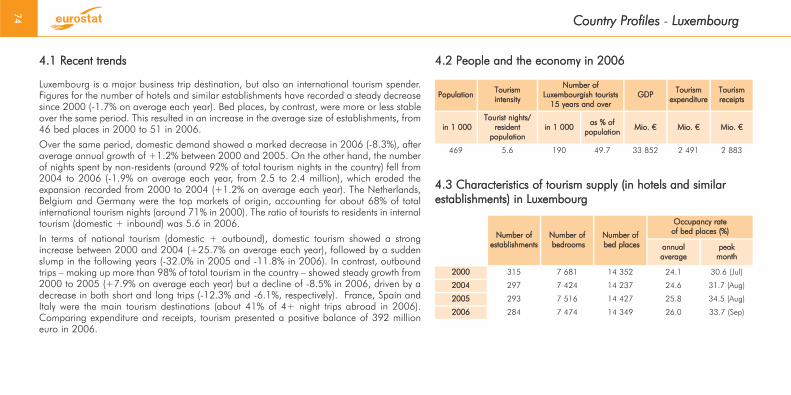
4.1 RRecent ttrends 4.2 PPeople aand tthe eeconomy iin 22006
Country PProfiles - LLuxembourg
74
Luxembourg is a major business trip destination, but also an international tourism spender.Figures for the number of hotels and similar establishments have recorded a steady decreasesince 2000 (-1.7% on average each year). Bed places, by contrast, were more or less stableover the same period. This resulted in an increase in the average size of establishments, from46 bed places in 2000 to 51 in 2006.
Over the same period, domestic demand showed a marked decrease in 2006 (-8.3%), afteraverage annual growth of +1.2% between 2000 and 2005. On the other hand, the numberof nights spent by non-residents (around 92% of total tourism nights in the country) fell from2004 to 2006 (-1.9% on average each year, from 2.5 to 2.4 million), which eroded theexpansion recorded from 2000 to 2004 (+1.2% on average each year). The Netherlands,Belgium and Germany were the top markets of origin, accounting for about 68% of totalinternational tourism nights (around 71% in 2000). The ratio of tourists to residents in internaltourism (domestic + inbound) was 5.6 in 2006.
In terms of national tourism (domestic + outbound), domestic tourism showed a strongincrease between 2000 and 2004 (+25.7% on average each year), followed by a suddenslump in the following years (-32.0% in 2005 and -11.8% in 2006). In contrast, outboundtrips – making up more than 98% of total tourism in the country – showed steady growth from2000 to 2005 (+7.9% on average each year) but a decline of -8.5% in 2006, driven by adecrease in both short and long trips (-12.3% and -6.1%, respectively). France, Spain andItaly were the main tourism destinations (about 41% of 4+ night trips abroad in 2006).Comparing expenditure and receipts, tourism presented a positive balance of 392 millioneuro in 2006.
4.3 CCharacteristics oof ttourism ssupply ((in hhotels aand ssimilarestablishments) iin LLuxembourg
Number oofestablishments
Number oofbedrooms
Number oofbed pplaces
Occupancy rrate of bbed pplaces ((%)
annualaverage
peakmonth
2000 315 7 681 14 352 24.1 30.6 (Jul)
2004 297 7 424 14 237 24.6 31.7 (Aug)
2005 293 7 516 14 427 25.8 34.5 (Aug)
2006 284 7 474 14 349 26.0 33.7 (Sep)
PopulationTourism intensity
Number oofLuxembourgish ttourists
15 yyears aand ooverGDP
Tourismexpenditure
Tourismreceipts
in 11 0000Tourist nnights/
residentpopulation
in 11 0000as %% oof
populationMio. €€ Mio. €€ Mio. €€
469 5.6 190 49.7 33 852 2 491 2 883

Country PProfiles - LLuxembourg
75
4.4 CCharacteristics oof ttourism ddemand iin LLuxembourg ((domestic aand iinbound)
4.5 CCharacteristics oof LLuxembourgish ttourists aaged 115 aand oover ((domestic aand aabroad)
Nights sspent iin ccollective aaccommodation Nights sspent bby nnon-rresidents, bby mmain ccountries oof oorigin(as %% oof aall nnights sspent bby nnon-rresidents iin ccollective aaccommodation)Total by rresidents by nnon-rresidents
in 11 0000 in 11 0000 as %% oof ttotal in 11 0000 as %% oof ttotal 1st mmarket 2nd mmarket 3rd mmarket Share oof ttop 33
2000 2 596 217 8.4 2 379 91.6 NL 39.1 BE 22.6 DE 9.1 70.8
2004 2 721 228 8.4 2 493 91.6 NL 43.1 BE 19.5 DE 9.8 72.4
2005 2 682 230 8.6 2 452 91.4 NL 40.3 BE 19.5 DE 10.5 70.3
2006 2 611 211 8.1 2 400 91.9 NL 38.4 BE 19.5 DE 10.4 68.3
Holiday ttrips bby rresident ttourists Holiday ttrips aabroad oof 44+ nnights ((in %%) bby mmain ccountries oof ddestination
Total ((domestic aand aabroad) Domestic Abroad
1st mmarket 2nd mmarket 3rd mmarketShare oof
top 33Total 1-33 nnights 4+ nnights Total 1-33 nnights 4+ nnights Total 1-33 nnights 4+ nnights
in 11 0000 in 11 0000 in 11 0000 in 11 0000 in 11 0000 in 11 0000 in 11 0000 in 11 0000 in 11 0000
2000 820 250 570 10 8 2 810 242 568 FR 19.9 ES 13.0 PT 9.3 42.2
2004 1 125 444 681 25 20 5 1 100 424 676 FR 21.0 IT 10.5 ES 10.4 41.9
2005 1 202 477 725 17 13 4 1 185 464 721 FR 20.8 ES 11.1 IT 10.0 41.9
2006 1 099 420 679 15 13 2 1 084 407 677 FR 19.5 ES 12.0 IT 9.6 41.1

4.1 RRecent ttrends 4.2 PPeople aand tthe eeconomy iin 22006
Country PProfiles - HHungary
76
Hungary is a tourist destination with an almost balanced share between domestic and foreigntourists. The 2006 figures for the number of hotels and similar establishments showed a slightdecrease in comparison to 2005 (-1.4%). Bed places followed the same trend (-2.1%), aftera steady increase between 2000 and 2005 (+2.5% on average each year). Consequently,the average number of bed places per establishment rose from 75 in 2000 to 78 in 2006.
As regards tourism demand, tourism nights in the country recovered well between 2004 and2006 (+2.0% per year on average), after a fall between 2000 and 2004 (-1.9% on averageeach year). Nights spent by residents rose by +7.0% per year on average from 2004 to2006, making up completely for the decrease between 2000 and 2004 (-2.3% on averageeach year). Nights spent by non-residents (about 51% of total tourism nights in the country)showed a decrease of -6.8% in 2006, after an average annual decline of -1.6% in the firstfour years of the 21st century and an increase of +2.6% in 2005. Germany, the UnitedKingdom and Austria were the top markets of origin, accounting for about 42% of totalinternational tourism nights in 2006.
In terms of national tourism, the figures for 2006 showed that residents made about 24.7million holiday trips (+8.3% compared to 2005), of which about 83% were in their owncountry. These figures concealed a different trend for domestic and outbound trips. Tripsmade by Hungarians in their own country recorded double-digit growth both in 2005 and2006 (+18.1% and +15.4%, respectively). Outbound trips, on the other hand, showed adecline in 2006 (-17.3%), after a boom in 2005 (+129.5%).
Comparing expenditure and receipts, tourism presented a positive balance of 1 686 millioneuro in 2006.
4.3 CCharacteristics oof ttourism ssupply ((in hhotels aand ssimilarestablishments) iin HHungary
PopulationTourism intensity
Number oof HHungariantourists 115 yyears aand
overGDP
Tourismexpenditure
Tourismreceipts
in 11 0000Tourist nnights/
residentpopulation
in 11 0000as %% oof
populationMio. €€ Mio. €€ Mio. €€
10 077 2.0 2983 35.0 89 901 1 687 3 373
Number oofestablishments
Number oofbedrooms
Number oofbed pplaces
Occupancy rrate of bbed pplaces ((%)
annualaverage
peakmonth
2000 1 928 57 870 143 573 25.8 41.6 (Aug)1
2004 1 952 64 263 157 970 25.4 41.1 (Aug)
2005 2 061 66 066 162 235 26.6 43.5 (Aug)
2006 2 032 66 873 158 762 27.3 45.4 (Aug)
1) 2001 data.

Country PProfiles - HHungary
77
4.4 CCharacteristics oof ttourism ddemand iin HHungary ((domestic aand iinbound)
4.5 CCharacteristics oof HHungarian ttourists aaged 115 aand oover ((domestic aand aabroad)
Holiday ttrips bby rresident ttourists Holiday ttrips aabroad oof 44+ nnights ((in %%) bby mmain ccountries oof ddestination
Total ((domestic aand aabroad) Domestic Abroad
1st mmarket 2nd mmarket 3rd mmarketShare oof
top 33Total 1-33 nnights 4+ nnights Total 1-33 nnights 4+ nnights Total 1-33 nnights 4+ nnights
in 11 0000 in 11 0000 in 11 0000 in 11 0000 in 11 0000 in 11 0000 in 11 0000 in 11 0000 in 11 0000
2000 : : : : : : : : : : : : : : : :
2004 17 267 11 810 5 457 15 104 11 128 3 976 2 163 682 1 481 : : : : : : :
2005 22 799 15 684 7 115 17 835 13 723 4 112 4 964 1 961 3 003 DE 14.7 AT 12.4 IT 9.6 36.7
2006 24 684 17 973 6 711 20 577 16 289 4 288 4 107 1 684 2 423 : : : : : : :
Nights sspent iin ccollective aaccommodation Nights sspent bby nnon-rresidents, bby mmain ccountries oof oorigin(as %% oof aall nnights sspent bby nnon-rresidents iin ccollective aaccommodation)Total by rresidents by nnon-rresidents
Share oof ttop 33in 11 0000 in 11 0000 as %% oof ttotal in 11 0000 as %% oof ttotal 1st mmarket 2nd mmarket 3rd mmarket
2000 20 430 9 220 45.1 11 210 54.9 DE1 40.3 AT1 6.6 IT1 4.5 51.4
2004 18 899 8 391 44.4 10 508 55.6 DE 32.7 AT 6.9 IT 5.7 45.3
2005 19 737 8 958 45.4 10 779 54.6 DE 30.8 UK 7.6 AT 6.6 45.0
2006 19 652 9 606 48.9 10 046 51.1 DE 28.0 UK 7.3 AT 7.1 42.4
1) 2001 data.

4.1 RRecent ttrends 4.2 PPeople aand tthe eeconomy iin 22006
Country PProfiles - MMalta
78
The island of Malta is mainly a destination of international tourism. Hotel accommodationsupply was more or less stable in 2006, after the negative trend recorded between 2000 and2005 (-6.7% on average each year). Conversely, the number of bed places have varied overthe last six years, from being more or less stable between 2000 and 2004, falling in 2005(from 40 779 to 37 322, -8.5%) and recovering again in 2006 (+5.9%). As a result, thenumber of bed places per establishment increased from 166 in 2000 to 228 in 2006.
As regards tourism demand, nights spent by all tourists in the country decreased by -2.1% in2006, following the negative trend already recorded in 2005. This trend was driven by thedrop in international tourism nights (-3.1%), which accounted for about 96% of total nights.The United Kingdom, Germany and Italy were the top markets of origin (61.4% in 2006),with the United Kingdom accounting for more than 42% of total international tourist nights.The ratio of tourists to residents in internal tourism (domestic + inbound) was 18.3 in 2006.
Comparing expenditure and receipts, tourism presented a positive balance of 355 millioneuro in 2006.
4.3 CCharacteristics oof ttourism ssupply ((in hhotels aand ssimilarestablishments) iin MMalta
PopulationTourism intensity
Number oof MMaltesetourists 115 yyears aand
overGDP
Tourismexpenditure
Tourismreceipts
in 11 0000Tourist nnights/
residentpopulation
in 11 0000as %% oof
populationMio. €€ Mio. €€ Mio. €€
405 18.3 : : 5 060 253 608
Number oofestablishments
Number oofbedrooms
Number oofbed pplaces
Occupancy rrate of bbed pplaces ((%)
annualaverage
peakmonth
2000 246 20 051 40 782 : 68.2 (Aug)
2004 194 19 331 40 779 51.5 83.1 (Aug)
2005 173 17 912 37 322 54.8 86.3 (Aug)
2006 173 18 533 39 518 50.5 82.8 (Aug)

Country PProfiles - MMalta
79
4.4 CCharacteristics oof ttourism ddemand iin MMalta ((domestic aand iinbound)
4.5 CCharacteristics oof MMaltese ttourists aaged 115 aand oover ((domestic aand aabroad)
Nights sspent iin ccollective aaccommodation Nights sspent bby nnon-rresidents, bby mmain ccountries oof oorigin(as %% oof aall nnights sspent bby nnon-rresidents iin ccollective aaccommodation)Total by rresidents by nnon-rresidents
in 11 0000 in 11 0000 as %% oof ttotal in 11 0000 as %% oof ttotal 1st mmarket 2nd mmarket 3rd mmarket Share oof ttop 33
2000 : : : : : UK 38.7 DE 18.3 FR 6.3 63.3
2004 7 737 279 3.6 7 458 96.4 UK 45.2 DE 11.7 FR 6.6 63.5
2005 7 567 247 3.3 7 320 96.7 UK 45.1 DE 12.1 FR 6.3 63.5
2006 7 407 315 4.3 7 092 95.7 UK 42.4 DE 11.6 IT 7.4 61.4
Holiday ttrips bby rresident ttourists Holiday ttrips aabroad oof 44+ nnights ((in %%) bby mmain ccountries oof ddestination
Total ((domestic aand aabroad) Domestic Abroad
1st mmarket 2nd mmarket 3rd mmarketShare oof
top 33Total 1-33 nnights 4+ nnights Total 1-33 nnights 4+ nnights Total 1-33 nnights 4+ nnights
in 11 0000 in 11 0000 in 11 0000 in 11 0000 in 11 0000 in 11 0000 in 11 0000 in 11 0000 in 11 0000
2000 : : : : : : : : : : : : : : : :
2004 : : : : : : : : : : : : : : : :
2005 : : : : : : : : : : : : : : : :
2006 : : : : : : : : : : : : : : : :

4.1 RRecent ttrends 4.2 PPeople aand tthe eeconomy iin 22006
Country PProfiles - TThe NNetherlands
80
The Netherlands is one of the principal generators of international tourism in Europe.Following steady growth between 2000 and 2004, the figures for the number of hotels andsimilar establishments were more or less stable in 2005 (+0.2%) and decreased marginallyin 2006 (-1.1%). The number of bed places recorded a fairly high increase in 2005 (+1.2%),followed by stagnation in 2006 (-0.1%). This resulted in a slight growth in the average sizeof establishments (from 61 in 2004 to 62 in 2006).
Tourism nights in the country recorded a marked increase in 2006 (+4.7%), after a slightdecline between 2000 and 2005 (-0.3% on average each year). Nights spent by residents(about 68% of total tourism nights) grew by +3.8% in 2006, thus offsetting the decrease of-1.0% from 2004 to 2005. The same trend applied to nights spent by non-residents, whichshowed greater expansion in 2006 (+6.7%). Germany, the United Kingdom and Belgiumwere the top three markets of origin, accounting for 62.9% of total international nights. Theratio of tourists to residents in total tourism in the country (domestic + inbound) was 5.1 in2006.
As regards national tourism (domestic + outbound), a steady increase was recorded in 2006(+1.4%), with the number of holiday trips returning to almost the same level as in 2004. Thisresult was driven by domestic trips (about 50% of total trips), which grew by +3.8% in 2006,while trips by Dutch tourists abroad fell by -0.9%. France, Germany and Spain were the maindestinations in 2006 (38.1% of total 4+ night trips abroad), with Germany overtaking Spaincompared with 2005. Comparing expenditure and receipts, tourism presented a negativebalance of 4 520 million euro in 2006.
4.3 CCharacteristics oof ttourism ssupply ((in hhotels aand ssimilarestablishments) iin tthe NNetherlands
PopulationTourism intensity
Number oof DDutchtourists 115 yyears aand
overGDP
Tourismexpenditure
Tourismreceipts
in 11 0000Tourist nnights/
residentpopulation
in 11 0000as %% oof
populationMio. €€ Mio. €€ Mio. €€
16 334 5.1 9 072 68.0 534 324 13 558 9 038
Number oofestablishments
Number oofbedrooms1
Number oofbed pplaces
Occupancy rrate of bbed pplaces ((%)
annualaverage
peakmonth
2000 2 835 : 173 066 47.1 61.9 (Aug)
2004 3 129 93 047 189 835 41.0 54.7 (Aug)
2005 3 135 94 364 192 215 42.1 55.5 (Aug)
2006 3 099 94 509 192 067 45.3 56.8 (Aug)

Country PProfiles - TThe NNetherlands
81
4.4 CCharacteristics oof ttourism ddemand iin tthe NNetherlands ((domestic aand iinbound)
4.5 CCharacteristics oof DDutch ttourists aaged 115 aand oover ((domestic aand aabroad)
Nights sspent iin ccollective aaccommodation Nights sspent bby nnon-rresidents, bby mmain ccountries oof oorigin(as %% oof aall nnights sspent bby nnon-rresidents iin ccollective aaccommodation)Total by rresidents by nnon-rresidents
in 11 0000 in 11 0000 as %% oof ttotal in 11 0000 as %% oof ttotal 1st mmarket 2nd mmarket 3rd mmarket Share oof ttop 33
2000 81 263 55 308 68.1 25 955 31.9 DE 45.1 UK 15.3 US 7.6 68.0
2004 80 912 55 526 68.6 25 386 31.4 DE 41.8 UK 14.0 BE 8.6 64.4
2005 80 161 54 951 68.6 25 210 31.4 DE 39.8 UK 14.5 BE 9.5 63.8
2006 83 944 57 057 68.0 26 887 32.0 DE 39.5 UK 13.9 BE 9.5 62.9
Holiday ttrips bby rresident ttourists Holiday ttrips aabroad oof 44+ nnights ((in %%) bby mmain ccountries oof ddestination
Total ((domestic aand aabroad) Domestic Abroad
1st mmarket 2nd mmarket 3rd mmarketShare oof
top 33Total 1-33 nnights 4+ nnights Total 1-33 nnights 4+ nnights Total 1-33 nnights 4+ nnights
in 11 0000 in 11 0000 in 11 0000 in 11 0000 in 11 0000 in 11 0000 in 11 0000 in 11 0000 in 11 0000
2000 25 354 9 825 15 529 13 388 7 639 5 749 11 966 2 186 9 780 FR 17.6 ES 12.2 DE 11.1 40.9
2004 28 712 10 237 18 475 14 133 7 177 6 956 14 579 3 060 11 519 FR 15.8 DE 12.1 ES 11.0 38.9
2005 27 872 9 824 18 048 13 579 7 017 6 562 14 293 2 807 11 486 FR 14.6 ES 11.8 DE 11.7 38.1
2006 28 265 9 881 18 384 14 096 7 110 6 986 14 169 2 771 11 398 FR 14.5 DE 12.2 ES 11.4 38.1

4.1 RRecent ttrends 4.2 PPeople aand tthe eeconomy iin 22006
Country PProfiles - AAustria
82
Austria is expanding its role as a generator of outbound tourism. Hotel accommodationsupply decreased in the initial years of the 21st century. The 2006 figures show a drop in thenumber of establishments (-1.5% compared to 2005), confirming the trend of previous years(-1.2% in 2005, -1.4% on average each year from 2000 to 2004). On the other hand, thenumber of bed places grew by +0.2% in 2006, after being more or less stable in 2005 andfalling slightly from 2000 to 2004 (-0.7% on average each year). Consequently, the averagesize of establishments rose to 41 bed places in 2006, compared to 38 in 2000.
Domestic demand grew over the same period. Nights spent by residents rose by +3.3% in2006, strengthening the positive trend of the previous years (+0.8% on average between2000 and 2005). The same evolution applies to nights spent by non-residents (about 71%of total nights in the country). They recorded an increase of +0.4% in 2006, after an averageannual growth of +1.6% from 2000 to 2005. Germany, the Netherlands and the UnitedKingdom were the top markets of origin, with Germany accounting for more than a half oftotal international tourist nights. The ratio of tourists to residents in internal tourism (domestic+ inbound) was 11.9 in 2006.
As regards national tourism (domestic + outbound), outbound trips – which account forabout 49% of total trips abroad, against 44% in 2000 – showed a significant recovery in2006 (+17.1%), after a decline from 2000 to 2005 (-1.0% on average each year). Similarly,domestic trips rose by +13.2% in 2006, following the trend of 2005 (+11.6%), thuscompensating for the decline from 2000 to 2004 (-7.4% on average each year). Italy, Spainand Greece were the main destinations of Austrian tourists in 2006, but their share declinedcompared to 2000 (from 42.4% to 36.2% in 2006). Comparing expenditure and receipts,tourism showed a positive balance of 5 835 million euro in 2006.
4.3 CCharacteristics oof ttourism ssupply ((in hhotels aand ssimilarestablishments) iin AAustria
PopulationTourism intensity
Number oof AAustriantourists 115 yyears aand
overGDP
Tourismexpenditure
Tourismreceipts
in 11 0000Tourist nnights/
residentpopulation
in 11 0000as %% oof
populationMio. €€ Mio. €€ Mio. €€
8 266 11.9 4 320 62.1 257 897 7 420 13 255
Number oofestablishments
Number oofbedrooms
Number oofbed pplaces
Occupancy rrate of bbed pplaces ((%)
annualaverage
peakmonth
2000 15 517 286 816 588 213 33.4 49.5 (Feb)
2004 14 435 290 491 570 785 35.5 58.1 (Feb)
2005 14 267 289 879 571 377 36.5 56.9 (Feb)
2006 14 051 282 002 572 514 37.0 57.4 (Feb)

Country PProfiles - AAustria
83
4.4 CCharacteristics oof ttourism ddemand iin AAustria ((domestic aand iinbound)
4.5 CCharacteristics oof AAustrian ttourists aaged 115 aand oover ((domestic aand aabroad)
Nights sspent iin ccollective aaccommodation Nights sspent bby nnon-rresidents, bby mmain ccountries oof oorigin(as %% oof aall nnights sspent bby nnon-rresidents iin ccollective aaccommodation)Total by rresidents by nnon-rresidents
in 11 0000 in 11 0000 as %% oof ttotal in 11 0000 as %% oof ttotal 1st mmarket 2nd mmarket 3rd mmarket Share oof ttop 33
2000 90 711 26 242 28.9 64 469 71.1 DE 60.1 NL 8.4 UK 4.5 73.0
2004 95 258 26 984 28.3 68 274 71.7 DE 56.2 NL 9.4 UK 4.7 70.3
2005 97 031 27 298 28.1 69 733 71.9 DE 55.1 NL 9.3 UK 4.8 69.2
2006 98 129 28 112 28.6 70 017 71.4 DE 52.9 NL 9.4 UK 5.0 67.3
Holiday ttrips bby rresident ttourists Holiday ttrips aabroad oof 44+ nnights ((in %%) bby mmain ccountries oof ddestination
Total ((domestic aand aabroad) Domestic Abroad
1st mmarket 2nd mmarket 3rd mmarketShare oof
top 33Total 1-33 nnights 4+ nnights Total 1-33 nnights 4+ nnights Total 1-33 nnights 4+ nnights
in 11 0000 in 11 0000 in 11 0000 in 11 0000 in 11 0000 in 11 0000 in 11 0000 in 11 0000 in 11 0000
2000 15 621 9 932 5 689 8 722 6 911 1 811 6 899 3 021 3 878 IT 22.6 EL 10.7 ES 9.1 42.4
2004 13 202 5 361 7 841 6 404 3 635 2 769 6 798 1 726 5 072 IT 21.8 EL 8.3 DE 7.7 37.8
2005 13 709 6 241 7 468 7 145 4 452 2 693 6 564 1 789 4 775 IT 21.1 EL 8.3 DE 7.6 37.0
2006 15 771 7 026 8 745 8 087 4 892 3 195 7 684 2 134 5 550 IT 20.7 ES 8.2 EL 7.3 36.2

4.1 RRecent ttrends 4.2 PPeople aand tthe eeconomy iin 22006
Country PProfiles - PPoland
84
Poland is an emerging tourism market in Europe. Hotel supply has shown a steady increasesince 2000 in both the number of establishments and the number of bed places (averageannual increase until 2006 of +8.0% and +6.8%, respectively). In particular, averagedouble-digit growth was recorded between 2000 and 2004 for hotels, when the number ofestablishments rose from 1 449 to 2 139 (+10.2% on average each year). Over the sameperiod, the number of bed places grew by +8.3% on average each year (from 120 280 to165 311). As a result, the average number of bed places per establishment declined from83 in 2000 to 77 in 2006. Tourism nights in the country increased by +5.4% in 2006, following the positive trend in2005. Nights spent by residents – accounting for about 79% of total tourist nights – cameclose to the level of 2000 (about 42 million), after an average annual decrease of -2.8%between 2000 and 2004. Conversely, nights spent by non-residents recorded a sharpincrease, rising from 6.9 million in 2000 to 10.6 million in 2006 (an average annualincrease of +7.4%). Germany, the United Kingdom and the United States were the topmarkets of origin, accounting for about 53% of total international tourist flows. The ratio oftourists to residents in total tourism in the country (domestic + inbound) was 1.3 in 2006.In terms of national tourism, holiday trips made by Polish tourists rose from 35.5 to 38.3million from 2005 to 2006 (+7.8%), partly making up for the fall in 2005 (-11.9%). Growthwas driven by both domestic trips (+7.1%) – which account for about 86% of total holidaytrips – and outbound trips (+13.1%). Germany, Italy and the United Kingdom were the maindestinations of Polish tourists in 2006, accounting for about 45% of total 4+ night tripsabroad. Comparing expenditure and receipts, tourism presented a positive balance of 1 170million euro in 2006.
4.3 CCharacteristics oof ttourism ssupply ((in hhotels aand ssimilarestablishments) iin PPoland
PopulationTourismintensity
Number oof PPolish ttourists15 yyears aand oover
GDPTourism
expenditureTourismreceipts
in 11 0000Tourist nnights/
residentpopulation
in 11 0000as %% oof
populationMio. €€ Mio. €€ Mio. €€
38 157 1.3 10 465 32.7 271 530 4 574 5 744
Number oofestablishments
Number oofbedrooms
Number oofbed pplaces
Occupancy rrate of bbed pplaces ((%)
annualaverage
peakmonth
2000 1 449 60 853 120 280 32.6 :
2004 2 139 83 007 165 311 30.6 45.3 (Jun)
2005 2 200 84 865 169 609 32.8 45.1 (Aug)
2006 2 301 88 409 178 056 33.6 44.6 (Aug)

Country PProfiles - PPoland
85
4.4 CCharacteristics oof ttourism ddemand iin PPoland ((domestic aand iinbound)
4.5 CCharacteristics oof PPolish ttourists aaged 115 aand oover ((domestic aand aabroad)
Nights sspent iin ccollective aaccommodation Nights sspent bby nnon-rresidents, bby mmain ccountries oof oorigin(as %% oof aall nnights sspent bby nnon-rresidents iin ccollective aaccommodation)Total by rresidents by nnon-rresidents
in 11 0000 in 11 0000 as %% oof ttotal in 11 0000 as %% oof ttotal 1st mmarket 2nd mmarket 3rd mmarket Share oof ttop 33
2000 48 794 41 903 85.9 6 891 14.1 : : : : : : :
2004 46 657 37 344 80.0 9 313 20.0 DE 45.0 UK 5.0 US 4.7 54.7
2005 48 618 38 076 78.3 10 542 21.7 DE 44.8 UK 5.9 US 4.4 55.1
2006 51 235 40 680 79.4 10 555 20.6 DE 41.7 UK 7.2 US 4.4 53.3
Holiday ttrips bby rresident ttourists Holiday ttrips aabroad oof 44+ nnights ((in %%) bby mmain ccountries oof ddestination
Total ((domestic aand aabroad) Domestic Abroad
1st mmarket 2nd mmarket 3rd mmarketShare oof
top 33Total 1-33 nnights 4+ nnights Total 1-33 nnights 4+ nnights Total 1-33 nnights 4+ nnights
in 11 0000 in 11 0000 in 11 0000 in 11 0000 in 11 0000 in 11 0000 in 11 0000 in 11 0000 in 11 0000
2000 : : : : : : : : : : : : : : : :
2004 40 288 23 649 16 639 36 669 23 056 13 613 3 619 593 3 026 DE 29.4 IT 6.8 SK 5.3 41.5
2005 35 500 18 978 16 522 30 920 17 850 13 070 4 580 1 128 3 452 DE 22.9 IT 9.0 UK 6.7 38.6
2006 38 283 20 475 17 808 33 102 18 761 14 341 5 181 1 714 3 467 DE 25.9 IT 9.4 UK 9.2 44.5
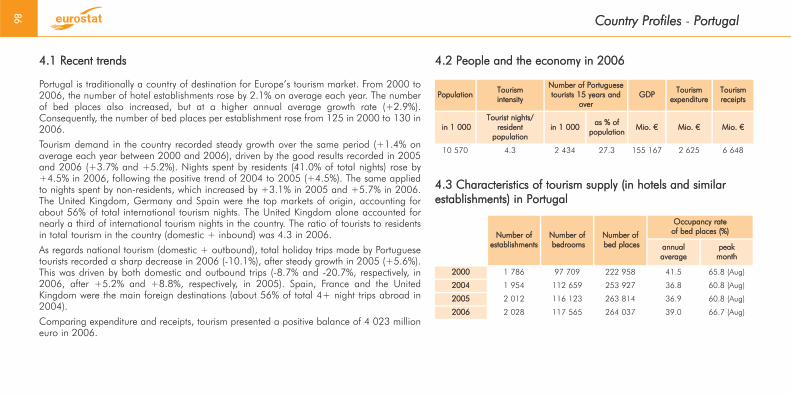
4.1 RRecent ttrends 4.2 PPeople aand tthe eeconomy iin 22006
Country PProfiles - PPortugal
86
Portugal is traditionally a country of destination for Europe’s tourism market. From 2000 to2006, the number of hotel establishments rose by 2.1% on average each year. The numberof bed places also increased, but at a higher annual average growth rate (+2.9%).Consequently, the number of bed places per establishment rose from 125 in 2000 to 130 in2006.
Tourism demand in the country recorded steady growth over the same period (+1.4% onaverage each year between 2000 and 2006), driven by the good results recorded in 2005and 2006 (+3.7% and +5.2%). Nights spent by residents (41.0% of total nights) rose by+4.5% in 2006, following the positive trend of 2004 to 2005 (+4.5%). The same appliedto nights spent by non-residents, which increased by +3.1% in 2005 and +5.7% in 2006.The United Kingdom, Germany and Spain were the top markets of origin, accounting forabout 56% of total international tourism nights. The United Kingdom alone accounted fornearly a third of international tourism nights in the country. The ratio of tourists to residentsin total tourism in the country (domestic + inbound) was 4.3 in 2006.
As regards national tourism (domestic + outbound), total holiday trips made by Portuguesetourists recorded a sharp decrease in 2006 (-10.1%), after steady growth in 2005 (+5.6%).This was driven by both domestic and outbound trips (-8.7% and -20.7%, respectively, in2006, after +5.2% and +8.8%, respectively, in 2005). Spain, France and the UnitedKingdom were the main foreign destinations (about 56% of total 4+ night trips abroad in2004).
Comparing expenditure and receipts, tourism presented a positive balance of 4 023 millioneuro in 2006.
4.3 CCharacteristics oof ttourism ssupply ((in hhotels aand ssimilarestablishments) iin PPortugal
PopulationTourism intensity
Number oof PPortuguesetourists 115 yyears aand
overGDP
Tourismexpenditure
Tourismreceipts
in 11 0000Tourist nnights/
residentpopulation
in 11 0000as %% oof
populationMio. €€ Mio. €€ Mio. €€
10 570 4.3 2 434 27.3 155 167 2 625 6 648
Number oofestablishments
Number oofbedrooms
Number oofbed pplaces
Occupancy rrate of bbed pplaces ((%)
annualaverage
peakmonth
2000 1 786 97 709 222 958 41.5 65.8 (Aug)
2004 1 954 112 659 253 927 36.8 60.8 (Aug)
2005 2 012 116 123 263 814 36.9 60.8 (Aug)
2006 2 028 117 565 264 037 39.0 66.7 (Aug)

Country PProfiles - PPortugal
87
4.4 CCharacteristics oof ttourism ddemand iin PPortugal ((domestic aand iinbound)
4.5 CCharacteristics oof PPortuguese ttourists aaged 115 aand oover ((domestic aand aabroad)
Nights sspent iin ccollective aaccommodation Nights sspent bby nnon-rresidents, bby mmain ccountries oof oorigin(as %% oof aall nnights sspent bby nnon-rresidents iin ccollective aaccommodation)Total by rresidents by nnon-rresidents
in 11 0000 in 11 0000 as %% oof ttotal in 11 0000 as %% oof ttotal 1st mmarket 2nd mmarket 3rd mmarket Share oof ttop 33
2000 41 956 16 171 38.5 25 785 61.5 UK 28.4 DE 20.7 NL 8.1 57.2
2004 41 722 17 105 41.0 24 617 59.0 UK 29.6 DE 16.3 ES 10.7 56.6
2005 43 265 17 877 41.3 25 388 58.7 UK 29.9 DE 16.2 ES 11.8 57.9
2006 45 522 18 680 41.0 26 842 59.0 UK 27.9 DE 15.2 ES 13.1 56.2
Holiday ttrips bby rresident ttourists Holiday ttrips aabroad oof 44+ nnights ((in %%) bby mmain ccountries oof ddestination
Total ((domestic aand aabroad) Domestic Abroad
1st mmarket 2nd mmarket 3rd mmarketShare oof
top 33Total 1-33 nnights 4+ nnights Total 1-33 nnights 4+ nnights Total 1-33 nnights 4+ nnights
in 11 0000 in 11 0000 in 11 0000 in 11 0000 in 11 0000 in 11 0000 in 11 0000 in 11 0000 in 11 0000
2000 10 621 6 933 3 688 9 774 6 750 3 024 847 183 664 ES 44.7 FR 12.3 UK 6.3 63.3
2004 10 816 6 651 4 165 9 633 6 408 3 225 1 183 243 940 ES 35.7 FR 11.0 UK 9.5 56.2
2005 11 417 7 481 3 936 10 130 7 087 3 043 1 287 394 893 : : : : : : :
2006 10 265 6 602 3 663 9 244 6 356 2 888 1 021 246 775 : : : : : : :

4.1 RRecent ttrends 4.2 PPeople aand tthe eeconomy iin 22006
Country PProfiles - RRomania
88
Romania is an emerging country of destination and origin of tourism. Hotel accommodationsupply expanded steadily between 2000 and 2006. The number of hotels grew by +8.5%on average each year (from 2 533 to 4 125) and the number of bed places by +2.1% (from199 333 to 226 383). Consequently, the average size of hotels declined from 79 bed placesin 2000 to 55 bed places in 2006.
As regards demand, all tourists spent about 19 million nights in Romania in 2006, against17.6 million in 2000 (+1.2% on average each year). Over the same period, domestic nights– representing about 83% of total nights – were more or less stable (+0.3% on average eachyear), while international tourism increased steadily (+7.1% on average each year, from 2.1to 3.2 million nights). Germany, Italy and France were the main countries of origin ofinternational tourism in the country, accounting for about 36% of total international nights in2006. The ratio of tourists to residents in internal tourism (domestic + inbound) was 0.9 in2006.
In terms of national tourism (domestic + outbound), the number of total holiday tripsplunged by a third from about 10.4 million in 2004 to about 6.9 million trips in 2006 (-33.6%). Both a dramatic reduction in short trips (1-3 nights, -42,8% from 2004 to 2006)and a fairly sizeable decrease in long trips (4+ nights, -21.7% from 2004 to 2006) causedthis crash. In 2006, about 93% of total trips were in the country (6.4 million). Of theremaining trips abroad (451 000), 91% were long trips. Italy, Greece and Spain were themain countries of destination, accounting for about 51% of total 4+ night trips abroad in2006. Tourism expenditure and receipts were almost equal in 2006.
4.3 CCharacteristics oof ttourism ssupply ((in hhotels aand ssimilarestablishments) iin RRomania
PopulationTourismintensity
Number oof RRomaniantourists 115 yyears aand
overGDP
Tourismexpenditure
Tourismreceipts
in 11 0000Tourist nnights/
residentpopulation
in 11 0000as %% oof
populationMio. €€ Mio. €€ Mio. €€
21 610 0.9 3 152 17.3 97 718 1 034 1 033
Number oofestablishments
Number oofbedrooms
Number oofbed pplaces
Occupancy rrate of bbed pplaces ((%)
annualaverage
peakmonth
2000 2 533 96 250 199 333 21.9 :
2004 3 301 101 574 207 810 : 54.3 (Aug)
2005 3 608 105 787 216 499 : 51.1 (Aug)
2006 4 125 110 937 226 383 21.9 49.9 (Aug)

Country PProfiles - RRomania
89
4.4 CCharacteristics oof ttourism ddemand iin RRomania ((domestic aand iinbound)
4.5 CCharacteristics oof RRomanian ttourists aaged 115 aand oover ((domestic aand aabroad)
Nights sspent iin ccollective aaccommodation Nights sspent bby nnon-rresidents, bby mmain ccountries oof oorigin(as %% oof aall nnights sspent bby nnon-rresidents iin ccollective aaccommodation)Total by rresidents by nnon-rresidents
in 11 0000 in 11 0000 as %% oof ffotal in 11 0000 as %% oof ffotal 1st mmarket 2nd mmarket 3rd mmarket Share oof ttop 33
2000 17 646 15 497 87.8 2 149 12.2 : : : : : : :
2004 : : : : : : : : : : : :
2005 : : : : : : : : : : : :
2006 18 992 15 750 82.9 3 242 17.1 DE 15.6 IT 12.5 FR 7.8 35.9
Holiday ttrips bby rresident ttourists Holiday ttrips aabroad oof 44+ nnights ((in %%) bby mmain ccountries oof ddestination
Total ((domestic aand aabroad) Domestic Abroad
1st mmarket 2nd mmarket 3rd mmarketShare oof
top 33Total 1-33 nnights 4+ nnights Total 1-33 nnights 4+ nnights Total 1-33 nnights 4+ nnights
in 11 0000 in 11 0000 in 11 0000 in 11 0000 in 11 0000 in 11 0000 in 11 0000 in 11 0000 in 11 0000
2000 : : : : : : : : : : : : : : : :
2004 10 376 6 127 4 249 : : : : : : : : : : : : :
2005 8 738 4 881 3 857 : : : : : : : : : : : : :
2006 6 892 3 505 3 387 6 441 3 464 2 977 451 41 410 IT 25.9 EL 15.1 ES 9.5 50.5
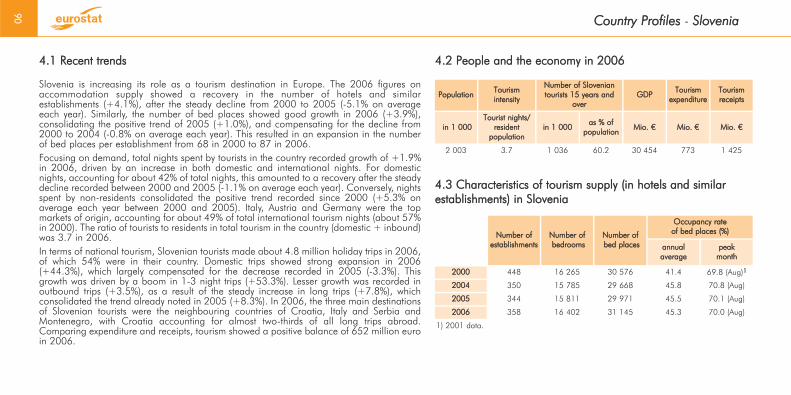
4.1 RRecent ttrends 4.2 PPeople aand tthe eeconomy iin 22006
Country PProfiles - SSlovenia
90
Slovenia is increasing its role as a tourism destination in Europe. The 2006 figures onaccommodation supply showed a recovery in the number of hotels and similarestablishments (+4.1%), after the steady decline from 2000 to 2005 (-5.1% on averageeach year). Similarly, the number of bed places showed good growth in 2006 (+3.9%),consolidating the positive trend of 2005 (+1.0%), and compensating for the decline from2000 to 2004 (-0.8% on average each year). This resulted in an expansion in the numberof bed places per establishment from 68 in 2000 to 87 in 2006. Focusing on demand, total nights spent by tourists in the country recorded growth of +1.9%in 2006, driven by an increase in both domestic and international nights. For domesticnights, accounting for about 42% of total nights, this amounted to a recovery after the steadydecline recorded between 2000 and 2005 (-1.1% on average each year). Conversely, nightsspent by non-residents consolidated the positive trend recorded since 2000 (+5.3% onaverage each year between 2000 and 2005). Italy, Austria and Germany were the topmarkets of origin, accounting for about 49% of total international tourism nights (about 57%in 2000). The ratio of tourists to residents in total tourism in the country (domestic + inbound)was 3.7 in 2006.In terms of national tourism, Slovenian tourists made about 4.8 million holiday trips in 2006,of which 54% were in their country. Domestic trips showed strong expansion in 2006(+44.3%), which largely compensated for the decrease recorded in 2005 (-3.3%). Thisgrowth was driven by a boom in 1-3 night trips (+53.3%). Lesser growth was recorded inoutbound trips (+3.5%), as a result of the steady increase in long trips (+7.8%), whichconsolidated the trend already noted in 2005 (+8.3%). In 2006, the three main destinationsof Slovenian tourists were the neighbouring countries of Croatia, Italy and Serbia andMontenegro, with Croatia accounting for almost two-thirds of all long trips abroad.Comparing expenditure and receipts, tourism showed a positive balance of 652 million euroin 2006.
4.3 CCharacteristics oof ttourism ssupply ((in hhotels aand ssimilarestablishments) iin SSlovenia
PopulationTourismintensity
Number oof SSloveniantourists 115 yyears aand
overGDP
Tourismexpenditure
Tourismreceipts
in 11 0000Tourist nnights/
residentpopulation
in 11 0000as %% oof
populationMio. €€ Mio. €€ Mio. €€
2 003 3.7 1 036 60.2 30 454 773 1 425
Number oofestablishments
Number oofbedrooms
Number oofbed pplaces
Occupancy rrate of bbed pplaces ((%)
annualaverage
peakmonth
2000 448 16 265 30 576 41.4 69.8 (Aug)1
2004 350 15 785 29 668 45.8 70.8 (Aug)
2005 344 15 811 29 971 45.5 70.1 (Aug)
2006 358 16 402 31 145 45.3 70.0 (Aug)
1) 2001 data.

Country PProfiles - SSlovenia
91
4.4 CCharacteristics oof ttourism ddemand iin SSlovenia ((domestic aand iinbound)
4.5 CCharacteristics oof SSlovenian ttourists aaged 115 aand oover ((domestic aand aabroad)
Nights sspent iin ccollective aaccommodation Nights sspent bby nnon-rresidents, bby mmain ccountries oof oorigin(as %% oof aall nnights sspent bby nnon-rresidents iin ccollective aaccommodation)Total by rresidents by nnon-rresidents
in 11 0000 in 11 0000 as %% oof ttotal in 11 0000 as %% oof ttotal 1st mmarket 2nd mmarket 3rd mmarket Share oof ttop 33
2000 6 509 3 232 49.7 3 277 50.3 DE1 22.7 IT1 18.1 AT1 16.5 57.3
2004 7 301 3 113 42.6 4 188 57.4 IT 18.2 DE 17.4 AT 16.0 51.6
2005 7 308 3 058 41.8 4 250 58.2 IT 19.6 DE 15.5 AT 15.5 50.6
2006 7 448 3 116 41.8 4 332 58.2 IT 20.0 AT 15.0 DE 13.6 48.6
1) 2001 data.
Holiday ttrips bby rresident ttourists Holiday ttrips aabroad oof 44+ nnights ((in %%) bby mmain ccountries oof ddestination1
Total ((domestic aand aabroad) Domestic Abroad
1st mmarket 2nd mmarket 3rd mmarketShare oof
top 33Total 1-33 nnights 4+ nnights Total 1-33 nnights 4+ nnights Total 1-33 nnights 4+ nnights
in 11 0000 iin 11 0000 iin 11 0000 iin 11 0000 iin 11 0000 iin 11 0000 iin 11 0000 iin 11 0000 iin 11 0000
2000 : : : : : : : : : : : : : : : :
2004 3 982 2 447 1 535 1 841 1 427 414 2 141 1 020 1 121 HR 65.9 BA 4.6 IT 4.6 75.1
2005 3 901 2 258 1 643 1 780 1 351 429 2 121 907 1 214 HR 61.8 IT 6.4 * 3.7 71.9
2006 4 765 2 958 1 807 2 569 2 071 498 2 196 887 1 309 HR 62.1 IT 6.2 * 5.9 74.2
1) Information partly based on additional data provided by the national statistical institute of Slovenia, complementary to the data collected under Directive 95/57/EC. *) Represents Serbia and Montenegro.
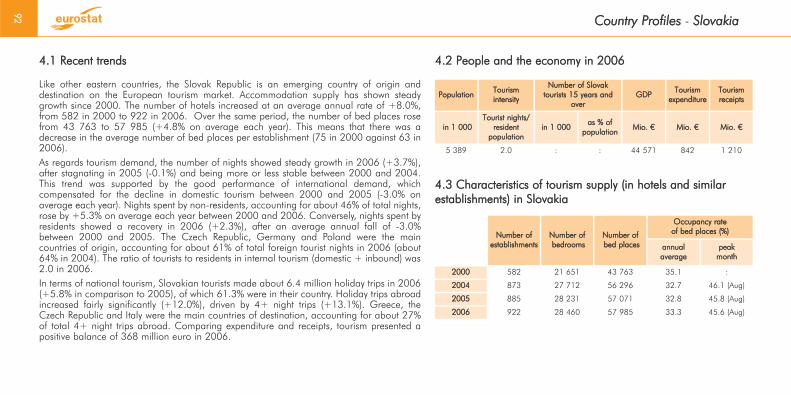
4.1 RRecent ttrends 4.2 PPeople aand tthe eeconomy iin 22006
Country PProfiles - SSlovakia
92
Like other eastern countries, the Slovak Republic is an emerging country of origin anddestination on the European tourism market. Accommodation supply has shown steadygrowth since 2000. The number of hotels increased at an average annual rate of +8.0%,from 582 in 2000 to 922 in 2006. Over the same period, the number of bed places rosefrom 43 763 to 57 985 (+4.8% on average each year). This means that there was adecrease in the average number of bed places per establishment (75 in 2000 against 63 in2006). As regards tourism demand, the number of nights showed steady growth in 2006 (+3.7%),after stagnating in 2005 (-0.1%) and being more or less stable between 2000 and 2004.This trend was supported by the good performance of international demand, whichcompensated for the decline in domestic tourism between 2000 and 2005 (-3.0% onaverage each year). Nights spent by non-residents, accounting for about 46% of total nights,rose by +5.3% on average each year between 2000 and 2006. Conversely, nights spent byresidents showed a recovery in 2006 (+2.3%), after an average annual fall of -3.0%between 2000 and 2005. The Czech Republic, Germany and Poland were the maincountries of origin, accounting for about 61% of total foreign tourist nights in 2006 (about64% in 2004). The ratio of tourists to residents in internal tourism (domestic + inbound) was2.0 in 2006.In terms of national tourism, Slovakian tourists made about 6.4 million holiday trips in 2006(+5.8% in comparison to 2005), of which 61.3% were in their country. Holiday trips abroadincreased fairly significantly (+12.0%), driven by 4+ night trips (+13.1%). Greece, theCzech Republic and Italy were the main countries of destination, accounting for about 27%of total 4+ night trips abroad. Comparing expenditure and receipts, tourism presented apositive balance of 368 million euro in 2006.
4.3 CCharacteristics oof ttourism ssupply ((in hhotels aand ssimilarestablishments) iin SSlovakia
Number oofestablishments
Number oofbedrooms
Number oofbed pplaces
Occupancy rrate of bbed pplaces ((%)
annualaverage
peakmonth
2000 582 21 651 43 763 35.1 :
2004 873 27 712 56 296 32.7 46.1 (Aug)
2005 885 28 231 57 071 32.8 45.8 (Aug)
2006 922 28 460 57 985 33.3 45.6 (Aug)
PopulationTourismintensity
Number oof SSlovaktourists 115 yyears aand
overGDP
Tourismexpenditure
Tourismreceipts
in 11 0000Tourist nnights/
residentpopulation
in 11 0000as %% oof
populationMio. €€ Mio. €€ Mio. €€
5 389 2.0 : : 44 571 842 1 210
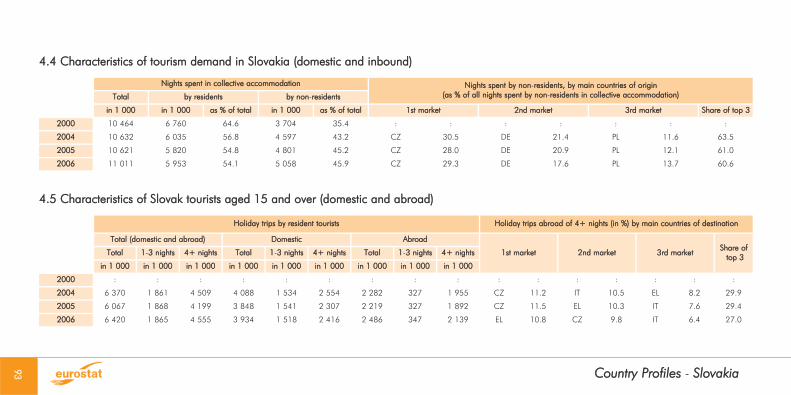
Country PProfiles - SSlovakia
93
4.4 CCharacteristics oof ttourism ddemand iin SSlovakia ((domestic aand iinbound)
4.5 CCharacteristics oof SSlovak ttourists aaged 115 aand oover ((domestic aand aabroad)
Nights sspent iin ccollective aaccommodation Nights sspent bby nnon-rresidents, bby mmain ccountries oof oorigin(as %% oof aall nnights sspent bby nnon-rresidents iin ccollective aaccommodation)Total by rresidents by nnon-rresidents
in 11 0000 in 11 0000 as %% oof ttotal in 11 0000 as %% oof ttotal 1st mmarket 2nd mmarket 3rd mmarket Share oof ttop 33
2000 10 464 6 760 64.6 3 704 35.4 : : : : : : :
2004 10 632 6 035 56.8 4 597 43.2 CZ 30.5 DE 21.4 PL 11.6 63.5
2005 10 621 5 820 54.8 4 801 45.2 CZ 28.0 DE 20.9 PL 12.1 61.0
2006 11 011 5 953 54.1 5 058 45.9 CZ 29.3 DE 17.6 PL 13.7 60.6
Holiday ttrips bby rresident ttourists Holiday ttrips aabroad oof 44+ nnights ((in %%) bby mmain ccountries oof ddestination
Total ((domestic aand aabroad) Domestic Abroad
1st mmarket 2nd mmarket 3rd mmarketShare oof
top 33Total 1-33 nnights 4+ nnights Total 1-33 nnights 4+ nnights Total 1-33 nnights 4+ nnights
in 11 0000 in 11 0000 in 11 0000 in 11 0000 in 11 0000 in 11 0000 in 11 0000 in 11 0000 in 11 0000
2000 : : : : : : : : : : : : : : : :
2004 6 370 1 861 4 509 4 088 1 534 2 554 2 282 327 1 955 CZ 11.2 IT 10.5 EL 8.2 29.9
2005 6 067 1 868 4 199 3 848 1 541 2 307 2 219 327 1 892 CZ 11.5 EL 10.3 IT 7.6 29.4
2006 6 420 1 865 4 555 3 934 1 518 2 416 2 486 347 2 139 EL 10.8 CZ 9.8 IT 6.4 27.0

4.1 RRecent ttrends 4.2 PPeople aand tthe eeconomy iin 22006
Country PProfiles - FFinland
94
Finland is mainly a generator of tourism, at home and abroad. Figures on accommodationsupply revealed a downward trend for establishments since the beginning of the 21st century.The number of hotels recorded an average annual decrease of -1.5% from 2000 to 2006.Over the same period, the number of bed places grew slightly between 2000 and 2004(+0.5% on average each year). In 2005, they reverted almost back to the level reached in2000 and then rose slightly again in 2006 (+0.5%). This resulted in an expansion in theaverage number of bed places per establishment (128 in 2006 against 116 in 2000).Unlike supply, tourism demand in the country recorded a steady growth in the same period.Nights spent by residents, which accounted for about 73% of total nights in the country, rosefrom 12.0 to 13.2 million between 2000 and 2006 (average annual increase of +1.6%).Nights spent by non-residents followed the same trend, rising from 4.1 to 5.0 million (+3.5%on average each year). Sweden, Germany and the United Kingdom were the top markets oforigin, accounting for 32.0% of total international tourism nights (about 37% in 2000). Theratio of tourists to residents in internal tourism (domestic + inbound) was 3.5 in 2006.As regards national tourism (domestic + outbound), Finnish tourists made 28.2 millionholiday trips in 2006 (-4.9% in comparison to 2005). The decrease was the result of adecline in domestic trips (from 25.1 to 23.6 million, -6.1%), which accounted for about 84%of total trips. Conversely, holiday trips abroad in 2006 recorded an upswing (+1.5%compared to 2005), driven by the expansion of 4+ night trips (+4.2%). Spain, Estonia andGreece were the main countries of destination for long trips, accounting for about 33% of4+night trips abroad, with Greece overtaking Sweden in 2006. Comparing expenditure and receipts, tourism presented a negative balance of 833 millioneuro in 2006.
4.3 CCharacteristics oof ttourism ssupply ((in hhotels aand ssimilarestablishments) iin FFinland
PopulationTourismintensity
Number oof FFinnishtourists 115 yyears aand
overGDP
Tourismexpenditure
Tourismreceipts
in 11 0000Tourist nnights/
residentpopulation
in 11 0000as %% oof
populationMio. €€ Mio. €€ Mio. €€
5 256 3.5 2 491 57.3 167 062 2 724 1 891
Number oofestablishments
Number oofbedrooms
Number oofbed pplaces
Occupancy rrate of bbed pplaces ((%)
annualaverage
peakmonth
2000 1 011 54 855 117 322 31.2 43.2 (Jul)
2004 961 53 537 119 941 31.5 49.6 (Jul)
2005 938 54 354 117 605 33.3 47.6 (Jul)
2006 923 54 452 118 170 34.8 49.5 (Jul)

Country PProfiles - FFinland
95
4.4 CCharacteristics oof ttourism ddemand iin FFinland ((domestic aand iinbound)
4.5 CCharacteristics oof FFinnish ttourists aaged 115 aand oover ((domestic aand aabroad)
Nights sspent iin ccollective aaccommodation Nights sspent bby nnon-rresidents, bby mmain ccountries oof oorigin(as %% oof aall nnights sspent bby nnon-rresidents iin ccollective aaccommodation)Total by rresidents by nnon-rresidents
in 11 0000 in 11 0000 as %% oof ttotal in 11 0000 as %% oof ttotal 1st mmarket 2nd mmarket 3rd mmarket Share oof ttop 33
2000 16 042 11 976 74.7 4 066 25.3 SE 15.8 DE 11.8 UK 9.0 36.6
2004 16 699 12 293 73.6 4 406 26.4 SE 13.9 DE 12.1 UK 9.3 35.3
2005 17 259 12 760 73.9 4 499 26.1 SE 13.3 DE 12.1 UK 9.4 34.8
2006 18 169 13 165 72.5 5 004 27.5 SE 11.7 DE 10.7 UK 9.6 32.0
Holiday ttrips bby rresident ttourists Holiday ttrips aabroad oof 44+ nnights ((in %%) bby mmain ccountries oof ddestination
Total ((domestic aand aabroad) Domestic Abroad
1st mmarket 2nd mmarket 3rd mmarketShare oof
top 33Total 1-33 nnights 4+ nnights Total 1-33 nnights 4+ nnights Total 1-33 nnights 4+ nnights
in 11 0000 in 11 0000 in 11 0000 in 11 0000 in 11 0000 in 11 0000 in 11 0000 in 11 0000 in 11 0000
2000 23 109 17 848 5 261 18 332 14 577 3 755 4 777 3 271 1 506 ES 22.6 EL 9.1 SE 7.9 39.6
2004 28 124 21 924 6 200 23 580 19 272 4 308 4 544 2 652 1 892 ES 18.4 EL 8.1 SE 7.6 34.1
2005 29 611 23 168 6 443 25 073 20 591 4 482 4 538 2 577 1 961 ES 16.6 EE 9.4 SE 6.5 32.5
2006 28 161 21 541 6 620 23 554 18 978 4 576 4 607 2 563 2 044 ES 17.9 EE 8.6 EL 6.9 33.4
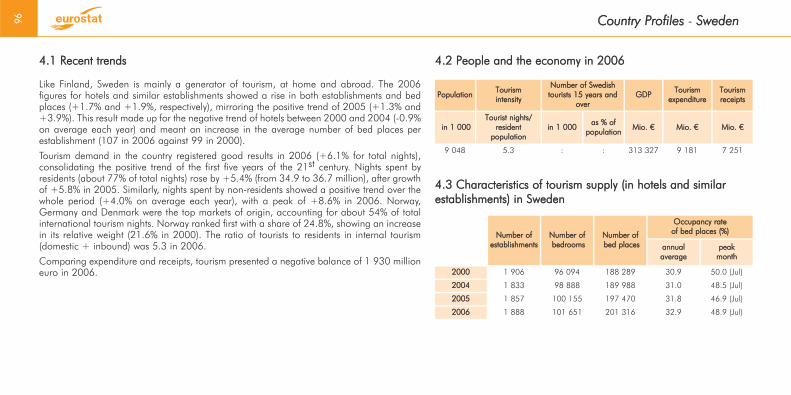
4.1 RRecent ttrends 4.2 PPeople aand tthe eeconomy iin 22006
Country PProfiles - SSweden
96
Like Finland, Sweden is mainly a generator of tourism, at home and abroad. The 2006figures for hotels and similar establishments showed a rise in both establishments and bedplaces (+1.7% and +1.9%, respectively), mirroring the positive trend of 2005 (+1.3% and+3.9%). This result made up for the negative trend of hotels between 2000 and 2004 (-0.9%on average each year) and meant an increase in the average number of bed places perestablishment (107 in 2006 against 99 in 2000).
Tourism demand in the country registered good results in 2006 (+6.1% for total nights),consolidating the positive trend of the first five years of the 21st century. Nights spent byresidents (about 77% of total nights) rose by +5.4% (from 34.9 to 36.7 million), after growthof +5.8% in 2005. Similarly, nights spent by non-residents showed a positive trend over thewhole period (+4.0% on average each year), with a peak of +8.6% in 2006. Norway,Germany and Denmark were the top markets of origin, accounting for about 54% of totalinternational tourism nights. Norway ranked first with a share of 24.8%, showing an increasein its relative weight (21.6% in 2000). The ratio of tourists to residents in internal tourism(domestic + inbound) was 5.3 in 2006.
Comparing expenditure and receipts, tourism presented a negative balance of 1 930 millioneuro in 2006.
4.3 CCharacteristics oof ttourism ssupply ((in hhotels aand ssimilarestablishments) iin SSweden
PopulationTourism intensity
Number oof SSwedishtourists 115 yyears aand
overGDP
Tourismexpenditure
Tourismreceipts
in 11 0000Tourist nnights/
residentpopulation
in 11 0000as %% oof
populationMio. €€ Mio. €€ Mio. €€
9 048 5.3 : : 313 327 9 181 7 251
Number oofestablishments
Number oofbedrooms
Number oofbed pplaces
Occupancy rrate of bbed pplaces ((%)
annualaverage
peakmonth
2000 1 906 96 094 188 289 30.9 50.0 (Jul)
2004 1 833 98 888 189 988 31.0 48.5 (Jul)
2005 1 857 100 155 197 470 31.8 46.9 (Jul)
2006 1 888 101 651 201 316 32.9 48.9 (Jul)

Country PProfiles - SSweden
97
4.4 CCharacteristics oof ttourism ddemand iin SSweden ((domestic aand iinbound)
4.5 CCharacteristics oof SSwedish ttourists aaged 115 aand oover ((domestic aand aabroad)
Nights sspent iin ccollective aaccommodation Nights sspent bby nnon-rresidents, bby mmain ccountries oof oorigin(as %% oof aall nnights sspent bby nnon-rresidents iin ccollective aaccommodation)Total by rresidents by nnon-rresidents
in 11 0000 in 11 0000 as %% oof ttotal in 11 0000 as %% oof ttotal 1st mmarket 2nd mmarket 3rd mmarket Share oof ttop 33
2000 39 809 31 155 78.3 8 654 21.7 NO 21.6 DE 20.8 DK 9.6 52.0
2004 42 666 32 942 77.2 9 724 22.8 NO 26.0 DE 18.0 DK 9.9 53.9
2005 44 940 34 862 77.6 10 078 22.4 NO 24.5 DE 19.3 DK 9.7 53.5
2006 47 697 36 754 77.1 10 943 22.9 NO 24.8 DE 19.4 DK 9.5 53.7
Holiday ttrips bby rresident ttourists Holiday ttrips aabroad oof 44+ nnights ((in %%) bby mmain ccountries oof ddestination
Total ((domestic aand aabroad) Domestic Abroad
1st mmarket 2nd mmarket 3rd mmarketShare oof
top 33Total 1-33 nnights 4+ nnights Total 1-33 nnights 4+ nnights Total 1-33 nnights 4+ nnights
in 11 0000 in 11 0000 in 11 0000 in 11 0000 in 11 0000 in 11 0000 in 11 0000 in 11 0000 in 11 0000
2000 : : : : : : : : : : : : : : : :
2004 : : : : : : : : : : : : : : : :
2005 : : : : : : : : : : : : : : : :
2006 : : : : : : : : : : : : : : : :

4.1 RRecent ttrends 4.2 PPeople aand tthe eeconomy iin 22006
Country PProfiles - UUnited KKingdom
98
The United Kingdom is one of the major generators of international tourism in the world.Figures on accommodation supply revealed a mixed picture at the beginning of the 21stcentury. The number of hotels and similar establishments showed a decline between 2000and 2006 (-2.6% on average each year). Over the same period, bed places recorded anincrease from 2000 to 2004 (+2.2% on average each year), followed by a strongcontraction in 2005 (-13.1%) and a new expansion in 2006 (+18.2%). This trend resultedin growth in the average size of establishments (from 25 in 2000 to 32 in 2006).Tourism demand showed an up-and-down trend over this period. Total nights suffered adecline from 2000 to 2004 (-4,8% on average each year). Then they enjoyed a strongrecovery in 2005 (+21.2%) – reverting back to the same level as in 2000 – and a new fallin 2006 (-5.1%). This trend was completely driven by domestic demand, which accountedfor about 66% of total tourism nights in 2006. Nights spent by residents decreased from207.9 million in 2000 to 157.6 million in 2004 (-6.7% on average each year), rose by+26.0% in 2005 but followed by a decline of -11.7% in 2006. In contrast, nights spent bynon-residents have shown steady growth since 2000, with a peak of +10.9% between 2005and 2006. The United States, Germany and France were the top markets of origin,accounting for 36.2% of total international tourism nights. The ratio of tourists to residents ininternal tourism (domestic + inbound) was 4.4 in 2006.As regards national tourism, British tourists made about 113 million holiday trips in 2006, adrop of -4.9% on average each year between 2000 and 2006. The fall was caused aboveall by the decrease in domestic trips (-7.0% on average each year), which accounted forabout 61% of total holiday trips. Conversely, trips abroad declined by -1.0% per year onaverage over the same period. Spain, France and the United States were the preferreddestinations of British tourists, accounting for 45.5% of 4+ night holiday trips abroad (49.0%in 2000). Comparing expenditure and receipts, tourism presented a negative balance of23 422 million euro in 2006.
4.3 CCharacteristics oof ttourism ssupply ((in hhotels aand ssimilarestablishments) iin tthe UUnited KKingdom
PopulationTourism intensity
Number oof ttourists ffromthe UUnited KKingdom 115
years aand ooverGDP
Tourismexpenditure
Tourismreceipts
in 11 0000Tourist nnights/
residentpopulation
in 11 0000as %% oof
populationMio. €€ Mio. €€ Mio. €€
60 393 4.4 30 150 60.8 1 912 154 50 305 26 883
Number oofestablishments
Number oofbedrooms
Number oofbed pplaces
Occupancy rrate of bbed pplaces ((%)
annualaverage
peakmonth
2000 45 728 553 699 1 119 433 47.0 57.0 (Aug)
2004 44 625 606 881 1 223 047 35.9 58.0 (Aug)
2005 32 926 518 028 1 062 342 45.6 56.0 (Aug)
2006 39 107 616 764 1 255 693 36.4 61.0 (Aug)

Country PProfiles - UUnited KKingdom
99
4.4 CCharacteristics oof ttourism ddemand iin tthe UUnited KKingdom ((domestic aand iinbound)
4.5 CCharacteristics oof ttourists ffrom tthe UUnited KKingdom aaged 115 aand oover ((domestic aand aabroad)
Holiday ttrips bby rresident ttourists Holiday ttrips aabroad oof 44+ nnights ((in %%) bby mmain ccountries oof ddestination
Total ((domestic aand aabroad) Domestic Abroad
1st mmarket 2nd mmarket 3rd mmarketShare oof
top 33Total 1-33 nnights 4+ nnights Total 1-33 nnights 4+ nnights Total 1-33 nnights 4+ nnights
in 11 0000 in 11 0000 in 11 0000 in 11 0000 in 11 0000 in 11 0000 in 11 0000 in 11 0000 in 11 0000
2000 152 700 74 700 78 000 106 100 67 400 38 700 46 600 7 300 39 300 ES 28.1 FR 11.5 US 9.4 49.0
2004 122 975 56 975 66 000 74 772 47 472 27 300 48 203 9 503 38 700 ES 31.8 FR 11.5 US 7.4 50.7
2005 : : 66 420 77 132 46 812 30 320 : : 36 100 ES 30.0 FR 11.7 US 7.3 49.0
2006 112 695 50 874 61 821 68 722 40 201 28 521 43 973 10 673 33 300 ES 27.9 FR 11.1 US 6.5 45.5
Nights sspent iin ccollective aaccommodation Nights sspent bby nnon-rresidents, bby mmain ccountries oof oorigin(as %% oof aall nnights sspent bby nnon-rresidents iin ccollective aaccommodation)Total by rresidents1 by nnon-rresidents
in 11 0000 in 11 0000 as %% oof ttotal in 11 0000 as %% oof ttotal 1st mmarket 2nd mmarket 3rd mmarket Share oof ttop 33
2000 281 756 207 940 73.8 73 816 26.2 US 21.8 DE 8.4 FR 6.0 36.2
2004 231 411 157 550 68.1 73 861 31.9 US 20.3 DE 9.3 FR 7.1 36.7
2005 280 385 198 562 70.8 81 823 29.2 US 15.7 DE 10.0 FR 6.4 32.1
2006 266 013 175 272 65.9 90 741 34.1 US 17.7 DE 11.2 FR 7.3 36.2
1) Change in methodology from 2005 onwards.
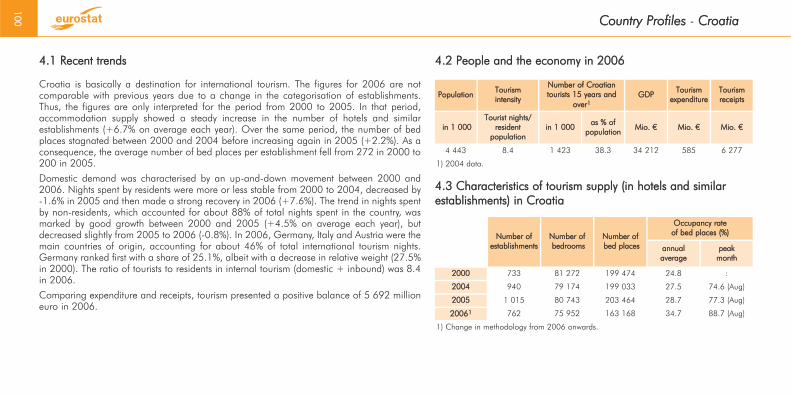
4.1 RRecent ttrends 4.2 PPeople aand tthe eeconomy iin 22006
Country PProfiles - CCroatia
100
Croatia is basically a destination for international tourism. The figures for 2006 are notcomparable with previous years due to a change in the categorisation of establishments.Thus, the figures are only interpreted for the period from 2000 to 2005. In that period,accommodation supply showed a steady increase in the number of hotels and similarestablishments (+6.7% on average each year). Over the same period, the number of bedplaces stagnated between 2000 and 2004 before increasing again in 2005 (+2.2%). As aconsequence, the average number of bed places per establishment fell from 272 in 2000 to200 in 2005.
Domestic demand was characterised by an up-and-down movement between 2000 and2006. Nights spent by residents were more or less stable from 2000 to 2004, decreased by-1.6% in 2005 and then made a strong recovery in 2006 (+7.6%). The trend in nights spentby non-residents, which accounted for about 88% of total nights spent in the country, wasmarked by good growth between 2000 and 2005 (+4.5% on average each year), butdecreased slightly from 2005 to 2006 (-0.8%). In 2006, Germany, Italy and Austria were themain countries of origin, accounting for about 46% of total international tourism nights.Germany ranked first with a share of 25.1%, albeit with a decrease in relative weight (27.5%in 2000). The ratio of tourists to residents in internal tourism (domestic + inbound) was 8.4in 2006.
Comparing expenditure and receipts, tourism presented a positive balance of 5 692 millioneuro in 2006.
4.3 CCharacteristics oof ttourism ssupply ((in hhotels aand ssimilarestablishments) iin CCroatia
PopulationTourism intensity
Number oof CCroatiantourists 115 yyears aand
over1GDP
Tourismexpenditure
Tourismreceipts
in 11 0000Tourist nnights/
residentpopulation
in 11 0000as %% oof
populationMio. €€ Mio. €€ Mio. €€
4 443 8.4 1 423 38.3 34 212 585 6 277
1) 2004 data.
Number oofestablishments
Number oofbedrooms
Number oofbed pplaces
Occupancy rrate of bbed pplaces ((%)
annualaverage
peakmonth
2000 733 81 272 199 474 24.8 :
2004 940 79 174 199 033 27.5 74.6 (Aug)
2005 1 015 80 743 203 464 28.7 77.3 (Aug)
20061 762 75 952 163 168 34.7 88.7 (Aug)
1) Change in methodology from 2006 onwards.

Country PProfiles - CCroatia
101
4.4 CCharacteristics oof ttourism ddemand iin CCroatia ((domestic aand iinbound)
4.5 CCharacteristics oof CCroatian ttourists aaged 115 aand oover ((domestic aand aabroad)
Nights sspent iin ccollective aaccommodation Nights sspent bby nnon-rresidents, bby mmain ccountries oof oorigin(as %% oof aall nnights sspent bby nnon-rresidents iin ccollective aaccommodation)Total by rresidents by nnon-rresidents
in 11 0000 in 11 0000 as %% oof ttotal in 11 0000 as %% oof ttotal 1st mmarket 2nd mmarket 3rd mmarket Share oof ttop 33
2000 30 858 4 224 13.7 26 634 86.3 : : : : : : :
2004 35 991 4 240 11.8 31 751 88.2 DE 27.5 IT 12.0 AT 9.4 48.9
2005 37 292 4 172 11.2 33 120 88.8 DE 25.6 IT 11.7 AT 9.0 46.3
2006 37 345 4 487 12.0 32 858 88.0 DE 25.1 IT 11.2 AT 9.6 45.9
Holiday ttrips bby rresident ttourists Holiday ttrips aabroad oof 44+ nnights ((in %%) bby mmain ccountries oof ddestination1
Total ((domestic aand aabroad) Domestic Abroad
1st mmarket 2nd mmarket 3rd mmarketShare oof
top 33Total 1-33 nnights 4+ nnights Total 1-33 nnights 4+ nnights Total 1-33 nnights 4+ nnights
in 11 0000 in 11 0000 in 11 0000 in 11 0000 in 11 0000 in 11 0000 in 11 0000 in 11 0000 in 11 0000
2000 : : : : : : : : : : : : : : : :
2004 : : 1 798 : : 1 440 : : 358 IT 20.6 BA 11.5 AT 11.4 43.5
2005 : : : : : : : : : : : : : : : :
2006 : : : : : : : : : : : : : : : :
1) Information partly based on additional data provided by the national statistical institute of Croatia, complementary to the data collected under Directive 95/57/EC.

4.1 RRecent ttrends 4.2 PPeople aand tthe eeconomy iin 22006
Country PProfiles - TThe fformer YYugoslav RRepublic oof MMacedonia
102
The former Yugoslav Republic of Macedonia is, together with Croatia and Turkey, one of thethree candidate countries to join the EU and a potential destination of international tourism.At the moment, there are only figures for the reference year 2000 available, which read 145hotels and similar establishments and 15 950 bed places, corresponding to an average sizeper hotel of 110 bed places. As regards tourism demand, 1.4 million total nights were spentin the country in 2000, of which 67.0% by residents.
4.3 CCharacteristics oof ttourism ssupply ((in hhotels aand ssimilarestablishments) iin tthe fformer YYugoslav RRepublic oof MMacedonia
PopulationTourism intensity
Number oof MMacedoniantourists 115 yyears aand
overGDP
Tourismexpenditure
Tourismreceipts
in 11 0000Tourist nnights/
residentpopulation
in 11 0000as %% oof
populationtotal
Mio. €€Mio. €€ Mio. €€
2 039 : : : 5 046 : :
Number oofestablishments
Number oofbedrooms
Number oofbed pplaces
Occupancy rrate of bbed pplaces ((%)
annualaverage
peakmonth
2000 145 6 646 15 950 15.2 :
2004 : : : : :
2005 : : : : :
2006 : : : : :

Country PProfiles - TThe fformer YYugoslav RRepublic oof MMacedonia
103
4.4 CCharacteristics oof ttourism ddemand iin tthe fformer YYugoslav RRepublic oof MMacedonia ((domestic aand iinbound)
4.5 CCharacteristics oof ttourists ffrom tthe fformer YYugoslav RRepublic oof MMacedonia aaged 115 aand oover ((domestic aand aabroad)
Nights sspent iin ccollective aaccommodation Nights sspent bby nnon-rresidents, bby mmain ccountries oof oorigin(as %% oof aall nnights sspent bby nnon-rresidents iin ccollective aaccommodation)Total by rresidents by nnon-rresidents
in 11 0000 in 11 0000 as %% oof ttotal in 11 0000 as %% oof ttotal 1st mmarket 2nd mmarket 3rd mmarket Share oof ttop 33
2000 1 420 952 67.0 468 33.0 : : : : : : :
2004 : : : : : : : : : : : :
2005 : : : : : : : : : : : :
2006 : : : : : : : : : : : :
Holiday ttrips bby rresident ttourists Holiday ttrips aabroad oof 44+ nnights ((in %%) bby mmain ccountries oof ddestination
Total ((domestic aand aabroad) Domestic Abroad
1st mmarket 2nd mmarket 3rd mmarketShare oof
top 33Total 1-33 nnights 4+ nnights Total 1-33 nnights 4+ nnights Total 1-33 nnights 4+ nnights
in 11 0000 in 11 0000 in 11 0000 in 11 0000 in 11 0000 in 11 0000 in 11 0000 in 11 0000 in 11 0000
2000 : : : : : : : : : : : : : : : :
2004 : : : : : : : : : : : : : : : :
2005 : : : : : : : : : : : : : : : :
2006 : : : : : : : : : : : : : : : :

4.1 RRecent ttrends 4.2 PPeople aand tthe eeconomy iin 22006
Country PProfiles - TTurkey
104
Turkey is basically a destination of international tourism. In 2000, hotel accommodationsupply comprised 1 814 establishments and 322 334 bed places. This is an average ofabout 178 bed places. This confirms that it is mainly enterprises belonging to hotel chainsthat are active on the supply market, offering travel packages for the international market.
The increasing importance of Turkey as a tourism destination is confirmed by the fact that thefigures for tourism expenditure and receipts have shown a positive balance for many years,with a value of 11 147 million euro in 2006.
4.3 CCharacteristics oof ttourism ssupply ((in hhotels aand ssimilarestablishments) iin TTurkey
PopulationTourism intensity
Number oof TTurkishtourists 115 yyears aand
overGDP
Tourismexpenditure
Tourismreceipts
in 11 0000Tourist nnights/
resident ppopulationin 11 0000
as %% oofpopulation
totalMio. €€
Mio. €€ Mio. €€
72 520 : : : 318 586 2 182 13 329
Number oofestablishments
Number oofbedrooms
Number oofbed pplaces
Occupancy rrate of bbed pplaces ((%)
annualaverage
peakmonth
2000 1 814 132 199 322 334 38.0 :
2004 : : : : :
2005 : : : : :
2006 : : : : :
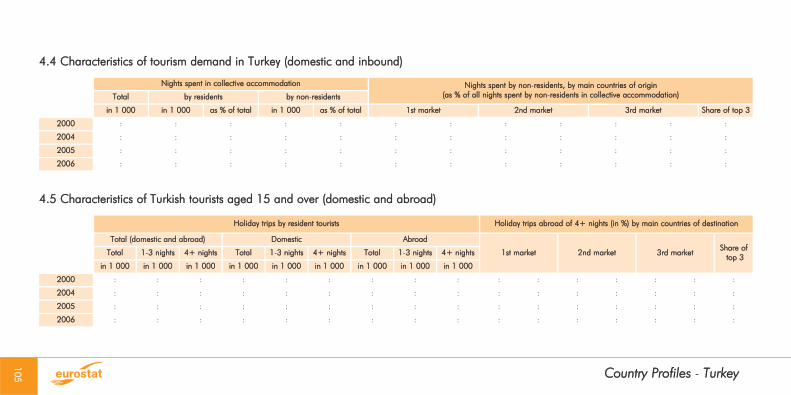
Country PProfiles - TTurkey
105
4.4 CCharacteristics oof ttourism ddemand iin TTurkey ((domestic aand iinbound)
4.5 CCharacteristics oof TTurkish ttourists aaged 115 aand oover ((domestic aand aabroad)
Nights sspent iin ccollective aaccommodation Nights sspent bby nnon-rresidents, bby mmain ccountries oof oorigin(as %% oof aall nnights sspent bby nnon-rresidents iin ccollective aaccommodation)Total by rresidents by nnon-rresidents
in 11 0000 in 11 0000 as %% oof ttotal in 11 0000 as %% oof ttotal 1st mmarket 2nd mmarket 3rd mmarket Share oof ttop 33
2000 : : : : : : : : : : : :
2004 : : : : : : : : : : : :
2005 : : : : : : : : : : : :
2006 : : : : : : : : : : : :
Holiday ttrips bby rresident ttourists Holiday ttrips aabroad oof 44+ nnights ((in %%) bby mmain ccountries oof ddestination
Total ((domestic aand aabroad) Domestic Abroad
1st mmarket 2nd mmarket 3rd mmarketShare oof
top 33Total 1-33 nnights 4+ nnights Total 1-33 nnights 4+ nnights Total 1-33 nnights 4+ nnights
in 11 0000 in 11 0000 in 11 0000 in 11 0000 in 11 0000 in 11 0000 in 11 0000 in 11 0000 in 11 0000
2000 : : : : : : : : : : : : : : : :
2004 : : : : : : : : : : : : : : : :
2005 : : : : : : : : : : : : : : : :
2006 : : : : : : : : : : : : : : : :

4.1 RRecent ttrends 4.2 PPeople aand tthe eeconomy iin 22006
Country PProfiles - IIceland
106
Iceland is a small country of origin and destination of international tourism within theEuropean market. The 2006 figures on accommodation supply showed a downturn after thepositive trend recorded since 2000 (+5.5% on average each year between 2000 and 2005).The number of hotels and similar establishments declined by -3.4% (from 319 in 2005 to308 in 2006). In contrast, the number of bed places showed steady growth over the sameperiod (+5.1% on average each year from 2000 to 2006). Consequently, the average sizeof establishments rose to 55 bed places in 2006, compared to 51 in 2000.
Like bed places, tourism demand in the country has expanded steadily since 2000 (averageannual increase of +5.6%). Domestic nights, accounting for about 30% of total nights,showed an average annual increase of +3.5%, with peak growth of +8.4% in 2006. Nightsspent by non-residents followed the same trend, but at a higher rate. The average annualgrowth was +6.7% between 2000 and 2006, with a peak of +11.0% in 2006. Germany,the United Kingdom and the United States were the main countries of origin, accounting for40.1% of total nights spent by non-residents on the island (43.0% in 2000).
The ratio of tourists to residents in total tourism in the country (domestic + inbound) was 8.0in 2006.
Comparing expenditure and receipts, tourism presented a negative balance of 525 millioneuro in 2006.
4.3 CCharacteristics oof ttourism ssupply ((in hhotels aand ssimilarestablishments) iin IIceland
PopulationTourism intensity
Number oof IIcelandictourists 115 yyears aand
overGDP
Tourismexpenditure
Tourismreceipts
in 11 0000Tourist nnights/
residentpopulation
in 11 0000as %% oof
populationMio. €€ Mio. €€ Mio. €€
300 8.0 : : 13 251 873 348
Number oofestablishments
Number oofbedrooms
Number oofbed pplaces
Occupancy rrate of bbed pplaces ((%)
annualaverage
peakmonth
2000 244 6 045 12 471 26.1 65.2 (Jul)
2004 303 7 396 15 223 26.4 66.5 (Jul)
2005 319 8 005 16 639 25.8 64.0 (Jul)
2006 308 8 025 16 849 28.1 67.3 (Jul)

Country PProfiles - IIceland
107
4.4 CCharacteristics oof ttourism ddemand iin IIceland ((domestic aand iinbound)
4.5 CCharacteristics oof IIcelandic ttourists aaged 115 aand oover ((domestic aand aabroad)
Nights sspent iin ccollective aaccommodation Nights sspent bby nnon-rresidents, bby mmain ccountries oof oorigin(as %% oof aall nnights sspent bby nnon-rresidents iin ccollective aaccommodation)Total by rresidents by nnon-rresidents
in 11 0000 in 11 0000 as %% oof ttotal in 11 0000 as %% oof ttotal 1st mmarket 2nd mmarket 3rd mmarket Share oof ttop 33
2000 1 737 590 34.0 1 147 66.0 DE 19.6 UK 12.7 US 10.7 43.0
2004 2 134 655 30.7 1 479 69.3 DE 18.4 UK 14.1 US 9.2 41.7
2005 2 189 668 30.5 1 521 69.5 DE 17.5 UK 13.5 US 10.2 41.2
2006 2 412 724 30.0 1 688 70.0 DE 16.5 UK 14.5 US 9.1 40.1
Holiday ttrips bby rresident ttourists Holiday ttrips aabroad oof 44+ nnights ((in %%) bby mmain ccountries oof ddestination
Total ((domestic aand aabroad) Domestic Abroad
1st mmarket 2nd mmarket 3rd mmarketShare oof
top 33Total 1-33 nnights 4+ nnights Total 1-33 nnights 4+ nnights Total 1-33 nnights 4+ nnights
in 11 0000 in 11 0000 in 11 0000 in 11 0000 in 11 0000 in 11 0000 in 11 0000 in 11 0000 in 11 0000
2000 : : : : : : : : : : : : : : : :
2004 : : : : : : : : : : : : : : : :
2005 : : : : : : : : : : : : : : : :
2006 : : : : : : : : : : : : : : : :

4.1 RRecent ttrends 4.2 PPeople aand tthe eeconomy iin 22006
Country PProfiles - LLiechtenstein
108
Liechtenstein is mainly a destination for international tourists. In 2006, accommodationsupply consisted of 46 hotels and similar establishments (50 in 2000, -1.4% on averageeach year) and 1 263 bed places (1 184 in 2000, +1.1% on average each year). Theincrease in bed places led to growth in the average size of establishments (28 bed places in2006, against 24 in 2000).
Tourism demand in the country recovered between 2004 and 2006 (+2.4% on averageeach year), after a downward trend since 2000 (-3.5% on average each year). The growthof the last two years was driven by the good performance of international tourism. Nightsspent by non-residents, which accounted for about 91% of total nights, rose from 145 000in 2004 to 155 000 in 2006 (+3.4% on average each year). Conversely, domestic nightsdeclined by -2.7% on average each year between 2000 and 2004 and by -6.1% each yearbetween 2004 and 2006. Switzerland, Germany and Austria were the main markets of origin(around 71% of total international nights), with Austria overtaking the United States in 2006in third position. Switzerland alone accounted for almost a third of total nights spent by non-residents in 2006 (28.5% in 2000).
The ratio of tourists to residents in total tourism in the country (domestic + inbound) was 4.9in 2006.
4.3 CCharacteristics oof ttourism ssupply ((in hhotels aand ssimilarestablishments) iin LLiechtenstein
PopulationTourism intensity
Number oof ttouristsfrom LLiechtenstein 115
years aand ooverGDP1 Tourism
expenditureTourismreceipts
in 11 0000Tourist nnights/
resident ppopulationin 11 0000
as %% oofpopulation
Mio. €€ Mio. €€ Mio. €€
35 4.9 : : 2 772 : :
1) 2004 data.
Number oofestablishments
Number oofbedrooms
Number oofbed pplaces
Occupancy rrate of bbed pplaces ((%)
annualaverage
peakmonth
2000 50 : 1 184 30.8 38.0 (Mar)
2004 45 572 1 176 24.2 32.5 (Feb)
2005 46 608 1 189 25.6 36.5 (Feb)
2006 46 646 1 263 25.6 31.4 (Feb)

Country PProfiles - LLiechtenstein
109
4.4 CCharacteristics oof ttourism ddemand iin LLiechtenstein ((domestic aand iinbound)
4.5 CCharacteristics oof ttourists ffrom LLiechtenstein aaged 115 aand oover ((domestic aand aabroad)
Holiday ttrips bby rresident ttourists Holiday ttrips aabroad oof 44+ nnights ((in %%) bby mmain ccountries oof ddestination
Total ((domestic aand aabroad) Domestic Abroad
1st mmarket 2nd mmarket 3rd mmarketShare oof
top 33Total 1-33 nnights 4+ nnights Total 1-33 nnights 4+ nnights Total 1-33 nnights 4+ nnights
in 11 0000 in 11 0000 in 11 0000 in 11 0000 in 11 0000 in 11 0000 in 11 0000 in 11 0000 in 11 0000
2000 : : : : : : : : : : : : : : : :
2004 : : : : : : : : : : : : : : : :
2005 : : : : : : : : : : : : : : : :
2006 : : : : : : : : : : : : : : : :
Nights sspent iin ccollective aaccommodation Nights sspent bby nnon-rresidents, bby mmain ccountries oof oorigin(as %% oof aall nnights sspent bby nnon-rresidents iin ccollective aaccommodation)Total by rresidents by nnon-rresidents
in 11 0000 in 11 0000 as %% oof ttotal in 11 0000 as %% oof ttotal 1st mmarket 2nd mmarket 3rd mmarket Share oof ttop 33
2000 187 19 10.2 168 89.8 DE 37.4 CH 28.5 AT 4.7 70.6
2004 162 17 10.5 145 89.5 CH 36.1 DE 33.6 AT 3.1 72.8
2005 165 16 9.7 149 90.3 CH 34.6 DE 32.6 US 3.5 70.7
2006 170 15 8.8 155 91.2 CH 33.9 DE 33.1 AT 3.9 70.9
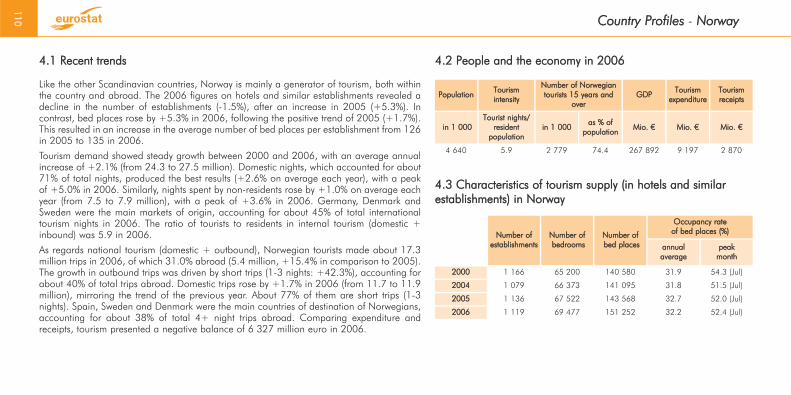
4.1 RRecent ttrends 4.2 PPeople aand tthe eeconomy iin 22006
Country PProfiles - NNorway
110
Like the other Scandinavian countries, Norway is mainly a generator of tourism, both withinthe country and abroad. The 2006 figures on hotels and similar establishments revealed adecline in the number of establishments (-1.5%), after an increase in 2005 (+5.3%). Incontrast, bed places rose by +5.3% in 2006, following the positive trend of 2005 (+1.7%).This resulted in an increase in the average number of bed places per establishment from 126in 2005 to 135 in 2006.
Tourism demand showed steady growth between 2000 and 2006, with an average annualincrease of +2.1% (from 24.3 to 27.5 million). Domestic nights, which accounted for about71% of total nights, produced the best results (+2.6% on average each year), with a peakof +5.0% in 2006. Similarly, nights spent by non-residents rose by +1.0% on average eachyear (from 7.5 to 7.9 million), with a peak of +3.6% in 2006. Germany, Denmark andSweden were the main markets of origin, accounting for about 45% of total internationaltourism nights in 2006. The ratio of tourists to residents in internal tourism (domestic +inbound) was 5.9 in 2006.
As regards national tourism (domestic + outbound), Norwegian tourists made about 17.3million trips in 2006, of which 31.0% abroad (5.4 million, +15.4% in comparison to 2005).The growth in outbound trips was driven by short trips (1-3 nights: +42.3%), accounting forabout 40% of total trips abroad. Domestic trips rose by +1.7% in 2006 (from 11.7 to 11.9million), mirroring the trend of the previous year. About 77% of them are short trips (1-3nights). Spain, Sweden and Denmark were the main countries of destination of Norwegians,accounting for about 38% of total 4+ night trips abroad. Comparing expenditure andreceipts, tourism presented a negative balance of 6 327 million euro in 2006.
4.3 CCharacteristics oof ttourism ssupply ((in hhotels aand ssimilarestablishments) iin NNorway
PopulationTourismintensity
Number oof NNorwegiantourists 115 yyears aand
overGDP
Tourismexpenditure
Tourismreceipts
in 11 0000Tourist nnights/
residentpopulation
in 11 0000as %% oof
populationMio. €€ Mio. €€ Mio. €€
4 640 5.9 2 779 74.4 267 892 9 197 2 870
Number oofestablishments
Number oofbedrooms
Number oofbed pplaces
Occupancy rrate of bbed pplaces ((%)
annualaverage
peakmonth
2000 1 166 65 200 140 580 31.9 54.3 (Jul)
2004 1 079 66 373 141 095 31.8 51.5 (Jul)
2005 1 136 67 522 143 568 32.7 52.0 (Jul)
2006 1 119 69 477 151 252 32.2 52.4 (Jul)

Country PProfiles - NNorway
111
4.4 CCharacteristics oof ttourism ddemand iin NNorway ((domestic aand iinbound)
4.5 CCharacteristics oof NNorwegian ttourists aaged 115 aand oover ((domestic aand aabroad)
Nights sspent iin ccollective aaccommodation Nights sspent bby nnon-rresidents, bby mmain ccountries oof oorigin(as %% oof aall nnights sspent bby nnon-rresidents iin ccollective aaccommodation)Total by rresidents by nnon-rresidents
in 11 0000 in 11 0000 as %% oof ttotal in 11 0000 as %% oof ttotal 1st mmarket 2nd mmarket 3rd mmarket Share oof ttop 33
2000 24 270 16 801 69.2 7 469 30.8 DE 23.8 DK 14.5 SE 12.6 50.9
2004 25 274 17 832 70.6 7 442 29.4 DE 22.2 DK 14.1 SE 11.1 47.4
2005 26 272 18 628 70.9 7 644 29.1 DE 22.8 DK 13.9 SE 11.4 48.1
2006 27 488 19 567 71.2 7 921 28.8 DE 21.1 DK 12.9 SE 10.9 44.9
Holiday ttrips bby rresident ttourists Holiday ttrips aabroad oof 44+ nnights ((in %%) bby mmain ccountries oof ddestination
Total ((domestic aand aabroad) Domestic Abroad
1st mmarket 2nd mmarket 3rd mmarketShare oof
top 33Total 1-33 nnights 4+ nnights Total 1-33 nnights 4+ nnights Total 1-33 nnights 4+ nnights
in 11 0000 in 11 0000 in 11 0000 in 11 0000 in 11 0000 in 11 0000 in 11 0000 in 11 0000 in 11 0000
2000 : : 5 096 : : 2 702 : : 2 394 ES 19.3 EL 12.9 SE 11.8 44.0
2004 16 430 10 637 5 793 11 600 8 723 2 877 4 830 1 914 2 916 ES 19.0 DK 11.9 SE 11.0 41.9
2005 16 391 10 519 5 872 11 744 8 994 2 750 4 647 1 525 3 122 ES 17.9 SE 10.8 DK 10.0 38.7
2006 17 312 11 331 5 981 11 949 9 161 2 788 5 363 2 170 3 193 ES 17.1 SE 11.1 DK 9.7 37.9

4.1 RRecent ttrends 4.2 PPeople aand tthe eeconomy iin 22006
Country PProfiles - SSwitzerland
112
Switzerland, one of the EFTA countries, is a country of origin and destination for internationaltourism. In 2000, accommodation supply consisted of 5 754 hotels and similarestablishments and 259 721 bed places, which corresponds to an average of 45 bed placesper establishment.
As regards tourism demand, tourists spent about 68.8 million nights in Switzerland in 2000,of which 52.2% generated by domestic tourists. In terms of international tourism, Germany,the Netherlands and the United Kingdom were the top markets of origin, accounting forabout 57% of total international tourism nights, with Germany taking up about two-fifths.
4.3 CCharacteristics oof ttourism ssupply ((in hhotels aand ssimilarestablishments) iin SSwitzerland
Number oofestablishments
Number oofbedrooms
Number oofbed pplaces
Occupancy rrate of bbed pplaces ((%)
annualaverage
peakmonth
2000 5 754 140 805 259 721 35.8 50.0 (Aug)
2004 : : : : :
2005 : : : : :
2006 : : : : :
PopulationTourismintensity
Number oof SSwiss ttourists15 yyears aand oover
GDPTourism
expenditureTourismreceipts
in 11 0000Tourist nnights/
residentpopulation
in 11 0000as %% oof
populationMio. €€ Mio. €€ Mio. €€
7 459 : : : 309 096 : :

Country PProfiles - SSwitzerland
113
4.4 CCharacteristics oof ttourism ddemand iin SSwitzerland ((domestic aand iinbound)
4.5 CCharacteristics oof SSwiss ttourists aaged 115 aand oover ((domestic aand aabroad)
Nights sspent iin ccollective aaccommodation Nights sspent bby nnon-rresidents, bby mmain ccountries oof oorigin(as %% oof aall nnights sspent bby nnon-rresidents iin ccollective aaccommodation)Total by rresidents by nnon-rresidents
in 11 0000 in 11 0000 as %% oof ttotal in 11 0000 as %% oof ttotal 1st mmarket 2nd mmarket 3rd mmarket Share oof ttop 33
2000 68 777 35 933 52.2 32 844 47.8 DE 41.2 NL 8.6 UK 7.6 57.4
2004 : : : : : : : : : : : :
2005 : : : : : : : : : : : :
2006 : : : : : : : : : : : :
Holiday ttrips bby rresident ttourists Holiday ttrips aabroad oof 44+ nnights ((in %%) bby mmain ccountries oof ddestination
Total ((domestic aand aabroad) Domestic Abroad
1st mmarket 2nd mmarket 3rd mmarketShare oof
top 33Total 1-33 nnights 4+ nnights Total 1-33 nnights 4+ nnights Total 1-33 nnights 4+ nnights
in 11 0000 in 11 0000 in 11 0000 in 11 0000 in 11 0000 in 11 0000 in 11 0000 in 11 0000 in 11 0000
2000 : : : : : : : : : : : : : : : :
2004 : : : : : : : : : : : : : : : :
2005 : : : : : : : : : : : : : : : :
2006 : : : : : : : : : : : : : : : :


Annex - TTechnical NNotes

Technical NNotes
116
A. General IInformation oon ttourism sstatisticsTourism sstatistics –– ssources aand rrecent ddevelopments
In 1995, Council Directive 95/57/EC on the collection of statistical informationin the field of tourism provided all Member States with a set of guidelines forthe collection, compilation, processing and transmission of harmonisedCommunity statistical information on tourism demand and supply. The aim wasto establish a common information system on tourism statistics at Communitylevel. After that, a "Community Methodology on Tourism Statistics" waselaborated with the help of Member States, following Council Decision90/655/EEC, and was published in 1998. It set out the basic methodology fortourism supply and demand, tourism market segments (rural and regionalaspects of tourism, cultural tourism), statistics relating to tourism (tourismexpenditure and balance of payments, tourism costs, prices and tariffs,employment in tourism) and tourism and the environment.
The Community methodology is used as a benchmark for tourism statistics andconcepts, in order to produce harmonised basic tourism statistics and providea common basis for all kinds of possible applications and tools for tourismanalysis.
In recent years, there have been new developments within tourism itself and intourism methodology in Europe and in the world, which have made it necessaryto update the concepts and methodological framework.
At the same time, Tourism Satellite Accounts (TSA) have been introduced as anew tool for measuring the economic impact of tourism. In 2001, a "TouristSatellite Account: Recommended Methodological Framework" was publishedjointly by the Commission of the European Communities, the Organization forEconomic Co-operation and Development (OECD), the United Nations (UN)and the World Tourism Organization (UNWTO). These recommendations arebased on a common conceptual framework for the design of the TSA that wasestablished by an inter-secretariat working group.
At EU level, this has prompted a revision of the EC Directive and of theCommunity Methodology, which is currently under discussion. The revisionconcerns supply-side and demand-side data and will take into accountEurostat's six quality components: relevance, accuracy, timeliness andpunctuality, accessibility and clarity, comparability, and coherence.At world level, the World Tourism Organisation (a UN agency set up a few yearsago), is the leading institution for the collection and dissemination ofcomparable tourism-related statistics. The Organisation has developed aStatistical Programme that integrates the major lines of action common to othersister organisations within the UN system of international statistics, with specificprojects in the field of tourism.

Technical NNotes
117
Attention is focused on promoting the implementation of internationalstandards and TSA at a global level and adapting the TSA conceptualframework. In the last year a big effort has been devoted to the revision of the1993 Recommendations on Tourism Statistics that have been presented to theUnited Nations Statistical Commission (UNSC) in February 2008 for approval.The revision was needed because the Tourism Satellite Account (TSA) hasexpanded beyond the conceptual framework of the 1993 Recommendations.The key changes introduced to the existing framework include, among others:the identification of tourism in the balance of payments; the reconciliationbetween supply and demand; the relevance of supply side data as well asemployment statistics.Key ddrivers ffor tthe eevolution oof ttourism aand ttheir rrelevance ffor sstatisticsLooking at the developments that have recently impacted on tourism statisticsand definitions, they have been stimulated by the evolution of internationaltourism demand, in terms of both market size and characteristics. This evolutionrequires new concepts and tools to be developed in order to improve datageneration and collection.Various factors have shaped international tourism development in Europe in thelast three to four years and their effects also have relevance from the statisticalpoint of view. First of all, the enlargement of the European Union to 25countries in 2004 has given a new impetus to international tourism to and fromthese areas. The 2007 enlargement of the European Union with Bulgaria andRomania strengthened that process again.
These events contribute to increasing cross-border trade and co-operationbetween new and old Member States and then the development of intraregionaltourism. That poses new problems for the development of a common Europeaninformation system on tourism statistics.Another aspect to take into account is the regional "diversification", which hascharacterised both old and new Member states (e.g. Italy, Portugal, Greece,Czech Republic, etc.), with the transfer of power from central to localgovernments, including the tourism sector. On the one hand, decentralisationhas allowed regions to develop their own tourism plans and, on the other hand,it has also increased the fragmentation of roles and duties and led to a lack ofco-ordination in key areas like communication, marketing and promotion. Incountries where devolution is at an early stage of development, it has alsocaused some delays in data collection and transmission from local bodies tocentral governments and statistical institutions.A third issue is the emergence of new holiday patterns entailing the need tohave more information on specific market segments (e.g. business tourism,congress tourism, tourism in private accommodation, etc.) for economic andmarketing purposes. A number of methodological projects have been plannedat European level, which also involves the development of technical manualson statistics.

Technical NNotes
118
B. Terms aand ddefinitionsGeneral aand sstatistical tterms aand ddefinitionsAverage aannual ggrowth rrate: The year-on-year growth rate of a phenomenonover a specified period. It describes the rate at which a phenomenon has grownas though it had grown at a steady state (in %).
Employment ((total): Covers both employees and self-employed persons agedover 15 years, who are engaged in some productive activity that falls within theproduction boundary of the system.
Enterprise: An enterprise is defined as the smallest combination of legal unitsthat is an organizational unit producing goods or services, which benefits froma certain degree of autonomy in decision-making, especially for the allocationof its current resources. An enterprise carries out one or more activities at oneor more locations.
Gross ddomestic pproduct ((GDP): Final result of the production activity of residentproducer units. The expression GDP at current prices values the prices of theyear in question. The expression GDP at constant prices is a volume measureof GDP that is constructed by multiplying the values of a base year by fixed baseLaspeyres volume indices.
Population oon 11 JJanuary: The inhabitants of a given area on 1st January of theyear in question (or, in some cases, on 31st December of the previous year).The population is based on data from the most recent census adjusted by thecomponents of population change produced since the last census, or based onpopulation registers.
Population ddensity: Population on the 1st of January of the year in question (or,in some cases, on 31st December of the previous year) divided by the surfacein km2.
Surface: The surface area is composed of the total area of a country and ismeasured in km2.

Technical NNotes
119
Tourism sspecific tterms aand ddefinitionsAccommodation eestablishment: Local kind-of-activity unit (local KAU) whichprovides accommodation. Includes collective tourist accommodationestablishments and private tourist accommodation.
Business ttrip: It is recommended to use the term "trip" to describe tourism fromthe standpoint of the generating place or country (the origin). Business tripcovers the whole period that the person engages in tourism but for professionalpurposes.
Collective ttourist aaccommodation eestablishment: An accommodationestablishment that provides overnight lodging for the traveller in a room orsome other unit, but the number of places it provides must be greater than aspecified minimum for groups of persons exceeding a single family unit and allthe places in the establishment must come under a common commercial-typemanagement, even if it is non-profit-making. Includes hotels and similarestablishments, specialised establishments and other collective establishments.Coverage may differ from one country to another due to differences inmethodologies (f.i. data collection thresholds in terms of minimum number ofbed places).
Domestic ttourism: Activities of residents of a given country travelling to andstaying in places only within that country but outside their usual environment.
Holiday ttrip: It is recommended to use the term "trip" to describe tourism fromthe standpoint of the generating place or country (the origin). Holiday tripcovers the whole period that the person engages in tourism for leisure purposes.
Hotels aand ssimilar eestablishments: Hotels and similar establishments are typifiedas being arranged in rooms, in number exceeding a specified minimum; ascoming under a common management; as providing certain services includingroom service, daily bed-making and cleaning of sanitary facilities; as groupedin classes and categories according to the facilities and services provided; andas not falling in the category of specialised establishments.
Inbound ttourism: Activities of non-residents of a given country travelling to andstaying in places in that country and outside their usual environment.
International ttourism: Consists of inbound tourism and outbound tourism.
National ttourism: Comprises domestic tourism and outbound tourism.
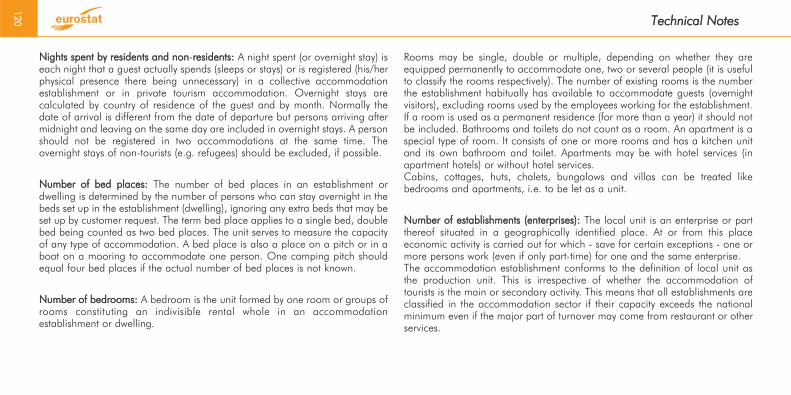
Technical NNotes
120
Nights sspent bby rresidents aand nnon-rresidents: A night spent (or overnight stay) iseach night that a guest actually spends (sleeps or stays) or is registered (his/herphysical presence there being unnecessary) in a collective accommodationestablishment or in private tourism accommodation. Overnight stays arecalculated by country of residence of the guest and by month. Normally thedate of arrival is different from the date of departure but persons arriving aftermidnight and leaving on the same day are included in overnight stays. A personshould not be registered in two accommodations at the same time. Theovernight stays of non-tourists (e.g. refugees) should be excluded, if possible.
Number oof bbed pplaces: The number of bed places in an establishment ordwelling is determined by the number of persons who can stay overnight in thebeds set up in the establishment (dwelling), ignoring any extra beds that may beset up by customer request. The term bed place applies to a single bed, doublebed being counted as two bed places. The unit serves to measure the capacityof any type of accommodation. A bed place is also a place on a pitch or in aboat on a mooring to accommodate one person. One camping pitch shouldequal four bed places if the actual number of bed places is not known.
Number oof bbedrooms: A bedroom is the unit formed by one room or groups ofrooms constituting an indivisible rental whole in an accommodationestablishment or dwelling.
Rooms may be single, double or multiple, depending on whether they areequipped permanently to accommodate one, two or several people (it is usefulto classify the rooms respectively). The number of existing rooms is the numberthe establishment habitually has available to accommodate guests (overnightvisitors), excluding rooms used by the employees working for the establishment.If a room is used as a permanent residence (for more than a year) it should notbe included. Bathrooms and toilets do not count as a room. An apartment is aspecial type of room. It consists of one or more rooms and has a kitchen unitand its own bathroom and toilet. Apartments may be with hotel services (inapartment hotels) or without hotel services.Cabins, cottages, huts, chalets, bungalows and villas can be treated likebedrooms and apartments, i.e. to be let as a unit.
Number oof eestablishments ((enterprises): The local unit is an enterprise or partthereof situated in a geographically identified place. At or from this placeeconomic activity is carried out for which - save for certain exceptions - one ormore persons work (even if only part-time) for one and the same enterprise. The accommodation establishment conforms to the definition of local unit asthe production unit. This is irrespective of whether the accommodation oftourists is the main or secondary activity. This means that all establishments areclassified in the accommodation sector if their capacity exceeds the nationalminimum even if the major part of turnover may come from restaurant or otherservices.

Technical NNotes
121
Occupancy rrate: The occupancy rate is calculated as follows: (Total nights of residents and non-residents of hotels and similar establishments)/ (Total bed places of hotels and similar establishments * 365)*100.
Other ccollective aaccommodation eestablishments: Any establishment, intendedfor tourists, which may be non-profit making, coming under a commonmanagement, providing minimum common services (not including daily bed-making) and not necessarily being arranged in rooms but perhaps indwelling–type units, campsites or collective dormitories and often engaging insome activity besides the provision of accommodation, such as health care,social welfare or transport.
Outbound ttourism: Activities of residents of a given country travelling to andstaying in places outside that country and outside their usual environment.
Tourism iintensity ((ratio ttourist nnights/resident ppopulation): This indicatorcompares the number of tourists (in terms of overnight stays) to the number ofresidents that are present in a destination in the same time period (e.g. a day,a month, a year). It measures the intensity of tourism demand in that period andis one of the indicators used to measure the carrying capacity of a touristdestination. It is a factor representing the number of nights spent in a country
divided by the inhabitants of the same country. This refers to table 4.2 in thecountry profiles where the ratio is calculated by dividing the population (firstcolumn of table 4.2) by the total number of overnight stays (first column of table4.4).
Tourism bbalance: Difference between international tourism receipts andexpenditures. In countries that are basically destinations of international tourismthe difference is usually positive (i.e. receipts overcome expenditure). Thismeans that the economy gains from tourism. On the contrary, countries that aremainly generators of international tourism generally show a negative balance(i.e. expenditure overcome receipts). This means that their economy looses fromtourism, because expenses made by residents abroad are higher than thosemade by international tourists in the country.
Tourism eexpenditure: Total consumption expenditure made by a visitor, or onbehalf of a visitor, for and during his/her trip and stay at destination.
Tourism rreceipt: Expenditure of international inbound tourists including theirpayments to international carriers for international transport.

Technical NNotes
122
C. Signs aand aabbreviationsSigns:
: . . . . . . . .not available
e . . . . . . .country estimate
u . . . . . . .unreliable or uncertain data
mio . . . . . .million
Country aabbreviations:
EU-227 . . . .European Union of 27 countries
EU-225 . . . .European Union of 25 countries
BE . . . . . . .Belgium
BG . . . . .Bulgaria
CZ . . . . . .Czech Republic
DK . . . . . .Denmark
DE . . . . . .Germany
EE . . . . . . .Estonia
IE . . . . . . .Ireland
EL . . . . . . .Greece
ES . . . . . . .Spain
FR . . . . . . .France
IT . . . . . . .Italy
CY . . . . . .Cyprus
LV . . . . . . .Latvia
LT . . . . . .Lithuania
LU . . . . . .Luxembourg
HU . . . . . .Hungary
MT . . . . . .Malta
NL . . . . . .Netherlands
AT . . . . . .Austria
PL . . . . . . .Poland
PT . . . . . . .Portugal
RO . . . . . .Romania
SI . . . . . . .Slovenia
SK . . . . . .Slovakia
FI . . . . . . .Finland
SE . . . . . . .Sweden
UK . . . . . .United Kingdom
HR . . . . . .Croatia
MK1 . . . . .The former Yugoslav Republicof Macedonia
TR . . . . . . .Turkey
IS . . . . . . .Iceland
LI . . . . . . .Liechtenstein
NO . . . . . .Norway
CH . . . . . .Switzerland
BA . . . . . .Bosnia and HerzegowinaUS . . . . . .United States of America
1) In tables and figures the code “MK” is used. This is a provisional code which does not prejudge in any way the definitive nomenclature for this country, which will be agreed following the conclusion ofnegotiations currently taking place on this subject at the United Nations.
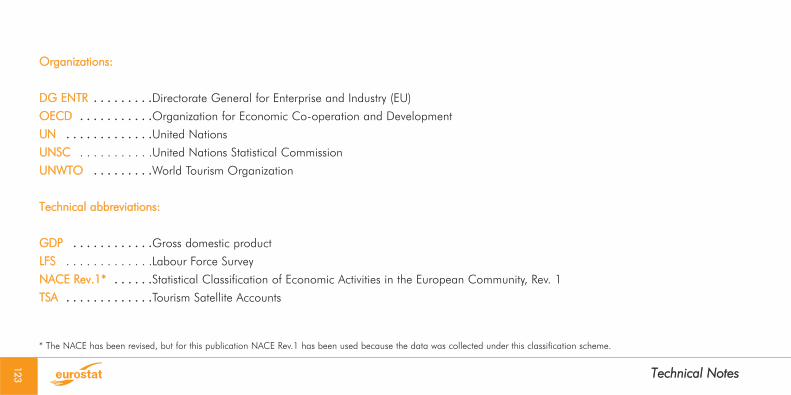
Technical NNotes
123
Organizations:
DG EENTR .. .. .. .. .. .. .. .. ..Directorate General for Enterprise and Industry (EU)
OECD .. .. .. .. .. .. .. .. .. .. ..Organization for Economic Co-operation and Development
UN .. .. .. .. .. .. .. .. .. .. .. .. ..United Nations
UNSC . . . . . . . . . . .United Nations Statistical Commission
UNWTO .. .. .. .. .. .. .. .. ..World Tourism Organization
Technical aabbreviations:
GDP .. .. .. .. .. .. .. .. .. .. .. ..Gross domestic product
LFS . . . . . . . . . . . . .Labour Force Survey
NACE RRev.1* .. .. .. .. .. ..Statistical Classification of Economic Activities in the European Community, Rev. 1
TSA .. .. .. .. .. .. .. .. .. .. .. .. ..Tourism Satellite Accounts
* The NACE has been revised, but for this publication NACE Rev.1 has been used because the data was collected under this classification scheme.

Technical NNotes
124
D. Classifications
Section HH Hotels aand rrestaurants
55 Hotels and restaurants
55.1 Hotels
55.10 Hotels
55.2 Camping sites and other provision of short-stay accommodation
55.21 Youth hostels and mountain refuges
55.22 Camping sites, including caravan sites
55.23 Other provision of lodgings n.e.c.
55.3 Restaurants
55.30 Restaurants
55.4 Bars
55.40 Bars
55.5 Canteens and catering
55.51 Canteens
55.52 Catering
Section II Transport, sstorage aand ccommunication
63.3 Activities of travel agencies and tour operators; tourist assistance activities n.e.c.
63.30 Activities of travel agencies and tour operators; tourist assistance activities n.e.c.
Nace RRev.1 cclassification ((parts rrelevant tto ttourism)

Technical NNotes
125
E. Data ssourcesName Web aaddress Sources uused
Eurostat http://ec.europa.eu/eurostat Free ddissemination ddatabase
Chapter 11
Eurostat - TTourism sstatistics http://ec.europa.eu/eurostat/tourism
Table 1.1 Theme: Population and social conditions - Population - Demography
Tables 1.2 and 1.3 Theme: Economy and finance - National accounts (including GDP)
Tables 1.4 Theme: Population and social conditions - Labour market (Labour Force Survey)
Chapter 22
Tables 2.1 and 2.2 Theme: Industry, trade and services - Tourism
Table 2.3 Theme: Industry, trade and services - Structural Business Statistics - Annual enterprise statistics
Tables and figures 2.4 Theme: Population and social conditions - Labour market (Labour Force Survey)
Chapter 33
All tables and figures (except figure 3.1.2) Theme: Industry, trade and services - Tourism
Additional sources used for:
Figure 3.1.2 Theme: Economy and finance - National accounts (including GDP)
Table 3.2.5 and 3.4.1 Theme: Population and social conditions - Population
Tables 3.3 and figure 3.1.2 Theme: Economy and finance - Balance of Payments (Expenditure and Receipts)
Chapter 44
Table 4.2 Theme: Population and social conditions - Population
Theme: Industry, trade and services - Tourism (Tourist nights and number of tourists)
Theme: Economy and finance - National accounts (GDP)
Theme: Economy and finance - Balance of Payments (Expenditure and Receipts)
Tables 4.3 - 4.5 Theme: Industry, trade and services - Tourism

Technical NNotes
126
Country Web aaddress Source nname
Belgium http://www.statbel.fgov.be Nationaal Instituut voor de Statistiek / Institut National de Statistique (Statistics Belgium)
Bulgaria http://www.nsi.bg National Statistical Institute
Czech RRepublic http://www.czso.cz Czech Statistical Office
Denmark http://www.dst.dk Danmarks Statistics (Statistics Denmark)
Germany http://www.destatis.de Statistisches Bundesamt (Federal Statistical Office)
Estonia http://www.stat.ee Statistikaamet (Statistical Office of Estonia)
Ireland http://www.cso.ie Central Statistics Office
Greece http://www.statistics.gr National Statistical Service of Greece
Spain http://www.ine.es Instituto Nacional de Estadistica (INE)
France http://www.insee.fr Institut National de Statistique et des Etudes Economiques (National Institute for Statistics and Economic Studies)
Italy http://www.istat.it Istituto nazionale di statistica (National Institute of Statistics)
Cyprus http://www.mof.gov.cy/mof/cystat/statistics.nsf Statistical Service of the Republic of Cyprus
Latvia http://www.csb.lv Central Statistical Bureau of Latvia
Lithuania http://www.stat.gov.lt Statistics Lithuania
Luxembourg http://www.statec.lu Service Central de la Statistique et des Etudes Economiques
Hungary http://www.ksh.hu Központi Statisztikai Hivatal (Hungarian Central Statistical Office)
Malta http://www.nso.gov.mt National Statistics Office
Netherlands http://www.cbs.nl Centraal Bureau voor de Statistiek (Statistics Netherlands)

Technical NNotes
127
Country Web aaddress Source nname
Austria http://www.statistik.at Statistik Austria
Poland http://www.stat.gov.pl Central Statistical Office (GUS)
Portugal http://www.ine.pt Instituto Nacional de Estatistica (INE)
Romania http://www.insse.ro Institutul National de Statistica (National Institute of Statistics)
Slovenia http://www.stat.si Statistical Office of the Republic of Slovenia
Slovakia http://www.statistics.sk Statisticky urad Slovenske republiky (Statistical Office of the Slovak Republic)
Finland http://www.stat.fi Tilastokeskus (Statistics Finland)
Sweden http://www.scb.se Statistika centralbyran (Statistics Sweden)
United KKingdom http://www.statistics.gov.uk Office for National Statistics
Croatia http://www.dzs.hr Croatian Bureau of Statistics (CROSTAT)
The fformer YYugoslav RRepublic oofMacedonia http://www.stat.gov.mk State Statistical Office
Turkey http://www.die.gov.tr/ENGLISH/index.html Turkish Statistical Institute
Iceland http://www.statice.is Hagstofa Islands (Statistics Iceland)
Liechtenstein http://www.llv.li/amtsstellen/llv-avw-statistik.htm Statistik Liechtenstein
Norway http://www.ssb.no Statistisk sentralbyra (Statistics Norway)
Switzerland http://www.statistik.admin.ch Statistik Schweiz


European Commission
Tourism statistics
Luxembourg: Office for Official Publications of the European Communities
2008 — 127 pp. — 10.5 x 21 cm
Theme: Population and social conditions - Industry, trade and servicesCollection: Pocketbooks
ISBN 978-92-79-09451-4ISSN 1831-1865


How to obtain EU publicationsOur priced publications are available from EU Bookshop (http://bookshop.europa.eu), where you can place an order with the sales agent of your choice.
The Publications Office has a worldwide network of sales agents. You can obtain their contact details by sending a fax to (352) 29 29-42758.

Tourism statisticsThis Pocketbook introduces both the expert and
non-expert reader a wide range of statistics
relating to tourism in Europe. The data covers the
period 2000 to 2006. The fi gures presented in this
publication cover on the one hand the supply of
collective tourist accommodation in Europe, giving
information on the available capacity in hotels and
other types of collective accommodation and the
tourist fl ows they receive. On the other hand, it
illustrates the travel behaviour of Europeans, giving
information on their domestic and outbound
trips. The publication focuses in a fi rst part on the
tourism industry and the tourism market while a
second part includes country profi les with more
detailed facts and fi gures for the Member States
of the European Union and EFTA as well as some
candidate countries.
http://ec.europa.eu/eurostat
KS
-DS
-08
-00
1-E
N-
ISBN 978-92-79-09451-4
9 7 8 9 2 7 9 0 9 4 5 1 4
N
to