tote G100 2010 - Total Telecom 2010/tote_g100_2010.pdf · nesses—Tata Communications, Tata...
19
Global 100 www.totaltele.com Business analysis for telecoms professionals November 2010 Rise and fall RANKING THE WORLD’S BIGGEST NETWORK OPERATORS
Transcript of tote G100 2010 - Total Telecom 2010/tote_g100_2010.pdf · nesses—Tata Communications, Tata...

Global100www.totaltele.com Business analysis for telecoms professionals November 2010
Rise and fallrAnKing tHe WorLd’s biggest netWorK oPerAtors

For seamless, national and international connectivity, the future starts now. One connection. Infinite possibilities. Rogers. The Canadian carrier solution for all your voice and data needs. www.rogers.com+1-416-935-6060

www.totaltele.com November 2010 3
CONTENTS4 rise and fall Companies in the Middle East, Latin America and Asia are starting to move up our Global 100 ranking, but one operator has abandoned its once lofty ambitions
5 Table: Biggest rank winners and losers Which companies have gone up ladders and which have slid down snakes?
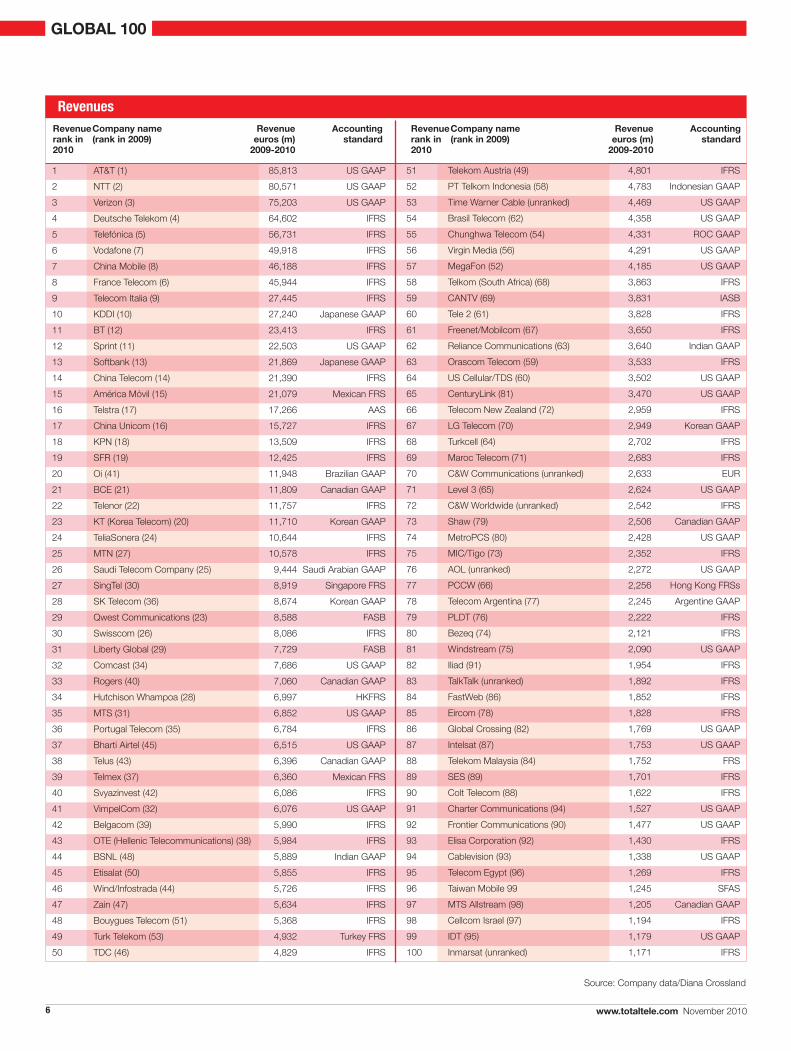
6 Table: ranking by revenues The complete list of revenue figures for the top 100 operators
8 Table: Ranking by net profi t and loss Find out which companies have maintained the healthiest balance sheets
9 Analyst viewpoint PricewaterhouseCoopers outlines a strategy for success in a digital world
10 Table: Complete rankings The complete ranking of the top 100 global operators, with revenues and profi ts in euros and local reporting currencies, plus reporting periods
12 Contributed profi le Brazilian operator TIM sets out its strategy for expansion in Latam’s biggest market
13 Contributed profi le XConnect sets out its position on interconnection and peering, including HD voice
16 Table: Ceos and employees Who are the leaders and how many have reduced headcounts?
18 Table: return on revenues A measure of profi tability, calculated as net income divided by revenues
19 Methodology and notes Explanations and clarifi cations on how the G100 is compiled
GLOBAL 100

4 www.totaltele.com November 2010
o v e r v i e w
RISE AND FALLCompanies in the Middle East, Latin America and Asia are starting to move up our Global 100 rankings, but one operator has abandoned its lofty ambitions
As we went to press with this year’s Global 100, the eyes of the telecoms world were not on the top of the table—the top five
all retained their places, while there was just one new entrant in the top 20—but rather on the middle of the rankings, where one company’s position belies the state of flux it finds itself in.
Just three years ago Kuwaiti telecoms group Zain set out its aim to establish itself as a top 10 global operator by 2011. Its lofty ambitions helped push it into 47th place in the revenue rankings in 2009, from 60th the year before, a position it has retained this year. But as that 2011 deadline approaches, a change in strategy threatens to push Zain out of the Global 100 altogether.
At the start of this year there were already signs that Zain was set to break up rather than expand its operations. By June the telco had concluded the sale of its African assets to India’s Bharti Airtel for US$10.7 billion. Looking at the operator’s service revenue figures for each of its separate country business units, which the company splits out in dollar terms only, the 15 businesses divested accounted for 41.4% of Zain’s revenues in 2009. Without those operations, Zain would likely have been in the bottom quarter of the table this year.
Further developments mean Zain is unlikely to feature at all in the 2011 rankings. In early November United Arab Emirates incumbent Etisalat confirmed that it has made an offer to acquire 51% of Zain, subject to certain condi-tions that include the sale of Zain’s fourth-largest revenue-generating unit, Saudi Arabia. The deal is valued at around US$11.7 billion.
The offer remains conditional, pending the completion of due diligence, but on the day it was announced Etisalat chairman Mohammed Omran was already talking about “unifying our resources and integrating our networks”. Zain’s lifespan as a standalone entity in the Global 100 could prove to be short—just three years.
Etisalat, as a result, is likely to continue to move up the rankings in 2011, from its position at number 45 this year. Zain’s top two revenue-generating businesses (excluding the divested African operations) in 2009 were Iraq and Kuwait, which together contributed $2.56 billion to turn-over. Etisalat rose five places in this year’s ranking from 50th in 2009, having the previous year held
the number 61 spot, one place lower than Zain.Meanwhile, Zain’s former African operations
should also provide new owner Bharti Airtel with a boost in the 2011 ranking. The Indian operator was one of the biggest winners in this year’s table, rising eight places to number 37; that is 20 places higher than it reached just two years ago. The addition of Zain’s African operations could have pushed Bharti Airtel into the top 30.
Bharti Airtel is the highest ranking as well as the fastest rising of India’s representatives in the Global 100, but other telcos from the country also fared well, despite having a difficult time in 2009 as intense competition in the mobile space pushed ARPUs down. State-owned operator Bharat Sanchar Nigam Ltd (BSNL) rose four places to 44th in this year’s ranking, while Reliance Communications was up one to 62nd.
India’s Tata Group does not feature in the Global 100 this year because its various telecoms busi-nesses—Tata Communications, Tata Teleservices and Tata Teleservices Maharashtra—are separate legal entities, none of which individually made the cut. However, the IT and communications segment contributed 525 billion rupees (€8.63 billion) to Tata Group’s revenues in the 2009-10 financial year, which would have put the company as a whole in the top 30.
The biggest advances in the Global 100 ranking came in Latin America, with a Brazilian company making it into the top 20 for the first time. Oi, which provides fixed and mobile services in Brazil, advanced 21 places to take the number 20 position, largely due to the fact that Brasil Telecom was included in its results for the first time. We left Brasil Telecom in the rankings this year—it rose eight places to number 54—but it will drop out of the top 100 next year: the Global 100 is based on annual financial figures, predom-inantly to the end of December or March (see methodology/notes p.19).
Oi needs an injection of cash to allow it pay down debt and fund further expansion, but help is on the way. In October Brazilian regulator Anatel gave the go-ahead for Portugal Telecom to acquire a stake in Oi once the latter has cleared its 74 million-real (about €30 million) debt with the government. Portugal Telecom in July revealed that through a partnership with Oi it will take a combined direct and indirect stake in
Mary Lennighan Editor
Total Telecom
GLOBAL 100

www.totaltele.com November 2010 5
The top 10 companies accounted for more than half of total revenues
top half place, falling 20 places to 48th, while China Unicom, which ranked 7th in 2009, slid 22 places to 29th.
Unicom’s domestic rival China Telecom was the second highest riser in the profits league, going up 56 places in the ranking to number 22 and recording profits of €1.47 billion. It was pipped only by UK incumbent BT, which rose 60 places to 26th position, recording a net profit of €1.15 billion.
The top of the profits table made for familiar reading, with China Mobile hanging on to its number one spot with net income of €11.8 billion and AT&T and Telefonica slipping just one place each to third and fourth respectively with income of €8.74 billion and €7.78 billion. Vodafone mean-while climbed to number two from eighth last year, posting net income of €9.67 billion. The biggest change at the top saw South Africa’s Telkom grab seventh place, up from 54, with income of €3.60 billion.
Languishing at the wrong end of the profits table, Sprint made a loss of €975 million on top of its €2.0 billion loss last year. And Level 3 and Virgin Media posted losses of €431 million and €403 million respectively. n
20 21 Oi (41) 11,948
65 16 CenturyLink (81) 3,470
58 10 Telkom South Africa (68) 3,863
59 10 CANTv (69) 3,831
82 9 Iliad (91) 1,954
28 8 SK Telecom (36) 8,674
37 8 Bharti Airtel (45) 6,515
54 8 Brasil Telecom (62) 4,358
33 7 Rogers (40) 7,060
52 6 Telkom Indonesia (58) 4,783
Source: Company data/Diana Crossland
77 -11 PCCW (66) 2,256
41 -9 vimpelcom (32) 6,076
85 -7 Eircom (78) 1,828
29 -6 Qwest Communications (23) 8,588
34 -6 Hutchison Whampoa (28) 6,997
71 -6 Level 3 (65) 2,624
80 -6 Bezeq (74) 2,121
81 -6 Windstream (75) 2,090
43 -5 OTE (38) 5,984
57 -5 Megafon (52) 4,185
Source: Company data/Diana Crossland
Revenue Revenue rank Company name Revenue in
Rank 2010 change y-o-y (rank in 2009) euros (m) 09-10
Revenue Revenue rank Company name Revenue in
Rank 2010 change y-o-y (rank in 2009) euros (m) 09-10
Oi of 22.38% in return for a maximum invest-ment of 8.4 billion reals (about €3.5 billion).
Portugal Telecom fell by one place to number 36 in our rankings and could slide further next year, because its acquisition of Oi is unlikely to offset the loss of its stake in rival Brazilian opera-tor Vivo; the Portuguese incumbent finalised the sale of its 50% stake in Brasilcel, the holding company for Vivo, to its equal partner in the venture Telefonica in September for $9.8 billion.
Because both Telefonica and Portugal Telecom generated more than €3 billion in revenues from Vivo in 2009, the deal should give the Spanish operator a significant boost in our rankings next year. Telefonica has held the number five spot for several years, although in the most recent ranking it lost ground to the number four player, Germany’s Deutsche Telekom.
As has been the case for the past few years, there was little change at the top end of the ranking by revenues: the top five remain in the same order as 2009. Last year we predicted that Verizon Communications “could well be pushing NTT for second spot” this year, following the inclusion in its results of Alltel, the smaller mobile rival acquired by Verizon Wireless in early 2009.
Verizon did indeed narrow the gap on NTT Communications, but only to €5.37 billion this year compared to €9.30 billion last year. In local currency terms, Verizon reported 10.7% growth from 2008 to 2009, while NTT saw revenues decline by 2.3% in its equivalent financial year ended 31 March.
Moving down the list, France Telecom’s slip to eighth place from sixth in the revenues league triggered the only changes in the top 10, lifting Vodafone and China Mobile to sixth and seventh respectively. Indeed, all three of China’s opera-tors made the top 20, generating over €83 billion in revenues between them, almost €5 billion more than they reported last year.
The top 25 players each generated revenues in excess of €10 billion, and the top 10 alone accounted for more than half of the €1.1 trillion revenues recorded by all the companies in the Global 100.
Meanwhile the net profit recorded by the top 100 telcos exceeded the €100 billion mark, and these rankings changed more dramatically year-on-year than on the revenue side (see p.8). Although fourth in revenue terms, Deutsche Telekom ranked as low as 59th by net profit, making it the biggest rank loser with a slip of 40 places compared to last year. Similarly, Brazilian high flyer Oi dropped 38 places year-on-year in the net profit table to 90th. Zain just held on to a
ToP TeN: ranking winners
ToP TeN: ranking Losers
GLOBAL 100
6 www.totaltele.com November 2010
Source: Company data/Diana Crossland
1 AT&T (1) 85,813 US GAAP
2 NTT (2) 80,571 US GAAP
3 verizon (3) 75,203 US GAAP
4 Deutsche Telekom (4) 64,602 IFRS
5 Telefónica (5) 56,731 IFRS
6 vodafone (7) 49,918 IFRS
7 China Mobile (8) 46,188 IFRS
8 France Telecom (6) 45,944 IFRS
9 Telecom Italia (9) 27,445 IFRS
10 KDDI (10) 27,240 Japanese GAAP
11 BT (12) 23,413 IFRS
12 Sprint (11) 22,503 US GAAP
13 Softbank (13) 21,869 Japanese GAAP
14 China Telecom (14) 21,390 IFRS
15 América Móvil (15) 21,079 Mexican FRS
16 Telstra (17) 17,266 AAS
17 China Unicom (16) 15,727 IFRS
18 KPN (18) 13,509 IFRS
19 SFR (19) 12,425 IFRS
20 Oi (41) 11,948 Brazilian GAAP
21 BCE (21) 11,809 Canadian GAAP
22 Telenor (22) 11,757 IFRS
23 KT (Korea Telecom) (20) 11,710 Korean GAAP
24 TeliaSonera (24) 10,644 IFRS
25 MTN (27) 10,578 IFRS
26 Saudi Telecom Company (25) 9,444 Saudi Arabian GAAP
27 SingTel (30) 8,919 Singapore FRS
28 SK Telecom (36) 8,674 Korean GAAP
29 Qwest Communications (23) 8,588 FASB
30 Swisscom (26) 8,086 IFRS
31 Liberty Global (29) 7,729 FASB
32 Comcast (34) 7,686 US GAAP
33 Rogers (40) 7,060 Canadian GAAP
34 Hutchison Whampoa (28) 6,997 HKFRS
35 MTS (31) 6,852 US GAAP
36 Portugal Telecom (35) 6,784 IFRS
37 Bharti Airtel (45) 6,515 US GAAP
38 Telus (43) 6,396 Canadian GAAP
39 Telmex (37) 6,360 Mexican FRS
40 Svyazinvest (42) 6,086 IFRS
41 vimpelCom (32) 6,076 US GAAP
42 Belgacom (39) 5,990 IFRS
43 OTE (Hellenic Telecommunications) (38) 5,984 IFRS
44 BSNL (48) 5,889 Indian GAAP
45 Etisalat (50) 5,855 IFRS
46 Wind/Infostrada (44) 5,726 IFRS
47 Zain (47) 5,634 IFRS
48 Bouygues Telecom (51) 5,368 IFRS
49 Turk Telekom (53) 4,932 Turkey FRS
50 TDC (46) 4,829 IFRS
51 Telekom Austria (49) 4,801 IFRS
52 PT Telkom Indonesia (58) 4,783 Indonesian GAAP
53 Time Warner Cable (unranked) 4,469 US GAAP
54 Brasil Telecom (62) 4,358 US GAAP
55 Chunghwa Telecom (54) 4,331 ROC GAAP
56 virgin Media (56) 4,291 US GAAP
57 MegaFon (52) 4,185 US GAAP
58 Telkom (South Africa) (68) 3,863 IFRS
59 CANTv (69) 3,831 IASB
60 Tele 2 (61) 3,828 IFRS
61 Freenet/Mobilcom (67) 3,650 IFRS
62 Reliance Communications (63) 3,640 Indian GAAP
63 Orascom Telecom (59) 3,533 IFRS
64 US Cellular/TDS (60) 3,502 US GAAP
65 CenturyLink (81) 3,470 US GAAP
66 Telecom New Zealand (72) 2,959 IFRS
67 LG Telecom (70) 2,949 Korean GAAP
68 Turkcell (64) 2,702 IFRS
69 Maroc Telecom (71) 2,683 IFRS
70 C&W Communications (unranked) 2,633 EUR
71 Level 3 (65) 2,624 US GAAP
72 C&W Worldwide (unranked) 2,542 IFRS
73 Shaw (79) 2,506 Canadian GAAP
74 MetroPCS (80) 2,428 US GAAP
75 MIC/Tigo (73) 2,352 IFRS
76 AOL (unranked) 2,272 US GAAP
77 PCCW (66) 2,256 Hong Kong FRSs
78 Telecom Argentina (77) 2,245 Argentine GAAP
79 PLDT (76) 2,222 IFRS
80 Bezeq (74) 2,121 IFRS
81 Windstream (75) 2,090 US GAAP
82 Iliad (91) 1,954 IFRS
83 TalkTalk (unranked) 1,892 IFRS
84 FastWeb (86) 1,852 IFRS
85 Eircom (78) 1,828 IFRS
86 Global Crossing (82) 1,769 US GAAP
87 Intelsat (87) 1,753 US GAAP
88 Telekom Malaysia (84) 1,752 FRS
89 SES (89) 1,701 IFRS
90 Colt Telecom (88) 1,622 IFRS
91 Charter Communications (94) 1,527 US GAAP
92 Frontier Communications (90) 1,477 US GAAP
93 Elisa Corporation (92) 1,430 IFRS
94 Cablevision (93) 1,338 US GAAP
95 Telecom Egypt (96) 1,269 IFRS
96 Taiwan Mobile 99 1,245 SFAS
97 MTS Allstream (98) 1,205 Canadian GAAP
98 Cellcom Israel (97) 1,194 IFRS
99 IDT (95) 1,179 US GAAP
100 Inmarsat (unranked) 1,171 IFRS
Revenue Company name Revenue Accountingrank in (rank in 2009) euros (m) standard2010 2009-2010
Revenue Company name Revenue Accountingrank in (rank in 2009) euros (m) standard2010 2009-2010
revenues
GLOBAL 100

Every connection is a new opportunity™
PBINSIGHT.EU/UK >
All organisations need insight at all levels, with their customers and citizens, in their markets and communities. Organisations aspire to acquire new customers, serve existing customers and uncover new growth opportunities—whilst maximising effi ciency, minimising costs and improving customer satisfaction.
Learn more about Pitney Bowes Business Insight solutions, software and services and see how we can help you to acquire serve and grow your customer and citizen relationships.
Solutions for Customer Intelligence, Communications and Care.
Insight = Opportunity
Insurance Financial Services Communications Public Sector

8 www.totaltele.com November 2010
Source: Company data/Diana Crossland
Net income (profi ts)
GLOBAL 100
1 0 China Mobile (1) ended 31 Dec 09 11,766
2 6 vodafone (8) ended 31 Mar 10 9,673
3 -1 AT&T (2) ended 31 Dec 09 8,744
4 -1 Telefónica (3) ended 31 Dec 09 7,776
5 4 América Móvil (9) ended 31 Dec 09 4,112
6 -1 NTT (5) ended 31 Mar 10 3,896
7 47 Telkom SA (54) ended 31 Mar 10 3,601
8 -2 France Telecom (6) ended 31 Dec 09 2,997
9 2 Telstra (11) ended 30 Jun 10 2,718
10 -6 verizon (4) ended 31 Dec 09 2,547
11 -1 SFR (10) ended 31 Dec 09 2,530
12 9 KPN (21) ended 31 Dec 09 2,175
13 1 TeliaSonera (14) ended 31 Dec 09 2,075
14 1 SingTel (15) ended 31 Mar 10 2,066
15 -2 Saudi Telecom (13) ended 31 Dec 09 2,020
16 45 Brasil Telecom (61) ended 31 Dec 09 1,952
17 0 KDDI (17) ended 31 Mar 10 1,684
18 -2 Etisalat (16) ended 31 Dec 09 1,678
19 3 MTN (22) ended 31 Dec 09 1,622
20 -8 Telecom Italia (12) ended 31 Dec 09 1,596
21 3 Bharti Airtel (24) ended 31 Mar 10 1,530
22 56 China Telecom (78) ended 31 Dec 09 1,473
23 2 Swisscom (25) ended 31 Dec 09 1,297
24 -6 Telenor (18) ended 31 Dec 09 1,217
25 20 BCE (45) ended 31 Dec 09 1,157
26 60 BT (86) ended 31 Mar 10 1,155
27 -1 Telmex (26) ended 31 Dec 09 1,093
28 -5 MegaFon (23) ended 31 Dec 09 1,042
29 -22 China Unicom (7) ended 31 Dec 09 976
30 -3 Chunghwa (27) ended 31 Dec 09 971
31 3 Belgacom (34) ended 31 Dec 09 904
32 1 Turk Telekom (33) ended 31 Dec 09 855
33 3 Telkom Indonesia (36) ended 31 Dec 09 839
34 -2 Maroc Telecom (32) ended 31 Dec 09 833
35 14 vimpelCom (49) ended 31 Dec 09 782
36 -7 Reliance Comms (29) ended 31 Mar 10 766
37 18 Softbank (55) ended 31 Mar 10 765
38 -18 MTS (20) ended 31 Dec 09 700
39 14 CANTv (53) ended 31 Dec 09 691
40 -1 Portugal Telecom (39) ended 31 Dec 09 683
41 -4 Telus (37) ended 31 Dec 09 667
42 18 Bezeq (60) ended 31 Dec 09 652
43 -8 SK Telecom (35) ended 31 Dec 09 629
44 -1 PLDT (43) ended 31 Dec 09 602
45 -15 Svyazinvest (30) ended 31 Dec 08 594
46 13 MIC/Tigo (59) ended 31 Dec 09 593
47 -16 Turkcell (31) ended 31 Dec 09 515
48 -20 Zain (28) ended 31 Dec 09 513
49 (unranked) C&W Comms ended 31 Mar 10 497
50 -3 SES (47) ended 31 Dec 09 477
51 -9 Bouygues Telecom (42) ended 31 Dec 09 471
52 -8 Qwest Comms (44) ended 31 Dec 09 462
53 11 Tele 2 (64) ended 31 Dec 09 444
54 -8 Shaw (46) ended 31 Aug 09 396
55 1 Telecom Egypt (56) ended 31 Dec 09 372
56 -18 OTE (38) ended 31 Dec 09 370
57 1 KT (Korea Telecom) (58) ended 31 Dec 09 363
58 4 CenturyLink (62) ended 31 Dec 09 356
59 -40 Deutsche Telekom (19) ended 31 Dec 09 353
60 -10 TDC (50) ended 31 Dec 09 320
61 -13 Wind/Infostrada (48) ended 31 Dec09 308
62 9 Taiwan Mobile (71) ended 31 Dec 09 303
63 -12 Orascom Telecom (51) ended 31 Dec 09 264
64 1 Telecom Argentina (65) ended 31 Dec 09 258
65 10 Freenet/Mobilcom (75) ended 31 Dec 09 256
66 -9 Windstream (57) ended 31 Dec 09 233
67 -1 Cellcom Israel (66) ended 31 Dec 09 218
68 -1 Telecom NZ (67) ended 30 Jun 10 214
69 1 LG Telecom (70) ended 31 Dec 09 184
70 -2 Elisa Corp (68) ended 31 Dec 09 177
71 6 Iliad (77) ended 31 Dec 09 175
72 (unranked) AOL ended 31 Dec 09 173
73 (unranked) Inmarsat ended 31 Dec 09 171
74 -2 PCCW (72) ended 31 Dec 09 161
75 -6 Telekom Malaysia (69) ended 31 Dec 09 137
76 5 US Cellular/TDS (81) ended 31 Dec 09 135
77 -1 MetroPCS (76) ended 31 Dec 09 123
78 2 Colt Telecom (80) ended 31 Dec 09 121
79 6 Telekom Austria (85) ended 31 Dec 09 94
80 11 Eircom (91) ended 30 Jun 10 94
81 -8 Frontier (73) ended 31 Dec 09 84
82 -3 MTS Allstream (79) ended 31 Dec 09 67
83 (unranked) TalkTalk ended 31 Mar 10 18
84 6 Liberty Global (90) ended 31 Dec 09 10
85 (unranked) C&W Worldwide ended 31 Mar 10 1
86 -3 BSNL (83) ended 31 Mar 09 1
87 -3 FastWeb (84) ended 31 Dec 09 -34
88 0 Global Crossing (88) ended 31 Dec 09 -98
89 -2 IDT (87) ended 31 Jul 09 -119
90 -38 Oi (52) ended 31 Dec 09 -174
91 2 virgin Media (93) ended 31 Dec 09 -403
92 -3 Level 3 (89) ended 31 Dec 09 -431
93 -1 Intelsat (92) ended 31 Dec 09 -545
94 0 Sprint (94) ended 31 Dec 09 -975
NA NA Comcast ended 31 Dec 09 NA
NA NA Rogers ended 31 Dec 09 NA
NA NA Hutchison Whampoa ended 31 Dec 09 NA
NA (unranked) Time Warner Cable ended 31 Dec 09 NA
NA NA Charter ended 31 Dec 09 NA
NA NA Cablevision ended 31 Dec 09 NA
Net income Net income Company name Financial Net income/rank rank change (net income rank year loss in euro (m)in 2010 Y-o-Y in 2009) 2009-2010
Net income Net income Company name Financial Net income/rank rank change (net income rank year loss in euro (m)in 2010 Y-o-Y in 2009) 2009-2010

www.totaltele.com November 2010 9
Colin Brereton, global communications leader at PricewaterhouseCoopers, outlines five strategic imperatives for success in the fast-moving digital marketplace
DIGITAL TRANSFORMATIONA N A LY S T v i e w P o i N T
Having weathered the recent economic storm telecoms operators now find themselves confronting new, and argua-
bly equally testing, challenges arising from a rapidly-changing digital marketplace. Operators are seeing their traditional sources of revenue squeezed by intense competition, while new market entrants capture the lion’s share of value from new services, applications and content. As a result, operators have found that their previously very firm grip on the digital consumer is being loosened at bewildering speed.
To reassert themselves, operators need to address some critical strategic challenges. If they do this successfully, they will be able to reclaim their position as a powerful and indispensable link in the digital value chain. But if they fail, they face a future of declining revenues and narrowing margins, while others continue to reap the massive rewards on offer.
Operators must tackle five strategic challenges: owning and understanding the consumer; mone-tising new services; driving an economic return from rising data traffic; achieving operational simplicity and efficiency; and creating value through consolidation.
The first challenge arises from major changes in consumer behaviour. These are highlighted particularly by the way that consumers use smart-phones to access content and services. As a result, the digital value chain is fashioning itself into fresh combinations, with new entrants’ ability to build their services around the consumer enabling them to capture most of the value on offer.
Getting to the heart of the way customers use services and data is the key to success in the future. Customers’ loyalty and brand trust have shifted from networks to devices. Operators need to better understand their customers to rebuild stronger relationships, ensuring that offerings are tailored flexibly to meet diverse requirements. A one-size-fits-all approach will no longer work.
In order to monetise new services effectively, customers must perceive value over and above the charges they pay for network access. The most dramatic illustration of this trend is the rapid growth in application stores offered by handset manufacturers. These now generate more than US$6 billion in annual revenues, with the total predicted to hit US$29 billion by 2013.
The rise of data-hungry smartphones also means that operators are supporting consumers’ insatiable appetite for bandwidth without being able to charge appropriately. The most enthusias-tic users of digital services are often the least profitable for the networks: One estimate from the US suggests that just 3% of smartphone users consume 40% of all network traffic.
In response, some operators are already charg-ing more to higher users of data services. To make these changes palatable to consumers, network operators may have to re-educate them about the value of connectivity and stress the benefits of differentiated pricing to lower users.
Responding to consumer demands has left many operators with a legacy of complex, frag-mented and expensive systems and operating models. This could prevent rapid strategic execu-tion in the future, so simplification is critical. Customer data is also fragmented and held in silos: sometimes the same customer has accounts across multiple products, yet there is no common access to that information across the enterprise.
Unifying customer data in one place can greatly enhance the ability to manage customer loyalty and drive lifetime value. And simplicity of operations will provide the ability to compete, as agility and responsiveness become the key qualities required for success in a fast-changing digital market.
Consolidation is also driving change. Just a few years ago, operators from developed economies were busy expanding in emerging markets, but now service providers from those fast-growing economies are eyeing up assets in mature markets (read Total Telecom Plus, November). But consol-idation has not always generated the shareholder value promised. Delivering value in the future will require a new approach from service provid-ers that recognises the differences between consumer markets through distinct targeted branding and pricing, while achieving cost and operational benefits from centralised operations and infrastructure.
The disruptive effects of digital transforma-tion, pervasive as they are, are far from finished. Operators are still very much in the game; but in order to maintain their chances of victory, they will need to respond quickly and decisively to the new rules of play. n
Colin Brereton global comms leader,
PricewaterhouseCoopers
GLOBAL 100

10 www.totaltele.com November 2010
GLOBAL 100
1 AT&T (1) 85,813 123,018 USD 8,744 12,535 USA ended 31 Dec 09
2 NTT (2) 80,571 10,181,376 JPY 3,896 492,266 Japan ended 31 Mar 10
3 verizon (3) 75,203 107,808 USD 2,547 3,651 USA ended 31 Dec 09
4 Deutsche Telekom (4) 64,602 64,602 EUR 353 353 Germany ended 31 Dec 09
5 Telefónica (5) 56,731 56,731 EUR 7,776 7,776 Spain ended 31 Dec 09
6 vodafone (7) 49,918 44,472 GBP 9,673 8,618 UK ended 31 Mar 10
7 China Mobile (8) 46,188 452,103 CNY 11,766 115,166 Hong Kong ended 31 Dec 09
8 France Telecom (6) 45,944 45,944 EUR 2,997 2,997 France ended 31 Dec 09
9 Telecom Italia (9) 27,445 27,445 EUR 1,596 1,596 Italy ended 31 Dec 09
10 KDDI (10) 27,240 3,442,147 JPY 1,684 212,764 Japan ended 31 Mar 10
11 BT (12) 23,413 20,859 GBP 1,155 1,029 UK ended 31 Mar 10
12 Sprint (11) 22,503 32,260 USD -975 -1,398 USA ended 31 Dec 09
13 Softbank (13) 21,869 2,763,406 JPY 765 96,716 Japan ended 31 Mar 10
14 China Telecom (14) 21,390 209,370 CNY 1,473 14,422 China ended 31 Dec 09
15 América Móvil (15) 21,079 394,711 MXN 4,112 76,998 Mexico ended 31 Dec 09
16 Telstra (17) 17,266 25,029 AUD 2,718 3,940 Australia ended 30 Jun 10
17 China Unicom (16) 15,727 153,945 CNY 976 9,556 Hong Kong ended 31 Dec 09
18 KPN (18) 13,509 13,509 EUR 2,175 2,175 The Netherlands ended 31 Dec 09
19 SFR (19) 12,425 12,425 EUR 2,530 2,530 France ended 31 Dec 09
20 Oi (41) 11,948 29,881. BRL -174 -436 Brazil ended 31 Dec 09
21 BCE (21) 11,809 17,735 CAD 1,157 1,738 Canada ended 31 Dec 09
22 Telenor (22) 11,757 97,650 NOK 1,217 10,104 Norway ended 31 Dec 09
23 KT (Korea Telecom) (20) 11,710 19,649,120 KRW 363 609,695 Korea ended 31 Dec 09
24 TeliaSonera (24) 10,644 109,161 SEK 2,075 21,280 Sweden ended 31 Dec 09
25 MTN (27) 10,578 111,947 ZAR 1,622 17,161 South Africa ended 31 Dec 09
26 Saudi Telecom Company (25) 9,444 50,780 SAR 2,020 10,863 Saudi Arabia ended 31 Dec 09
27 SingTel (30) 8,919 16,871 SGD 2,066 3,907 Singapore ended 31 Mar 10
28 SK Telecom (36) 8,674 14,555,465 KRW 629 1,055,606 Republic of Korea ended 31 Dec 09
29 Qwest Communications (23) 8,588 12,311 USD 462 662 USA ended 31 Dec 09
30 Swisscom (26) 8,086 12,001 CHF 1,297 1,925 Switzerland ended 31 Dec 09
31 Liberty Global (29) 7,729 11,080 USD 10 14 USA ended 31 Dec 09
32 Comcast (34) 7,686 11,019 USD NA NA USA ended 31 Dec 09
33 Rogers (40) 7,060 10,602 CAD NA NA Canada ended 31 Dec 09
34 Hutchison Whampoa (28) 6,997 77,784 HKD NA NA Hong Kong ended 31 Dec 09
35 MTS (31) 6,852 9,823 USD 700 1,004 Russian Federation ended 31 Dec 09
36 Portugal Telecom (35) 6,784 6,784 EUR 683 683 Portugal ended 31 Dec 09
37 Bharti Airtel (45) 6,515 396,150 INR 1,530 93,019 India ended 31 Mar 10
38 Telus (43) 6,396 9,606 CAD 667 1,002 Canada ended 31 Dec 09
39 Telmex (37) 6,360 119,100 MXN 1,093 20,469 Mexico ended 31 Dec 09
40 Svyazinvest (42) 6,086 264,413 RUB 594 25,797 Russian Federation ended 31 Dec 08
41 vimpelCom (32) 6,076 8,710 USD 782 1,121 Russian Federation ended 31 Dec 09
42 Belgacom (39) 5,990 5,990 EUR 904 904 Belgium ended 31 Dec 09
43 OTE (38) 5,984 5,984 EUR 370 370 Greece ended 31 Dec 09
44 BSNL (48) 5,889 358,119 INR 1 57 India ended 31 Mar 09
45 Etisalat (50) 5,855 30,831 AED 1,678 8,836 UAE ended 31 Dec 09
46 Wind/Infostrada (44) 5,726 5,726 EUR 308 308 Italy ended 31 Dec 09
47 Zain (47) 5,634 2,318 KWD 513 211 Kuwait ended 31 Dec 09
48 Bouygues Telecom (51) 5,368 5,368 EUR 471 471 France ended 31 Dec 09
49 Turk Telekom (53) 4,932 10,568 TRY 855 1,832 Turkey ended 31 Dec 09
50 TDC (46) 4,829 35,939 DKK 320 2,383 Denmark ended 31 Dec 09
Rank Company name Revenue in Revenue Net income/ Net profi t/ net Country of Financial yearin 2010 (rank in 2009) euros (m) in reporting net loss in loss in reporting reporting 2009-2010 currency (m) euros (m) currency (m)
Complete ranking table

www.totaltele.com November 2010 11
Source: Company data/Diana Crossland
GLOBAL 100
51 Telekom Austria (49) 4,801 4,801 EUR 94 94 Austria ended 31 Dec 09
52 PT Telkom Indonesia (58) 4,783 64,596,635 IDR 839 11,332,140 Indonesia ended 31 Dec 09
53 Time Warner Cable (unranked) 4,469 6,406 USD NA NA USA ended 31 Dec 09
54 Brasil Telecom (62) 4,358 10,898 BRL 1,952 4,881 Brazil ended 31 Dec 09
55 Chunghwa Telecom (54) 4,331 198,361 TWD 971 44,495 Taiwan ended 31 Dec 09
56 virgin Media (56) 4,291 3,804 GBP -403 -357 UK ended 31 Dec 09
57 MegaFon (52) 4,185 181,833 RUB 1,042 45,289 Russian Federation ended 31 Dec 09
58 Telkom (South Africa) (68) 3,863 38,305 ZAR 3,601 35,712 South Africa ended 31 Mar 10
59 CANTv (69) 3,831 11,807,789 vEF 691 2,129,693 venezuela ended 31 Dec 09
60 Tele 2 (61) 3,828 39,265 SEK 444 4,555 Sweden ended 31 Dec 09
61 Freenet/Mobilcom (67) 3,650 3,650 EUR 256 256 Germany ended 31 Dec 09
62 Reliance Communications (63) 3,640 221,323 INR 766 46,550 India ended 31 Mar 10
63 Orascom Telecom (59) 3,533 5,065 USD 264 379 Egypt ended 31 Dec 09
64 US Cellular/TDS (60) 3,502 5,020 USD 135 193 USA ended 31 Dec 09
65 CenturyLink (81) 3,470 4,974 USD 356 511 USA ended 31 Dec 09
66 Telecom NZ (72) 2,959 5,271 NZD 214 382 New Zealand ended 30 Jun 10
67 LG Telecom (70) 2,949 4,949,119 KRW 184 308,124 Korea ended 31 Dec 09
68 Turkcell (64) 2,702 5,789 USD 515 1,104 Turkey ended 31 Dec 09
69 Maroc Telecom (71) 2,683 30,339 MAD 833 9,425 Morocco ended 31 Dec 09
70 Cable&Wireless Comms (unranked) 2,633 2,346 USD 497 443 UK ended 31 Mar 10
71 Level 3 (65) 2,624 3,762 USD -431 -618 USA ended 31 Dec 09
72 Cable&Wireless Worldwide (unranked) 2,542 2,265 GBP 1 1 UK ended 31 Mar 10
73 Shaw (79) 2,506 3,390 CAD 396 535 Canada ended 31 Aug 09
74 MetroPCS (80) 2,428 3,480 USD 123 176 USA ended 31 Dec 09
75 MIC/Tigo (73) 2,352 3,372 USD 593 850 Luxembourg ended 31 Dec 09
76 AOL (unranked) 2,272 3,257 USD 173 248 USA ended 31 Dec 09
77 PCCW (66) 2,256 25,077 HKD 161 1,795 Hong Kong ended 31 Dec 09
78 Telecom Argentina (77) 2,245 12,226 ARS 258 1,405 Argentina ended 31 Dec 09
79 PLDT (76) 2,222 147,993 PHP 602 40,095 Philippines ended 31 Dec 09
80 Bezeq (74) 2,121 11,519 ILS 652 3,541 Israel ended 31 Dec 09
81 Windstream (75) 2,090 2,996 USD 233 334 USA ended 31 Dec 09
82 Iliad (91) 1,954 1,954 EUR 175 175 France ended 31 Dec 09
83 TalkTalk (unranked) 1,892 1,686 GBP 18 16 UK ended 31 Mar 10
84 FastWeb (86) 1,852 1,852 EUR -34 -34 Italy ended 31 Dec 09
85 Eircom (78) 1,828 1,828 EUR 94 94 Cayman Islands ended 30 Jun 10
86 Global Crossing (82) 1,769 2,536 USD -98 -141 Bermuda ended 31 Dec 09
87 Intelsat (87) 1,753 2,513 USD -545 -781 Bermuda ended 31 Dec 09
88 Telekom Malaysia (84) 1,752 8,608 MYR 137 673 Malaysia ended 31 Dec 09
89 SES (89) 1,701 1,701 EUR 477 477 Luxembourg ended 31 Dec 09
90 Colt (88) 1,622 1,622 EUR 121 121 UK ended 31 Dec 09
91 Charter Communications (94) 1,527 2,189 USD NA NA USA ended 31 Dec 09
92 Frontier Communications (90) 1,477 2,117 USD 84 120 USA ended 31 Dec 09
93 Elisa Corporation (92) 1,430 1,430 EUR 177 177 Finland ended 31 Dec 09
94 Cablevision (93) 1,338 1,918 USD NA NA USA ended 31 Dec 09
95 Telecom Egypt (96) 1,269 9,960 EGP 372 2,917 Egypt ended 31 Dec 09
96 Taiwan Mobile (99) 1,245 57,015 TWD 303 13,888 Taiwan ended 31 Dec 09
97 MTS Allstream (98) 1,205 1,809 CAD 67 101 Canada ended 31 Dec 09
98 Cellcom Israel (97) 1,194 6,483 ILS 218 1,182 Israel ended 31 Dec 09
99 IDT (95) 1,179 1,538 USD -119 -155 USA ended 31 Jul 09
100 Inmarsat (unranked) 1,171 1,038 USD 171 152 UK ended 31 Dec 09
Rank Company name Revenue in Revenue Net income/ Net profi t/ net Country of Financial yearin 2010 (rank in 2009) euros (m) in reporting net loss in loss in reporting reporting 2009-2010 currency (m) euros (m) currency (m)
Complete ranking table

12 www.totaltele.com November 2010
CONTRIBUTED PROFILE
This year turned out to be an exciting one for telecoms services in Brazil, with a spate of M&A activity. Latin America’s biggest market is also its fiercest battleground
(see article in Total Telecom Plus, June), and competition in Brazil is set to intensify further as the regulator opens up the market to MVNOs and more 3G spectrum is auctioned, and as operators seek to integrate their fixed and mobile services.
Telecom Italia-owned TIM Brasil (TIM Participacoes) is one operator well positioned to expand in the market, with a very clear mobile-focused strategy and a solid infrastructure. For the past two years the company has focused on maintaining a balance between growth and financial returns , and now is set for new challenges.
TIM plans to make 3G services available to around 60% of the population by 2012, and is investing about 2.5 billion reais (about $1 billion) this year. Over the past 18 months the operator has carried out a turn-around strategy, and although not complete posted net revenues of 3.6 billion reais (about $1.5 billion) in the third quarter, up 6.1% from 3.44 billion reais in the same period a year earlier. Ebitda rose 19.6% to BRL924 million in the third quarter, and the Ebitda margin was 25.3%, up from 22.5% in the third quarter of 2009.
As well as substantial improvements in financial results, there is other evidence of a successful turn-around. Sound results can be seen in terms of improvement in network quality metrics, skyrocketing total minutes of traffic and subscriber growth . Subscribers grew 18.5% year-on-year to 46.9 million at the end of the third quarter, and the company is aiming for 50 million subscribers by the end of the year.
During the past 18 months, TIM has also adopted a new tariff strategy, moving from charging per-minute to charging per-call and removing the traditional long distance barrier in Brazil. At the end of last year TIM bought local long-distance operator Intelig for about $70 million.
“Now we can see the Brazilian market as a single market, and we are happy to enable the creation of the largest community base in the country with 44 million users,” says Luca Luciani, the company’s CEO.
voice central to growthAs the sole pure-play mobile company in Brazil, TIM sees voice services as the central element of its strategy: more than 85% of the operator’s revenues come from voice services. In turn, the Brazilian telecoms market is worth around R$100 billion per year, and the largest part of that comes from voice services. According to analyst company Hot Telecom, 80.3% of all teleph-ony subscribers in Brazil were mobile users in 2009, and that proportion is set to rise to 83.5% in 2013.
With that in mind, TIM’s strategy is focused firmly on stimu-lating higher minutes of use from its customers, and on fixed-to-mobile substitution. In the second quarter, TIM’s outgoing traffic more than doubled to 12.2 billion minutes compared to the previous year, and average minutes per customer reached 110 minutes per month compared to 73 minutes a year earlier (that has now risen to 123 minutes).
When looking at the long distance business, traffic increased- fifteen-fold compared to a year earlier and put the company in a leadership position in a competitive domestic sector with some 40% market share.
Unlocking data value TIM’s network supports the fast-growing data traffic of its customers. In the post-paid segment the company in July launched TIM Web, a transparent data card plan based on charging according to time spent rather than megabytes used.
In the pre-paid segment the company is pursuing the as-yet unexploited market of internet cafés for lower social classes. TIM offers, via customized smartphones, a substitute option for internet cafés enabling connectivity to social networks such as facebook and twitter for a pre-paid daily charge. Infinity Web, launched in August, provides internet access for lower income customers for the cost of 0.50 reais per day.
During the past 18 months 28 million users have joined the company’s Infinity and Liberty plans. In 2011, the company plans to also concentrate on sales of Blackberry and iPhone handsets and services, with updated Internet navigation and other applications. n
Brazilian mobile operator TIM sets out its strategy for expansion in a highly competitive market,with 3G services, differentiated tariffs and the iPhone central to its plans
UPWARDLY MOBILET i M B r A S i L
Net Revenue R$3.6 billion (3Q10)
CEO Luca Luciani
Headquarters Rio de Janeiro, Brazil
Employees 9,231
Subscribers 47 million (39.7 million prepaid); (7.2 million postpaid)
ARPU R$23.4
MOU 123 minutes/customer/month
Market Capitalisation R$15.0 billion (Sept 2010)
TIM Quick Facts (as of 3Q10)

www.totaltele.com November 2010 13
CONTRIBUTED PROFILE
XConnect is the global leader of federation-based inter-connection and peering services. Through its Interconnect 2.0 suite of services, the company solves
the challenges of next-generation interconnection (NGN) by enabling seamless interworking and interoperability between fixed, mobile and IP networks.
Interconnect 2.0 is the most comprehensive suite of secure and scalable carrier-class Enum Registry and IPX hub intercon-nection services. It meets the need for interconnection of IP networks, to efficiently deliver new revenue-generating multi-media services on a cross network basis while increasing service quality and reducing costs.
Xconnect operates the largest worldwide Enum-based IP peering federation, the Global Alliance, and the world’s first national VoIP/NGN interconnection federations in North America, Scandinavia, Korea and South Africa. Headquartered in London, with offices and points of presence in the US, Europe, Africa and Asia, XConnect provides services to over 100 service providers in more than 20 countries.
High-defi nition voiceIn 2010, XConnect continued to enhance its position as the market leader for next-generation federation interconnection services. In January, the company announced the world’s first high definition (HD) voice peering federation, the HD Alliance. HD voice increasingly is being deployed by service providers to deliver clearer, higher quality voice calls than is possible on the PSTN. The HD Alliance interconnects HD enabled networks, preserving an all-IP call path, which allows HD calls to be deliv-ered between networks—an essential requirement for the mass adoption of the service. The HD Alliance launched with nine charter members and is backed by leading vendors Polycom, Dialogic and Broadsoft.
As the explosive growth of IP continues globally, the need for interconnection between NGN/IP networks on a national level is paramount. In April, XConnect partnered with Multisource to launch a national federation in South Africa. The partner-ship, known as XConnect South Africa, will combine
Multisource’s extensive market knowledge and network capabil-ity with XConnect’s expertise in providing multimedia interconnection and carrier Enum registry services.
The full suite of XConnect’s Interconnect 2.0 services will be deployed, enabling South African operators to interconnect their networks and route calls seamlessly and efficiently through a scalable, multilateral interconnection hub.
Next-generation networksXConnect further enhanced its market leading position by announcing the first IP eXchange (IPX) platform to offer seam-less integration with PathFinder, the GSMA’s Number Translation Service, enabling interoperability and convergence between fixed and mobile networks.
Based on standards and specifications developed by the GSMA, the XConnect IPX platform enables network operators to opti-mise routing and signalling and deliver new IP services via a high-quality, secure, managed IP connection with support for multiple commercial models.
A full suite of IPX services is available within XConnect’s national federation environments in North America, Korea, Europe and South Africa, as well as accessible from XConnect’s points of presence globally.
XConnect’s strategy and focus for 2011 remains on utilising its industry leading technology, capability and experience to capitalise on emerging next-generation network opportunities as adoption of IP networks continues. This includes increasing deployments of national federation hubs in partnership with established in-country partners, continued growth of Global Alliance members, product innovation and development to introduce new features and service including HD video, instant messaging and presence.
Core to the company’s strategy will be working with unified communications solutions providers to offer the benefits of federations within UC environments. And it will use its Enum registry technology to extend the benefits of UC from intra-enterprise to inter-enterprise. n
XConnect sets out its position on interconnection and peering services, including the latest international alliances and agreements to promote high-defi nition voice services
PEERING INTO THE FUTUREX C o N N e C T
Founded 2004
CEO Eli Katz
Headquarters London
Services Multimedia interconnect and IP peering
Customers Over 100 service providers in 20 countries
POPs US, Europe, Africa, Asia
Global Alliance Enum-based IP peering federation
HD Alliance High-defi nition voice peering federation
XConnect Quick Facts

Sponsors: Organised by:
2010
World Communication Awards For global communications providers
24 November 2010 The London Hilton on Park Lane
The World Communication Awards The London Hilton on Park Lane 24 November 2010
To book your table, go to www.worldcommsawards.com
Best Brand• Etisalat• Grameenphone• Idea Cellular• Telstra Enterprise & Government• Turk Telekom• Ufone • Verizon Business
Best Content Service• Afghan Wireless• Orange Business Services • TE Data • Turk Telekom • Turkcell
Best Customer Care• Bharti Airtel • BT• Etisalat Misr • Global Crossing • Orange Business Services • Tata Communications • TeliaSonera International Carrier
Best Global Operator• BT Global Services• Hutchinson Global Communication• Orange Business Services• PCCW Global • Virtela Technology Services Inc
Best Managed Service• BT Group • Ericsson • Interoute• iPass• Orange Business Services• Tulip Telecom• Virtela Technology Services Inc• Vodafone
Best Mobile Device Strategy• Emtiac Mobile Solutions• Novatel Wireless • Turk Telekom
Best Mobile Operator• Bharti Airtel• Maxis • Orange Business Services • Safaricom • TMN
Best New Service• Avea • Bharti Airtel • MTN Uganda • Orange Business Services • Sebit• Verizon Business
Best Operator in a Developing Market• Digicel Group • Etisalat Misr • Ezecom• Gateway Communications • Orange Business Services Africa• Viettel Cambodia
Best Project Management• Bharti Airtel • Orange Business Services • Subex • Tech Mahindra • Telstra
Best Regional Operator• China Telecom (Europe) • Digicel Group• GTS Central Europe • Hutchison Global Communications • Interoute • Singapore Telecommunications • Viettel
Best Wholesale Carrier• Bharti Airtel • BICS • BT Wholesale • China Telecom (Europe)• Colt• Tata Communications • TeliaSonera International Carrier
Team of the Year• Azercell Telecom • Emtiac Mobile Solutions• Orange Business Services • Roshan• Turk Telekom • Turkcell
The Alireza Mahmoodshahi Technology Foresight Award• Arieso Ltd• BT Group• Cambridge Broadband Networks• Continuous Computing• IPWireless• Kineto Wireless• SK Telecom• Turkcell Technology
The Green Award• Azercell Telecom• Batelco• BT Group• Colt• Orange Business Services• Telefonica O2 UK
Users’ Choice• AT&T• BT• NTT Communications• Orange Business Services• Telefonica• Verizon Business
CEO of the Year• Abdul Aziz• Anil Sardana• Ian Livingston• Karel Pienaar• Luca Luciani• Mohammed Omran• Paul Doany• Saud Al Daweesh• Sureyya Ciliv• Wang Jianzhou
Shortlisted for the World Communication Awards 2010
BOOK YOUR TABLE
freedomThe feeling of
www.worldcommsawards.com
Winners will be announced at the gala dinner on Wednesday, 24 November 2010

16 www.totaltele.com November 2010
Source: Company data/Diana Crossland
Chief executives and employees
GLOBAL 100
1 AT&T (1) Randall L. Stephenson 282,720
2 NTT (2) Satoshi Miura 195,000
3 verizon (3) Ivan G. Seidenberg 222,900
4 Deutsche Telekom (4) René Obermann 259,920
5 Telefónica (5) Cesar Alierta Izuel 257,426
6 vodafone (7) vittorio Colao 85,000
7 China Mobile (8) Wang Jianzhou 145,954
8 France Telecom (6) Stéphane Richard 181,000
9 Telecom Italia (9) Franco Bernabe 69,964
10 KDDI (10) Tadashi Onodera 18,301
11 BT (12) Ian Livingston 97,800
12 Sprint (11) Daniel R. Hesse 40,000
13 Softbank (13) Masayoshi Son 21,885
14 China Telecom (14) Wang Xiaochu 312,520
15 América Móvil (15) Daniel Hajj Aboumrad 53,661
16 Telstra (17) David Thodey 45,220
17 China Unicom (16) Chang Xiaobing 321,772
18 KPN (18) Ad Scheepbouwer 34,925
19 SFR (19) Frank Esser 9,945
20 Oi (41) Luiz Eduardo Falco 12,372
21 BCE (21) George Cope 50,662
22 Telenor (22) Jon Fredrik Baksaas 40,300
23 KT (Korea Telecom) (20) Suk-Chae Lee 30,841
24 TeliaSonera (24) Lars Nyberg 29,734
25 MTN (27) Phuthuma Nhleko 17,509
26 Saudi Telecom (25) Saud bin Majed Al-Daweesh 21,190
27 SingTel (30) Chua Sock Koong 23,000
28 SK Telecom (36) Man Won Jung 10,714
29 Qwest Comms (23) Edward A. Mueller 30,138
30 Swisscom (26) Carsten Schloter 19,479
31 Liberty Global (29) Michael T. Fries 23,000
32 Comcast (34) Brian L. Roberts 107,000
33 Rogers (40) Alan D. Horn 28,985
34 Hutchison Whampoa (28) Canning Fok 220,000
35 MTS (31) Mikhail v. Shamolin 36,136
36 Portugal Telecom (35) Zeinal Bava 37,021
37 Bharti Airtel (45) Manoj Kohli 18,354
38 Telus (43) Darren Entwistle 36,400
39 Telmex (37) Héctor Slim Seade 52,946
40 Svyazinvest (42) Evgeny Yurchenko NA
41 vimpelCom (32) Boris Nemsic 36,355
42 Belgacom (39) Didier Bellens 17,833
43 OTE (38) Panagis vourloumis 32,864
44 BSNL (48) Kuldeep Goyal 299,840
45 Etisalat (50) Mohammed Khalfan Al Qamzi NA
46 Wind/Infostrada (44) Luigi Gubitosi 6,915
47 Zain (47) Nabeel Bin Salamah 13,000
48 Bouygues Telecom (51) Olivier Roussat 9,018
49 Turk Telekom (53) Paul Doany 34,086
50 TDC (46) Henrik Poulsen 13,042
51 Telekom Austria (49) Hannes Ametsreiter 16,573
52 PT Telkom Indonesia (58) Rinaldi Firmansyah 28,750
53 Time Warner Cable (unranked) Glenn A. Britt 47,000
54 Brasil Telecom (62) Luiz Falco 3,619
55 Chunghwa Telecom (54) Shyue-Ching Lu 27,915
56 virgin Media (56) Neil Berkett 12,107
57 MegaFon (52) Sergey Soldatenkov 20,237
58 Telkom SA (68) Jeffrey Hedberg (acting) 23,247
59 CANTv (69) Socorro Hernandez NA
60 Tele 2 (61) Mats Granryd 6,684
61 Freenet/Mobilcom (67) Christoph vilanek 4,394
62 Reliance Comms (63) Anil D. Ambani 37,150
63 Orascom Telecom (59) Khaled Bichara 17,213
64 US Cellular/TDS (60) LeRoy T. Carlson, Jr. 12,400
65 CenturyLink (81) Glen F. Post, III 20,200
66 Telecom NZ (72) Paul Reynolds 8,629
67 LG Telecom (70) Lee Sang-Cheol NA
68 Turkcell (64) Sureyya Ciliv 11,000
69 Maroc Telecom (71) Abdelslam Ahizoune 14,075
70 C&W Comms (unranked) Tony Rice NA
71 Level 3 (65) James Q. Crowe 5,200
72 C&W Worldwide (unranked) Jim Marsh 6,575
73 Shaw (79) Jim Shaw 10,000
74 MetroPCS (80) Roger D Linquist 3,600
75 MIC/Tigo (73) Mikael Grahne 7,789
76 AOL (unranked) Timothy M. Armstrong 6,700
77 PCCW (66) Alex Arena 18,200
78 Telecom Argentina (77) Franco Bertone 15,300
79 PLDT (76) Napoleon L. Nazareno 29,035
80 Bezeq (74) Avi Gabbay 7,364
81 Windstream (75) Jeffery R. Gardner 7,385
82 Iliad (91) Maxime Lombardini 4,052
83 TalkTalk (unranked) Dido Harding 4,572
84 Fastweb (86) Carsten Schloter 3,440
85 Eircom (78) Paul Donovan 4,559
86 Global Crossing (82) John J. Legere 5,235
87 Intelsat (87) David McGlade 1,111
88 Telekom Malaysia (84) Dato’ Sri Zamzamzairani 24,744
89 SES (89) Romain Bausch 1,585
90 Colt (88) Rakesh Bhasin 4,777
91 Charter (94) Michael J. Lovett 16,700
92 Frontier (90) Mary Agnes Wilderotter 5,400
93 Elisa Corp (92) veli-Matti Mattila 3,331
94 Cablevision (93) James L. Dolan NA
95 Telecom Egypt (96) Tarek Tantawy NA
96 Taiwan Mobile 99 Richard Tsai 2,496
97 MTS Allstream (98) Pierre Blouin 5,837
98 Cellcom Israel (97) Amos Shapira 4,432
99 IDT (95) Howard S. Jonas 1,400
100 Inmarsat (unranked) Andrew Sukawaty 499
Revenue Company name Current Employeesrank (rank in 2009) chief executive 2009in 2010
Revenue Company name Current Employeesrank (rank in 2009) chief executive 2009in 2010

GET TO KNOW:
THE PERIODIC TABLE OF NETWORK ELEMENTS
any network | any service | anywhere
SB: Service BrokerA critical network element to provide and manage application connectivity and interworking for your evolving networkSBSBSSSSSSSSSSSSSSSSSBBBBBBBBBB
FREE
POSTER OFFER
CLICK HERE to Request Your Free “Periodic Table of Network Elements” poster, compliments of Metaswitch.
OSA-SCS
R-IM-SSF
SIP
TCAP
CAMEL
MAP
SIP-ISCPCRF
eNB
BGCF
MRFC
MRFP
PDFMS
SBC
IP-PBX
SGSSP
PBX MGW PDG
MME
SAE
www.metaswitch.com
© 2010 Metaswitch Networks. All rights reserved.

18 www.totaltele.com November 2010
Source: Company data/Diana Crossland
return on revenue
GLOBAL 100
1 AT&T (1) 10.19%
2 NTT (2) 4.83%
3 verizon (3) 3.39%
4 Deutsche Telekom (4) 0.55%
5 Telefónica (5) 13.71%
6 vodafone (7) 19.38%
7 China Mobile (8) 25.47%
8 France Telecom (6) 6.52%
9 Telecom Italia (9) 5.82%
10 KDDI (10) 6.18%
11 BT (12) 4.93%
12 Sprint (11) -4.33%
13 Softbank (13) 3.50%
14 China Telecom (14) 6.89%
15 América Móvil (15) 19.51%
16 Telstra (17) 15.74%
17 China Unicom (16) 6.21%
18 KPN (18) 16.10%
19 SFR (19) 20.36%
20 Oi (41) -1.46%
21 BCE (21) 9.80%
22 Telenor (22) 10.35%
23 KT (Korea Telecom) (20) 3.10%
24 TeliaSonera (24) 19.49%
25 MTN (MTN Group Ltd.) (27) 15.33%
26 Saudi Telecom Company (25) 21.39%
27 SingTel (30) 23.16%
28 SK Telecom (36) 7.25%
29 Qwest Communications (23) 5.38%
30 Swisscom (26) 16.04%
31 Liberty Global (29) 0.13%
32 Comcast (34) NA
33 Rogers (40) NA
34 Hutchison Whampoa (28) NA
35 MTS (31) 10.22%
36 Portugal Telecom (35) 10.07%
37 Bharti Airtel (45) 23.48%
38 Telus (43) 10.43%
39 Telmex (37) 17.19%
40 Svyazinvest (42) 9.76%
41 vimpelCom Ltd (32) 12.87%
42 Belgacom (39) 15.09%
43 OTE (38) 6.18%
44 BSNL (48) 0.02%
45 Etisalat (50) 28.66%
46 Wind/Infostrada (44) 5.38%
47 Zain (47) 9.10%
48 Bouygues Telecom (51) 8.77%
49 Turk Telekom (53) 17.34%
50 TDC (46) 6.63%
51 Telekom Austria (49) 1.96%
52 PT Telkom Indonesia (58) 17.54%
53 Time Warner Cable (unranked) NA
54 Brasil Telecom (62) 44.79%
55 Chunghwa Telecom (54) 22.43%
56 virgin Media (56) -9.38%
57 MegaFon (52) 24.91%
58 Telkom SA (68) 93.23%
59 CANTv (61) 11.60%
60 Tele 2 (61) 11.60%
61 Freenet/Mobilcom (67) 7.01%
62 Reliance Communications (63) 21.03%
63 Orascom Telecom (59) 7.48%
64 US Cellular/TDS (60) 3.84%
65 CenturyLink (81) 10.27%
66 Telecom NZ (72) 7.25%
67 LG Telecom (70) 6.23%
68 Turkcell (64) 19.07%
69 Maroc Telecom (71) 31.07%
70 Cable&Wireless Comms (unranked) 18.88%
71 Level 3 (65) -16.43%
72 Cable&Wireless Worldwide (unranked) 0.04%
73 Shaw (79) 15.78%
74 MetroPCS (80) 5.06%
75 MIC/Tigo (73) 25.21%
76 AOL (unranked) 7.61%
77 PCCW (66) 7.16%
78 Telecom Argentina (77) 11.49%
79 PLDT (76) 27.09%
80 Bezeq (74) 30.74%
81 Windstream (75) 11.15%
82 Iliad (91) 8.96%
83 TalkTalk (unranked) 0.95%
84 Fastweb (86) -1.84%
85 Eircom (78) 5.14%
86 Global Crossing (82) -5.56%
87 Intelsat (87) -31.08%
88 Telekom Malaysia (84) 7.82%
89 SES (89) 28.04%
90 Colt (88) 7.46%
91 Charter (94) NA
92 Frontier (90) 5.67%
93 Elisa Corporation (92) 12.38%
94 Cablevision (93) NA
95 Telecom Egypt (96) 29.29%
96 Taiwan Mobile 99 24.36%
97 MTS Allstream (98) 5.58%
98 Cellcom Israel (97) 18.23%
99 IDT (95) -10.08%
100 Inmarsat (unranked) 14.64%
Revenue Company name Return on revenuerank in (rank in 2009) 2009-20102010
Revenue Company name Return on revenuerank in (rank in 2009) 2009-20102010

www.totaltele.com November 2010 19
Revenue and net income dataThe current league table is based on the latest published revenue and net income figures for operators’ full financial years: predominantly ending 31 December 2009, but also ending 31 December 2008, 31 March 2009, 30 June 2009, 31 July 2009 and 31 March 2010. We strove to use audited consolidated revenue and net income data.
Whenever available, we used revenue and net income figures as reported under I.F.R.S. (Interna-tional Financial Reporting Standard). When I.F.R.S. reporting was unavailable, we strove to use data under US G.A.A.P. (United States Generally Accepted Accounting Principles). National reporting standards were used otherwise.
Latest data availableWe strove to obtain the latest full-year figures for each ranked company, that is for calendar year 2009 and fiscal year 2009-2010. In a few cases however, the latest data was published for calendar year 2008 and for fiscal year 2008-2009. Despite the distortion induced by this difference in reporting, and in order to give the fairest view of companies operating in the various markets, we decided to include some of these companies, provided they were significant enough in the national market.
This was the case for IDT (31 July 2009), Shaw Communications Inc. (31 August 2009), OJSC Svyazin-vest (31 December 2008) and BSNL (31 March 2009).
Double-countingThere is a degree of double-counting of revenue and net income in this league table, due to minority sharehold-ings associated with a degree of free floatation of remaining shares. Double-counting may arise from shareholdings by multiple parties into a company.
Mergers & SeparationsFrance Telecom’s reported figures exclude activities in the UK, which are no longer consolidated following the announcement in September 2009 of the merger of the Orange and T-Mobile operations in the UK. The UK segment is now treated as a discontinued operation in France Telecom’s financial statements.
LG Telecom has absorbed LG Dacom & LG Powercom as of Jan 1st 2010 and will be branded as LG Telecom. LG Telecom & LG Dacom are listed separately in this years rankings.
Verizon’s Consolidated revenues in 2009 increased by $10,454 million, or 10.7%, compared to the similar period in 2008, primarily due to the inclusion of the operating results of Alltel in its Wireless segment.
CenturyTel merged with Embarq on 1st July 2009 and was rebranded CenturyLink. The 2009 results for CenturyLink include six months’ operations from Embarq.
Time Warner has been removed from the table since it separated from AOL in Dec 09 and Time Warner Cable (TMC) in March 09. AOL and TWC have been added to the rankings and rated as individual companies.
Cable and Wireless separated its businesses Communications and Worldwide on 26 March 2010, creating two separately listed companies, Cable & Wireless Worldwide and Cable & Wireless Communications. These two companies have reported their results for 09–10 separately, as is now shown in the rankings.
The Demerger of Old Carphone Warehouse was
effective on 26 March 2010 and resulted in the formation of the Carphone Warehouse Group plc and the TalkTalk Group plc. Neither company has issued an Annual Report for 09-10 but instead published a summary of financial information that showed what the results would have been if both companies had been operating separately. These separate results have been used in the rankings table.
In April 2010, a new entity, VimpelCom Limited, completed a tender offer to exchange ownership of OJSC VimpelCom and Ukraine’s Kyivstar for shares in VimpelCom Limited.
Qwest Communications and CenturyLink agreed in August 2010 to a merger between the two companies. It is anticipated the transaction will close in the first half of 2011.
Extraction of telecoms revenuesSome of the ranked companies’ activities span non-telecommunications industries. In these instances, we have endeavoured to extract telecommunications-related revenue in order to not distort reporting, using segment information reported by these companies. Corresponding net income data by segment was, unfortunately, often unavailable. These companies include Hutchison Whampoa Ltd. (segments: Hutchison Telecommunications International Ltd., 3 Group), Comcast Corporation (High-speed data, tele-phone), Rogers Communications Inc. (Rogers Cable, Rogers Wireless), Time Warner Cable (high-speed data and voice only), Cablevision Systems Corp. (high-speed data services excluding video, voice, VoIP) and Charter Communications Inc. (high-speed data, telephone).
Newcomers and drop-outsSome companies listed this year lacked a ranking in last year’s table, due either to the unavailability of company information or too low revenue figures at the time of data collection. Newcomers to the table are Time Warner Cable, Cable & Wireless Communications, Cable & Wireless Worldwide, AOL, TalkTalk Telecom Group and Inmarsat.
Some companies dropped out of the league table, due either to consolidation by other companies or to revenue figures lower than those of the 100 players. These companies are TOT, Tata Communications (now separated out from Tata Indicom), The Carphone Warehouse Group (has separated from Talk Talk), Time Warner (sold AOL & TWC), Embarq (merged with CenturyLink) and Cable & Wireless (split into separate companies).
Exchange ratesWe used historical mid-market rates at noon eastern time on the day of reporting, provided by http://www.xe.com. Mid-market rates are derived from mid-point between the buy and sell rates of large-value transac-tions in the global currency markets. As our analysis does not use consistent exchange rate comparisons, some companies may benefit and others lose from a conversion of their revenue and net income figures into euros. Conversion into euros is indicative and provides no like-for-like comparison. Companies whose figures were not available for 2009–2010 have had the exchange rate for the period ending 2009–2010 applied, rather than the applicable exchange rate in 2008–2010. This is to ensure there is not an unfair advantage due to a better exchange rate.
METHODOLOGY/NOTES
CONTACTS
EDITORIAL4th Floor, Welken House, 10-11 Charterhouse Square, London EC1M 6EH +44 (0)20 7608 7030; [email protected]
TOTAL TELECOM PLUSIan Kemp [email protected] Editor +44 (0)1626 835 703Michelle Young [email protected] Art Editor
TOTAL TELECOMMary Lennighan [email protected] Editor +44 (0)20 7608 7069Nick Wood [email protected] Assistant Editor +44 (0)20 7608 7046Tim Charters [email protected] Web Developer +44 (0)20 7608 7073
contributing editorsRoy Rubenstein [email protected] Omer, Israel Ingrid Lunden [email protected] London Ken Wieland [email protected] London Craig Stephen [email protected] Hong Kong +852 9048 1124Jagdish Rattanani [email protected] Mumbai +91 22 287 55087
ADvERTISINGHEAD OFFICE, LONDON, UK Nick Carter [email protected] Sales Manager +44 (0)20 7608 7065Gordon White [email protected] Manager +44 (0)20 7608 7041
UNITED STATES AND CANADA KCS International T +1 717 397 7100 F +1 717 397 7800 Karen C Smith-Kernc – East [email protected] Alan Kernc – West & Canada [email protected]
JAPAN Hiroko Kujime [email protected] Business T +81-3-3661-6138 F +81-3-3661-6139
ADvERTISING PRODUCTIONPlease forward all advertising material directly to: [email protected] +44 (0)20 7827 4151
MARKETINGTally Judge [email protected] Marketing Manager +44 (0)20 7608 7076Charles Georgiou [email protected] Marketing Executive +44 (0)20 7608 7071
SUBSCRIPTION/CUSTOMER SERvICESAleisha Bryant [email protected] Customer Services Executive +44 (0) 7608 7042 or subscribe online at: www.subscription.co.uk/totaltelecom
M A N A G E M E N TRob Chambers [email protected] Publisher +44 (0)20 7608 7077Greg Hitchen [email protected] Chief Executive Officer
OTHER PUBLICATIONS Online: www.totaltele.com Television: www.totaltele.tv
TOTAL TELECOM EvENTSWorld Communication Awards www.worldcommsawards.comWorld vendor Awards www.worldvendorawards.comWorld Telecoms Council www.worldtelecomscouncil.com
© 2010. All rights reserved.
Terrapinn Holdings Ltd registered office: 4th Floor Welken House, 10-11 Charterhouse Square, London EC1M 6EH
Total Telecom Plus is published by