Total suspended solids, nutrient and pesticide loads (2012 ... · Total suspended solids, nutrient...
95
Total suspended solids, nutrient and pesticide loads (2012–2013) for rivers that discharge to the Great Barrier Reef Great Barrier Reef Catchment Loads Monitoring 2012–2013
Transcript of Total suspended solids, nutrient and pesticide loads (2012 ... · Total suspended solids, nutrient...

Total suspended solids, nutrient and pesticide loads (2012–2013) for rivers that discharge to the Great Barrier Reef
Great Barrier Reef Catchment Loads Monitoring 2012–2013

Prepared by
R. Wallace, R. Huggins, R. A. Smith, R. D. R. Turner, A. Garzon-Garcia, M. St. J. Warne.
Water Quality and Investigations, Environmental Monitoring and Assessment Science,
Science Division, Department of Science, Information Technology and Innovation
PO Box 5078
Brisbane QLD 4001
© The State of Queensland (Department of Science, Information Technology and Innovation) 2015
The Queensland Government supports and encourages the dissemination and exchange of its information. The copyright in
this publication is licensed under a Creative Commons Attribution 3.0 Australia (CC BY) licence
Under this licence you are free, without having to seek permission from DSITIA, to use this publication in accordance with the licence terms. You must keep intact the copyright notice and attribute the State of Queensland, Department of Science, Information Technology and Innovation as the source of the publication. For more information on this licence visit http://creativecommons.org/licenses/by/3.0/au/deed.en
Disclaimer
This document has been prepared with all due diligence and care, based on the best available information at the time of
publication. The department holds no responsibility for any errors or omissions within this document. Any decisions made by other
parties based on this document are solely the responsibility of those parties. Information contained in this document is from a
number of sources and, as such, does not necessarily represent government or departmental policy.
If you need to access this document in a language other than English, please call the Translating and Interpreting Service (TIS
National) on 131 450 and ask them to telephone Library Services on +61 7 3170 5725
Citation
Wallace, R., Huggins, R., Smith, R. A., Turner, R. D. R., Garzon-Garcia, A and Warne, M. St. J. 2015. Total suspended solids, nutrient
and pesticide loads (2012–2013) for rivers that discharge to the Great Barrier Reef – Great Barrier Reef Catchment Loads
Monitoring Program 2012–2013. Department of Science, Information Technology and Innovation. Brisbane.
April 2015

Page | i www.reefplan.qld.gov.au
Executive summary Diffuse pollutant loads discharged from rivers of the east coast of Queensland have contributed to a decline
in water quality in the Great Barrier Reef lagoon. This decline in water quality is known to directly impact the
health of the Great Barrier Reef and its ecosystems. The Reef Water Quality Protection Plan 2009 (Reef Plan
2009) and the revised Reef Water Quality Protection Plan 2013, aim to halt and reverse the decline in water
quality and enhance the resilience of the Great Barrier Reef to other threatening processes (e.g. coral
bleaching, ocean acidification, disease, climate change and overfishing) by improving land management
practices. Only Reef Plan 2009 is pertinent to the current report.
Reef Plan 2009 is underpinned by pollutant reduction targets measured against the baseline (anthropogenic)
load reported in the Reef Water Quality Protection Plan First Report 2009. These reduction targets include a
20 per cent reduction in anthropogenic load of total suspended solids by 2020; a 50 per cent reduction in
anthropogenic load of nutrients (nitrogen and phosphorus) by 2013; and a 50 per cent reduction in
photosystem II inhibiting herbicides1 by 2013.
Progress towards the Reef Plan 2009 targets is measured through the Paddock to Reef Integrated
Monitoring, Modelling and Reporting Program (Paddock to Reef Program) which is jointly funded by the
Australian and Queensland governments. The Paddock to Reef Program includes catchment scale water
quality monitoring of pollutant loads entering the Great Barrier Reef lagoon which is implemented through
the Great Barrier Reef Catchment Loads Monitoring Program.
The monitoring data generated by this program provides a point of truth to validate loads predicted by
catchment models. The loads predicted by the catchment models are used to report annually on progress
towards the Reef Plan 2009 targets, as part of the annual Reef Report Card (e.g. the Report Card 2012 and
2013).
Pollutant loads are calculated annually by the Great Barrier Reef Catchment Loads Monitoring Program in
the following natural resource management regions and priority catchments:
Cape York region – Normanby catchment
Wet Tropics region – Barron, Johnstone, Tully and Herbert catchments
Burdekin region – Burdekin and Haughton catchments
Mackay Whitsunday region – Plane and Pioneer catchments
Fitzroy region – Fitzroy catchment
Burnett Mary region – Burnett catchment
This report presents monitored annual loads and yields of pollutants based on monitoring data from the
2012–2013 monitoring year (i.e., 1 July 2012 to 30 June 2013).
Total rainfall across the priority reef catchments for the 2012–2013 monitoring year was generally average
to slightly below average in the Cape York, Wet Tropics and Burdekin regions and average to above average
1 Photosystem II inhibitor herbicides are those herbicides that exert toxicity to plants by inhibiting the photosystem II component of photosynthesis. The
priority herbicides for this program are ametryn, total atrazine, diuron, hexazinone and tebuthiuron.
Page | ii www.reefplan.qld.gov.au
in the Mackay Whitsunday region. Following very dry conditions during the first six months, the Fitzroy and
Burnett Mary regions received very high rainfall associated with Ex-Tropical Cyclone Oswald in late-January
which contributed to them receiving above average to very much above average annual rainfall over the
2012–2013 monitoring year.
During the 2012–2013 monitoring year, discharge in all rivers of the Cape York, Wet Tropics and Burdekin
Dry Tropics regions was below the long-term mean with exceedence probabilities ranging from 50 per cent
in Barratta Creek in the Haughton catchment to 78 per cent in the Barron catchment. Annual river discharge
in all other catchments was very much above average with exceedence probabilities in the Mackay
Whitsunday and Fitzroy regions in the range of 22 percent to 28 per cent. In the Burnett catchment
exceptionally high rainfall associated with Ex-Tropical Cyclone Oswald resulted in the highest maximum
recorded flow and highest annual recorded discharge. The annual discharge of the Burnett River during the
2012-2013 monitoring year was five times higher than the long-term mean annual discharge with an
exceedence probability of only three per cent. The periods of highest discharge during 2012–2013 were:
Late January – All catchments with major flooding in the Fitzroy and Burnett catchments and
Early March – Barron, Burdekin, Pioneer, Plane and Fitzroy catchments.
Ten end-of-system and fifteen sub-catchment sites were monitored for total suspended solids and nutrients
during the 2012–2013 monitoring year. Photosystem II inhibiting pesticides were also monitored at eight
end-of-system sites and two sub-catchment sites. This is the first year that monitored annual loads have
been reported for the Bowen River. The installation of an automated water quality monitoring trailer and
direct engagement of staff employed by the Burdekin Bowen Integrated Floodplain Management Advisory
Board enabled the regular collection of water samples during both ambient and flood conditions.
During 2012–2013, the monitored catchments generated approximately 9.6 million tonnes of total
suspended solids, approximately 34,000 tonnes of nitrogen, and approximately 9400 tonnes of phosphorus.
A major flood event in the Burnett catchment following Ex-Tropical Cyclone Oswald resulted in the highest
monitored annual loads of total suspended solids and total nitrogen at all end-of-system sites during the
2012–2013 monitoring year. The combined loads of the Burdekin, Fitzroy and Burnett catchments,
accounted for at least 90 per cent of the total suspended solids (8.7 million tonnes) and total phosphorus
loads (8500 tonnes) and 78 per cent of the monitored annual total nitrogen load (approximately
27,000 tonnes).
The monitored annual load of the five priority photosystem II inhibiting herbicides (ametryn, total atrazine,
diuron, hexazinone and tebuthiuron) during the 2012–2013 monitoring year was approximately
10,000 kilograms. The total monitored annual priority photosystem II inhibiting herbicide loads exported
past the end-of-system monitoring sites were (from largest to smallest): 5100 kilograms of tebuthiuron,
2600 kilograms of total atrazine, 1900 kilograms of diuron, 440 kilograms of hexazinone and 100 kilograms
of ametryn. These reported monitored annual loads do not include monitored annual loads of pesticides
from the Johnstone catchment as sample collection at this catchment was insufficient for the calculation of
pesticide loads during the monitoring year.

Page | iii www.reefplan.qld.gov.au
Total atrazine and diuron were detected at all monitored catchments; ametryn was detected at all
catchments except in the Fitzroy and hexazinone was detected at all catchments except the Burdekin. The
Pioneer and Burnett catchments contributed the largest monitored annual loads of ametryn (28 kilograms
and 27 kilograms, respectively) and Barratta creek in the Haughton catchment contributed the largest
monitored annual load of total atrazine (520 kilograms). The Tully catchment contributed the largest load of
diuron (570 kilograms) and hexazinone (130 kilograms). Consistent with previous monitoring years, the
Fitzroy catchment contributed the largest load of tebuthiuron (5000 kilograms). In addition, this report, for
the first time, presents the loads of all the pesticides that were detected in the monitored catchments
(Appendix A).
Yields (the load divided by the monitored surface area of the catchment) were calculated to compare the
rate of pollutant delivery between catchments. The highest monitored annual yield at the end-of-system
sites of total suspended solids was in the Burnett catchment, total nitrogen in the Tully catchment and total
phosphorus in Sandy Creek in the Plane catchment. The Johnstone and Pioneer catchments also produced
high monitored annual yields of total suspended solids, total nitrogen and total phosphorus. The Barron and
Herbert catchments also produced high monitored annual yields of total suspended solids during the 2012–
2013 monitoring year. Conversely, the lowest monitored annual yields of total suspended solids were
produced by Barratta Creek in the Haughton catchment and the Normanby catchment, and the lowest total
nitrogen and total phosphorus yields occurred in the Fitzroy and Burdekin catchments.
In 2012–2013, the largest monitored annual land use yield (the load divided by the total surface area of
land-uses where the pesticide is registered for use) of ametryn was in the Burnett catchment, total atrazine
in Barratta Creek in the Haughton catchment, diuron and hexazinone in the Tully catchment and tebuthiuron
in the Fitzroy catchment.
This is the final technical report to be released by the Great Barrier Reef Catchment Loads Monitoring
Program under Reef Plan 2009. The Paddock to Reef Integrated Monitoring, Modelling and Reporting
Program was reviewed in 2013. This resulted in decommissioning several sub-catchment sites where the
modellers felt the catchment models were of sufficient accuracy and establishing end-of-system sites to
provide loads data for new catchments and better alignment of freshwater and marine monitoring. The
loads and yields data contained in this report complement the existing data collected over the previous six
years to validate the catchment models which are used to monitor progress against the water quality
improvement targets.
The program has ensured continuous improvement through the implementation of a quality management
system including the delivery of specialist training to regional staff. Further, the installation of automated
sampling equipment has improved sample coverage during large flood events as demonstrated by the water
quality data available for the calculation of loads in the remote Bowen catchment monitoring site and the
collection of water samples during the Burnett River flood in January 2013.

Page | iv www.reefplan.qld.gov.au
The continuity of the data made available through the Great Barrier Reef Catchment Loads Monitoring
Program continues to provide a critical data resource for the effective management of Queensland natural
resources.

Page | v www.reefplan.qld.gov.au
This page is intentionally blank.

Page | vi www.reefplan.qld.gov.au
Contents
Executive summary i
1 Introduction 1
2 Methods 4
2.1 Monitoring sites 4
2.2 Rainfall 4
2.3 Water quality sampling 4
2.4 Quality control 8
2.5 Water quality sample analysis 8
2.6 River discharge 10
2.7 Data analysis 11
3 Results and discussion 19
3.1 Rainfall and river discharge 19
3.2 Sampling representivity 26
3.3 Total suspended solids and nutrient loads and yields 27
3.4 Pesticide loads and yields 39
4 Conclusions 45
5 Acknowledgements 47
6 References 48
7 Appendices 54

Page | vii www.reefplan.qld.gov.au
List of figures
Figure 2.1 Map indicating the natural resource management regions, catchments and sites where the Great Barrier Reef Catchment Loads Monitoring Program monitored in 2012–2013. 5
Figure 3.1 Queensland rainfall (millimetres) totals for 1 July 2012 to 30 June 2013 along with the monitored catchments and Great Barrier Reef Catchment Loads Monitoring Program sites. 22
Figure 3.2 Queensland rainfall deciles for 1 July 2012 to 30 June 2013 along with the monitored catchments and Great Barrier Reef Catchment Loads Monitoring Program sites. 23
Figure 3.3 Annual discharge for the end-of-system sites (including the North Johnstone and South Johnstone sub-catchments) between 1 July 2012 and 30 June 2013, compared to the long-term mean annual discharge. 24
Figure 3.4 Per cent contribution from each catchment to the combined monitored annual total suspended solids load. 28
Figure 3.5 Per cent contribution from each catchment to the combined monitored total nitrogen annual load. 32
Figure 3.6 Per cent contribution from each catchment to the combined monitored dissolved inorganic nitrogen annual load. 32
Figure 3.7 Per cent contribution from each catchment to the combined monitored oxidised nitrogen annual load. 32
Figure 3.8 Per cent contribution from each catchment to the combined monitored ammonium nitrogen annual load. 32
Figure 3.9 Per cent contribution from each catchment to the combined monitored particulate nitrogen annual load. 32
Figure 3.10 Per cent contribution from each catchment to the combined monitored dissolved organic nitrogen annual load. 32
Figure 3.11 Per cent contribution from each catchment to the combined monitored total phosphorus annual load. 34
Figure 3.12 Per cent contribution from each catchment to the combined monitored dissolved organic phosphorus annual load. 34
Figure 3.13 Per cent contribution from each catchment to the combined monitored dissolved inorganic phosphorus annual load. 34
Figure 3.14 Per cent contribution from each catchment to the combined monitored particulate phosphorus annual load. 34
Figure 3.15 Per cent contribution from each end-of-system site (excluding North Johnstone) to the combined monitored annual ametryn load. 44

Page | viii www.reefplan.qld.gov.au
Figure 3.16 Per cent contribution from each end-of-system site (excluding North Johnstone) to the combined monitored annual total atrazine load. 44
Figure 3.17 Per cent contribution from each end-of-system site (excluding North Johnstone) to the combined monitored annual diuron load. 44
Figure 3.18 Per cent contribution from each end-of-system site (excluding North Johnstone) to the combined monitored annual hexazinone load. 44
Figure 3.19 Per cent contribution from each end-of-system site (excluding North Johnstone) to the combined monitored annual tebuthiuron load. 44
Figure 7.1 Hydrograph showing discharge (blue line) and sample coverage for total suspended solids, total nutrients, dissolved and particulate nutrients (red circles) in the Normanby River at Kalpowar Crossing between 1 July 2012 and 30 June 2013. Representivity rating was good for total suspended solids, no other analytes were calculated. 62
Figure 7.2 Hydrograph showing discharge (blue line) and sample coverage for total suspended solids, total nutrients, dissolved and particulate nutrients (red circles) in the Barron River at Myola between 1 July 2012 and 30 June 2013. Representivity rating was excellent for all analytes. 63
Figure 7.3 Hydrograph showing discharge (blue line) and sample coverage for total suspended solids, total nutrients, dissolved and particulate nutrients (red circles) in the North Johnstone River at Tung Oil between 1 July 2012 and 30 June 2013. Representivity rating was good for all analytes. 63
Figure 7.4 Hydrograph showing discharge (blue line) and photosystem II inhibiting pesticide sample coverage (red circles) for North Johnstone River at Tung Oil between 1 July 2012 and 30 June. 2013. 64
Figure 7.5 Hydrograph showing discharge (blue line) and sample coverage for total suspended solids, total nutrients, dissolved and particulate nutrients (red circles) in the South Johnstone River at Upstream Central Mill between 1 July 2012 and 30 June 2013. Representivity rating was excellent for all analytes. 64
Figure 7.6 Hydrograph showing discharge (blue line) and sample coverage for total suspended solids, total nutrients, dissolved and particulate nutrients (red circles) in the Tully River at Euramo between 1 July 2012 and 30 June 2013. Representivity rating was excellent for all analytes. 65
Figure 7.7 Hydrograph showing discharge (blue line) and photosystem II inhibiting pesticide sample coverage (red circles) for Tully River at Euramo between 1 July 2012 and 30 June 2013. 65
Figure 7.8 Hydrograph showing discharge (blue line) and sample coverage for total suspended solids, total nutrients, dissolved and particulate nutrients (red circles) in the Tully River at Tully Gorge National Park between 1 July 2012 and 30 June 2013. Representivity rating was moderate for all analytes. 66
Figure 7.9 Hydrograph showing discharge (blue line) and sample coverage for total suspended solids, total nutrients and photosystem II inhibiting herbicides (red circles) for the Herbert River at

Page | ix www.reefplan.qld.gov.au
Ingham between 1 July 2011 and 30 June 2012. Representivity rating was good for all analytes (excluding photosystem II inhibiting herbicides. 66
Figure 7.10 Hydrograph showing discharge (blue line) and sample coverage for total suspended solids, total nutrients, dissolved and particulate nutrients sample coverage (red circles) in the Barratta Creek at Northcote between 1 July 2012 and 30 June 2013. Representivity rating was excellent for all analytes. 67
Figure 7.11 Hydrograph showing discharge (blue line) and photosystem II pesticide sample coverage (red circles) for Barratta Creek at Northcote between 1 July 2012 and 30 June 2013. 67
Figure 7.12 Hydrograph showing discharge (blue line) and sample coverage for total suspended solids, total nutrients, dissolved and particulate nutrients (red circles) in the Burdekin River at Home Hill between 1 July 2012 and 30 June 2013. Representivity rating was good for all analytes. 68
Figure 7.13 Hydrograph showing discharge (blue line) and photosystem II inhibiting herbicide sample coverage (red circles) for Burdekin River at Home Hill between 1 July 2012 and 30 June 2013. 68
Figure 7.14 Hydrograph showing discharge (blue line) and sample coverage for total suspended solids, total nutrients, dissolved and particulate nutrients (red circles) in the Burdekin River at Sellheim between 1 July 2012 and 30 June 2013. Representivity rating was moderate for all analytes. 69
Figure 7.15 Hydrograph showing discharge (blue line) and sample coverage for total suspended solids, total nutrients, dissolved and particulate nutrients (red circles) for Cape River at Taemas between 1 July 2012 and 30 June 2013. Representivity rating was good for all other analytes. 69
Figure 7.16 Hydrograph showing discharge (blue line) and sample coverage for total suspended solids and total nutrients (red circles) for Belyando River at Gregory Development Road between 1 July 2012 and 30 June 2013. Representivity rating was good for all analytes. 70
Figure 7.17 Hydrograph showing discharge (blue line) and sample coverage for total suspended solids, total nutrients, dissolved and particulate nutrients (red circles) in the Suttor River at Bowen Development Road between 1 July 2012 and 30 June 2013. Representivity rating was good for all analytes. 70
Figure 7.18 Hydrograph showing discharge (blue line) and sample coverage for total suspended solids, total nutrients, dissolved and particulate nutrients (red circles) in the Bowen River at Myuna between 1 July 2012 and 30 June 2013. Representivity rating was excellent for all analytes. 71
Figure 7.19 Hydrograph showing discharge (blue line) and sample coverage for total suspended solids, total nutrients, dissolved and particulate nutrients and photosystem II inhibiting herbicides (red circles) in the Pioneer River at Dumbleton Pump Station between 1 July 2012 and 30 June 2013. Representivity rating was excellent for all analytes (excluding photosystem II inhibiting herbicides). 71
Figure 7.20 Hydrograph showing discharge (blue line) and sample coverage for total suspended solids, total nutrients, dissolved and particulate nutrients and photosystem II inhibiting herbicides (red circles) in Sandy Creek at Homebush between 1 July 2012 and 30 June 2013. Representivity rating was good for all analytes (excluding photosystem II inhibiting herbicides). 72

Page | x www.reefplan.qld.gov.au
Figure 7.21 Hydrograph showing discharge (blue line) and sample coverage for total suspended solids, total nutrients, dissolved and particulate nutrients and photosystem II inhibiting herbicides (red circles) in the Fitzroy River at Rockhampton between 1 July 2012 and 30 June 2013. Representivity rating was good for all analytes (excluding photosystem II inhibiting herbicides). 72
Figure 7.22 Hydrograph showing discharge (blue line) and sample coverage for total suspended solids, total nutrients, dissolved and particulate nutrients and photosystem II inhibiting herbicides (red circles) in the Comet River at Comet Weir between 1 July 2011 and 30 June 2012. Representivity rating was good for all analytes. 73
Figure 7.23 Hydrograph showing discharge (blue line) and sample coverage for total suspended solids, total nutrients, dissolved and particulate nutrients and photosystem II inhibiting herbicides (red circles) in Theresa Creek at Gregory Highway between 1 July 2011 and 30 June 2012. Representivity rating was indicative for all analytes. 73
Figure 7.24 Hydrograph showing discharge (blue line) and sample coverage for total suspended solids, total nutrients, dissolved and particulate nutrients (red circles) in the Dawson River at Taroom between 1 July 2012 and 30 June 2013. Representivity rating was good for all analytes. 74
Figure 7.25 Hydrograph showing discharge (blue line) and sample coverage for total suspended solids, total nutrients, dissolved and particulate nutrients and photosystem II inhibiting herbicides (red circles) in the Burnett River at Ben Anderson Barrage between 1 July 2011 and 30 June 2012. Representivity rating was excellent for all analytes (excluding photosystem II inhibiting herbicides ). 74
Figure 7.26 Hydrograph showing discharge (blue line) and sample coverage for total suspended solids, total nutrients, dissolved and particulate nutrients (red circles) in the Burnett River at Eidsvold between 1 July 2012 and 30 June 2013. Representivity rating was indicative for all analytes. 75
Figure 7.27 Hydrograph showing discharge (blue line) and sample coverage for total suspended solids, total nutrients, dissolved and particulate nutrients (red circles) in the Burnett River at Jones Weir Tail Water between 1 July 2012 and 30 June 2013. Representivity rating was indicative for all analytes. 75
Figure 7.28 Hydrograph showing discharge (blue line) and sample coverage for total suspended solids, total nutrients, dissolved and particulate nutrients (red circles) in the Burnett River at Mt Lawless between 1 July 2011 and 30 June 2012. Representivity rating was good for total suspended solids and total nutrients and indicative for dissolve and particulate nutrients. 76
List of tables
Table 2.1 Summary information on sites monitored as part of the Great Barrier Reef Catchment Loads Monitoring Program between 1 July 2012 and 30 June 2013. Text in bold are end-of-system sites and the corresponding data, all others are sub-catchment sites. 6
Table 2.2 Summary information on analytes measured and sample collection methods used as part of the Great Barrier Reef Catchment Loads Monitoring Program between 1 July 2012 and 30 June

Page | xi www.reefplan.qld.gov.au
2013. Text in bold are end-of-system sites and the corresponding data, all others are sub-catchment sites. 7
Table 2.3 Summary information for each analyte measured and the corresponding practical quantitation limit. 9
Table 2.4 Timing and flow factors applied to calculate discharge at non-gauged monitoring sites and recently installed gauging stations. 11
Table 2.5 Scores assigned to total suspended solids and nutrients data to determine their representivity. 12
Table 2.6 Binary codes indicating which photosystem II inhibiting herbicides are registered for the aggregated land use categories in Great Barrier Reef catchments. A code of 1 indicates the pesticide is registered for application in that aggregated land use, while a code of 0 indicates that it is not registered for application in that land use. 18
Table 2.7 Surface area of each aggregated land use category based on data were obtained from the Queensland Land Use Monitoring Program 18
Table 3.1 The total and monitored area for each catchment and summary discharge and flow statistics for the 2012–2013 monitoring year. Text in bold are end-of-system sites and the corresponding data, all others are sub-catchment sites. 25
Table 3.2 Monitored annual total suspended solids and nutrient loads for 2012–2013. Text in bold are end-of-system sites and the corresponding data, all others are sub-catchment sites. Green shading = excellent or good representivity rating; orange shading = moderate representivity; and red shading = indicative representivity. 36
Table 3.3 Total suspended solids and nitrogen yields calculated for 2012–2013 along with the per cent of catchment monitored. Text in bold are end-of-system sites and the corresponding data, all others are sub-catchment sites. Green shading = excellent or good representivity rating; orange shading = moderate representivity; and red shading = indicative. 37
Table 3.4 Phosphorus yields calculated for 2012–2013 along with the per cent of catchment monitored. Text in bold are end-of-system sites and the corresponding data, all others are sub-catchment sites. Green shading = excellent or good representivity rating; orange shading = moderate representivity; and red shading = indicative. 38
Table 3.5 Monitored annual loads calculated for the five priority photosystem II inhibiting herbicides: ametryn, total atrazine, diuron, hexazinone and tebuthiuron. Text in bold are end-of-system sites and the corresponding data, all others are sub-catchment sites. 42
Table 3.6 The monitored annual yields calculated for the five priority photosystem II inhibiting herbicides: ametryn, total atrazine, diuron, hexazinone and tebuthiuron. All sites are end-of-system sites with the corresponding data. 43
Table 7.1 The monitored annual loads calculated for the additional pesticides: 2,4-D, bromacil, fluometuron, fluroxypyr, haloxyfop, imidacloprid, isoxaflutole. Text in bold are end-of-system sites and the corresponding data, all others are sub-catchment sites. 56

Page | xii www.reefplan.qld.gov.au
Table 7.2 The monitored annual loads calculated for the additional pesticides: MCPA, metolachlor, metribuzin, metsulfuron-methyl, prometryn, propazin-2-hydroxy and simazine. Text in bold are end-of-system sites and the corresponding data, all others are sub-catchment sites. 57
Table 7.3 The monitored annual loads calculated for the additional pesticides: terbuthylazine, triclopyr, atrazine and its metabolites desethylatrazine, desisopropylatrazine. Text in bold are end-of-system sites and the corresponding data, all others are sub-catchment sites. 58
Table 7.4 Per cent of annual discharge period calculated using interpolated discharge. Text in bold are end-of-system sites and the corresponding data, all others are sub-catchment sites. 60
Table 7.5 Description of discharge data quality codes (DNRM 2014). 61
Table 7.6 The recalculated monitored annual land use yields for the five priority photosystem II inhibiting herbicides: ametryn, total atrazine, diuron, hexazinone and tebuthiuron for the 2010–2011 and 2011–2012 monitoring years. All sites and land use yields in bold are end-of-system sites and the corresponding data. 78
Table 7.7 The number of samples collected and the representivity rating for monitored sites in 2012–2013. Text in bold are end-of-system sites and the corresponding data, all others are sub-catchment sites. 79
Table 7.8 The number of samples collected and the representivity rating for monitored sites in 2012–2013. Text in bold are end-of-system sites and the corresponding data, all others are sub-catchment sites. 80

Page | 1 www.reefplan.qld.gov.au
1 Introduction The Great Barrier Reef World Heritage Area is located off the north-east coast of Australia and is recognised
as the largest coral reef ecosystem in the world (Furnas 2003; Rayment 2003). It is widely acknowledged that
the Great Barrier Reef is at significant risk from degraded water quality caused by pollutants exported from
catchments adjacent to the Great Barrier Reef (Wachenfeld et al. 1998; State of Queensland and
Commonwealth of Australia 2003; Brodie et al. 2008; DPC 2008; Hunter and Walton 2008; Brodie et al. 2009;
Packett et al. 2009; Brodie et al. 2010; Brodie et al. 2013a; Brodie et al. 2013b; Schaffelke et al. 2013). In
order to improve water quality entering from these catchments, the Queensland and Australian
Governments cooperatively initiated the Reef Water Quality Protection Plan 2009 (Reef Plan) with the short-
term goal to halt and reverse the decline in water quality entering the Great Barrier Reef lagoon by 2013
(DPC 2009a).
The Paddock to Reef Integrated Monitoring, Modelling and Reporting (Paddock to Reef) Program measures
progress towards Reef Plan goals and targets. The Paddock to Reef program is a joint collaboration involving
the Australian and Queensland Governments, industry, regional natural resource management bodies and
research organisations (DPC 2009b). It is a world-leading approach to integrate data and information on
management practices, catchment indicators, water quality and the health of the Great Barrier Reef.
To assist in evaluating progress towards the water quality targets of Reef Plan, the Great Barrier Reef
Catchment Loads Monitoring Program was implemented to monitor and report on loads of total suspended
solids and nutrients in 11 priority catchments and loads of pesticides in eight priority catchments under the
Paddock to Reef program.
Evidence of elevated anthropogenic loads of total suspended solids, nutrients and pesticides exported to the
Great Barrier Reef lagoon since European settlement has been reported extensively over recent years (e.g.
Nicholls 1988; Eyre 1998; Wachenfeld et al. 1998; Fabricius et al. 2005; Hunter and Walton 2008; Packett et
al. 2009; Brodie et al. 2010; DPC 2011; Kroon et al. 2011; Smith et al. 2012; Turner et al. 2012; Kroon et al.
2013; Turner et al. 2013; Wallace et al. 2014). Kroon et al. (2013) estimated that since European settlement
the mean annual load of total suspended solids exported to the Great Barrier Reef lagoon has increased by
5.5 times, total nitrogen has increased by 5.7 times and total phosphorus has increased by 8.9 times.
Photosystem II inhibiting herbicides were not present before European settlement. The majority of pollutant
loads are generated during the wet season as runoff during flood events from catchments adjacent to the
Great Barrier Reef (Nicholls 1988; Eyre 1998; Smith et al. 2012; Turner et al. 2012; Kroon et al. 2013; Turner
et al. 2013; Wallace et al. 2014).
Thirty-five catchments flow into the Great Barrier Reef lagoon, and cover an area of approximately
424,000 square kilometres. These catchments extend from the tropics to the subtropics over
1500 kilometres of Queensland’s east coastline (DPC 2011). Across the study area, there are substantial
climatic differences within and between catchments, with highly variable rainfall, hydrology and geology.
These factors contribute to the high variability in estimated discharge volume and total suspended solids,

Page | 2 www.reefplan.qld.gov.au
nutrient and pesticide loads between catchments and years (Furnas et al. 1997; Devlin and Brodie 2005;
Joo et al. 2012; Smith et al. 2012; Turner et al. 2012; Turner et al. 2013; Wallace et al. 2014).
Of these 35 catchments, 11 catchments were monitored by the Great Barrier Reef Catchment Loads
Monitoring Program in 2012–2013. The 11 catchments were selected based on inputs from the regional
National Action Plan for Salinity and Water Quality Program officers, the Great Barrier Reef Marine Park
Authority and the Australian Centre for Tropical Freshwater Research (DERM 2011a). The 11 priority
monitored catchments and the natural resource management regions in which they occur are:
Cape York region – Normanby catchment
Wet Tropics region – Barron, Johnstone (including North Johnstone and South Johnstone rivers),
Tully and Herbert catchments
Burdekin region – Burdekin and Haughton catchments
Mackay Whitsunday region – Plane and Pioneer catchments
Fitzroy region – Fitzroy catchment
Burnett Mary region – Burnett catchment
Grazing is the largest single land use within the Great Barrier Reef catchments (DPC 2011), with other
significant land uses being conservation, forestry, sugarcane, horticulture and other cropping. In the Cape
York region, the Normanby catchment is dominated by grazing and large amount of land set aside for
conservation in State protected areas. In the Wet Tropics the main land uses are grazing in the west,
sugarcane on the coastal flood plains and small areas of horticulture. Large areas of the Wet Tropics region
are also set aside for conservation purposes in the Wet Tropics World Heritage Area. Land use in the
Burdekin region is dominated by grazing with irrigated sugarcane, horticulture and cropping located in the
lower Burdekin and Haughton catchments. Within the Mackay Whitsunday region the Pioneer and Plane
catchments are dominated by grazing. This region also contains relatively large areas of sugarcane
cultivation along the coastline and areas for nature conservation. Grazing, dry land cropping, irrigated cotton
and mining are the dominant land uses within the Fitzroy region. Land use within the Burnett Mary region is
a mixture of grazing, dairy, horticulture, sugarcane and other cropping (DPC 2011).
This report is the seventh publication from the Great Barrier Reef Catchment Loads Monitoring Program, and
fourth annual technical report in this series. The current report presents annual loads and yields (the load
per unit area) from 11 priority reef catchments for total suspended solids, nutrients and from nine
catchments for pesticides in 2012–2013. These loads have been calculated using the same methods in each
of the technical reports issued under the Paddock to Reef Program. Previous reports of the Great Barrier
Reef Catchment Loads Monitoring Program have presented loads for the period 2006–2009 (Joo et al. 2012),
2009–2010 (Turner et al. 2012), 2010–2011 (Turner et al. 2013), 2011–2012 (Wallace et al. 2014). Smith et
al. (2012) examined pesticide loads and assessed the toxicity and potential implications of mixtures of
pesticides. Smith et al. (2014) recently reported the concentrations and loads of alternate pesticides in
monitored Great Barrier Reef catchments and compared the relative toxicity of these chemicals to the

Page | 3 www.reefplan.qld.gov.au
primary photosystem II inhibiting herbicides which have been the focus of landuse management change
under Reef Plan 2009 (DPC 2009b; 2013c).
The scope of this report is confined to the estimation and reporting of loads and yields exported from the
monitored area of each catchment and as such these pollutant loads do not represent the total load
discharged to the Great Barrier Reef lagoon2. This report does not link land uses, regions or soil erosion
processes (e.g. gullies, channel/bank or hill-slope erosion) to loads or yields of total suspended solids or
nutrients but does present land use yields of pesticides. The reported loads are estimated from monitoring
data, which provides a point of truth to validate the modelled catchment loads. The loads predicted by the
catchment models are used to report on progress towards water quality targets in the annual Reef Plan
Report Card (DPC 2011; DPC 2013a; DPC 2013b; DPC 2014). No modelled loads are presented in this report.
2 Not all catchments that drain to the Great Barrier Reef lagoon were monitored. In addition, the end-of-system monitoring sites are not located at the mouth
of the river or creek (refer to Section 2.1) and this unmonitored portion of the catchment or sub-catchment may contribute, remove or degrade total suspended solids, nutrients and pesticides.

Page | 4 www.reefplan.qld.gov.au
2 Methods
2.1 Monitoring sites Eleven priority catchments were identified for monitoring under the Paddock to Reef Program (DPC 2011;
Carroll et al. 2012). Monitoring sites were established at existing Queensland Government stream gauging
stations (Figure 2.1 and Table 2.1). Sites are classified as either end-of-system or sub-catchment sites. End-
of-system sites are defined as sites located at the lowest point in a river or creek, which does not have tidal
influence and the volume of water passing that point, can be accurately gauged. Sub-catchment sites are
located on rivers that have different drainage basins to the major river for those catchments. Sub-catchment
sites were selected to provide specific water quality data on various land uses or on a geographical region for
enhanced validation of catchment models.
Ten end-of-system sites and 15 sub-catchment sites were selected to monitor total suspended solids and
nutrients (Table 2.2), while eight end-of-system sites and two sub-catchment site were selected to monitor
photosystem II inhibiting pesticides (Table 2.2). All selected sites are fixed monitoring locations of the Great
Barrier Reef Catchment Loads Monitoring Program to allow collection of data over multiple years. Summary
information on each monitoring site including its gauging station identification, location, whether it is an
end-of-system or sub-catchment site, the surface area of each catchment or sub-catchment and the area
monitored is provided in Table 2.1.
Between 1 July 2012 and 30 June 2013 monitoring was undertaken at 25 sites located in the 11 priority
catchments (Figure 2.1 and Table 2.1). These 25 sites have remained as fixed monitoring sites since
commencement of the Great Barrier Reef Catchment Loads Monitoring Program in 2009.
Monitoring at some sites was constrained during the 2012–2013 monitoring year, limiting the analysis and
reporting of data for these catchments. Further details are provided in Section 3.2 and Section 3.3.
2.2 Rainfall Rainfall data were obtained from the Commonwealth of Australia, Bureau of Meteorology National Climate
Centre data archive (BoM 2013a). These data were synthesised using ArcGIS to create maps of Queensland
to display total annual rainfall and annual rainfall deciles during the 2012–2013 monitoring year.
2.3 Water quality sampling Water samples were collected according to methods outlined in the Environmental Protection (Water) Policy
Monitoring and Sampling Manual (DERM 2010). Water quality samples were collected between 1 July 2012
and 30 June 2013. Two different sampling methods were used to collect water samples, depending on
equipment availability and suitability for use at each site. The two methods used were manual grab sampling
and automatic sampling using refrigerated pump samplers. The specific methods employed at each site are
shown in Table 2.2.

Page | 5 www.reefplan.qld.gov.au
Figure 2.1 Map indicating the natural resource management regions, catchments and sites where the Great Barrier Reef Catchment Loads Monitoring Program monitored in 2012–2013.

Page | 6 www.reefplan.qld.gov.au
Table 2.1 Summary information on sites monitored as part of the Great Barrier Reef Catchment Loads Monitoring Program between 1 July 2012 and 30 June 2013. Text in bold are end-of-system sites and the corresponding data, all others are sub-catchment sites.
NRM region Catchment Gauging station
River and site name Type of
site#
Site location Total catchment
surface area (km
2)
Monitored surface area
(km2)
Per cent of catchment monitored Latitude Longitude
Cape York Normanby 105107A Normanby River at Kalpowar Crossing EoS -14.91850 144.21000 24,399 12,934 53
Wet Tropics Barron 110001D Barron River at Myola EoS -16.79983 145.61211 2188 1945 89
Johnstone 112004A North Johnstone River at Tung Oil$ S-C -17.54564 145.93253 2325
925 40
112101B South Johnstone River at Upstream Central Mill$ S-C -17.60889 145.97906 400 17
Tully 113006A Tully River at Euramo EoS -17.99214 145.94247 1683
1450 86
113015A Tully River at Tully Gorge National Park S-C -17.77260 145.65025 482 29
Herbert 116001F Herbert River at Ingham EoS -18.63275 146.14267 9844 8581 87
Burdekin Haughton 119101A Barratta Creek at Northcote EoS -19.69228 147.16879 4051 753 19
Burdekin 120001A Burdekin River at Home Hill EoS -19.64361 147.39584
130,120
129,939 99
120002C Burdekin River at Sellheim S-C -20.00778 146.43694 36,290 28
120301B Belyando River at Gregory Development Road S-C -21.53323 146.85961 35,411 27
120302B Cape River at Taemas S-C -20.99956 146.42712 16,074 12
120310A Suttor River at Bowen Development Road S-C -21.52075 147.04267 10,758 8
120205A Bowen River at Myuna S-C -20.58333 147.60000 7104 5
Mackay
Whitsunday
Pioneer 125013A Pioneer River at Dumbleton Pump Station EoS -21.14407 149.07528 1572 1485 94
Plane 126001A Sandy Creek at Homebush EoS -21.28306 149.02278 2539 326 13
Fitzroy Fitzroy 1300000 Fitzroy River at Rockhampton EoS -23.38111 150.51691
142,552
139,159 98
130401A Isaac River at Yatton S-C -22.66583 149.11695 19,720 14
130206A Theresa Creek at Gregory Highway S-C -23.42924 148.15138 8485 6
130302A Dawson River at Taroom S-C -25.63756 149.79014 15,846 11
130504B Comet River at Comet Weir S-C -23.61247 148.55139 16,457 12
Burnett Mary Burnett 136014A Burnett River at Ben Anderson Barrage Head Water EoS -24.88963 152.29215
33,207
32,891 99
136002D Burnett River at Mt Lawless S-C -25.54471 151.65494 29,355 88
136094A Burnett River at Jones Weir Tail Water S-C -25.59483 151.29735 21,700 65
136106A Burnett River at Eidsvold S-C -25.40225 151.10327 7117 21
# EoS = end-of-system site, S-C = sub-catchment site. $ = the North Johnstone and South Johnstone rivers combined act as an end-of-system site.
Page | 7 www.reefplan.qld.gov.au
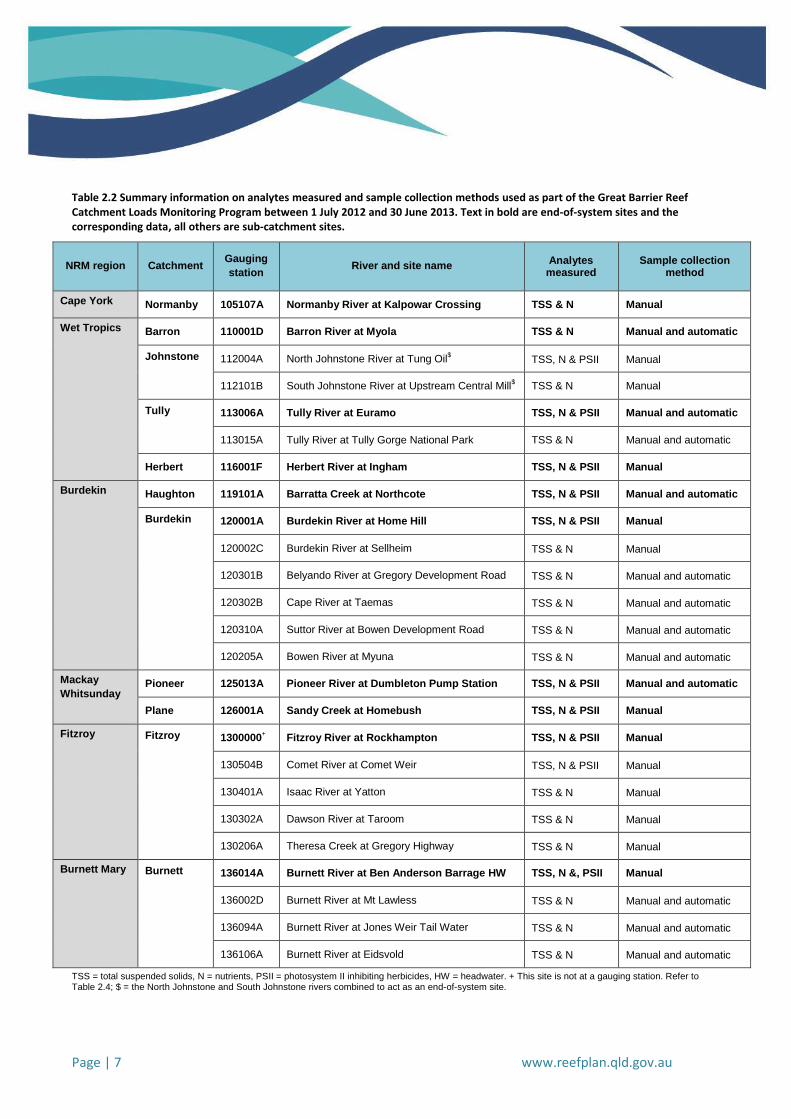
Table 2.2 Summary information on analytes measured and sample collection methods used as part of the Great Barrier Reef Catchment Loads Monitoring Program between 1 July 2012 and 30 June 2013. Text in bold are end-of-system sites and the corresponding data, all others are sub-catchment sites.
NRM region Catchment Gauging
station River and site name
Analytes measured
Sample collection method
Cape York Normanby 105107A Normanby River at Kalpowar Crossing TSS & N Manual
Wet Tropics Barron 110001D Barron River at Myola TSS & N Manual and automatic
Johnstone 112004A North Johnstone River at Tung Oil$ TSS, N & PSII Manual
112101B South Johnstone River at Upstream Central Mill$ TSS & N Manual
Tully 113006A Tully River at Euramo TSS, N & PSII Manual and automatic
113015A Tully River at Tully Gorge National Park TSS & N Manual and automatic
Herbert 116001F Herbert River at Ingham TSS, N & PSII Manual
Burdekin Haughton 119101A Barratta Creek at Northcote TSS, N & PSII Manual and automatic
Burdekin 120001A Burdekin River at Home Hill
TSS, N & PSII Manual
120002C Burdekin River at Sellheim TSS & N Manual
120301B Belyando River at Gregory Development Road TSS & N Manual and automatic
120302B Cape River at Taemas TSS & N Manual and automatic
120310A Suttor River at Bowen Development Road TSS & N Manual and automatic
120205A Bowen River at Myuna TSS & N Manual and automatic
Mackay
Whitsunday Pioneer 125013A Pioneer River at Dumbleton Pump Station TSS, N & PSII Manual and automatic
Plane 126001A Sandy Creek at Homebush TSS, N & PSII Manual
Fitzroy Fitzroy 1300000+ Fitzroy River at Rockhampton TSS, N & PSII Manual
130504B Comet River at Comet Weir TSS, N & PSII Manual
130401A Isaac River at Yatton TSS & N Manual
130302A Dawson River at Taroom TSS & N Manual
130206A Theresa Creek at Gregory Highway TSS & N Manual
Burnett Mary Burnett 136014A Burnett River at Ben Anderson Barrage HW TSS, N &, PSII Manual
136002D Burnett River at Mt Lawless TSS & N Manual and automatic
136094A Burnett River at Jones Weir Tail Water TSS & N Manual and automatic
136106A Burnett River at Eidsvold TSS & N Manual and automatic
TSS = total suspended solids, N = nutrients, PSII = photosystem II inhibiting herbicides, HW = headwater. + This site is not at a gauging station. Refer to Table 2.4; $ = the North Johnstone and South Johnstone rivers combined to act as an end-of-system site.

Page | 8 www.reefplan.qld.gov.au
Intensive sampling (daily or every few hours) occurred during high flow events and reduced sampling
(monthly) was undertaken during ambient (low or base-flow) conditions. Where possible, total suspended
solids, nutrients and pesticide samples were collected concurrently. Approximately 50 per cent of the total
suspended solids and nutrient samples were collected by manual grab sampling and 50 per cent were
collected using refrigerated automatic pump samplers. All pesticide samples were manually collected except
in the Pioneer catchment where an automatic sampler fitted with glass bottles was installed.
Samples were stored and transported in accordance with the Environmental Protection (Water) Policy
Monitoring and Sampling Manual (DERM 2010).
2.4 Quality control During the 2012–2013 monitoring year the Great Barrier Reef Catchment Loads Monitoring Program
continued to implement a quality management system. This system has been used to govern all aspects of
the program delivery since 2010 to ensure consistency and transparency in all areas of the Program.
Continual improvement in the program delivery has been achieved during the 2012–2013 monitoring year
through adoption of the quality management system and demonstrated through:
ongoing delivery of the Great Barrier Reef Catchment Loads Monitoring Quality Management
training package to staff of the Department of National Parks, Racing, Sport and Recreation
(Normanby and Taroom) and partner organisations including Burdekin Bowen Integrated Floodplain
Management Committee
installation of automated water quality monitoring equipment to improve sampling representivity
during flood events in order to improve pollutant load estimates
review of standard operating procedures to ensure all aspects of the program delivery are
documented and undertaken in a manner consistent with state and national standards
2.5 Water quality sample analysis Total suspended solids and nutrient analyses were undertaken by the Science Division Chemistry Centre
(Dutton Park, Queensland) according to Standard Methods 2540 D, 4500-NO3 I, 4500-NH3 H, 4500-Norg D and
4500-P G (APHA-AWWA-WEF 2005). Total suspended solids samples were analysed by a gravimetric
methodology and nutrient samples were analysed via Flow Injection Analysis (colourimetric techniques).
Queensland Health Forensic and Scientific Services (Coopers Plains, Queensland) undertook the analysis of
water samples for pesticides. All pesticide samples were extracted via solid phase extraction and analysed
using liquid chromatography-mass spectrometry (LC-MS) to quantify the five priority photosystem II
inhibiting herbicides (ametryn, atrazine including its breakdown products desethyl atrazine and desisopropyl
atrazine, diuron, hexazinone and tebuthiuron). For the purpose of this report, atrazine together with its
breakdown products is reported as ‘total atrazine’. The total atrazine concentration for each sample was
calculated according to Equation 1, which was then used to calculate a total atrazine load:

Page | 9 www.reefplan.qld.gov.au
Equation 1
𝑇𝑜𝑡𝑎𝑙 𝐴𝑡𝑟𝑎𝑧𝑖𝑛𝑒 = 𝐶𝑒 ×𝑀𝑎
𝑀𝑒+ 𝐶𝑖 ×
𝑀𝑎
𝑀𝑖+ 𝐶𝑎
where, C = concentration, M = molecular weight, a = atrazine, e = desethylatrazine and i = desisopropyl.
During the 2012–2013 monitoring year, water samples were analysed for pesticides in addition to the
photosystem II inhibiting herbicides and their loads are reported for the first time (see Appendix A).
Science Delivery Chemistry Centre (Dutton Park, Queensland) and Queensland Health Forensic and Scientific
Services (Coopers Plains, Queensland) laboratories are both accredited by the National Association of
Testing Authorities (NATA, Australia) for the analyses conducted. Table 2.3 provides a summary of all
analysed parameters and their practical quantitation limits.
Table 2.3 Summary information for each analyte measured and the corresponding practical quantitation limit.
Monitored pollutants Abbreviation Analytes measured Practical
quantitation limit
Sediments
Total suspended solids TSS Total suspended solids 1 mg L-1
Nutrients
Total nitrogen TN Total nitrogen as N 0.03 mg L-1
Particulate nitrogen PN Total nitrogen (suspended) as N 0.03 mg L-1
Dissolved organic nitrogen DON Organic nitrogen (dissolved) as N 0.03 mg L-1
Ammonium nitrogen as N NH4-N Ammonium nitrogen as N 0.002 mg L-1
Oxidised nitrogen as N NOx-N Oxidised nitrogen as N 0.001 mg L-1
Dissolved inorganic nitrogen DIN Ammonium nitrogen as N + Oxidised nitrogen as N
0.002 mg L-1
Total phosphorus TP Total Kjeldahl phosphorus as P 0.02 mg L-1
Particulate phosphorus PP Total phosphorus (suspended) as P 0.02 mg L-1
Dissolved organic phosphorus DOP Organic phosphorus (dissolved) as P 0.02 mg L-1
Dissolved inorganic phosphorus DIP Phosphate phosphorus as P 0.001 mg L-1
Pesticides
Diuron
Pesticide (PSII)
Diuron 0.01 µg L-1
Ametryn Ametryn 0.01 µg L-1
Total Atrazine Atrazine, desethyl atrazine and desisopropyl atrazine
0.01 µg L-1
Tebuthiuron Tebuthiuron 0.01 µg L-1
Hexazinone Hexazinone 0.01 µg L-1

Page | 10 www.reefplan.qld.gov.au
2.6 River discharge River discharge data (hourly-interpolated flow, m3 s-1) were extracted from the Department of Natural
Resources and Mines, Surface Water Database using the Hydstra pre-programmed script
(http://watermonitoring.derm.qld.gov.au/host.htm) (DNRM 2012). The method used to calculate discharge
by the Surface Water Database is presented in Appendix B. The preference was to use data with a quality
code of 10 to 30, based on the Department of Natural Resources and Mines hydrographic methodology for
quality rating flow data (DNRM 2014) (see Appendix C for an explanation of DNRM quality coding). If such
data were not available due to a gauging station error, flows with a quality code of 60 were used (see
Appendix C for an explanation of DNRM quality coding).
If samples were collected at sites without an operating Department of Natural Resources and Mines gauging
station (due to logistic or work health and safety reasons, or site decommissioning) a ‘timing and flow factor’
was calculated. Timing and flow factors were based on flow data from the nearest upstream gauging
station(s). Timing and flow factors were applied to discharge data used in the calculation of loads during the
2012–2013 monitoring year at: North Johnstone River at Goondi Bridge, Burdekin River at Home Hill, Fitzroy
River at Rockhampton and Burnett River at Ben Anderson Barrage Head Water (Table 2.4). In general, the
factors adjust the timing of the flow to account for the delay in time it takes water to flow from the gauging
station to the water quality sampling site.
The long-term mean annual discharge and historical maximum recorded flow for each monitoring site was
calculated using data contained in the Surface Water Database. For three sites, Pioneer River at Dumbleton
Pump Station, Burnett River at Ben Anderson Barrage Head Water and Burnett River at Mt Lawless, historical
discharge was estimated using discharge data from upstream gauging stations as described in Table 2.4.
The exceedence probability (Pe) of the annual discharge was calculated for each monitored site by:
Equation 2
𝑃𝑒 = (1 − 𝑅𝑖
𝑁 + 1) × 100
where R is the rank of the ith total annual (1 July to 30 June) discharge, and N is the number of annual
discharge observations at the monitoring site.

Page | 11 www.reefplan.qld.gov.au
Table 2.4 Timing and flow factors applied to calculate discharge at non-gauged monitoring sites and recently installed gauging stations.
Gauging station River and site name Timing and flow factors
1120049 North Johnstone River at Goondi Bridge
Estimated from discharge data for Tung Oil GS 112004A where:
Discharge North Johnstone River at Goondi Bridge = Discharge North Johnstone River at
Tung Oil
120001A Burdekin River at Home Hill Estimated from discharge data for Clare GS 120006B where:
Discharge Burdekin River at Home Hill = Discharge Burdekin River at Clare
125013A Pioneer River at Dumbleton Pump
Station
Historical discharge was estimated using data from Mirani Weir
Tail Water GS 125007A where:
Discharge Pioneer River Dumbleton Pump Station = Discharge Mirani Weir Tail Water
1300000 Fitzroy River at Rockhampton Estimated from discharge data from The Gap GS 130005A
where: Time Rockhampton = Time The Gap + 14.5 hours
136014A Burnett River at Ben Anderson Barrage
Head Water
Estimated from discharge data for Fig Tree GS 136007A, Degilbo
GS 136011A and Perry GS 136019A where:
Discharge Burnett River at Ben Anderson Barrage Head Water = Discharge Fig Tree +
Discharge Degilbo + Discharge Perry
Historical discharge (pre-1988) was estimated from
Walla GS 136001A and 136001B where:
Discharge Burnett River at Ben Anderson Barrage Head Water = Discharge Walla
136002D Burnett River at Mt Lawless
Historical discharge was estimated using data from Burnett River
at Yenda GS 136002A where:
Discharge Burnett River at Mt Lawless = Discharge Yenda
2.7 Data analysis
2.7.1 Rating of sampling representivity
The suitability of the total suspended solids and nutrients data at each site between 1 July 2012 and
30 June 2013 to calculate loads, was assessed by determining the representivity of the data for each analyte
using the method of Turner et al. (2012) which was based on elements of the Kroon et al. (2010) and Joo et
al. (2012) methods. This is the first time that sampling representivity was calculated for nutrients. The rating
of sampling representivity for total suspended solids and all monitored nutrients are presented individually.
The rating of sampling representivity was assessed against two criteria:
1. the number of samples collected in the top five per cent of flow; and
2. the ratio between the highest flow rate at which a water sample was collected in 2012–2013 and the maximum flow rate recorded (both measured in m3 s-1).
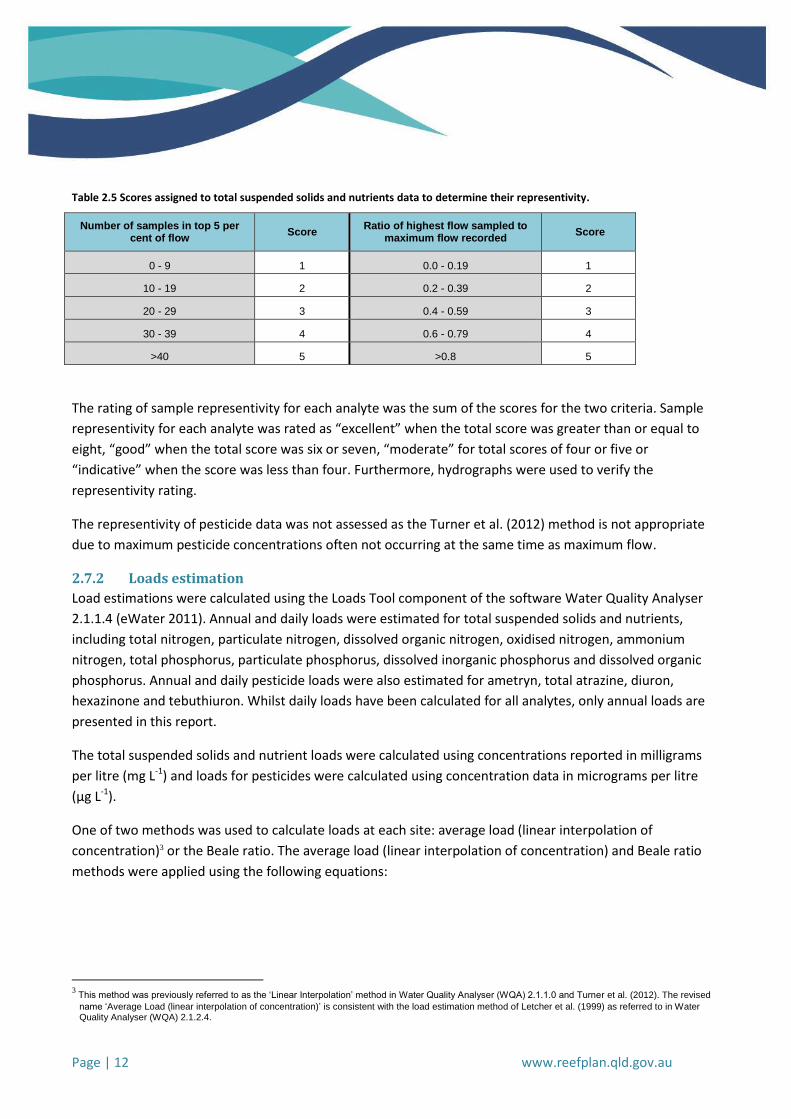
The representivity was determined by assigning a score using the system presented in Table 2.5.
Page | 12 www.reefplan.qld.gov.au
Table 2.5 Scores assigned to total suspended solids and nutrients data to determine their representivity.
Number of samples in top 5 per cent of flow
Score Ratio of highest flow sampled to
maximum flow recorded Score
0 - 9 1 0.0 - 0.19 1
10 - 19 2 0.2 - 0.39 2
20 - 29 3 0.4 - 0.59 3
30 - 39 4 0.6 - 0.79 4
>40 5 >0.8 5
The rating of sample representivity for each analyte was the sum of the scores for the two criteria. Sample
representivity for each analyte was rated as “excellent” when the total score was greater than or equal to
eight, “good” when the total score was six or seven, “moderate” for total scores of four or five or
“indicative” when the score was less than four. Furthermore, hydrographs were used to verify the
representivity rating.
The representivity of pesticide data was not assessed as the Turner et al. (2012) method is not appropriate
due to maximum pesticide concentrations often not occurring at the same time as maximum flow.
2.7.2 Loads estimation
Load estimations were calculated using the Loads Tool component of the software Water Quality Analyser
2.1.1.4 (eWater 2011). Annual and daily loads were estimated for total suspended solids and nutrients,
including total nitrogen, particulate nitrogen, dissolved organic nitrogen, oxidised nitrogen, ammonium
nitrogen, total phosphorus, particulate phosphorus, dissolved inorganic phosphorus and dissolved organic
phosphorus. Annual and daily pesticide loads were also estimated for ametryn, total atrazine, diuron,
hexazinone and tebuthiuron. Whilst daily loads have been calculated for all analytes, only annual loads are
presented in this report.
The total suspended solids and nutrient loads were calculated using concentrations reported in milligrams
per litre (mg L-1) and loads for pesticides were calculated using concentration data in micrograms per litre
(µg L-1).
One of two methods was used to calculate loads at each site: average load (linear interpolation of
concentration)3 or the Beale ratio. The average load (linear interpolation of concentration) and Beale ratio
methods were applied using the following equations:
3 This method was previously referred to as the ‘Linear Interpolation’ method in Water Quality Analyser (WQA) 2.1.1.0 and Turner et al. (2012). The revised
name ‘Average Load (linear interpolation of concentration)’ is consistent with the load estimation method of Letcher et al. (1999) as referred to in Water Quality Analyser (WQA) 2.1.2.4.

Page | 13 www.reefplan.qld.gov.au
Average load (linear interpolation of concentration):
Equation 3
j
n
j
jjq
ccLoad
1
1
2
where jc is the jth sample concentration, and
jq is the inter-sample mean flow (eWater 2011).
Beale ratio:
Equation 4
2
211
11
q
Q
N
ql
QL
N
q
lQLoad
where Q is the total discharge for the period, l is the average load for a sample, L is the observed load, q
is the average of N discharge measurements, is the standard error of L and is the correlation
coefficient for L and Q (eWater 2011; Joo et al. 2012).
2.7.2.1 Total suspended solids, nutrient and pesticides loads
The most appropriate method (average load (linear interpolation of concentration) or Beale ratio) to
calculate annual loads of total suspended solids, total nutrients and dissolved nutrients was determined for
each analyte at each site using the following criteria:
if the majority of major events were sampled on both the rise and fall, then the average load (linear
interpolation of concentration) method was applied (e.g. Barratta Creek at Northcote, Figure 7.10,
Appendix D)
if the majority of the events were not adequately sampled but the representivity rating was
“moderate”, “good” or better, the Beale ratio was applied (e.g. North Johnstone at Tung Oil,
Figure 7.3, Appendix D and Tully River at Tully Gorge, Figure 7.8, Appendix D)
if the majority of the events were not adequately sampled and the representivitiy rating was
“indicative”, then annual loads may be estimate using the Beale ratio method (e.g. Theresa Creek,
Figure 7.24, Appendix D). No indicative loads are reported for the 2012–2013 monitoring year.
The most appropriate load calculation method varied between sites as the numbers of samples collected
and the coverage of the hydrograph varied between sites (Appendix D). This year, as the sampling for total
suspended solids and nutrients was similar, the same loads calculation method was used for both. Similarly,
a single loads calculation method was used for all pesticides, which may have been different to that for total

Page | 14 www.reefplan.qld.gov.au
suspended solids and nutrients. In years where the sampling is not the same different methods may be used
for each analyte.
The loads calculation method applied for total suspended solids, nutrients and pesticides at each monitoring
site is provided in Table 3.2 to Table 3.6. Once the appropriate loads calculation method was determined,
the loads were calculated using the following procedure:
water quality concentration data with a date and time stamp were imported into Water Quality
Analyser 2.1.1.4 (eWater 2011) for each parameter
flow data (m3 s-1 ) were imported into Water Quality Analyser 2.1.1.4 (eWater 2011) on an hourly-
interpolated time stamp
for total suspended solids and nutrients, if the water quality concentration values were below the
practical quantitation limit specified by the Science Division Chemistry Centre, the results were
adjusted to a value of 50 per cent of the practical quantitation limit
the flow data were then aligned to the water quality concentration data
when pesticide concentrations were below the practical quantitation limit, but other samples in the
same event detected the same pesticide, they were replaced by 50 per cent of the practical
quantitation limit. In all other cases, where the sample concentration was reported as below the
practical quantitation limit results were adjusted to 0 µg L-1 in order to not potentially overestimate
the loads
the hydrograph and water quality concentration data were checked for relevance and suitability (i.e.
trends in relation to hysteresis, visual relationship of water quality concentrations to flow and
representativeness)
the data were then processed by the Loads Tool component of Water Quality Analyser 2.1.1.4
(eWater 2011) using the appropriate loads estimation method (as outlined above) and annual loads
for the 1 July 2012 to 30 June 2013 period were reported; and
all calculated results were rounded to two significant figures.
At some sites, the average load (linear interpolation of concentration) method was determined to be the
most appropriate calculation method, but inadequate ambient sampling points were available to calculate
annual loads using Water Quality Analyser 2.1.1.4 (eWater 2011). In these cases, calculated data points that
were 50 per cent of the lowest reported concentration were inserted into the dataset at 1 July 2012 and the
lowest reported concentration was inserted into the dataset at 30 June 2013 to provide tie-down
concentrations for calculations (eWater 2011).
The use of average load (linear interpolation of concentration) and Beale ratio loads calculation methods for
total suspended solids, nutrients and pesticides is consistent with the previous monitoring years from 2006
to 2012 (Joo et al. 2012; Turner et al. 2012; Turner et al. 2013 and Wallace et al. 2014). This is only the
second year, however, that we have reported different method outputs based on the number of
concentration points of each analyte at each site, rather than using the number of concentration points of
total suspended solids as a proxy for the number of concentration data points for all analytes.

Page | 15 www.reefplan.qld.gov.au
2.7.3 Yields
Yields are the load of pollutants (e.g. kilograms, kg or tonnes, t) that originate from a monitored area of land
(e.g. square kilometres, km2) within a catchment (i.e. t km-2 for total suspended solids and kg km-2 for
nutrients and pesticides). Yields provide a useful means of comparing the rate of pollutant delivery between
monitored areas.
2.7.3.1 Total suspended solids and nutrient catchment yields
Catchment yields of total suspended solids and nutrients were calculated for all end-of-system and sub-
catchment sites by dividing the monitored annual pollutant load of each analyte by the total monitored
catchment area.
Equation 5
CY = monitored annual load/MCA
where CY is the catchment yield (t km-2 or kg km-2) and MCA is the monitored catchment area (km2)
upstream of the monitoring site. The yields were calculated using MCA as all land within a catchment can
contribute to total suspended solids and nutrient loads and yields.
Total suspended solids and nutrients may originate from all land use types within the monitored area
including areas set aside for conservation purposes. The yields of total suspended solids and nutrients are
therefore presented as an average rate of pollutant delivery across the total monitored catchment area.
Research conducted in the priority reef catchments has demonstrated high variability in the rate of pollutant
delivery over varying temporal and spatial scales.
2.7.3.2 Pesticide land use yields
In this report, only pesticide land use yields (the load divided by the total surface area of land uses where the
pesticide is registered for use) are presented. In Turner et al (2012) only pesticide catchment yields (load
divided by monitored catchment surface area) were reported while in Turner et al (2013) and Wallace et al
(2014) pesticide catchment yields were presented in the body of the report and pesticide land use yields
were presented in the Appendices.
It is important to note the method applied in the calculation of pesticide land use yields in the present report
differs from previous years as outlined below. These changes were the result of extensive internal review
and consultation with peak industry bodies.
Agricultural chemicals, including photosystem II inhibiting herbicides, are registered for specific applications
within the agricultural sector by the Australian Pesticides and Veterinary Medicines Authority. The
registration of chemicals allows restrictions to be applied to control potential environmental impacts of
these chemical. These restrictions may include the crop type, timing and rate at which registered chemicals
may be applied.
It is possible to use the registered chemical restriction information to determine for which agricultural
production purposes the priority photosystem II inhibiting herbicides were registered during the 2012–2013

Page | 16 www.reefplan.qld.gov.au
monitoring year. Together with land use data available through the Australian Collaborative Land Use
Mapping Program, registered chemical information may be used to calculate the land use yield of
photosystem II inhibiting herbicides.
In each monitored catchment, the land use data were obtained from the Queensland Land Use Monitoring
Program, which is part of the Australian Collaborative Land Use Mapping Program sourced through the
Queensland Government Information Service. These land use data were aggregated into eleven categories,
with only the aggregated land use area for cropping, forestry, grazing, horticulture and sugarcane used to
determine the land use yields (i.e., urban, mining, conservation and water were not used). Aggregated land
use categories used in the calculation of land use yields for the photosystem II herbicides are presented in
Table 2.6.
As these land use categories are an aggregation of land use data categories contained in the Queensland
Land Use Monitoring Program dataset, it is acknowledged that these categories may include specific land
uses to which the application of registered chemical is not permitted (e.g. ametryn may be applied to
pineapples which are included in the horticulture land use category, but may not be applied to bananas
which are also included in the horticulture land use category).
The binary codes (Table 2.6) indicate whether the pesticide is registered for application in an aggregated
land use (indicated by a code of 1) or not (indicated by a code of 0) and whether validation criteria have
been met. The validation criteria applied to the binary coding were:
the pesticide is registered for a land use contained in the aggregated land use category (e.g.
pineapples in horticulture)
the specific land use (e.g. pineapples) to which the pesticide is registered occurs upstream of the
monitoring site.
The pesticide land use yields (LUY) in each catchment were calculated using Equation 6:
Equation 6
LUY = annual monitored pesticide load/LUA
where LUA is the total land use area (km2) in each catchment based on the aggregated land use categories to
which a photosystem II inhibiting herbicide may be applied.
The LUA was determined by:
Equation 7
LUA = ∑ (binary code x surface area of each aggregated land use category) (Table 2.7)
The resulting land use yields (kg km-2) are the yields of pesticides from the monitored area for each
aggregated land use category in each catchment.
Page | 17 www.reefplan.qld.gov.au
These estimates are still likely to underestimate the actual yields as not all land to which use of a pesticide is
permitted will have had that pesticide applied. Complicating this, is that pesticides are predominantly
transported to waterways when pesticide applied land receives sufficient rain to cause surface run-off –
agricultural land not receiving rain but registered for a pesticide will not significantly contribute to the load
or yield. At this point the spatial resolution for rainfall in the Great Barrier Reef catchments is not sufficient
to permit this type of calculation of yields.
The binary coding applied in the calculation of the land use yields in this report is the product of a
consultative review undertaken with peak industry bodies. Changes made to the binary code from previous
reports (Turner et al 2012 and Wallace et al 2013) have removed the implied linkage between a
photosystem II inhibiting herbicide and aggregated land use categories through the application of the
validation criteria. As an example, the binary coding for ametryn and horticulture was adjusted from 1 to a 0.
This occurred because while industry advice (G. Townsend, Growcom, pers. comm., 18 March 2015)
confirmed ametryn is widely used in the control of broad leaf weeds in the production of pineapples.
However, analysis of spatial data confirmed very limited or no pineapple production occurs upstream of the
monitoring sites in the priority catchments (S. Newett, Queensland Department of Agriculture and Forestry,
pers. comm., 16 April 2015). The binary code of atrazine to horticulture was revised from 1 to 0 following
consultation with industry that confirmed atrazine is not typically used in the production of sweet corn
upstream of current monitoring locations (M. Vitelli, AgForce, pers. comm. 4 March 2015; S. Wallace,
Growcom, pers. comm., 18 March 2015). The binary code of atrazine to grazing was also revised from 1 to 0
as advice received from industry (M. Vitelli, AgForce, pers. comm. 4 March 2015) that was subsequently
independently verified, indicated that atrazine is only registered for application to the Giant Sensitive Plant
(Mimosa diplotricha) and this has a restricted distribution in the GBR catchments.
The land use yields of photosystem II inhibiting herbicides for the 2010–2011 and 2011–2012 monitoring
years have also been recalculated using the revised binary coding and presented in Appendix E.
Page | 18 www.reefplan.qld.gov.au
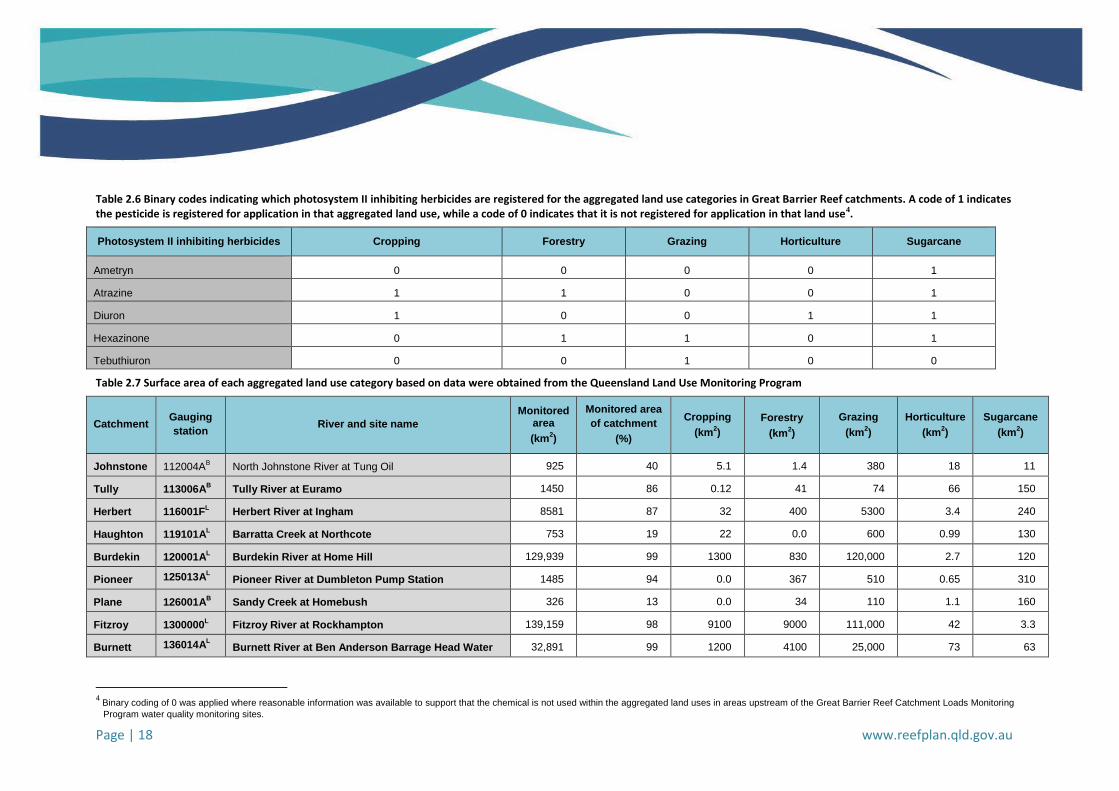
Table 2.6 Binary codes indicating which photosystem II inhibiting herbicides are registered for the aggregated land use categories in Great Barrier Reef catchments. A code of 1 indicates the pesticide is registered for application in that aggregated land use, while a code of 0 indicates that it is not registered for application in that land use4.
Photosystem II inhibiting herbicides Cropping Forestry Grazing Horticulture Sugarcane
Ametryn 0 0 0 0 1
Atrazine 1 1 0 0 1
Diuron 1 0 0 1 1
Hexazinone 0 1 1 0 1
Tebuthiuron 0 0 1 0 0
Table 2.7 Surface area of each aggregated land use category based on data were obtained from the Queensland Land Use Monitoring Program
Catchment Gauging
station River and site name
Monitored area
(km2)
Monitored area
of catchment
(%)
Cropping
(km2)
Forestry
(km2)
Grazing
(km2)
Horticulture
(km2)
Sugarcane
(km2)
Johnstone 112004AB North Johnstone River at Tung Oil 925 40 5.1 1.4 380 18 11
Tully 113006AB Tully River at Euramo 1450 86 0.12 41 74 66 150
Herbert 116001FL Herbert River at Ingham 8581 87 32 400 5300 3.4 240
Haughton 119101AL Barratta Creek at Northcote 753 19 22 0.0 600 0.99 130
Burdekin 120001AL Burdekin River at Home Hill 129,939 99 1300 830 120,000 2.7 120
Pioneer 125013AL Pioneer River at Dumbleton Pump Station 1485 94 0.0 367 510 0.65 310
Plane 126001AB Sandy Creek at Homebush 326 13 0.0 34 110 1.1 160
Fitzroy 1300000L Fitzroy River at Rockhampton 139,159 98 9100 9000 111,000 42 3.3
Burnett 136014AL Burnett River at Ben Anderson Barrage Head Water 32,891 99 1200 4100 25,000 73 63
4 Binary coding of 0 was applied where reasonable information was available to support that the chemical is not used within the aggregated land uses in areas upstream of the Great Barrier Reef Catchment Loads Monitoring
Program water quality monitoring sites.

Page | 19 www.reefplan.qld.gov.au
3 Results and discussion Automatic water sampling equipment at all Burnett River sub-catchment monitoring sites were destroyed
during the major flood event in January 2013. Insufficient water quality data were subsequently available to
calculate annual loads for three sites - Burnett River at Eidsvold, Burnett River at Jones Weir and Burnett
River at Mt Lawless.
Due to logistical reasons, water quality monitoring at Isaac River at Yatton and Theresa Creek at Gregory
Highway was also not sufficient to calculate annual loads for the 2012–2013 monitoring year (see Section 3.2
and Section 3.3). As a result, no calculated data for these sub-catchment sites are presented in this report.
Water samples received from the Normanby catchment were only analysed for total suspended solids due to
extensive and prolonged flooding which prevented the nutrient samples being stored correctly. Monitored
annual loads and yields of nutrients in the Normanby catchment are not presented in this report.
In the discussion of loads and yields, unless it is stated to the contrary, all comparisons are based solely on
the end-of-system sites.
3.1 Rainfall and river discharge Annual rainfall across the priority reef catchments during the 2012–2013 monitoring year (Figure 3.1) was
generally average to slightly below average in the Cape York, Wet Tropics and Burdekin regions (Figure 3.2)
with few flood events occurring in the monitored catchments of these regions (Appendix D). Rainfall in the
Mackay Whitsunday region was average to above average over the same period. In the Fitzroy and Burnett
regions the eastern section of the priority catchments received very high rainfall associated with Ex-Tropical
Cyclone Oswald in late-January 2013 which contributed to these areas receiving above average to very much
above average rainfall over the 2012–2013 monitoring year. The monitored western Fitzroy sub-catchments
however did not receive the significant rainfall associated with this weather event and annual rainfall totals
across this area were below average to very much below average.
3.1.1 El Niño Southern Oscillation and Southern Oscillation Index
Indicators of the El Niño Southern Oscillation were near El Niño thresholds during late winter before shifting
to more neutral pattern during spring – this was an atypical weather pattern as El Niño or La Niña events
typically consolidate during spring (BoM 2013b). The Southern Oscillation Index remained positive in the
neutral range throughout spring before rapidly declining into the negative neutral range with a monthly
Southern Oscillation Index average of -6.13 for December 2012 (BoM 2013b). The El Niño Southern
Oscillation remained in the neutral range throughout summer with the Southern Oscillation Index persisting
with a slightly negative monthly average in the range of -0.29 to -3.8 in January and February, 2013,
respectively (BoM 2013b). Neutral El Niño Southern Oscillation conditions continued throughout autumn
and early winter. The Southern Oscillation Index remained positive over this period with a high 30-day
average of 13.9 recorded to June 30 2013 (BoM 2013b).

Page | 20 www.reefplan.qld.gov.au
3.1.2 Monthly rainfall summary
Rainfall in the central and northern catchments during July 2012 was above average to very much above
average (BoM 2012a) resulting in a small early event in Barratta Creek in the Haughton catchment, the
Burdekin catchment including the Cape and Belyando sub-catchments, the Pioneer catchment, Sandy Creek
in the Plane catchment and the Fitzroy catchment including the Theresa Creek sub-catchment.
Above average rainfall occurred across the central and northern catchments in August 2012. In the Fitzroy
and Burnett regions, however, rainfall was very much below average over this same period (BoM 2012b).
The trend towards below average rainfall extended across most priority reef catchments in September and
October 2012 (BoM 2012c and BoM 2012d) however, the Normanby catchment continued to receive above
average rainfall over this same period. The dry conditions persisted in November and December 2012 with
below average to very much below average rainfall across all priority reef catchments (BoM 2012e and BoM
2013c). Notable rainfall totals were recorded in the Burnett catchment during the first week in November
2012, however, no significant increase in river discharge resulted from these falls possibly owing to the very
dry conditions over the preceding months.
During the middle of January 2013, a monsoon trough with an embedded low pressure system located over
north Queensland resulted in widespread rain across the northern priority reef catchments. High rainfall
totals were received during this period in the Wet Tropics region, including 470 mm at South Johnstone
(BoM 2013c and BoM 2013e). On the 22nd January 2013, Tropical Cyclone Oswald crossed the Queensland
coast from the Gulf of Carpentaria downgrading to a tropical low as it moved across the Peninsula District
and then in a southerly direction toward Cairns. Together with a monsoon trough that extended across the
southern Gulf of Carpentaria, Ex-Tropical Cyclone Oswald resulted in moderate to high rainfall totals across
the Wet Tropics region and later inland of Mackay (BoM 2013e). Very heavy rainfall was received across the
priority reef catchments in the Fitzroy and Burnett Mary regions on the 26th and 27th January 2013. Monthly
rainfall totals in the Burnett catchment were 2–3 times greater than the January long-term average. In the
lower Fitzroy catchment monthly rainfall totals were also very high with Rockhampton receiving 556 mm,
more than 4 times greater than the long-term monthly average (BoM 2013c and BoM 2013e). Monthly
rainfall totals across the remainder of the Fitzroy catchment were generally above average with rainfall
totals at Comet and Taroom 1-2 times the long-term January average (BoM 2013e).
During February 2013, rainfall in the Cape York and Wet Tropics regions was below average to very much
below average, average in the Burdekin and Mackay Whitsunday regions and above average in the Fitzroy
and Burnett regions (BoM 2013f). Small increases in river discharge were observed at all monitoring sites in
the Burnett catchment resulting from rain in the last week of February 2013. During the first week of March
2013 a strong easterly surface flow brought heavy rain to central Queensland (BoM 2013g). Rain received
during this period resulted in a significant increase in discharge in the Pioneer River and Sandy Creek in the
Mackay Whitsunday region and in the southern sub-catchments of the Burdekin region and in the Dawson
and Comet sub-catchments of the Fitzroy region. Tropical Cyclone Sandra and Tropical Cyclone Tim formed
during March 2013 but neither system crossed the coast (BoM 2013g).

Page | 21 www.reefplan.qld.gov.au
All regions received average to above average rainfall during April 2013 (BoM 2013h). High daily rainfall
totals were recorded during the second week of April in the Cape York and Mackay Whitsunday regions, with
some priority reef catchments receiving monthly rainfall totals very much above average. Tropical Cyclone
Zane formed on the 30th April 2013 but did not cross the coast.
Rainfall was average to above average across the priority reef catchments in May with isolated high rainfall
totals occurring in the Johnstone catchment during the second week of May 2013 (BoM 2013i). These falls
resulted in the second largest flow event in the North Johnstone and South Johnstone rivers during the
2012–2013 monitoring year. The remainder of the monitoring year was dry throughout Queensland with all
regions receiving below average to very much below average rainfall in June (BoM 2013j).
3.1.3 River discharge
River discharge in all rivers of the Cape York, Wet Tropics and Burdekin Dry Tropics regions was very much
below the long-term mean (Figure 3.3) with exceedence probabilities at end-of-system sites ranging from
50 per cent in Barratta Creek in the Haughton catchment to 78 per cent in the Barron catchment (Table 3.1).
River discharge in all monitored catchments in the Mackay Whitsunday and Fitzroy regions was very much
above average with exceedence probabilities similar between the Pioneer catchment (28 per cent), Sandy
Creek in the Plane catchment (26 per cent) and the Fitzroy catchment (22 per cent). In the Burnett
catchment, exceptionally high 24-hour rainfall totals in late January 2013 in the upper catchment, resulted in
the highest maximum recorded flow and highest annual recorded discharge. Annual discharge in the Burnett
River during the 2012–2013 monitoring year was five times higher than the long-term mean annual
discharge with an exceedence probability of only three per cent.
River discharge in Burdekin sub-catchments was very much below the mean annual discharge in the Suttor,
Cape, Belyando and upper-Burdekin rivers with exceedence probabilities ranging between 71 per cent and
95 per cent (Table 3.1). Annual river discharge in the Bowen River sub-catchment however was above
average due to the large flow event following significant rainfall across much of the Bowen River sub-
catchment resulting from Ex-Tropical Cyclone Oswald. The elevated river discharge in the Bowen River sub-
catchment relative to the long-term mean is likely to have contributed to the magnitude of difference in the
load of all monitored analytes between the Bowen River sub-catchments and other monitored sub-
catchments in the Burdekin region.
River discharge in the monitored sub-catchments of the Fitzroy River were all very much below the long-
term mean with exceedence probabilities ranging between 63 per cent at Theresa Creek and 80 per cent at
Comet River (Table 3.1). Annual river discharge in these sub-catchments contrasts with the very high annual
discharge for the Fitzroy end-of-system site, which during the 2012–2013 monitoring year was 175 per cent
of the long-term mean annual discharge with an exceedence probability of 22 per cent.
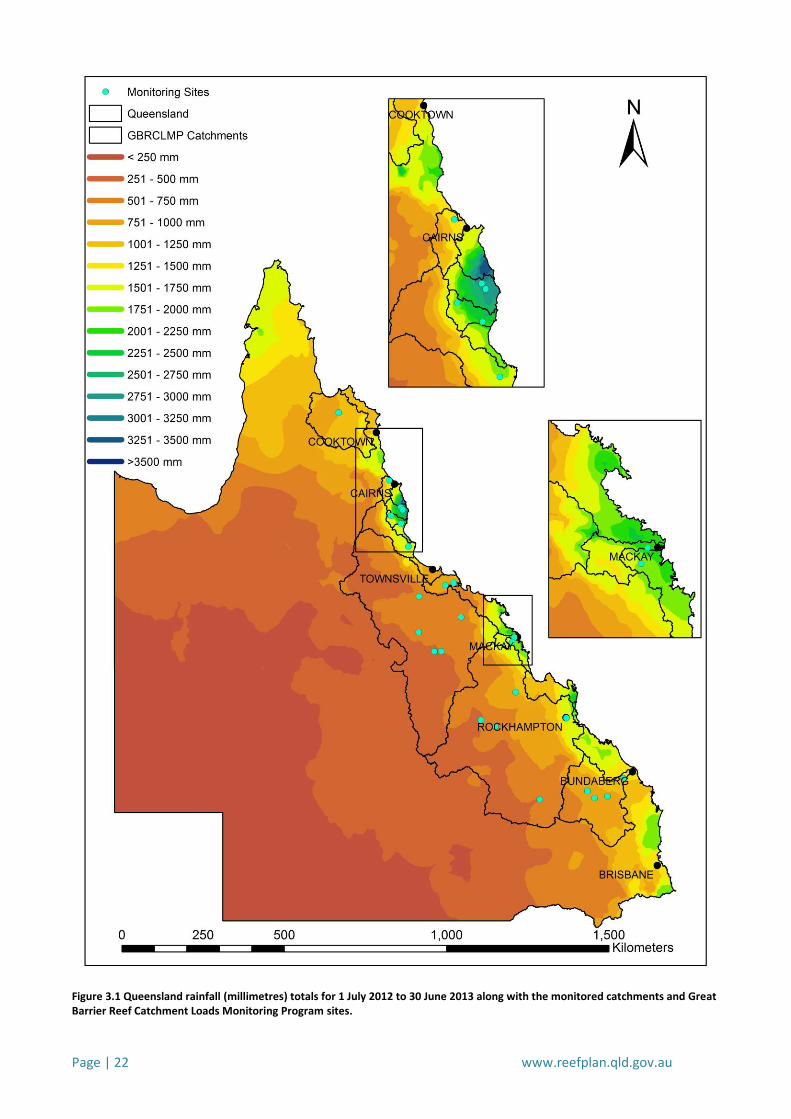
Page | 22 www.reefplan.qld.gov.au
Figure 3.1 Queensland rainfall (millimetres) totals for 1 July 2012 to 30 June 2013 along with the monitored catchments and Great Barrier Reef Catchment Loads Monitoring Program sites.

Page | 23 www.reefplan.qld.gov.au
Figure 3.2 Queensland rainfall deciles for 1 July 2012 to 30 June 2013 along with the monitored catchments and Great Barrier Reef Catchment Loads Monitoring Program sites.

Page | 24 www.reefplan.qld.gov.au
Figure 3.3 Annual discharge for the end-of-system sites (including the North Johnstone and South Johnstone sub-catchments) between 1 July 2012 and 30 June 2013, compared to the long-term mean annual discharge.
0
2,000
4,000
6,000
8,000
10,000
12,000
Normanby Riverat Kalpowar
Crossing
Barron River atMyola
NorthJohnstone River
at GoondiBridge
SouthJohnstone River
at UpstreamCentral Mill
Tully River atEuramo
Herbert River atIngham
Barratta Creekat Northcote
Burdekin Riverat Home Hill
Pioneer River atDumbleton
Pump Station
Sandy Creek atHomebush
Fitzroy River atRockhampton
Burnett River atBen AndersonBarrage Head
Water
Dis
char
ge (
GL)
Long-term mean annual discharge (GL) Discharge during 2012-2013 (GL)

Page | 25 www.reefplan.qld.gov.au
Table 3.1 The total and monitored area for each catchment and summary discharge and flow statistics for the 2012–2013 monitoring year. Text in bold are end-of-system sites and the corresponding data, all others are sub-catchment sites.
NRM region Catchment River and site name
Total catchment
surface area
(km-2
)
Monitored surface
area
(km-2
)
Monitored surface area of
catchment
(%)
Start year of
flow records
Long-term mean
annual discharge
(GL)
Discharge during
2012–2013
(GL)
Exceedence
probability
(%)
Discharge as a per
cent of the long-term
mean annual
discharge
(%)
Historical maximum recorded
flow
(m3 s
-1)
Maximum recorded
flow 2012–2013
(m3 s
-1)
Per cent of
maximum recorded
flow observed in 2012-
2013
(%)
Cape York Normanby Normanby River at Kalpowar
Crossing 24,399 12,934 53 2005 2806 1827 63 65 2088 1860 89
Wet Tropics Barron Barron River at Myola 2188 1945 89 1957 759 365 78 48 3076 520 17
Johnstone$ North Johnstone River at Tung Oil
2325
925 40 1966 1827 1405 71 77 3051 1308 43
South Johnstone River at Upstream
Central Mill 400 17 1974 803 589 67 73 1680 673 40
Tully Tully River at Euramo 1683
1450 86 1972 3098 2847 65 92 1052 1002 95
Tully River at Tully Gorge National Park 482 29 12/2009 990 757 75 76 1883 729 39
Herbert Herbert River at Ingham 9844 8581 87 1915 3436 2951 56 86 11,267 7779 69
Burdekin Haughton Barratta Creek at Northcote 4051 753 19 1974 166 127 50 77 1107 434 39
Burdekin Burdekin River at Home Hill
130,120
129,939 99 1973 9855 4056 65 41 25,483 4688 18
Burdekin River at Sellheim 36,290 28 1968 4747 1932 71 41 24,200 5879 24
Belyando River at Gregory
Development Road 35,411 27 1976 680 56 95 8 4269 88 2
Cape River at Taemas 16,074 12 1968 682 117 82 17 2995 245 8
Suttor River at Bowen Development
Road 10,758 8 2006 741 262 71 35 2379 448 19
Bowen River at Myuna 7104 5 1960 976 1128 32 116 10,480 4458 43
Mackay
Whitsunday
Pioneer Pioneer River at Dumbleton Pump
Station 1572 1485 94 1977 834 1248 28 150 4337 1512 35
Plane Sandy Creek at Homebush 2539 326 13 1966 175 265 26 151 1314 791 60
Fitzroy Fitzroy Fitzroy River at Rockhampton
142,552
139,159 98 1964 5392 9458 22 175 14,493 8919 62
Theresa Creek at Gregory Highway 8485 6 1956 267 96 63 36 4234 216 5
Dawson River at Taroom 15,846 11 1911 403 107 73 27 5858 239 4
Comet River at Comet Weir 16,457 12 2002 1079 111 80 10 3975 106 3
Burnett Mary Burnett Burnett River at Ben Anderson
Barrage Head Water
33,207
32,891 99 1910 1452 7358 3 507 14,357 16,902 118
Burnett River at Mt Lawless 29,355 88 1909 1068 6180 5 579 14,983 16,646 111
Burnett River at Jones Weir Tail Water 21,700 65 1981 567 3734 3 659 8932 14,536 163
Burnett River at Eidsvold 7117 21 1960 218 2364 3 1084 3561 10,954 308
Summary end-of-system loads (including North Johnstone and South
Johnstone rivers) 354,480 330,788 93
$ = the North and South Johnstone rivers combined act as an end-of-system site.

Page | 26 www.reefplan.qld.gov.au
3.2 Sampling representivity The sampling representivity rating identifies the sample coverage achieved during the period of maximum
discharge at each monitoring site. The representivity metric was applied because the majority of the annual
total suspended solids and nutrient loads are transported during the highest flow periods and in order to
reliably calculate the annual pollutant load, it is important that the pollutant concentration data are
available for the periods of highest discharge. Table 3.2 provides a summary of the sampling representivity
ratings – indicating those parameters and sites where the representivity is good and excellent; moderate;
and indicative. Table 7.7 and Table 7.8 in Appendix F provide the representivity rating and the number of
samples used to calculate the loads and yields for all parameters (except pesticides) and sites.
3.2.1 Total suspended solids, total nutrients and dissolved nutrients
Good or excellent sampling representivities were achieved at all end-of-system monitoring sites for all
monitored analytes during the 2012–2013 monitoring year (Table 3.2).
A high level of sampling representivity was achieved in many of the sub-catchment monitoring sites. In the
Johnstone catchment, good sampling representivity was achieved at the North Johnstone River for all
analytes and excellent sampling representivity was achieved at the South Johnstone River (Table 3.2). This is
a notable improvement from the previous monitoring year when only moderate representivity was achieved
at the South Johnstone River (Wallace et al. 2014).
In the Burdekin sub-catchments good sampling representivity was achieved at the Belyando, Cape and
Suttor rivers and excellent sampling representivity was achieved in the Bowen River (Table 3.2). This is a
significant achievement as no annual monitored loads have previously been reported for the Bowen River
due to the very poor sample coverage at this remote site. The installation of an automated water quality
monitoring trailer and the direct engagement of the Burdekin Bowen Integrated Floodplain Management
Committee to collect water samples during ambient base flow and flood events, has demonstrated the
significant data quality outcomes achieved through strategic investment in water quality monitoring
infrastructure and investment in building strong relationships with regional natural resource management
partners. In contrast to excellent sampling representivity achieved at the Bowen River, only moderate
representivity was achieved at the upper-Burdekin River monitoring site at Sellheim which was manually
sampled.
In the Fitzroy River sub-catchments, sampling representivity at the manually sampled Comet River and
Dawson Rivers was good for all analytes (Table 3.2). Only indicative representivity was achieved however at
the Theresa Creek sub-catchment monitoring site where only five samples were collected during the 2012–
2013 monitoring year and no samples were collected during the largest flow event which unseasonably
occurred during July 2012 (Figure 7.23).
In the upper Burnett River excellent monthly ambient sampling was conducted. All automated water quality
sampling equipment was destroyed however during the record flood in the Burnett catchment following Ex-
Tropical Cyclone Oswald which crossed the upper catchment during late-January 2013. Due to damage to

Page | 27 www.reefplan.qld.gov.au
road infrastructure caused by the flood it was not possible to manually collect water quality samples at these
sites during the period of peak discharge. However, throughout this period water quality samples were
manually collected at the Burnett River end-of-system monitoring site, achieving excellent sampling
representivity for all monitored analytes.
3.3 Total suspended solids and nutrient loads and yields The 2012–2013 annual monitored loads and yields of total suspended solids and nutrients for the 11
monitored catchments were determined using measured discharge and contaminant concentration data.
The resulting loads are estimates of the mass of each analyte transported past the monitoring sites and do
not necessarily represent the loads discharged to the Great Barrier Reef lagoon – as the end-of-system
monitoring sites are not located at the mouth of the river or creek (refer to Section 2.1), this unmonitored
portion of the catchment or sub-catchment may contribute, remove or degrade total suspended solids,
nutrients and pesticides. The annual loads discharged to the Great Barrier Reef for all 35 catchments are
estimated using catchment modelling and are reported elsewhere in the Paddock to Reef Program (DPC
2014).
The monitored annual loads and yields of total suspended solids and nutrients are presented in Table 3.2 to
Table 3.4. The relative contribution of each monitored catchment to the total annual load for each
parameter is presented in Figure 3.4 to Figure 3.14.
3.3.1 Total suspended solids
3.3.1.1 Total suspended solid loads
The combined monitored annual load of total suspended solids for the 11 priority catchments was 9.6 Mt
(Table 3.2) of which, over 90 per cent was derived from the Burnett (3.7 Mt; 39 per cent), Burdekin (2.5 Mt;
26 per cent) and Fitzroy (2.5 Mt; 26 per cent) catchments (Table 3.2 and Figure 3.4). The monitored annual
loads of total suspended solids in all other catchments were comparatively low, with each catchment
contributing less than five per cent of the monitored total suspended solids load during 2012–2013. The
lowest monitored total suspended solids load occurred in Barratta Creek in the Haughton catchment (5.5 kt;
0.06 per cent).
In the Burdekin catchment, the highest monitored annual sub-catchment load was in the Bowen River
(2.3 Mt), with lower monitored annual loads of total suspended solids in the upper Burdekin river
(monitored at Sellheim, 0.61 Mt) and in the Suttor (0.058 Mt), Belyando (0.019 Mt) and Cape (0.012 Mt)
rivers (Table 3.2). The monitored annual load of total suspended solids in the Bowen River was
approximately 90 per cent of the monitored annual Burdekin River end-of-system load. The magnitude of
difference in the monitored annual load of total suspended solids between the Bowen River and other sub-
catchments of the Burdekin is likely influenced by above average rainfall being received in the Bowen River
sub-catchment and very much below average rainfall in all other sub-catchments during the 2012–2013
monitoring year.
The Fitzroy River sub-catchments produced low monitored annual loads of total suspended solids during the
2012–2013 monitoring year. The monitored annual total suspended solid loads in the Dawson River sub-

Page | 28 www.reefplan.qld.gov.au
catchment and Comet River sub-catchment were 0.028 Mt and 0.062 Mt, respectively. Insufficient data were
available to calculate an annual load of total suspended solids for the Theresa Creek and Isaac River sub-
catchments.
The end-of-system monitored annual load of total suspended solids in the Burnett River (3.7 Mt) during the
2012–2013 monitoring year was exceptionally high compared to the previous monitoring years 2006–2012
(Joo et all. 2012; Turner et al. 2012; Turner et al. 2013; Wallace et al. 2014) during which the end-of-system
total suspended solids loads ranged between 15kt in the below average rainfall year of 2011–2012 (Wallace
et al., 2014) to 2.6 Mt in 2010–2011 when rainfall was very much above average (Turner et al., 2013). It is
estimated that greater than 90 per cent of the monitored annual total suspended solid load was exported
past the monitoring point during the major flow event resulting from Ex-Tropical Cyclone Oswald.
Due to extensive damage to automated water quality monitoring equipment and road infrastructure, no
water samples were collected from the Burnett River sub-catchment monitoring sites during the major
flood. Although good ambient sampling was achieved by the regional hydrographic staff of the Department
of Natural Resources and Mines throughout the year, insufficient data were available to calculate the
monitored annual total suspended solids loads for these sites.
Figure 3.4 Per cent contribution from each catchment to the combined monitored annual total suspended solids load.
3.3.1.2 Total suspended solids yields
During the 2012–2013 monitoring year, the highest yield of total suspended solids was derived from the
Burnett catchment (110 t km-2) which resulted from the major flood in late January 2013 (Table 3.3). A high
yield of total suspended solids was also monitored in the Pioneer River (89 t km-2) and moderate yields in the
Barron (51 t km-2), North Johnstone (48 t km-2), Herbert (44 t km-2) and South Johnstone (43 t km-2)
catchments (Table 3.3). Excluding the Burnett River, all of these catchments are all located in the Wet
Tropics and Mackay Whitsunday natural resource management regions and have consistently produced the
1.5% 1.0% 0.47% 0.18% 0.48% 4.0%
0.06%
26%
1.4%
0.12%
26%
39%
Normanby
Barron
North Johnstone
South Johnstone
Tully
Herbert
Haughton
Burdekin
Pioneer
Plane
Fitzroy
Burnett
Page | 29 www.reefplan.qld.gov.au
highest yields of total suspended solids during previous monitoring years (Turner et al. 2012 and 2013;
Wallace et al. 2014). It is notable, however, the yield of total suspended solids in the Tully catchment
(32 t km-2) during the 2012–2013 monitoring year was much less than other catchment within the Wet
Tropics region.
The lowest monitored annual yields of total suspended solids occurred in Barratta Creek in the Haughton
catchment (7.3 t km-2) and the Normanby (11 t km-2), Fitzroy (18 t km-2) and Burdekin (20 t km-2) catchments
(Table 3.3). Land use in these latter catchments is predominately dry land grazing which have been reported
previously as contributing low yields of total suspended solids (Turner et al. 2012; Turner et al. 2013;
Wallace et al. 2014).
Amongst the sub-catchments of the Burdekin River, the yield of total suspended solids varied greatly (Table
3.3). The Bowen River sub-catchment had an exceptionally high yield of total suspended solids (330 t km-2)
compared to all other sub-catchments monitored as part of the Great Barrier Reef Catchment Loads
Monitoring Program. As this is the first year of monitoring data for the Bowen River sub-catchment, it is not
known whether this total suspended solids yield is typical for this catchment. The yield of total suspended
solids at all other Burdekin sub-catchment monitoring sites was however, much less than reported for the
previous monitoring years 2009–2012 (Turner et al. 2012; Turner et al. 2013; Wallace et al. 2014). The yield
of total suspended solids in the upper Burdekin River sub-catchment monitored at Sellheim (17 t km-2) was
high compared to the monitored annual yield of total suspended solids in the Suttor (5.4 t km-2), Cape
(0.76 t km-2) and Belyando (0.53 t km-2) catchments (Table 3.3).
Within the Fitzroy sub-catchments the monitored annual yields of total suspended solids at the Comet River
(3.7 t km-2) was approximately twice the monitored annual yield at the Dawson River (1.8 t km-2). No data
were available for Theresa Creek or Isaac River sub-catchments during the 2012–2013 monitoring year.
3.3.2 Nitrogen
3.3.2.1 Nitrogen load
The combined monitored annual load of total nitrogen for the monitored reef catchments was 34 kt (Table
3.2). The Burnett (12 kt; 35 per cent), Fitzroy (9.3 kt; 27 per cent) and Burdekin (5.5 kt; 16 per cent) rivers
produced the largest loads of total nitrogen with the Herbert River (3.3 kt; 9.7 per cent) also contributing a
substantial load (Table 3.2 and Figure 3.5). All remaining catchments each contributed less than
four per cent of the monitored annual total nitrogen load with Sandy Creek in the Plane catchment
contributing the lowest total nitrogen load by an end-of-system site (0.20 kt; 0.59 per cent).
During the 2012–2013 monitoring year the combined monitored annual load of dissolved inorganic nitrogen
was 6.6 kt (Table 3.2). The largest monitored annual loads of dissolved inorganic nitrogen were derived from
the Burnett (2.0 kt; 30 per cent) and Herbert (1.5 kt; 23 per cent) catchments with substantial loads also
from the Fitzroy (0.92 kt; 14 per cent), Burdekin (0.80 kt; 12 per cent) and Tully (0.71 kt; 11 per cent)
catchments (Table 3.2 and Figure 3.6). The remaining catchments each contributed less than four per cent of

Page | 30 www.reefplan.qld.gov.au
the combined monitored load (Figure 3.6) with the lowest loads from end-of-system sites occurring in Sandy
Creek in the Plane catchment (0.042 kt; 0.63 per cent) and Barron catchment (0.044 t; 0.66 per cent).
Oxidised nitrogen accounted for 87 per cent of the monitored dissolved inorganic nitrogen load during the
2012–2013 monitoring year. This ratio is less than previous monitoring years due largely to the high load of
ammonium nitrogen (540 t) from the Burnett catchment relative to the total monitored end-of-system load
of dissolved inorganic nitrogen from all catchments (6.6 kt). The Burnett (1.5 kt; 26 per cent), Herbert (1.5 kt;
26 per cent), Burdekin (0.76 kt; 13 per cent) and Fitzroy (0.71 kt; 12 per cent) and Tully (0.67 kt; 12 per cent)
rivers together accounted for 89 per cent of the monitored oxidised nitrogen load. All remaining catchments
each contributed less than four per cent of the monitored oxidised nitrogen load with the lowest monitored
annual loads occurring in Sandy Creek in the Plane catchment (0.038 t; 0.66 per cent) and the Barron
catchment (0.037 kt; 0.64 per cent).
During the 2012–2013 monitoring year, the monitored annual load of ammonium nitrogen from all
monitored priority reef catchments was 970 t (Table 3.2). The largest monitored annual loads were derived
from the Burnett (540 t; 56 per cent), Fitzroy (210 t; 22 per cent) and Herbert (63 t; 6.5 per cent)
catchments. The remaining catchments each contributed less than five per cent of the total monitored
annual ammonium nitrogen load. The lowest loads were derived from Barron catchment (6.9 t;
0.71 per cent), Barratta Creek in the Haughton catchment (5.4 t; 0.56 per cent), South Johnstone catchment
(5.3 t; 0.55 per cent) and Sandy Creek in the Plane catchment (3.6 t; 0.37 per cent).
The relative proportion of the ammonium nitrogen load to the oxidised nitrogen load varied greatly amongst
catchments. In the Burnett, Fitzroy, Pioneer and Barron catchments the relative proportion was high (1:2.8
to 1:5.4) whilst in the Tully (1:18) and Herbert (1:24) the relative proportions were much lower.
Approximately 42 per cent of the total monitored annual particulate nitrogen load of 17 kt was derived from
the Burnett catchment (7.3 kt). The Fitzroy (4.3 kt; 25 per cent) Burdekin (3.1 kt; 18 per cent) and Herbert
catchments also contributed moderate loads of particulate nitrogen with the remaining catchments each
contributing less than four per cent of the monitored annual load. The lowest monitored annual loads of
particulate nitrogen were derived from Sandy Creek in the Plane catchment (0.063 kt; 0.28 per cent) and
Barratta Creek in the Haughton catchment (0.055 kt; 0.17 per cent).
The monitored annual load of dissolved organic nitrogen, 10kt, followed a similar trend to the particulate
nitrogen load with the majority of the load coming from the large dry inland catchments of the Fitzroy
(4.1 kt; 39 per cent), Burnett (2.9 kt; 28 per cent), Burdekin (1.5 kt; 14 per cent) and Herbert (0.75 kt;
7.2 per cent) catchments (Table 3.2 and Figure 3.10). All remaining sites each contributed less than
four per cent of the dissolved organic nitrogen load with the lowest monitored annual loads derived from
Sandy Creek in the Plane catchment (0.096 kt; 0.92 per cent), Barratta Creek in the Haughton catchment
(0.078 kt; 0.75 per cent) and the South Johnstone catchment (0.057 kt; 0.55 per cent).

Page | 31 www.reefplan.qld.gov.au
3.3.2.2 Nitrogen yields
The largest monitored annual yield of total nitrogen was derived from the Tully catchment (890 kg km-2) with
high yields of total nitrogen also occurring in the Pioneer catchment (700 kg km-2), Sandy Creek in the Plane
catchment (610 kg km-2) and the North Johnstone and South Johnstone catchments (660 kg km-2 and
590 kg km-2, respectively) (Table 3.3). The yield of total nitrogen from the Burnett catchment (370 kg km-2)
following the major flood event in January 2013 was substantially higher than previously reported by the
Great Barrier Reef Catchment Loads Monitoring Program (Turner et al. 2012; Turner et al. 2013, Wallace et
al. 2014). The lowest monitored annual yields of total nitrogen were derived from the Fitzroy (67 kg km-2)
and Burdekin (42 kg km-2) catchments.
The highest yield of particulate nitrogen during the 2012–2013 monitoring year occurred in the Pioneer
catchment (340 kg km-2) with comparatively high yields also occurring in the North Johnstone (270 kg km-2)
and South Johnstone (230 kg km-2) catchments, Sandy Creek in the Plane catchment (190 kg km-2) and Tully
catchment (170 kg km-2). Each of these catchments contain high proportions of intensive agricultural land
uses including irrigated cropping (DPC 2011) which is in contrast to the large inland catchments which are
dominated by grazing and had comparatively low yields of particulate nitrogen. The lowest yields of
particulate nitrogen occurred in the Fitzroy (31 kg km-2) and Burdekin (24 kg km-2) catchments.
The monitored annual yield of dissolved organic nitrogen was similar amongst the small coastal catchments
in the Wet Tropics and Mackay Whitsunday regions (Table 3.3) with the highest yields derived from Sandy
Creek in the Plane catchment (300 kg km-2) and the Tully catchment (230 kg km-2). The lowest yields of
dissolved organic nitrogen were derived from the Fitzroy (29 kg km-2) and Burdekin (12 kg km-2) catchments.
The Tully catchment had the highest monitored annual yield of dissolved inorganic nitrogen (490 kg km-2),
which similar to previous years, was driven by a high yield of oxidised nitrogen (460 kg km-2) (Table 3.3). High
yields of oxidised nitrogen were monitored across all catchments of the Wet Tropics and Mackay
Whitsunday regions excluding the Barron catchment which yielded only 19 kg km-2. The high yield of
ammonium nitrogen was similar for the Pioneer (29 kg km-2) and Tully (26 kg km-2) catchments. The lowest
yields of dissolved inorganic nitrogen, ammonium nitrogen and oxidised nitrogen occurred in the Fitzroy and
Burdekin catchments (Table 3.3).

Page | 32 www.reefplan.qld.gov.au
Figure 3.5 Per cent contribution from each catchment to the combined monitored total nitrogen annual load.
Figure 3.6 Per cent contribution from each catchment to the combined monitored dissolved inorganic nitrogen annual load.
Figure 3.7 Per cent contribution from each catchment to the combined monitored oxidised nitrogen annual load.
Figure 3.8 Per cent contribution from each catchment to the combined monitored ammonium nitrogen annual load.
Figure 3.9 Per cent contribution from each catchment to the combined monitored particulate nitrogen annual load.
Figure 3.10 Per cent contribution from each catchment to the combined monitored dissolved organic nitrogen annual load.
1.3% 1.8 0.67% 3.8%
9.7%
0.67%
16%
2.9%
0.59%
27%
35%
0.66% 3.0% 1.2%
11%
23%
1.4%
12% 3.8% 0.63%
14%
30%
0.64% 3.1% 1.3%
12%
26%
1.5% 13% 3.6%
0.66%
12%
26%
0.71% 1.4% 0.55% 3.8%
6.5%
0.56%
3.9%
4.5%
0.37%
22%
56%
1.6% 1.5% 0.54% 1.5% 6.4%
0.32%
18%
2.9%
0.36%
25%
42%
1.3% 1.5% 0.55% 3.3% 7.2%
0.75%
14%
2.8%
0.92%
39%
28%

Page | 33 www.reefplan.qld.gov.au
3.3.3 Phosphorus
3.3.3.1 Phosphorus load
The combined annual monitored load of total phosphorus during the 2012–2013 monitoring year was
approximately 9.4 kt (Table 3.2). The majority of the total phosphorus load was produced by the Fitzroy
(3.7 kt; 39 per cent), Burnett (2.9 kt; 31 per cent) and Burdekin (1.9 kt; 20 per cent) catchments (Table 3.2
and Figure 3.11). The remaining catchments each contributed less than four per cent of the annual
monitored total phosphorus load, with the lowest total phosphorus loads occurring in Sandy Creek in the
Plane catchment (0.053 kt; 0.56 per cent), South Johnstone catchment 0.043 kt; 0.46 per cent) and Barratta
Creek in the Haughton catchment (0.024 kt; 0.26 per cent).
The monitored annual load of dissolved organic phosphorus from all catchments was 370 t (Table 3.2). The
Fitzroy (150 t; 40 per cent) and Burnett (78 t; 21 per cent) catchments contributed the largest monitored
annual dissolved organic phosphorus loads (Table 3.2 and Figure 3.12). The Burdekin (40t; 11 per cent),
Herbert (32 t; 8.6 per cent) and Tully (29 t; 7.8 per cent) catchments also contributed moderate loads. All
other catchments each contributed less than four per cent of the combined monitored annual dissolved
organic phosphorus load during the 2012–2013 monitoring year. The smallest load of dissolved organic
phosphorus was monitored in Barratta Creek in the Haughton catchment (2.3 t; 0.62 per cent) (Figure 3.12).
Approximately two-thirds of the total monitored annual dissolved inorganic phosphorus load (2.3 kt) came
from the Fitzroy catchment (1.5 kt) and a further 16 per cent from the Burdekin (0.36 kt) and 12 per cent
from the Burnett catchment (0.28 kt) (Table 3.2 and Figure 3.13). Together these three catchments
accounted for 93 per cent of the total monitored annual load of dissolved inorganic phosphorus. The
proportionally high contribution from the Fitzroy catchment is consistent with the observed trend over
2009–2012 monitoring years (Turner et al. 2012; Turner et al. 2013; Wallace et al. 2014). All remaining
catchments each contributed two per cent or less of the monitored annual load of dissolved inorganic
phosphorus (Figure 3.13).
The monitored annual particulate phosphorus load (6.9 kt) accounted for approximately three quarters of
the total phosphorus monitored annual load (9.4 kt) of the monitored catchments (Table 3.2) which is
consistent with previous monitoring years (Turner et al. 2012; Turner et al. 2013; Wallace et al. 2014). The
majority of the monitored annual particulate phosphorus load was derived from the Burnett (2.6 kt;
38 per cent), Fitzroy (2.1 kt; 30 per cent) and Burdekin (1.5 kt; 22 per cent) catchments (Figure 3.14 and
Table 3.2). All other catchments each produced less than four per cent of the monitored annual particulate
phosphorus load with the lowest loads occurring in Sandy Creek in the Plane catchment (0.019 kt;
0.28 per cent) and Barratta Creek in the Haughton catchment (0.012 kt; 0.17 per cent). Particulate
phosphorus accounted for more than 75 per cent of the total phosphorus load at all end-of-system
monitoring sites except at Sandy Creek in the Plane catchment (36 per cent), Barratta Creek in the Haughton
catchment (50 per cent) and the Fitzroy catchment (57 per cent) where this proportion was considerably
lower.

Page | 34 www.reefplan.qld.gov.au
Figure 3.11 Per cent contribution from each catchment to the combined monitored total phosphorus annual load.
Figure 3.12 Per cent contribution from each catchment to the combined monitored dissolved organic phosphorus annual load.
Figure 3.13 Per cent contribution from each catchment to the combined monitored dissolved inorganic phosphorus annual load.
Figure 3.14 Per cent contribution from each catchment to the combined monitored particulate phosphorus annual load.
0.88% 1.1% 0.46% 0.76% 3.3%
0.26%
20%
2.2%
0.56%
39%
31%
0.99% 3.8% 1.9%
7.8%
8.6%
0.62%
11%
3.5%
1.1% 40%
21%
0.35% 0.38% 0.19% 0.43% 2.0%
0.43%
16%
2.0%
1.4%
65%
12%
1.0% 1.4% 0.55% 0.83% 3.6% 0.17%
22%
2.3%
0.28%
30%
38%

Page | 35 www.reefplan.qld.gov.au
3.3.3.2 Phosphorus yields
Sandy Creek in the Plane catchment and the Pioneer catchment produced the highest monitored annual
yields of total phosphorus (160 kg km-2 and 140 kg km-2, respectively) (Table 3.4). High monitored annual
yields of total phosphorus were also derived from the North Johnstone (110 kg km-2) and South Johnstone
(110 kg km-2) catchments. The Burnett catchment also produced a high total phosphorus yield of 89 kg km-2.
The yield of total phosphorus from all other catchments was substantially less with the lowest yields
occurring in the Fitzroy (27 kg km-2) and Burdekin (14 kg km-2) catchments. The yield of total phosphorus in
the Bowen River sub-catchment, 270 kg km-2, was exceptionally high compared to all end-of-system
monitoring sites driven by a high yield of particulate phosphorus (260 kg km-2) which accounted for
approximately 96 per cent of the total phosphorus load at this site during the 2012–2013 monitoring year.
The highest yields of particulate phosphorus at the monitored end-of-system sites were in the Pioneer
(110 kg km-2), North Johnstone (100 kg km-2) and South Johnstone (95 kg km-2) catchments. The lowest yield
of particulate phosphorus was in Barratta Creek in the Haughton catchment (15 kg km-2) and the Fitzroy
(15 kg km-2) and Burdekin (11 kg km-2) catchments.
The monitored annual yield of dissolved inorganic phosphorus at Sandy Creek in the Plane catchment
(98 kg km-2) was exceptionally high compared to all other monitored catchments including three times more
than the monitored yield in the Pioneer catchment (30 kg km-2) and ten to twenty times more than all
catchments in the Wet Tropics region. The high yield of dissolved inorganic phosphorus in Sandy Creek in the
Plane catchment is consistent with previous monitoring years (Wallace et al. 2014). The lowest yield of
dissolved inorganic phosphorus was in the Burdekin catchment (2.7 kg km-2).
The Tully and South Johnstone catchments produced the highest monitored annual yields of dissolved
organic phosphorus (20 kg km-2, 18 kg km-2, respectively), with moderate yields also occurring in the North
Johnstone catchment (15 kg km-2) and Sandy Creek in the Plane catchment (13 kg km-2). Consistent with all
monitored forms phosphorus, the Fitzroy and Burdekin catchments produced the lowest yields of dissolved
organic phosphorus, with 1.1 kg km-2 and 0.31 kg km-2 respectively.
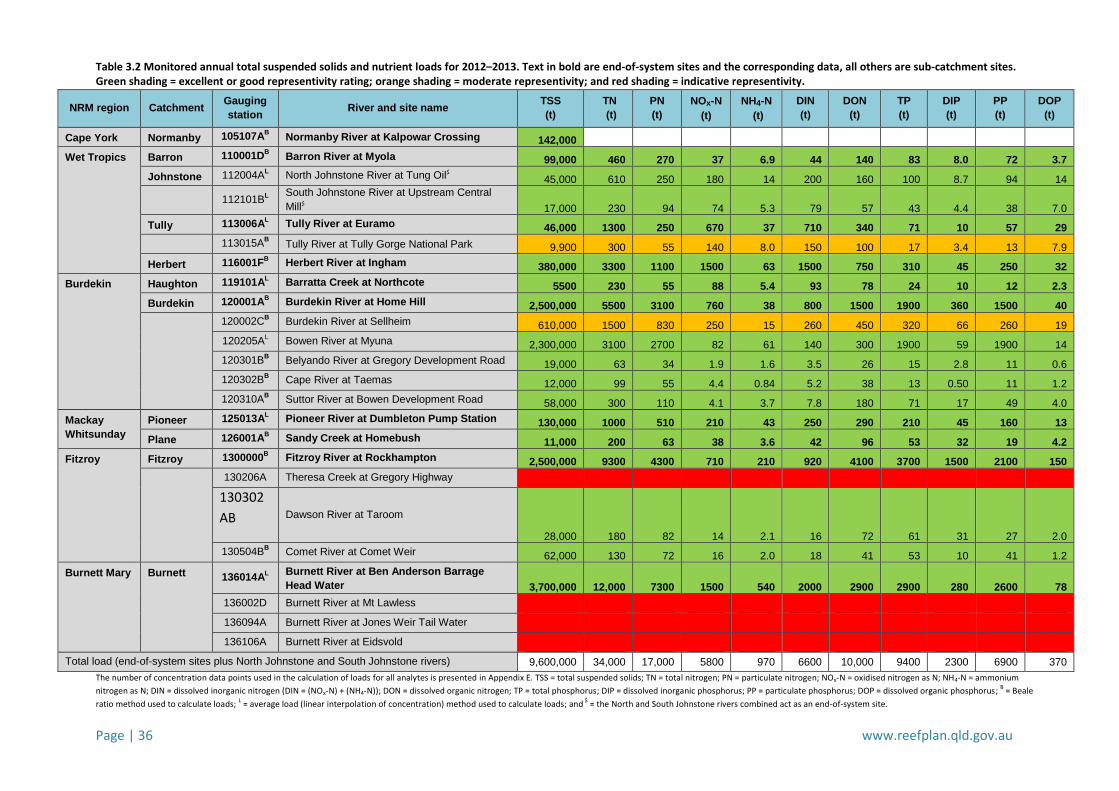
Page | 36 www.reefplan.qld.gov.au
Table 3.2 Monitored annual total suspended solids and nutrient loads for 2012–2013. Text in bold are end-of-system sites and the corresponding data, all others are sub-catchment sites. Green shading = excellent or good representivity rating; orange shading = moderate representivity; and red shading = indicative representivity.
The number of concentration data points used in the calculation of loads for all analytes is presented in Appendix E. TSS = total suspended solids; TN = total nitrogen; PN = particulate nitrogen; NOx-N = oxidised nitrogen as N; NH4-N = ammonium
nitrogen as N; DIN = dissolved inorganic nitrogen (DIN = (NOx-N) + (NH4-N)); DON = dissolved organic nitrogen; TP = total phosphorus; DIP = dissolved inorganic phosphorus; PP = particulate phosphorus; DOP = dissolved organic phosphorus; B = Beale
ratio method used to calculate loads; L = average load (linear interpolation of concentration) method used to calculate loads; and
$ = the North and South Johnstone rivers combined act as an end-of-system site.
NRM region Catchment Gauging
station River and site name
TSS
(t)
TN
(t)
PN
(t)
NOx-N
(t)
NH4-N
(t)
DIN
(t)
DON
(t)
TP
(t)
DIP
(t)
PP
(t)
DOP
(t)
Cape York Normanby 105107AB Normanby River at Kalpowar Crossing 142,000
Wet Tropics Barron 110001DB Barron River at Myola 99,000 460 270 37 6.9 44 140 83 8.0 72 3.7
Johnstone 112004AL North Johnstone River at Tung Oil$ 45,000 610 250 180 14 200 160 100 8.7 94 14
112101BL
South Johnstone River at Upstream Central
Mill$ 17,000 230 94 74 5.3 79 57 43 4.4 38 7.0
Tully 113006AL Tully River at Euramo 46,000 1300 250 670 37 710 340 71 10 57 29
113015AB Tully River at Tully Gorge National Park 9,900 300 55 140 8.0 150 100 17 3.4 13 7.9
Herbert 116001FB Herbert River at Ingham 380,000 3300 1100 1500 63 1500 750 310 45 250 32
Burdekin Haughton 119101AL Barratta Creek at Northcote 5500 230 55 88 5.4 93 78 24 10 12 2.3
Burdekin 120001AB Burdekin River at Home Hill 2,500,000 5500 3100 760 38 800 1500 1900 360 1500 40
120002CB Burdekin River at Sellheim 610,000 1500 830 250 15 260 450 320 66 260 19
120205AL Bowen River at Myuna 2,300,000 3100 2700 82 61 140 300 1900 59 1900 14
120301BB Belyando River at Gregory Development Road 19,000 63 34 1.9 1.6 3.5 26 15 2.8 11 0.6
120302BB Cape River at Taemas 12,000 99 55 4.4 0.84 5.2 38 13 0.50 11 1.2
120310AB Suttor River at Bowen Development Road 58,000 300 110 4.1 3.7 7.8 180 71 17 49 4.0
Mackay
Whitsunday
Pioneer 125013AL Pioneer River at Dumbleton Pump Station 130,000 1000 510 210 43 250 290 210 45 160 13
Plane 126001AB Sandy Creek at Homebush 11,000 200 63 38 3.6 42 96 53 32 19 4.2
Fitzroy Fitzroy 1300000B Fitzroy River at Rockhampton 2,500,000 9300 4300 710 210 920 4100 3700 1500 2100 150
130206A Theresa Creek at Gregory Highway
130302
AB Dawson River at Taroom
28,000 180 82 14 2.1 16 72 61 31 27 2.0
130504BB Comet River at Comet Weir 62,000 130 72 16 2.0 18 41 53 10 41 1.2
Burnett Mary Burnett 136014AL
Burnett River at Ben Anderson Barrage
Head Water 3,700,000 12,000 7300 1500 540 2000 2900 2900 280 2600 78
136002D Burnett River at Mt Lawless
136094A Burnett River at Jones Weir Tail Water
136106A Burnett River at Eidsvold
Total load (end-of-system sites plus North Johnstone and South Johnstone rivers) 9,600,000 34,000 17,000 5800 970 6600 10,000 9400 2300 6900 370

Page | 37 www.reefplan.qld.gov.au
Table 3.3 Total suspended solids and nitrogen yields calculated for 2012–2013 along with the per cent of catchment monitored. Text in bold are end-of-system sites and the corresponding data, all others are sub-catchment sites. Green shading = excellent or good representivity rating; orange shading = moderate representivity; and red shading = indicative.
The number of concentration data points used in the calculation of loads for all analytes is presented in Appendix F. TSS = total suspended solids; TN = total nitrogen; PN = particulate nitrogen; NOx-N = oxidised nitrogen as N; NH4-N = ammonium
nitrogen as N; DIN = dissolved inorganic nitrogen (DIN = (NOx-N) + (NH4-N)); DON = dissolved organic nitrogen;B = Beale ratio method used to calculate loads; L = average load (linear interpolation of concentration) method used to calculate loads; and $ =
the North and South Johnstone rivers combined act as an end-of-system site.
NRM region Catchment Gauging
station River and site name
Monitored area of catchment
(%)
TSS
(t km-2)
TN
(kg km-2)
PN
(kg km-2)
NOx-N
(kg km-2)
NH4-N
(kg km-2)
DIN
(kg km-2)
DON
(kg km-2)
Cape York Normanby 105107AB Normanby River at Kalpowar Crossing 53 11
Wet Tropics Barron 110001DB Barron River at Myola 89 51 230 140 19 3.6 22 72
Johnstone 112004AL North Johnstone River at Tung Oil $ 40 48 660 270 200 15 210 180
112101BL South Johnstone River at Upstream Central Mill $
17 43 590 230 190 13 200 140
Tully 113006AL Tully River at Euramo 86 32 890 170 460 26 490 230
113015AB Tully River at Tully Gorge National Park 29 21 630 110 290 17 300 220
Herbert 116001FB Herbert River at Ingham 87 44 390 120 170 7.3 180 87
Burdekin Haughton 119101AL Barratta Creek at Northcote 19 7.3 300 73 120 7.1 120 100
Burdekin 120001AB Burdekin River at Home Hill
99 20 42 24 5.9 0.29 6.2 12
120002CB Burdekin River at Sellheim 28 17 42 23 6.8 0.42 7.2 12
120205AL Bowen River at Myuna 5 330 440 370 12 8.5 20 43
120301BB Belyando River at Gregory Development Road
27 0.53 1.8 0.95 0.053 0.045 0.098 0.73
120302BB Cape River at Taemas 12 0.76 6.1 3.4 0.27 0.052 0.33 2.4
120310AB Suttor River at Bowen Development Road 8 5.4 28 10 0.38 0.34 0.72 17
Mackay
Whitsunday
Pioneer 125013AL Pioneer River at Dumbleton Pump Station 94 89 700 340 140 29 170 190
Plane 126001AB Sandy Creek at Homebush 13 35 610 190 120 11 130 300
Fitzroy Fitzroy 1300000B Fitzroy River at Rockhampton 98 18 67 31 5.1 1.5 6.6 29
130206AB Theresa Creek at Gregory Highway 6
130302AB Dawson River at Taroom 11 1.8 11 5.2 0.87 0.13 1.0 4.5
130504BB Comet River at Comet Weir 12 3.7 7.9 4.4 0.99 0.12 1.1 2.5
Burnett Mary Burnett 136014A
L
Burnett River at Ben Anderson Barrage Head
Water
99 110 370 220 45 16 61 88
136002D Burnett River at Mt Lawless 88
136094A Burnett River at Jones Weir Tail Water 65
136106A Burnett River at Eidsvold 21

Page | 38 www.reefplan.qld.gov.au
Table 3.4 Phosphorus yields calculated for 2012–2013 along with the per cent of catchment monitored. Text in bold are end-of-system sites and the corresponding data, all others are sub-catchment sites. Green shading = excellent or good representivity rating; orange shading = moderate representivity; and red shading = indicative.
The number of
concentration data points used in the calculation of loads for all analytes is presented in Appendix F. TP = total phosphorus; DIP = dissolved inorganic phosphorus; PP = particulate phosphorus; DOP = dissolved organic phosphorus; B = Beale ratio
method used to calculate loads; L
= average load (linear interpolation of concentration) method used to calculate loads; and $ = the North and South Johnstone rivers combined act as an end-of-system site.
NRM region Catchment Gauging
station River and site name
Monitored area of
catchment (%)
TP
(kg km-2)
DIP
(kg km-2)
PP
(kg km-2)
DOP
(kg km-2)
Cape York Normanby 105107AB Normanby River at Kalpowar Crossing 53
Wet Tropics Barron 110001DB Barron River at Myola 89 42 4.1 37 1.9
Johnstone 112004AL North Johnstone River at Tung Oil $ 40 110 9.4 100 15
112101BL South Johnstone River at Upstream Central Mill $ 17 110 11 95 18
Tully 113006AL Tully River at Euramo 86 49 6.7 39 20
113015AB Tully River at Tully Gorge National Park 29 35 7.0 28 16
Herbert 116001FB Herbert River at Ingham 87 36 5.3 29 3.7
Burdekin Haughton 119101AL Barratta Creek at Northcote 19 32 14 15 3.0
Burdekin 120001AB Burdekin River at Home Hill 99 14 2.7 11 0.31
120002CB Burdekin River at Sellheim 28 8.7 1.8 7.1 0.53
120205A Bowen River at Myuna 5 270 8.3 260 2.0
120301BB Belyando River at Gregory Development Road 27 0.42 0.079 0.32 0.018
120302BB Cape River at Taemas 12 0.80 0.031 0.70 0.073
120310AB Suttor River at Bowen Development Road 8 6.6 1.6 4.6 0.38
Mackay
Whitsunday
Pioneer 125013AL Pioneer River at Dumbleton Pump Station 94 140 30 110 8.7
Plane 126001AB Sandy Creek at Homebush 13 160 98 60 13
Fitzroy Fitzroy 1300000B Fitzroy River at Rockhampton 98 27 11 15 1.1
130206AB Theresa Creek at Gregory Highway 6
130302AB Dawson River at Taroom 11 3.9 2 1.7 0.13
130504BB Comet River at Comet Weir 12 3.2 0.62 2.5 0.071
Burnett Mary Burnett 136014AL
Burnett River at Ben Anderson Barrage Head
Water 99
89 8.6 79 2.4
136002D Burnett River at Mt Lawless 88
136094A Burnett River at Jones Weir Tail Water 65
136106A Burnett River at Eidsvold 21

Page | 39 www.reefplan.qld.gov.au
3.4 Pesticide loads and yields
3.4.1.1 Annual load
The monitored annual loads of the five priority photosystem II inhibiting herbicides, ametryn, total atrazine,
diuron, hexazinone and tebuthiuron, were calculated for each monitored site (Table 3.5). The loads of other
herbicides detected are presented in Appendix A. It is important to note that no monitored annual loads of
pesticides are presented for the North Johnstone sub-catchment due to insufficient data (only five pesticide
samples were collected) being available for this manually sampled site. The annual monitored load of
photosystem II inhibiting herbicides derived from the North Johnstone sub-catchment have previously been
reported by the Great Barrier Reef Catchment Loads Monitoring Program since 2009 (see Turner et al. 2012;
Turner et al. 2013 and Wallace et al. 2014).
When all monitored catchments are considered together, the total monitored annual load of the five priority
photosystem II inhibiting herbicides exported past the end-of-system monitoring sites were (from largest to
smallest): 5100 kg of tebuthiuron; 2600 kg of total atrazine; 1900 kg of diuron; 440 kg of hexazinone; and
100 kg of ametryn (Table 3.5). The per cent contributions of each catchment to the total monitored annual
load for each of the five priority photosystem II inhibiting herbicides are presented in Figure 3.15 to Figure
3.19.
Of the five priority photosystem II inhibiting herbicides, only total atrazine and diuron were detected at all
nine end-of-system monitoring sites where loads were calculated (Table 3.5). This is consistent with results
from the previous monitoring year (Wallace et al. 2014). A monitored diuron load could not, however, be
calculated for the Comet River sub-catchment as there were no detections of diuron above the limit of
reporting. Ametryn was not detected above the limit of reporting in the Fitzroy catchment and hexazinone
was not detected above the limit of reporting in the Burdekin catchment or Comet River sub-catchment.
Tebuthiuron was detected (above the limit of reporting) at the least number of sites, with no monitored
loads calculated for the Tully, Herbert, Pioneer or Plane catchments.
The largest monitored annual loads of ametryn were in the Pioneer (28 kg) and Burnett catchments (27 kg),
together accounting for more than half (28 per cent and 27 per cent, respectively) of the total monitored
ametryn load (100 kg) (Table 3.5 and Figure 3.15). The lowest calculable load of ametryn was from the
Burdekin catchment (1.7 kg; 1.7 per cent). The largest monitored annual load of total atrazine was recorded
at Barratta Creek in the Haughton catchment (520 kg) which was 20 per cent of the combined monitored
total atrazine load of 2600 kg (Table 3.5). The monitored annual load of total atrazine in all other end-of-
system sites ranged from 120 kg in the Herbert catchment (4.6 per cent) to 470 kg in the Fitzroy
(18 per cent) and 460 kg in the Pioneer catchments (18 per cent) (Table 3.5 and Figure 3.16). The monitored
annual load of total atrazine in the Comet River sub-catchment was 41 kg.
The greatest contributions to the total monitored annual diuron load (1900 kg) were from the Tully (570 kg;
30 per cent) and Pioneer (440 kg; 23 per cent) catchments, with Sandy Creek in the Plane catchment (310 kg;
16 per cent) and the Herbert catchment (270 kg; 14 per cent) also contributing a substantial proportion of

Page | 40 www.reefplan.qld.gov.au
the total monitored annual diuron load. The lowest calculable monitored annual load of diuron was in the
Burdekin catchment (29 kg; 1.5 per cent) (Table 3.5 and Figure 3.17).
The largest monitored annual load of hexazinone was recorded in the Tully catchment (130 kg; 30 per cent).
Comparatively moderate loads of hexazinone were recorded in the Pioneer (93 kg; 21 per cent), Herbert
(81 kg; 19 per cent) and Burnett (71 kg; 16 per cent) catchments. The lowest calculable monitored load of
hexazinone was in Barratta Creek in the Haughton catchment (1.1 kg; 0.25 per cent) (Table 3.5 and Figure
3.18).
The largest monitored annual load of tebuthiuron was recorded in the Fitzroy catchment (5000 kg;
98 per cent) with comparatively small loads in the Burnett (87 kg; 1.7 per cent) and Burdekin (30 kg;
0.59 per cent) catchments. Very small monitored annual loads of tebuthiuron occurred in Barratta Creek in
the Haughton catchment (0.049 kg; 0.00096 per cent) (Table 3.5 and Figure 3.19) the Comet River sub-
catchment (1.9 kg).
3.4.1.2 Pesticide land use yields
Pesticide land use yieldsi5 of the five priority photosystem II inhibiting herbicides are presented in Table 3.6
for all end-of-system sites monitored for pesticides. The highest land use yield of ametryn occurred in the
Burnett catchment (0.43 kg km-2) with moderate yields also occurring in Barratta Creek in the Haughton
catchment (0.098 kg km-2), the Pioneer catchment (0.091 kg km-2) and Sandy Creek in the Plane catchment
(0.077 kg km-2). The lowest calculable yield of ametryn was in the Burdekin catchment (0.014 kg km-2).
The highest land use yields of total atrazine was from Barratta Creek in the Haughton catchment (3.4 kg km-
2) followed by Sandy Creek in the Plane catchment (1.5 kg km-2) and the Tully (1.0 kg km-2) catchments (Table
3.6). The land use yields of total atrazine in all other catchments were much less, ranging from 0.18 kg km-2
in the Herbert catchment down to 0.026 kg km-2 in the Fitzroy catchment.
The diuron land use yields were highest in the Tully catchment (2.7 kg km-2) followed by Sandy Creek in the
Plane catchment (2.0 kg km-2). Lower, but still substantial land use yields were recorded in the Pioneer
(1.4 kg km-2) and Herbert (0.98 kg km-2) catchments and at Barratta Creek in the Haughton catchment
(0.52 kg km-2). The land use yields of diuron were comparatively low in all other monitored catchments with
the lowest occurring in the Fitzroy catchment (0.011 kg km-2).
The highest land use yield of hexazinone was also in the Tully catchment (0.49 kg km-2) which was
approximately 2.6 times larger than the next highest land use yield recorded at Sandy Creek in the Plane
catchment (0.19 kg km-2) (Table 3.6). The land use yield of hexazinone was moderate in the Pioneer
catchment (0.079 kg km-2) and low in all other catchments.
The land use yield of tebuthiuron was highest in the Fitzroy catchment (0.045 kg km-2). The land use yields of
tebuthiuron were markedly lower in the other three catchments where it was detected. The tebuthiuron
land use yield was thirteen times smaller in the Burnett catchment (0.0034 kg km-2), 180 times smaller in the
5 Note pesticide land use yields for 2010–2011 and 2011–2012 are presented in the appendices of Turner et al (2013) and Wallace et al (2014), respectively.

Page | 41 www.reefplan.qld.gov.au
Burdekin catchment (0.00025 kg km-2), and approximately 550 times smaller at Barratta Creek in the
Haughton Catchment (0.000082 kg km-2).

Page | 42 www.reefplan.qld.gov.au
Table 3.5 Monitored annual loads calculated for the five priority photosystem II inhibiting herbicides: ametryn, total atrazine, diuron, hexazinone and tebuthiuron. Text in bold are end-of-system sites and the corresponding data, all others are sub-catchment sites.
NRM region Catchment Gauging
station River and site name
Monitored area
(km-2)
Monitored
area of
catchment
(%)
n Ametryn
(kg)
Total Atrazine
(kg)
Diuron
(kg)
Hexazinone
(kg)
Tebuthiuron
(kg)
Wet tropics Johnstone 112004A North Johnstone River at Tung Oil 925 40 5 NC NC NC NC NC
Tully 113006A Tully River at EuramoB 1450 86 65 10 190 570 130 NC
Herbert 116001F Herbert River at InghamL 8581 87 44 7.8 120 270 81 NC
Burdekin Haughton 119101A Barratta Creek at NorthcoteL 753 19 31 13 520 80 1.1 0.049
Burdekin 120001A Burdekin River at Home HillL 129,939 99 29 1.7 240 29 NC 30
Mackay
Whitsunday
Pioneer 125013A Pioneer River at Dumbleton Pump
StationL
1485 94 104 28 460 440 93 NC
Plane 126001A Sandy Creek at HomebushB 326 13 26 12 280 310 55 NC
Fitzroy Fitzroy 1300000 Fitzroy River at RockhamptonB 139,159 98 24 NC 470 98 4.5 5000
130504B Comet River at Comet WeirB 16,457 12 8 NC 41 NC NC 1.9
Burnett Mary Burnett 136014A Burnett River at Ben Anderson
Barrage Head WaterL
32,891 27 70 27 310 130 71 87
Total (monitored end-of-system sites) 314,584 97 393 100 2600 1900 440 5100
n = the number of grab samples used to estimate loads; NC = a load was not calculated as all the concentrations for all samples collected were below the practical quantitation limit or there were insufficient samples collected over the year to
calculate a load; L = average load (linear interpolation of concentration) method used to calculate loads;
B = Beale ratio method used to calculate loads.

Page | 43 www.reefplan.qld.gov.au
Table 3.6 The monitored annual yields calculated for the five priority photosystem II inhibiting herbicides: ametryn, total atrazine, diuron, hexazinone and tebuthiuron. All sites are end-of-system sites with the corresponding data.
PSII herbicide Registered land
use types River and site name
Land use yield
(kg km-2)
Ametryn Sugarcane Tully River at EuramoB 0.067
Herbert River at InghamL 0.032
Barratta Creek at NorthcoteL 0.098
Burdekin River at Home HillL 0.014
Pioneer River at Dumbleton Pump StationL 0.091
Sandy Creek at HomebushB 0.077
Fitzroy River at RockhamptonB NC
Burnett River at Ben Anderson Barrage Head WaterL 0.43
Total atrazine Cropping, forestry, and sugarcane
Tully River at EuramoB 1.0
Herbert River at InghamL 0.18
Barratta Creek at NorthcoteL 3.4
Burdekin River at Home HillL 0.11
Pioneer River at Dumbleton Pump StationL 0.68
Sandy Creek at HomebushB 1.5
Fitzroy River at RockhamptonB 0.026
Burnett River at Ben Anderson Barrage Head WaterL 0.058
Diuron Cropping, horticulture and sugarcane
Tully River at EuramoB 2.7
Herbert River at InghamL 0.98
Barratta Creek at NorthcoteL 0.52
Burdekin River at Home HillL 0.020
Pioneer River at Dumbleton Pump StationL 1.4
Sandy Creek at HomebushB 2.0
Fitzroy River at RockhamptonB 0.011
Burnett River at Ben Anderson Barrage Head WaterL 0.096
Hexazinone Forestry, grazing and sugarcane
Tully River at EuramoB 0.49
Herbert River at InghamL 0.014
Barratta Creek at NorthcoteL 0.0015
Burdekin River at Home HillL NC
Pioneer River at Dumbleton Pump StationL 0.079
Sandy Creek at HomebushB 0.19
Fitzroy River at RockhamptonB 0.000037
Burnett River at Ben Anderson Barrage Head WaterL 0.0024
Tebuthiuron Grazing Tully River at EuramoB NC
Herbert River at InghamL NC
Barratta Creek at NorthcoteL 0.000082
Burdekin River at Home HillL 0.00025
Pioneer River at Dumbleton Pump StationL NC
Sandy Creek at HomebushB NC
Fitzroy River at RockhamptonB 0.045
Burnett River at Ben Anderson Barrage Head WaterL 0.0034
NC = a load was not calculated as all the concentrations for all samples collected were below the practical quantitation limit L = average load (linear interpolation of concentration) method used to calculate loads;
B = Beale ratio method used to calculate loads

Page | 44 www.reefplan.qld.gov.au
Figure 3.15 Per cent contribution from each end-of-system site (excluding North Johnstone) to the combined monitored annual ametryn load.
Figure 3.16 Per cent contribution from each end-of-system site (excluding North Johnstone) to the combined monitored annual total atrazine load.
Figure 3.17 Per cent contribution from each end-of-system site (excluding North Johnstone) to the combined monitored annual diuron load.
Figure 3.18 Per cent contribution from each end-of-system site (excluding North Johnstone) to the combined monitored annual hexazinone load.
Figure 3.19 Per cent contribution from each end-of-system site (excluding North Johnstone) to the combined monitored annual tebuthiuron load.
10%
7.8%
13%
1.7%
28%
12%
27%
7.3%
4.6%
20%
9.3%
18%
11%
18%
12%
30%
14%
4.2% 1.5%
23%
16%
5.1%
6.7%
30%
19%
0.25%
21%
13%
1.0%
16%
0.00096% 0.59%
98%
1.7%
Page | 45 www.reefplan.qld.gov.au
4 Conclusions The Great Barrier Reef Catchment Loads Monitoring Program determined the monitored annual loads and
yields of total suspended solids and ten forms of phosphorus and nitrogen, for ten end-of-system sites and
15 sub-catchment sites, covering eleven catchments, during the 2012–2013 monitoring year. The monitored
annual loads and yields of five priority photosystem II inhibiting herbicides were also determined for eight
end-of-system sites and one sub-catchment monitoring site. During 2012–2013:
Priority reef catchments in the Cape York, Wet Tropics and Burdekin regions received average to
slightly below average rainfall over the monitoring year, average to above average rainfall in the
Mackay Whitsunday region, and very much above average rainfall in the lower Fitzroy and Burnett
catchments.
The long-term mean annual discharge was exceeded in the Pioneer catchment, Sandy Creek in the
Plane catchment and in the Fitzroy and Burnett catchments.
Discharge in the Burnett River was five times greater than the long-term annual mean.
Good to excellent sampling representivity was achieved for total suspended sediments and all
measures of nutrients at all end-of-system monitoring sites providing robust loads data for the
validation of catchment models. This was the first year that loads were reported for the Bowen River
sub-catchment monitoring site – this was achieved through installation of automated water quality
monitoring equipment and direct engagement with a regional natural resource management agency
to collect water samples.
The monitored catchments generated approximately 9.6 million tonnes of total suspended solids,
34,000 tonnes of nitrogen and 9400 tonnes of phosphorus.
The Burnett and Fitzroy catchments generally generated the highest loads of all non-pesticide
pollutants. The Herbert catchment also accounted for a large proportion of the dissolved inorganic
nitrogen and oxidised nitrogen and the Burdekin catchment accounted for a large proportion of the
dissolved inorganic phosphorus load.
The Burnett, Fitzroy and Burdekin catchments combined accounted for at least 90 per cent of the
monitored annual loads of total suspended solids and total phosphorus and more than 75 per cent
of the monitored annual load of total nitrogen.
Sandy Creek in the Plane catchment, Barratta Creek in the Haughton catchment and the South
Johnstone sub-catchments generally produced the lowest loads of all non-pesticide pollutants and
the Barron catchment also produced some of the lowest loads of some forms of nitrogen and
phosphorus.
The highest monitored annual yield of total suspended solids was in the Burnett catchment, total
nitrogen in the Tully catchment and total phosphorus in Sandy Creek in the Plane catchment. The
Tully, Johnstone and Pioneer catchments and Sandy Creek in the Plane catchment produced high
yields of all monitored non-pesticide pollutants. The major flood in the Burnett catchment resulted

Page | 46 www.reefplan.qld.gov.au
in yields of all monitored non-pesticide pollutants being much higher than previously reported by
the Great Barrier Reef Catchment Loads Monitoring.
Generally the lowest monitored annual yields of all non-herbicide pollutants were in the Burdekin
and Fitzroy catchments. The Normanby catchment produced very low yields of total suspended
solids but was not monitored for nutrients during the 2012–2013 monitoring year.
The annual load of the five priority photosystem II inhibiting herbicides (ametryn, total atrazine,
diuron, hexazinone and tebuthiuron) was approximately 10,000 kilograms.
Photosystem II inhibiting herbicides were detected at all monitored sites.
The total monitored annual pesticide loads at the end-of-system monitoring sites were, in
descending order: 5100 kilograms of tebuthiuron; 2600 kilograms of total atrazine; 1900 kilograms
of diuron; 440 kilograms of hexazinone; and 100 kilograms of ametryn.
Total atrazine and diuron were detected at all monitored end-of-system sites; ametryn was detected
at all catchments except in the Fitzroy and hexazinone was detected at all catchments except the
Burdekin and the Comet River sub-catchment.
The Pioneer and Burnett catchments contributed the largest monitored annual load of ametryn,
Barratta creek contributed the largest load of total atrazine, the Tully catchment contributed the
largest load of diuron and hexazinone and the Fitzroy catchment contributed the largest loads of
tebuthiuron.
The highest land use yield of ametryn was in the Burnett catchment, total atrazine at Barratta Creek
in the Haughton catchment, diuron and hexazinone in the Tully catchment and tebuthiuron in the
Fitzroy catchment.

Page | 47 www.reefplan.qld.gov.au
5 Acknowledgements The Great Barrier Reef Catchment Loads Monitoring Program is grateful to the Queensland Government
hydrographers who were responsible for the installation and maintenance of all gauging stations and
associated infrastructure and for the collection and validation of flow data that are critical to the pollutant
loads presented in this report.
The authors wish to thank all stakeholders who assisted in the collection of water samples during the 2012–
2013 monitoring year including Queensland Government hydrographers and scientists, officers of Terrain
Natural Resource Management, Burdekin Bowen Integrated Floodplain Management Advisory Committee
and Queensland Parks and Wildlife Services staff. Thanks also go to the Queensland Government catchment
modellers and to all members, partners and stakeholders of Reef Plan and the Paddock to Reef Program.
The Program would like to acknowledge assistance and advice provided by the Science Division Chemistry
Centre and Queensland Health Forensic and Scientific Services. The contribution of industry and other
Queensland Government Departments in providing advice regarding the use of pesticides in various
agricultural sectors for the calculation of pesticide land use yields is greatly appreciated.
Finally, the authors wish to thank the internal and external reviewers for their valuable feedback provided
on an earlier draft of this report, in particular Prof. Rodger Grayson and Dr. Roger Shaw.

Page | 48 www.reefplan.qld.gov.au
6 References APHA-AWWA-WEF (American Public Health Association, American Water Works Association and Water
Environment Federation) (2005). Standard methods for the examination of water and wastewater, 21st
edition. Clesceri L.S., Greenberg A.E., Trussell R.R. (eds). American Public Health Association, American
Water Works Association and Water Environment Federation, Washington, USA.
BoM (Bureau of Meteorology) (2012a) Monthly Weather Review – Queensland, July 2012. Accessed on
04/02/2014. <http://www.bom.gov.au>.
BoM (Bureau of Meteorology) (2012b) Monthly Weather Review – Queensland, August 2012. Accessed on
04/02/2014. <http://www.bom.gov.au>.
BoM (Bureau of Meteorology) (2012c) Monthly Weather Review – Queensland, September 2012. Accessed
on 04/02/2014. <http://www.bom.gov.au>.
BoM (Bureau of Meteorology) (2012d) Monthly Weather Review – Queensland, October 2012. Accessed on
04/02/2014. <http://www.bom.gov.au>.
BoM (Bureau of Meteorology) (2012e) Monthly Weather Review – Queensland, November 2012. Accessed
on 04/02/2014. <http://www.bom.gov.au>.
BoM (Bureau of Meteorology) (2013a). Archive – Twelve month rainfall totals for Queensland. Accessed on
04/02/2014. <http://www.bom.gov.au>.
BoM (Bureau of Meteorology) (2013b) ENSO Wrap-Up Archive, 03 Jul 2012 to 02 Jul 2013. Accessed on
04/02/2014. <http://www.bom.gov.au>.
BoM (Bureau of Meteorology) (2013c) Special Climate Statement 44 – extreme rainfall and flooding in
coastal Queensland and New South Wales, 5 February 2013. Accessed on 04/02/2014.
<http://www.bom.gov.au>.
BoM (Bureau of Meteorology) (2013d) Monthly Weather Review – Queensland, December 2013. Accessed
on 04/02/2014. <http://www.bom.gov.au>.
BoM (Bureau of Meteorology) (2013e) Monthly Weather Review – Queensland, January 2013. Accessed on
04/02/2014. <http://www.bom.gov.au>.
BoM (Bureau of Meteorology) (2013f) Monthly Weather Review – Queensland, February 2013. Accessed on
04/02/2014. <http://www.bom.gov.au>.
BoM (Bureau of Meteorology) (2013g) Monthly Weather Review – Queensland, March 2013. Accessed on
04/02/2014. <http://www.bom.gov.au>.

Page | 49 www.reefplan.qld.gov.au
BoM (Bureau of Meteorology) (2013h) Monthly Weather Review – Queensland, April 2013. Accessed on
04/02/2014. <http://www.bom.gov.au>.
BoM (Bureau of Meteorology) (2013i) Monthly Weather Review – Queensland, May 2013. Accessed on
04/02/2014. <http://www.bom.gov.au>.
BoM (Bureau of Meteorology) (2013j) Monthly Weather Review – Queensland, June 2013. Accessed on
04/02/2014. <http://www.bom.gov.au>.
Brodie J.E., Binney J., Fabricius K., Gordon I., Hoegh-Gouldberg O., Hunter H., Peter O’Reagain P., Pearson R.,
Quick M., Thorburn P., Waterhouse J., Webster I., Wilkinson S. (2008). Synthesis of evidence to support the
Scientific Consensus Statement on Water Quality in the Great Barrier Reef. The State of Queensland,
Department of the Premier and Cabinet, Brisbane, Australia. Available from:
<http://www.reefplan.qld.gov.au/resources/assets/reef-consensus.pdf>. Downloaded: 8 November 2014.
Brodie J.E., Waterhouse J., Lewis S., Bainbridge Z., Johnson J. (2009). Current Loads of Priority Pollutants
Discharged from Great Barrier Reef Catchments to the Great Barrier Reef. ACTFR Technical Report 09/02.
Australian Centre for Tropical Freshwater Research, Townsville, Australia.
Brodie J., Devlin M., Haynes D., Waterhouse J. (2010). Assessment of the eutrophication status of the Great
Barrier Reef Lagoon (Australia). Biogeochemistry, 106(2):281.
Brodie J., Waterhouse J., Schaffelke B., Kroon F., Thorburn P., Rolfe J., Johnson J., Fabricus K., Lewis S., Devlin
M., Warne M. St. J., McKenzie L. (2013a). Scientific Consensus Statement – Land use impacts on Great Barrier
Reef water quality and ecosystem condition. Reef Water Quality Protection Plan Secretariat, Brisbane,
Queensland. 9p. Available from: <http://www.reefplan.qld.gov.au/about/assets/scientific-consensus-
statement-2013.pdf>. Downloaded: 8 November 2014.
Brodie J., Waterhouse J., Schaffelke B., Furnas M., Maynard J., Collier C., Lewis S., Warne M. St. J, Fabricus K.,
Devlin M., McKenzie L., Yorkston H., Randall L., Bennett J., Brando V. (2013b). 2013 Scientific Consensus
Statement. Chapter 3 – Relative risks to the Great Barrier Reef from degraded water quality. Reef Water
Quality Protection Plan Secretariat, Brisbane, Queensland. 58p. Available from:
<http://www.reefplan.qld.gov.au/about/scientific-consensus-statement/water-quality-risks.aspx>.
Downloaded: 8 November 2014.
Carroll, C., Waters, D., Vardy, S., Silburn, D.M., Attard, S., Thorburn, P.J., Davis, A.M., Halpin, N., Schmidt, M.,
Wilson, B., Clark, A. 2012. A Paddock to reef monitoring and modelling framework for the Great Barrier Reef:
Paddock and catchment component. Marine Pollution Bulletin, 65(4-9):136-149.
DERM (Department of Environment and Resource Management) (2010). Monitoring and Sampling Manual
2009, Version 3. Brisbane, Australia. Available from:
<https://www.ehp.qld.gov.au/water/monitoring/monitoring_and_sampling_manual.html>. Downloaded: 8
November 2014.

Page | 50 www.reefplan.qld.gov.au
DERM (Department of Environment and Resource Management) (2011a). Reef Plan I5 Event Monitoring
Program Internal Review. Brisbane, Australia.
Devlin M., Brodie J. (2005). Terrestrial discharge into the Great Barrier Reef Lagoon: Nutrient behaviour in
coastal waters. Marine Pollution Bulletin, 51(1–4):9–22.
DNRM (Department of Natural Resources and Mines) (2012). River discharge dataset (hourly-interpolated
flow, m3 s-1), Surface Water Database, Queensland Government, Available from:
http://watermonitoring.derm.qld.gov.au/host.htm. Downloaded: 8 November 2014.
DNRM (Department of Natural Resources and Mines) (2014), Quality coding water monitoring data (WM58),
version 3.0, Brisbane Qld: State of Queensland, DNRM, Service Delivery.
DPC (Department of Premier and Cabinet) (2008). Scientific consensus statement on water quality in the
Great Barrier Reef. Reef Water Quality Protection Plan Secretariat, Brisbane, Australia. Available from:
<http://www.reefplan.qld.gov.au/about/assets/scientific-consensus-statement-on-water-quality-in-the-
gbr.pdf>. Downloaded: 17 November 2014.
DPC (Department of Premier and Cabinet) (2009a). Paddock to Reef Program – Integrated monitoring,
modelling and reporting. Reef Water Quality Protection Plan Secretariat, Brisbane, Australia. Available from:
<http://www.reefplan.qld.gov.au/measuring-success/assets/paddock-to-reef.pdf>. Downloaded: 8
November 2014.
DPC (Department of Premier and Cabinet) (2009b). Reef Water Quality Protection Plan. Reef Water Quality
Protection Plan Secretariat, Brisbane, Australia.
DPC (Department of Premier and Cabinet) (2011). Reef Water Quality Protection Plan – First Report Card
(2009 Baseline). Reef Water Quality Protection Plan Secretariat, Brisbane, Australia. Available from:
http://www.reefplan.qld.gov.au/about/assets/gbr.pdf. Downloaded: 8 November 2014.
DPC (Department of Premier and Cabinet) (2013a). Reef Water Quality Protection Plan – Second Report
Card. Reef Water Quality Protection Plan Secretariat, Brisbane, Australia. Available from:
<http://www.reefplan.qld.gov.au/about/assets/gbr-second-report.pdf>. Downloaded: 8 November 2014.
DPC (Department of Premier and Cabinet) (2013b). Reef Water Quality Protection Plan – Report Card 2011.
Reef Water Quality Protection Plan Secretariat, Brisbane, Australia. Available from:
<http://www.reefplan.qld.gov.au/measuring-success/report-cards/assets/report-card-2011.pdf>.
Downloaded: 8 November 2014.
DPC (Department of the Premier and Cabinet) (2013c). Reef Water Quality Protection Plan 2013, Securing
the health and resilience of the Great Barrier Reef World Heritage Area and adjacent catchments, Reef
Water Quality Protection Plan Secretariat, Brisbane. Available from: www.reefplan.qld.gov.au. Downloaded:
8 November 2014.

Page | 51 www.reefplan.qld.gov.au
DPC (Department of Premier and Cabinet) (2014). Reef Water Quality Protection Plan – Report Card 2012
and 2013. Reef Water Quality Protection Plan Secretariat, Brisbane, Australia. Available from:
<http://www.reefplan.qld.gov.au/measuring-success/report-cards/assets/report-card-2012-2013.pdf>.
Downloaded: 8 November 2014.
eWater Cooperative Research Centre (2011). Water Quality Analyser v2.0.0 User Guide. eWater Cooperative
Research Centre, Canberra, Australia.
Eyre B. (1998). Transport, retention and transformation of material in Australian estuaries. Estuaries, 21(4A):
540–551.
Fabricius K. E., De’ath G., McCook L., Turak E., Williams D. McB. (2005). Changes in algal, coral and fish
assemblages along water quality gradients on the inshore Great Barrier Reef. Marine Pollution Bulletin,
51(1–4):384–398.
Furnas M., Mitchell A., Skuza M. (1997). River inputs of nutrient and sediments to the Great Barrier Reef. In:
Wachenfeld, D., Oliver, J., Davis, K., (eds). Proceedings of the State of the Great Barrier Reef World Heritage
Area Workshop GBRMPA, Workshop Series No. 23, 27–29 November, 1995, Townsville, Australia.
Furnas M. (2003). Catchments and Corals: Terrestrial Runoff to the Great Barrier Reef. Australian Institute of
Marine Science, Townsville, Australia. Available from: <http://epubs.aims.gov.au/handle/11068/6477>.
Downloaded: 8 November 2014.
Hunter H., Walton R. (2008). Land-use effects on fluxes of suspended sediment, nitrogen and phosphorus
from a river catchment of the Great Barrier Reef, Australia. Journal of Hydrology, 356(1–2):131–146.
Joo M., Raymond M., McNeil V., Huggins R., Turner R., Choy S. (2012). Estimates of sediment and nutrient
loads in 10 major catchments draining to the Great Barrier Reef during 2006–2009. Marine Pollution Bulletin,
65(4–9):150–166.
Kroon F., Kuhnert P., Henderson B., Henderson A., Turner R., Huggins R., Wilkinson S., Abbot B., Brodie J., Joo
M. (2010). Baseline pollutant loads to the Great Barrier Reef. CSIRO: Water for a Healthy Country Flagship
Report Series, Australia. ISSN: 1835-095X. 41 pp.
Kroon F., Kuhnert P., Henderson B., Wilkinson S., Kinsey-Henderson A., Abbott B., Brodie J., Turner R. (2011).
River loads of suspended solids, nitrogen, phosphorus and herbicides delivered to the Great Barrier Reef
Lagoon. Marine Pollution Bulletin, 65(4–9):167–181.
Kroon F., Turner R., Smith R., Warne M.St.J., Hunter H., Bartley R., Wilkinson S., Lewis S., Waters D., Carroll C.
(2013). Scientific Consensus Statement. Chapter 3 – Sources of sediment, nutrients, pesticides and other
pollutants in the Great Barrier Reef catchment. Reef Water Quality Protection Plan Secretariat, Brisbane,
Queensland. 42p. Available from:<http://www.reefplan.qld.gov.au/about/scientific-consensus-
statement/sources-of-pollutants.aspx>. Downloaded: 8 November 2014.

Page | 52 www.reefplan.qld.gov.au
Letcher R., Jakeman T., Merrit W., McKee L., Eyre B., Baginska B. (1999). Review of techniques to estimate
catchment exports – Technical report. New South Wales Environment Protection Authority, Sydney,
Australia.
Nicholls N. (1988). El Niño and rainfall variability. Journal of Climate, 1:418–442.
Packett R., Dougall C., Rohde K., Noble R. (2009). Agricultural lands are hot-spots for annual runoff polluting
the southern Great Barrier Reef Lagoon. Marine Pollution Bulletin, 58:976–986.
Rayment G.E. (2003). Water quality in sugar catchments in Queensland. Water Science and Technology,
48(7):35–47.
Schaffelke B, Anthony K, Blake J, Brodie J, Collier C, Devlin M, Fabricus K, Martin K, McKenzie L, Negri A,
Ronan, Thompson A, Warne M.St.J. (2013). 2013 Scientific Consensus Statement. Chapter 1 – Marine and
coastal ecosystem impacts. Reef Water Quality Protection Plan Secretariat, Brisbane, Queensland. 47p.
Available from: <http://www.reefplan.qld.gov.au/about/scientific-consensus-statement/ecosystem-
impacts.aspx>. Downloaded: 8 November 2014.
Smith R., Middlebrook R., Turner R., Huggins R., Vardy S., Warne M.St.J. (2012). Large-scale pesticide
monitoring across Great Barrier Reef catchments – Paddock to Reef Integrated Monitoring, Modelling and
Reporting Program. Marine Pollution Bulletin, 65(4–9):117–127.
Smith R., Turner R., Vardy S., Huggins R., Wallace R., Warne M.St.J. (2014) An evaluation of the prevalence of
alternate pesticides of environmental concern in Great Barrier Reef catchments. Water Quality and
Investigations, Environmental Monitoring and Assessment Science, Department of Science, Information
Technology and the Arts, Brisbane. Available from:
<http://www.qld.gov.au/environment/agriculture/sustainable-farming/reef/>. Downloaded: 8 November
2014.
State of Queensland and Commonwealth of Australia (2003). Reef Water Quality Protection Plan: For
catchments adjacent to the Great Barrier Reef World Heritage Area. Queensland Department of Premier and
Cabinet, Brisbane, Australia. Available from: <http://www.reefplan.qld.gov.au/about/assets/reefplan-
2003.pdf>. Downloaded: 8 November 2014.
Turner, R., Huggins, R., Wallace, R., Smith, R., Vardy, S., Warne, M.St.J. (2012). Sediment, nutrient, and
pesticide loads: Great Barrier Reef Catchment Loads Monitoring Program 2009–2010. Department of
Science, Information Technology, Innovation and the Arts, Brisbane. Available from:
<http://www.reefplan.qld.gov.au/measuring-success/paddock-to-reef/assets/2009-2010-gbr-catchment-
loads-report.pdf>. Downloaded: 8 November 2014.
Turner, R., Huggins, R., Wallace, R., Smith, R., Vardy, S. and Warne, M.St.J. (2013). Total suspended solids,
nutrient and pesticide loads (2010–2011) for rivers that discharge to the Great Barrier Reef: Great Barrier
Reef Catchment Loads Monitoring Program 2010–2011. Department of Science, Information Technology,

Page | 53 www.reefplan.qld.gov.au
Innovation and the Arts, Brisbane. Available from: <http://www.reefplan.qld.gov.au/measuring-
success/paddock-to-reef/assets/2010-2011-gbr-catchment-loads-report.pdf>. Downloaded: 8 November
2014. Downloaded: 8 November 2014.
Wachenfeld, D.R., Oliver, J.K., Morrissey, J.I. (1998). State of the Great Barrier Reef World Heritage Area.
Great Barrier Reef Marine Park Authority, Townsville, Australia.
Wallace, R., Huggins, R., Smith, R., Turner, R., Vardy, S. and Warne, M.St.J. (2014). Total suspended solids,
nutrient and pesticide loads (2011–2012) for rivers that discharge to the Great Barrier Reef – Great Barrier
Reef Catchment Loads Monitoring Program 2011–2012. Department of Science, Information Technology,
Innovation and the Arts. Brisbane. Available from: http://www.reefplan.qld.gov.au/measuring-
success/paddock-to-reef/assets/2011-2012-gbr-catchment-loads-report.pdf. Downloaded: 8 November
2014.
Water Quality Analyser V2 (2011–2012) © eWater Cooperative Research Centre, Australia.

Page | 54 www.reefplan.qld.gov.au
7 Appendices
Appendix A Loads of other pesticides detected by the Great Barrier Reef Catchment
Loads Monitoring Program
All water samples collected for the analysis of pesticides were analysed via LCMS as described in Section 2.5.
The LCMS analytical suite is capable of detecting pesticides and their breakdown products which are not
modelled under the Reef Plan 2009 (i.e. other than the five priority photosystem II inhibiting herbicides). The
monitored annual loads of these additional pesticides were calculated using the methods previously
described in Section 2.7.2. The results presented in this section of the report are the monitored annual loads
of these additional pesticides, namely 2,4-D, bromacil, fluometuron, fluroxypyr, haloxyfop, imidacloprid,
isoxaflutole, MCPA, metolachlor, metribuzin, metsulfuron-methyl, prometryne, propazine-2-hydroxy (a
metabolite of the herbicide propazine), simazine, terbuthylazine, triclopyr. The monitored annual loads of
atrazine and its metabolites, desethyl atrazine and desisopropyl atrazine, are also presented although they
will not be discussed further as the total atrazine load is already considered in Section 3.4.
The total monitored annual loads of the additional pesticides ranged from 0.30 kg of fluroxypyr to 1100 kg of
metolachlor (Table 7.1 to Table 7.3). Overall, the additional pesticides reported here increase the total
monitored annual load of pesticides by approximately 2800 kg (or approximately 28 per cent) to a total
monitored annual load of approximately 12,800 kg.
Of the additional pesticides detected by the LCMS analysis, 2,4-D and metolachlor were detected at all
monitored catchments. Barratta Creek in the Haughton catchment had the highest number of additional
pesticides detected with calculable loads for all additional pesticides except terbuthylazine which was only
detected in the Fitzroy catchment. Fluroxypyr and propazin-2-hydroxy were only detected in Barratta Creek
in the Haughton catchment. The Herbert and Burnett catchments had the lowest number of additional
pesticides detected with four in each catchment.
The largest monitored annual loads of 2,4-D were recorded in the Fitzroy (180 kg), Tully (110 kg) and Burnett
(110 kg) catchments. The lowest monitored annual load of 2,4-D was in the Burdekin catchment (28 kg).
Bromacil was only detected at Barratta Creek in the Haughton catchment (1.5 kg) and the Fitzroy catchment
(41 kg). Fluometuron was only detected at Barratta Creek in the Haughton catchment (0.70 kg) and the
Pioneer catchment (3.8 kg).
Haloxyfop was detected at three monitored end-of-system sites with the largest load occurring in the
Burdekin catchment (32 kg). Haloxyfop was also detected in the Comet River sub-catchment where the
monitored annual load was 0.4 kg. Imidacloprid and isoxaflutole were detected at all monitored catchments
in the Wet Tropics, Burdekin and Mackay Whitsunday regions except isoxaflutole which was not detected in
the Herbert catchment. The largest monitored annual load of imidacloprid was in the Tully catchment
Page | 55 www.reefplan.qld.gov.au
(270 kg) and the largest monitored annual load of isoxaflutole was in Barratta Creek in the Haughton
catchment (21 kg).
MCPA was detected at all monitored catchments in the Burdekin, Mackay Whitsunday and Fitzroy regions.
The largest monitored annual load of MCPA was derived from Sandy Creek in the Plane catchment (120 kg)
with comparatively small loads in the other monitored catchments of these regions. The majority of the total
monitored annual load of metolachlor was derived from the Fitzroy (550 kg) and Burnett (470 kg)
catchments which experienced major flooding in late-January 2013. The smallest monitored annual loads of
metolachlor occurred in the Wet Tropics natural resource management region with the Herbert and Tully
catchments contributing 7.0 kg and 1.8 kg, respectively. The monitored annual load of metolachlor in the
Comet River sub-catchment was 28 kg.
Metribuzin was detected in four monitored catchments with the largest monitored annual load occurring in
the Pioneer catchment (67 kg). Metsulfuron-methyl was also only detected at three monitored end-of-
system sites with the largest load occurring in the Tully catchment (5.9 kg) and markedly lower loads in
Barratta Creek in the Haughton catchment (0.027 kg) and Herbert catchment (0.0087 kg).
Prometryn was only detected at two monitored end-of-system sites with the vast majority of the monitored
annual load derived from the Burnett catchment (31 kg) and a comparatively small load from Barratta Creek
in the Haughton catchment (0.1 kg). Propazin-2-hydroxy, a metabolite of propazine, was only detected
above the limit of reporting in Barratta Creek in the Haughton catchment with a calculated load of 0.80 kg.
Simazine was detected in four monitored catchments with the largest monitored annual load occurring in
the Fitzroy catchment (51 kg). Simazine was also detected in the Comet River sub-catchment with a
monitored annual load calculated at 1.0 kg.
Terbuthylazine was detected only in the Fitzroy catchment with a load of 5.9 kg. Triclopyr was detected in all
monitored end-of-system catchments except the Burdekin and Fitzroy. The largest monitored annual loads
of triclopyr occurred in the Burnett catchment (60 kg) with smaller loads in the remaining catchments
ranging from 2.3 kg in the Tully catchment to 0.50 kg in Barratta Creek in the Haughton catchment.
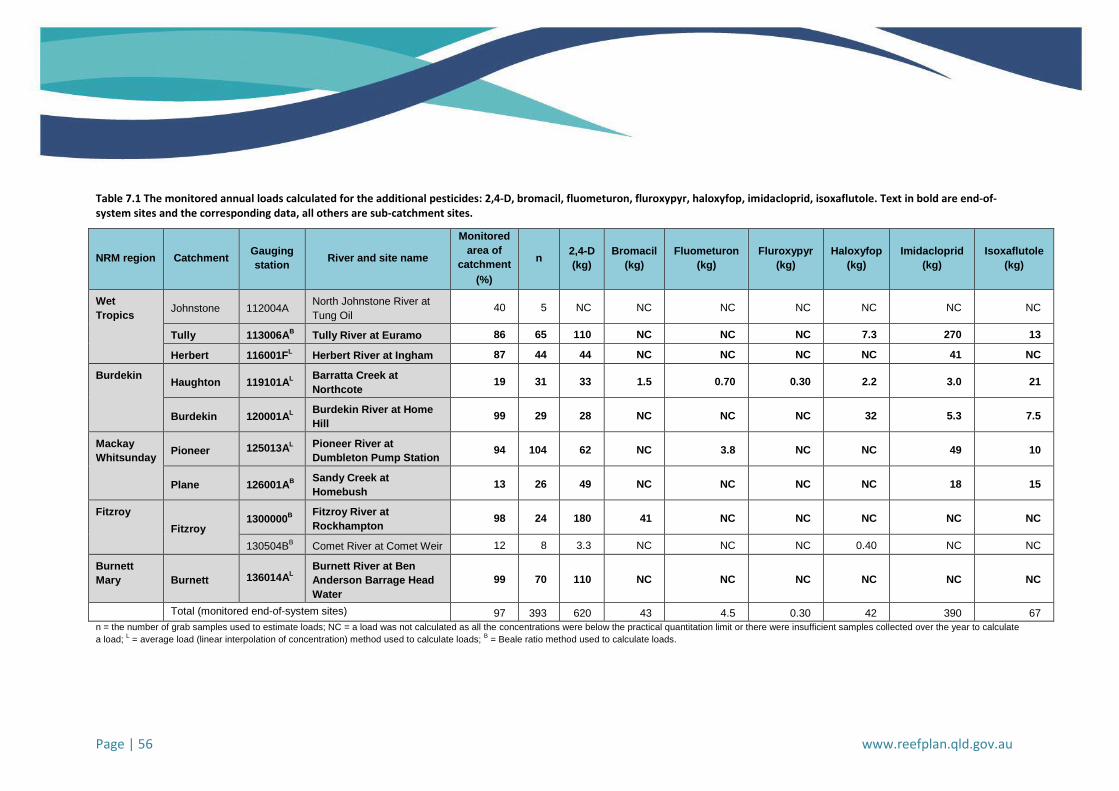
Page | 56 www.reefplan.qld.gov.au
Table 7.1 The monitored annual loads calculated for the additional pesticides: 2,4-D, bromacil, fluometuron, fluroxypyr, haloxyfop, imidacloprid, isoxaflutole. Text in bold are end-of-system sites and the corresponding data, all others are sub-catchment sites.
NRM region Catchment Gauging
station River and site name
Monitored
area of
catchment
(%)
n 2,4-D
(kg)
Bromacil
(kg)
Fluometuron
(kg)
Fluroxypyr
(kg)
Haloxyfop
(kg)
Imidacloprid
(kg)
Isoxaflutole
(kg)
Wet
Tropics Johnstone 112004A
North Johnstone River at
Tung Oil 40 5 NC NC NC NC NC NC NC
Tully 113006AB Tully River at Euramo 86 65 110 NC NC NC 7.3 270 13
Herbert 116001FL Herbert River at Ingham 87 44 44 NC NC NC NC 41 NC
Burdekin Haughton 119101A
L
Barratta Creek at
Northcote 19 31 33 1.5 0.70 0.30 2.2 3.0 21
Burdekin 120001AL
Burdekin River at Home
Hill 99 29 28 NC NC NC 32 5.3 7.5
Mackay
Whitsunday Pioneer 125013A
L Pioneer River at
Dumbleton Pump Station 94 104 62 NC 3.8 NC NC 49 10
Plane 126001AB
Sandy Creek at
Homebush 13 26 49 NC NC NC NC 18 15
Fitzroy
Fitzroy 1300000
B
Fitzroy River at
Rockhampton 98 24 180 41 NC NC NC NC NC
130504BB Comet River at Comet Weir 12 8 3.3 NC NC NC 0.40 NC NC
Burnett
Mary Burnett 136014AL
Burnett River at Ben
Anderson Barrage Head
Water
99 70 110 NC NC NC NC NC NC
Total (monitored end-of-system sites) 97 393 620 43 4.5 0.30 42 390 67
n = the number of grab samples used to estimate loads; NC = a load was not calculated as all the concentrations were below the practical quantitation limit or there were insufficient samples collected over the year to calculate
a load; L = average load (linear interpolation of concentration) method used to calculate loads;
B = Beale ratio method used to calculate loads.

Page | 57 www.reefplan.qld.gov.au
Table 7.2 The monitored annual loads calculated for the additional pesticides: MCPA, metolachlor, metribuzin, metsulfuron-methyl, prometryn, propazin-2-hydroxy and simazine. Text in bold are end-of-system sites and the corresponding data, all others are sub-catchment sites.
NRM region Catchment Gauging
station River and site name
Monitored
area of
catchment
(%)
n MCPA
(kg)
Metolachlor
(kg)
Metribuzin
(kg)
Metsulfuron
-methyl
(kg)
Prometryn
(kg)
Propazin-
2-hydroxy
(kg)
Simazine
(kg)
Wet
Tropics Johnstone 112004A
North Johnstone River at
Tung Oil 40 5 NC NC NC NC NC NC NC
Tully 113006AB Tully River at Euramo 86 65 NC 1.8 30 5.9 NC NC 2.5
Herbert 116001FL Herbert River at Ingham 87 44 NC 7.0 NC 0.0087 NC NC NC
Burdekin Haughton 119101A
L
Barratta Creek at
Northcote 19 31 6.9 16 21 0.027 0.1 0.8 1.4
Burdekin 120001AL
Burdekin River at Home
Hill 99 29 36 34 NC NC NC NC NC
Mackay
Whitsunday Pioneer 125013A
L Pioneer River at
Dumbleton Pump Station 94 104 12 11 67 NC NC NC 0.8
Plane 126001AB
Sandy Creek at
Homebush 13 26 120 23 51 NC NC NC NC
Fitzroy
Fitzroy 1300000
B
Fitzroy River at
Rockhampton 98 24 3.3 550 NC NC NC NC 51
130504BB Comet River at Comet Weir 12 8 NC 28 NC NC NC NC 1.0
Burnett
Mary Burnett 136014AL
Burnett River at Ben
Anderson Barrage Head
Water
99 70 NC 470 NC NC 31 NC NC
Total (monitored end-of-system sites) 97 393 180 1100 170 5.9 31 0.80 60
n = the number of grab samples used to estimate loads; NC = a load was not calculated as all the concentrations were below the practical quantitation limit or there were insufficient samples collected over the year to calculate
a load; L = average load (linear interpolation of concentration) method used to calculate loads;
B = Beale ratio method used to calculate loads.

Page | 58 www.reefplan.qld.gov.au
Table 7.3 The monitored annual loads calculated for the additional pesticides: terbuthylazine, triclopyr, atrazine and its metabolites desethylatrazine, desisopropylatrazine. Text in bold are end-of-system sites and the corresponding data, all others are sub-catchment sites.
NRM region Catchment Gauging
station River and site name
Monitored
area of
catchment
(%)
n Terbuthylazine
(kg) Triclopyr
(kg)
Total atrazine (kg)
Atrazine
(kg)
Desethylatrazine
(kg)
Desisopropylatrazine
(kg)
Wet
Tropics Johnstone 112004A
North Johnstone River at Tung
Oil 40 5 NC NC NC NC NC
Tully 113006AB Tully River at Euramo 86 65 NC 2.3 143 18 1.1
Herbert 116001FL Herbert River at Ingham 87 44 NC 1.4 100 6.7 6.8
Burdekin Haughton 119101AL Barratta Creek at Northcote 19 31 NC 0.50 440 47 20
Burdekin 120001AL Burdekin River at Home Hill 99 29 NC NC 180 32 18
Mackay
Whitsunday Pioneer 125013A
L Pioneer River at Dumbleton
Pump Station 94 104 NC 1.2 390 47 17
Plane 126001AB Sandy Creek at Homebush 13 26 NC 0.60 240 22 10
Fitzroy Fitzroy
1300000B Fitzroy River at Rockhampton 98 24 5.9 NC 360 8.3 55
130504BB Comet River at Comet Weir 12 8 NC NC 33 4.4 3.0
Burnett
Mary Burnett 136014A
L Burnett River at Ben
Anderson Barrage Head Water 99 70 NC 60 270 26 NC
Total (monitored end-of-system sites) 97 393 5.9 66 2156 211.4 130.9
Data shaded blue (atrazine, desethyl atrazine and desisopropyl atrazine) have already been incorporated in the calculation of total atrazine as presented in the main body of this report.
n = the number of grab samples used to estimate loads; NC = a load was not calculated as all the concentrations were below the practical quantitation limit or there were insufficient samples collected over the year to calculate
a load; L = average load (linear interpolation of concentration) method used to calculate loads;
B = Beale ratio method used to calculate loads.

Page | 59 www.reefplan.qld.gov.au
Appendix B Calculation of discharge
Discharge as contained in the Queensland Government surface water database is calculated following the
equation:
Equation 8
𝑞 = 𝑣𝑎
where, q is the discharge (m3 s-1), a = the cross-sectional area of the river (m2), and v = average velocity of
the flow in the cross-sectional area (ms-1).
Discharge is calculated for sub-sectional areas of the river channel and summed to determine the discharge
across the whole cross-sectional area. Sub-sectional areas were calculated from a known width multiplied by
the river gauge height at time t. Flow velocity was determined for each cross-sectional area at time t using a
current meter.
During the 2012–2013 monitoring year, river gauge height was recorded by gauging stations using a float or
a pressure sensor at intervals of approximately 15 minutes. Flow records were extracted for each site from
the Queensland Government electronic data management system (Hydstra).
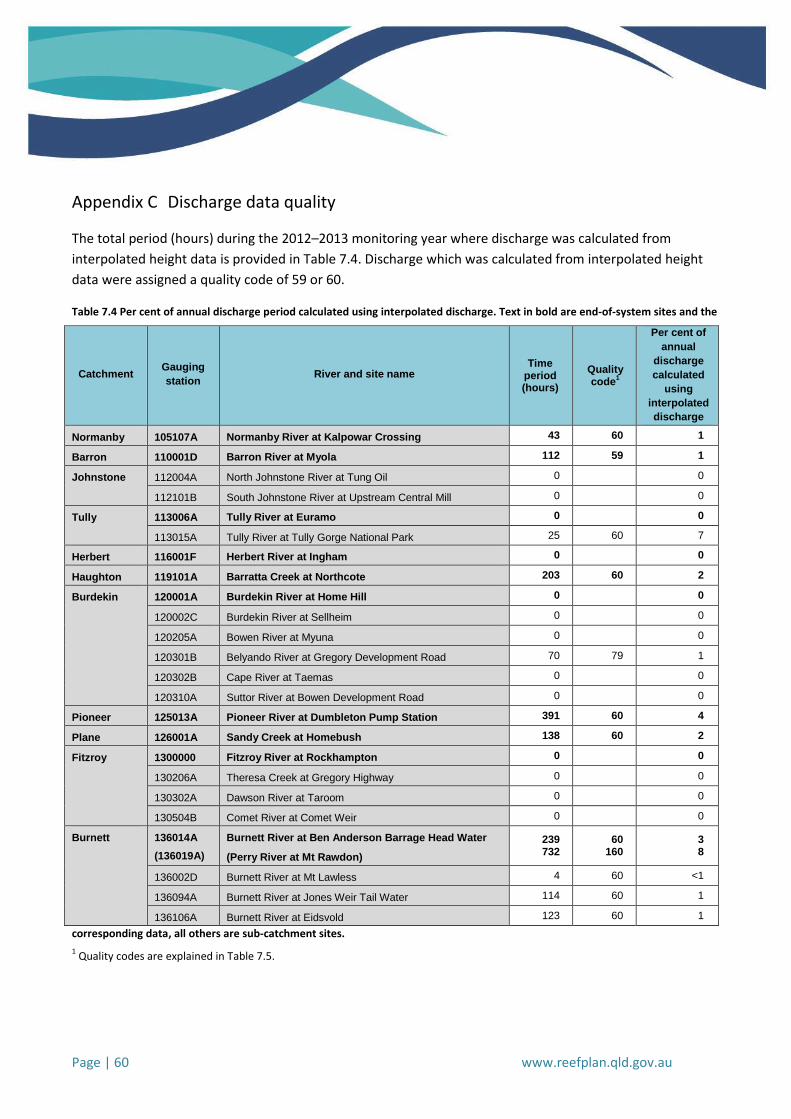
Page | 60 www.reefplan.qld.gov.au
Appendix C Discharge data quality
The total period (hours) during the 2012–2013 monitoring year where discharge was calculated from
interpolated height data is provided in Table 7.4. Discharge which was calculated from interpolated height
data were assigned a quality code of 59 or 60.
Table 7.4 Per cent of annual discharge period calculated using interpolated discharge. Text in bold are end-of-system sites and the
corresponding data, all others are sub-catchment sites.
1 Quality codes are explained in Table 7.5.
Catchment Gauging
station River and site name
Time period (hours)
Quality code
1
Per cent of
annual
discharge
calculated
using
interpolated
discharge
Normanby 105107A Normanby River at Kalpowar Crossing 43 60 1
Barron 110001D Barron River at Myola 112 59 1
Johnstone 112004A North Johnstone River at Tung Oil 0 0
112101B South Johnstone River at Upstream Central Mill 0 0
Tully 113006A Tully River at Euramo 0 0
113015A Tully River at Tully Gorge National Park 25 60 7
Herbert 116001F Herbert River at Ingham 0 0
Haughton 119101A Barratta Creek at Northcote 203 60 2
Burdekin 120001A Burdekin River at Home Hill 0 0
120002C Burdekin River at Sellheim 0 0
120205A Bowen River at Myuna 0 0
120301B Belyando River at Gregory Development Road 70 79 1
120302B Cape River at Taemas 0 0
120310A Suttor River at Bowen Development Road 0 0
Pioneer 125013A Pioneer River at Dumbleton Pump Station 391 60 4
Plane 126001A Sandy Creek at Homebush 138 60 2
Fitzroy 1300000 Fitzroy River at Rockhampton 0 0
130206A Theresa Creek at Gregory Highway 0 0
130302A Dawson River at Taroom 0 0
130504B Comet River at Comet Weir 0 0
Burnett 136014A
(136019A)
Burnett River at Ben Anderson Barrage Head Water
(Perry River at Mt Rawdon)
239 732
60 160
3 8
136002D Burnett River at Mt Lawless 4 60 <1
136094A Burnett River at Jones Weir Tail Water 114 60 1
136106A Burnett River at Eidsvold 123 60 1

Page | 61 www.reefplan.qld.gov.au
Table 7.5 Description of discharge data quality codes (DNRM 2014).
Discharge data quality code Description
10 Good
15 No flow
20 Fair
30 Poor
59 CITEC – Derived height
60 Estimate
160 Suspect

Page | 62 www.reefplan.qld.gov.au
Appendix D Hydrograph plots of discharge and sample collection points
Figures in Appendix D are presented in the order of the location of the waterways from north to south.
Figure 7.1 Hydrograph showing discharge (blue line) and sample coverage for total suspended solids, total nutrients, dissolved and particulate nutrients (red circles) in the Normanby River at Kalpowar Crossing between 1 July 2012 and 30 June 2013. Representivity rating was good for total suspended solids, no other analytes were calculated.

Page | 63 www.reefplan.qld.gov.au
Figure 7.2 Hydrograph showing discharge (blue line) and sample coverage for total suspended solids, total nutrients, dissolved and particulate nutrients (red circles) in the Barron River at Myola between 1 July 2012 and 30 June 2013. Representivity rating was excellent for all analytes.
Figure 7.3 Hydrograph showing discharge (blue line) and sample coverage for total suspended solids, total nutrients, dissolved and particulate nutrients (red circles) in the North Johnstone River at Tung Oil between 1 July 2012 and 30 June 2013. Representivity rating was good for all analytes.

Page | 64 www.reefplan.qld.gov.au
Figure 7.4 Hydrograph showing discharge (blue line) and photosystem II inhibiting pesticide sample coverage (red circles) for North Johnstone River at Tung Oil between 1 July 2012 and 30 June. 2013.
Figure 7.5 Hydrograph showing discharge (blue line) and sample coverage for total suspended solids, total nutrients, dissolved and particulate nutrients (red circles) in the South Johnstone River at Upstream Central Mill between 1 July 2012 and 30 June 2013. Representivity rating was excellent for all analytes.

Page | 65 www.reefplan.qld.gov.au
Figure 7.6 Hydrograph showing discharge (blue line) and sample coverage for total suspended solids, total nutrients, dissolved and particulate nutrients (red circles) in the Tully River at Euramo between 1 July 2012 and 30 June 2013. Representivity rating was excellent for all analytes.
Figure 7.7 Hydrograph showing discharge (blue line) and photosystem II inhibiting pesticide sample coverage (red circles) for Tully River at Euramo between 1 July 2012 and 30 June 2013.

Page | 66 www.reefplan.qld.gov.au
Figure 7.8 Hydrograph showing discharge (blue line) and sample coverage for total suspended solids, total nutrients, dissolved and particulate nutrients (red circles) in the Tully River at Tully Gorge National Park between 1 July 2012 and 30 June 2013. Representivity rating was moderate for all analytes.
Figure 7.9 Hydrograph showing discharge (blue line) and sample coverage for total suspended solids, total nutrients and photosystem II inhibiting herbicides (red circles) for the Herbert River at Ingham between 1 July 2011 and 30 June 2012. Representivity rating was good for all analytes (excluding photosystem II inhibiting herbicides.

Page | 67 www.reefplan.qld.gov.au
Figure 7.10 Hydrograph showing discharge (blue line) and sample coverage for total suspended solids, total nutrients, dissolved and particulate nutrients sample coverage (red circles) in the Barratta Creek at Northcote between 1 July 2012 and 30 June 2013. Representivity rating was excellent for all analytes.
Figure 7.11 Hydrograph showing discharge (blue line) and photosystem II pesticide sample coverage (red circles) for Barratta Creek at Northcote between 1 July 2012 and 30 June 2013.
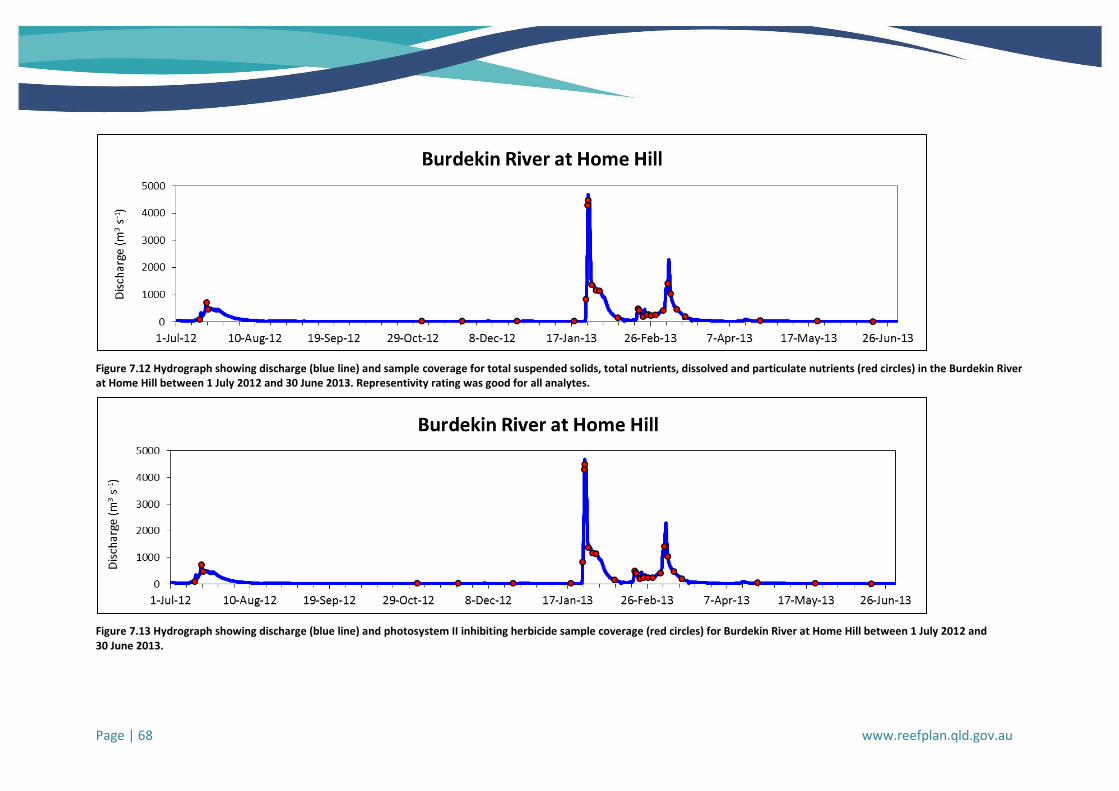
Page | 68 www.reefplan.qld.gov.au
Figure 7.12 Hydrograph showing discharge (blue line) and sample coverage for total suspended solids, total nutrients, dissolved and particulate nutrients (red circles) in the Burdekin River at Home Hill between 1 July 2012 and 30 June 2013. Representivity rating was good for all analytes.
Figure 7.13 Hydrograph showing discharge (blue line) and photosystem II inhibiting herbicide sample coverage (red circles) for Burdekin River at Home Hill between 1 July 2012 and 30 June 2013.

Page | 69 www.reefplan.qld.gov.au
Figure 7.14 Hydrograph showing discharge (blue line) and sample coverage for total suspended solids, total nutrients, dissolved and particulate nutrients (red circles) in the Burdekin River at Sellheim between 1 July 2012 and 30 June 2013. Representivity rating was moderate for all analytes.
Figure 7.15 Hydrograph showing discharge (blue line) and sample coverage for total suspended solids, total nutrients, dissolved and particulate nutrients (red circles) for Cape River at Taemas between 1 July 2012 and 30 June 2013. Representivity rating was good for all other analytes.

Page | 70 www.reefplan.qld.gov.au
Figure 7.16 Hydrograph showing discharge (blue line) and sample coverage for total suspended solids and total nutrients (red circles) for Belyando River at Gregory Development Road between 1 July 2012 and 30 June 2013. Representivity rating was good for all analytes.
Figure 7.17 Hydrograph showing discharge (blue line) and sample coverage for total suspended solids, total nutrients, dissolved and particulate nutrients (red circles) in the Suttor River at Bowen Development Road between 1 July 2012 and 30 June 2013. Representivity rating was good for all analytes.
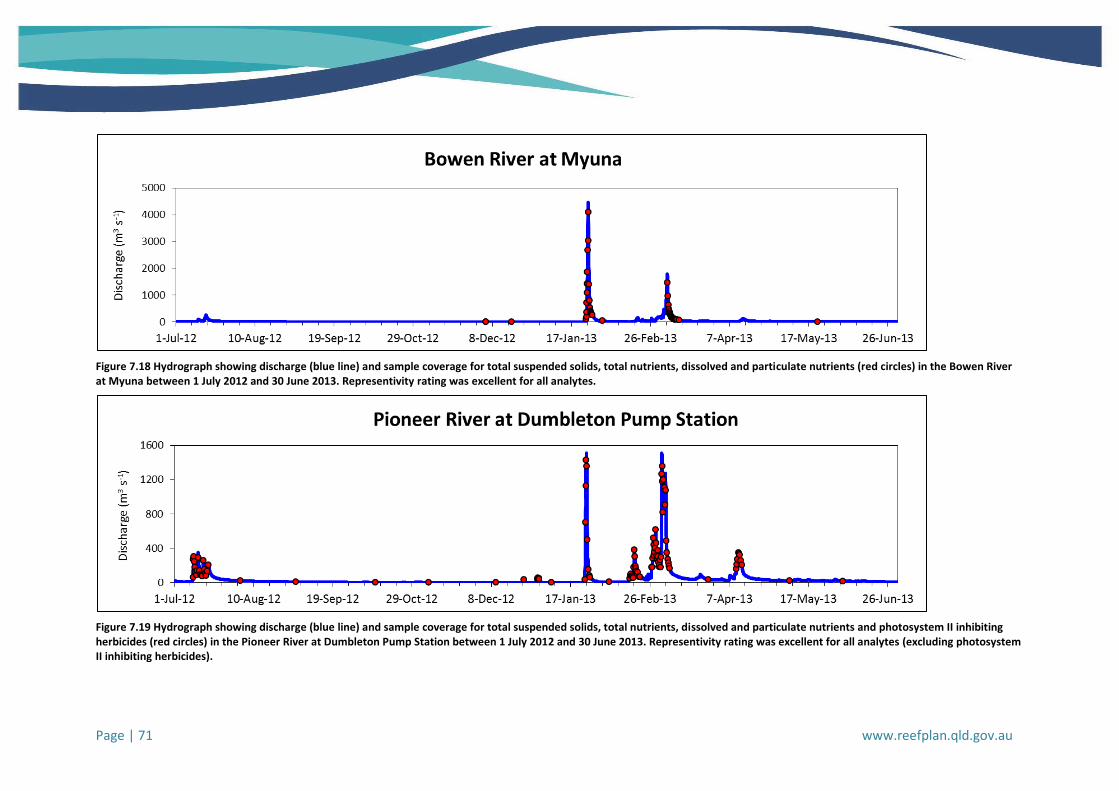
Page | 71 www.reefplan.qld.gov.au
Figure 7.18 Hydrograph showing discharge (blue line) and sample coverage for total suspended solids, total nutrients, dissolved and particulate nutrients (red circles) in the Bowen River at Myuna between 1 July 2012 and 30 June 2013. Representivity rating was excellent for all analytes.
Figure 7.19 Hydrograph showing discharge (blue line) and sample coverage for total suspended solids, total nutrients, dissolved and particulate nutrients and photosystem II inhibiting herbicides (red circles) in the Pioneer River at Dumbleton Pump Station between 1 July 2012 and 30 June 2013. Representivity rating was excellent for all analytes (excluding photosystem II inhibiting herbicides).

Page | 72 www.reefplan.qld.gov.au
Figure 7.20 Hydrograph showing discharge (blue line) and sample coverage for total suspended solids, total nutrients, dissolved and particulate nutrients and photosystem II inhibiting herbicides (red circles) in Sandy Creek at Homebush between 1 July 2012 and 30 June 2013. Representivity rating was good for all analytes (excluding photosystem II inhibiting herbicides).
Figure 7.21 Hydrograph showing discharge (blue line) and sample coverage for total suspended solids, total nutrients, dissolved and particulate nutrients and photosystem II inhibiting herbicides (red circles) in the Fitzroy River at Rockhampton between 1 July 2012 and 30 June 2013. Representivity rating was good for all analytes (excluding photosystem II inhibiting herbicides).
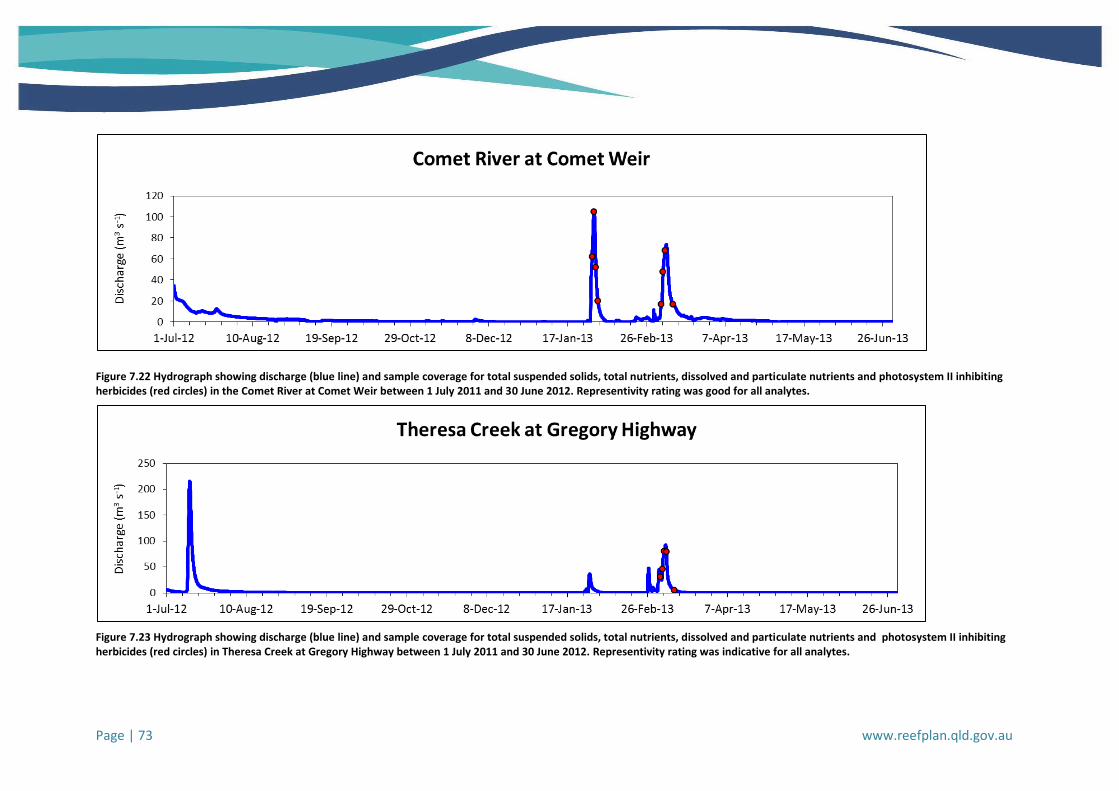
Page | 73 www.reefplan.qld.gov.au
Figure 7.22 Hydrograph showing discharge (blue line) and sample coverage for total suspended solids, total nutrients, dissolved and particulate nutrients and photosystem II inhibiting herbicides (red circles) in the Comet River at Comet Weir between 1 July 2011 and 30 June 2012. Representivity rating was good for all analytes.
Figure 7.23 Hydrograph showing discharge (blue line) and sample coverage for total suspended solids, total nutrients, dissolved and particulate nutrients and photosystem II inhibiting herbicides (red circles) in Theresa Creek at Gregory Highway between 1 July 2011 and 30 June 2012. Representivity rating was indicative for all analytes.

Page | 74 www.reefplan.qld.gov.au
Figure 7.24 Hydrograph showing discharge (blue line) and sample coverage for total suspended solids, total nutrients, dissolved and particulate nutrients (red circles) in the Dawson River at Taroom between 1 July 2012 and 30 June 2013. Representivity rating was good for all analytes.
Figure 7.25 Hydrograph showing discharge (blue line) and sample coverage for total suspended solids, total nutrients, dissolved and particulate nutrients and photosystem II inhibiting herbicides (red circles) in the Burnett River at Ben Anderson Barrage between 1 July 2011 and 30 June 2012. Representivity rating was excellent for all analytes (excluding photosystem II inhibiting herbicides ).

Page | 75 www.reefplan.qld.gov.au
Figure 7.26 Hydrograph showing discharge (blue line) and sample coverage for total suspended solids, total nutrients, dissolved and particulate nutrients (red circles) in the Burnett River at Eidsvold between 1 July 2012 and 30 June 2013. Representivity rating was indicative for all analytes.
Figure 7.27 Hydrograph showing discharge (blue line) and sample coverage for total suspended solids, total nutrients, dissolved and particulate nutrients (red circles) in the Burnett River at Jones Weir Tail Water between 1 July 2012 and 30 June 2013. Representivity rating was indicative for all analytes.

Page | 76 www.reefplan.qld.gov.au
Figure 7.28 Hydrograph showing discharge (blue line) and sample coverage for total suspended solids, total nutrients, dissolved and particulate nutrients (red circles) in the Burnett River at Mt Lawless between 1 July 2011 and 30 June 2012. Representivity rating was good for total suspended solids and total nutrients and indicative for dissolve and particulate nutrients.

Page | 77 www.reefplan.qld.gov.au
Appendix E Revised land use yields of priority photosystem II inhibiting herbicides
for the 2010–2011 and 2011–2012 monitoring years
The calculation of land use yields of the priority photosystem II inhibiting herbicides applies a binary code to
link priority photosystem II herbicides to the aggregated land use categories (see Section 2.7.3.2). The binary
coding that has been applied in the calculation of land use yields in this report represents the outcome of an
internal review and consultation with peak industry bodies. The revised binary coding applied to the
calculation of land use yields is presented in Table 2.6.
To allow comparison with land use yields previously reported by the Great Barrier Reef Catchment Loads
Monitoring Program, land use yields of the 2010–2011 and 2011–2012 monitoring years have been
recalculated using the revised binary coding (see Table 2.6). The revised land use yield for the 2010–2011
and 2011–2012 monitoring years are presented in Table 7.6.

Page | 78 www.reefplan.qld.gov.au
Table 7.6 The recalculated monitored annual land use yields for the five priority photosystem II inhibiting herbicides: ametryn, total atrazine, diuron, hexazinone and tebuthiuron for the 2010–2011 and 2011–2012 monitoring years. All sites and land use yields in bold are end-of-system sites and the corresponding data.
PSII herbicide Registered land
use types River and site name
2010–2011
land use yield
(kg km-2)
2011–2012
land use yield
(kg km-2)
Ametryn Sugarcane North Johnstone River at Goondi BridgeB,B
NC NC
Tully River at EuramoB,B
NC 0.042
Herbert River at InghamB,L
0.070 0.015
Barratta Creek at NorthcoteB,L
0.0075 0.017
Burdekin River at Home HillL,L
NC 0.20
Pioneer River at Dumbleton Pump StationL,L
0.24 0.028
Sandy Creek at HomebushB,B
0.21 0.019
Fitzroy River at RockhamptonL,L
NC NC
Burnett River at Ben Anderson Barrage Head WaterL,L
NC NC
Total atrazine Cropping, forestry and sugarcane
North Johnstone River at Goondi BridgeB,B
1.6 0.82
Tully River at EuramoB,B
0.58 0.79
Herbert River at InghamB,L
0.15 0.070
Barratta Creek at NorthcoteB,L
1.9 1.4
Burdekin River at Home HillL,L
0.032 0.16
Pioneer River at Dumbleton Pump StationL,L
0.78 0.33
Sandy Creek at HomebushB,B
1.2 0.31
Fitzroy River at RockhamptonL,L
0.13 0.055
Burnett River at Ben Anderson Barrage Head WaterL,L
0.037 0.0019
Diuron Cropping, horticulture and sugarcane
North Johnstone River at Goondi BridgeB,B
0.87 0.48
Tully River at EuramoB,B
1.0 1.1
Herbert River at InghamB,L
0.47 0.54
Barratta Creek at NorthcoteB,L
0.30 0.39
Burdekin River at Home HillL,L
NC 0.020
Pioneer River at Dumbleton Pump StationL,L
1.7 0.45
Sandy Creek at HomebushB,B
2.2 0.35
Fitzroy River at RockhamptonL,L
0.014 0.0072
Burnett River at Ben Anderson Barrage Head WaterL,L
0.046 0.0089
Hexazinone Forestry, grazing and sugarcane
North Johnstone River at Goondi BridgeB,B
0.0026 NC
Tully River at EuramoB,B
0.46 0.38
Herbert River at InghamB,L
0.0069 0.0082
Barratta Creek at NorthcoteB,L
0.023 0.0040
Burdekin River at Home HillL,L
NC NC
Pioneer River at Dumbleton Pump StationL,L
0.11 0.023
Sandy Creek at HomebushB,B
0.34 0.054
Fitzroy River at RockhamptonL,L
0.00022 NC
Burnett River at Ben Anderson Barrage Head WaterL,L
0.0019 0.00019
Tebuthiuron Grazing North Johnstone River at Goondi BridgeB,B
NC 0.00080
Tully River at EuramoB,B
NC 0.059
Herbert River at InghamB,L
NC NC
Barratta Creek at NorthcoteB,L
0.0017 0.0022
Burdekin River at Home HillL,L
0.0068 0.0019
Pioneer River at Dumbleton Pump StationL,L
NC 0.0018
Sandy Creek at HomebushB,B
NC NC
Fitzroy River at RockhamptonL,L
0.054 0.0080
Burnett River at Ben Anderson Barrage Head WaterL,L
0.0051 0.000067 L = average load (linear interpolation of concentration) method used to calculate loads in the 2010–2011 and 2011–2012 years respectively;
B = Beale ratio
method used to calculate loads in the 2010–2011 and 2011–2012 years respectively.

Page | 79 www.reefplan.qld.gov.au
Appendix F Representivity rating of all monitored annual total suspended solids and nutrient loads
Table 7.7 The number of samples collected and the representivity rating for monitored sites in 2012–2013. Text in bold are end-of-system sites and the corresponding data, all others are sub-catchment sites.
NRM region Catchment Gauging
station River and site name
TSS TN PN NOx-N NH4-N DIN
n Rating n Rating n Rating n Rating n Rating n Rating
Cape York Normanby 105107A Normanby River at Kalpowar Crossing 7 good 0 0 0 0 0
Wet Tropics Barron 110001D Barron River at Myola 28 excellent 28 excellent 28 excellent 28 excellent 28 excellent 28 excellent
Johnstone 112004A North Johnstone River at Tung Oil$ 34 good 34 good 34 good 34 good 34 good 34 good
112101B South Johnstone River at Upstream Central Mill$ 47 excellent 47 excellent 47 excellent 47 excellent 47 excellent 47 excellent
Tully 113006A Tully River at Euramo 161 excellent 161 excellent 161 excellent 161 excellent 161 excellent 161 excellent
113015A Tully River at Tully Gorge National Park 34 moderate 34 moderate 34 moderate 34 moderate 34 moderate 34 moderate
Herbert 116001F Herbert River at Ingham 45 good 45 good 45 good 45 good 45 good 45 good
Burdekin Haughton 119101A Barratta Creek at Northcote 43 excellent 43 excellent 43 excellent 43 excellent 43 excellent 43 excellent
Burdekin 120001A Burdekin River at Home Hill
29 good 29 good 29 good 29 good 29 good 29 good
120002C Burdekin River at Sellheim 13 moderate 13 moderate 13 moderate 13 moderate 13 moderate 13 moderate
120205A Bowen River at Myuna 47 excellent 47 excellent 47 excellent 47 excellent 47 excellent 47 excellent
120301B Belyando River at Gregory Development Road 13 good 12 good 12 good 12 good 12 good 12 good
120302B Cape River at Taemas 18 good 18 good 18 good 18 good 18 good 18 good
120310A Suttor River at Bowen Development Road 20 good 20 good 20 good 20 good 20 good 20 good
Mackay
Whitsunday
Pioneer 125013A Pioneer River at Dumbleton Pump Station 104 excellent 104 excellent 103 excellent 104 excellent 104 excellent 104 excellent
Plane 126001A Sandy Creek at Homebush 26 good 26 good 26 good 26 good 26 good 26 good
Fitzroy Fitzroy 1300000 Fitzroy River at Rockhampton 23 good 23 good 23 good 23 good 23 good 23 good
130206A Theresa Creek at Gregory Highway 5 indicative 5 indicative 5 indicative 5 indicative 5 indicative 5 indicative
130302A Dawson River at Taroom 13 good 13 good 12 good 13 good 13 good 13 good
130504B Comet River at Comet Weir 8 good 8 good 8 good 8 good 8 good 8 good
Burnett Mary Burnett 136014A
Burnett River at Ben Anderson Barrage Head
Water 73 excellent 72 excellent 72 excellent 73 excellent 73 excellent 73 excellent
136002D Burnett River at Mt Lawless 20 indicative 20 indicative 10 indicative 10 indicative 10 indicative 10 indicative
136094A Burnett River at Jones Weir Tail Water 9 indicative 9 indicative 9 indicative 9 indicative 9 indicative 9 indicative
136106A Burnett River at Eidsvold 10 indicative 10 indicative 10 indicative 10 indicative 10 indicative 10 indicative
n = number of concentration data points used in the calculation of loads; TSS = total suspended solids; TN = total nitrogen; PN = particulate nitrogen; NOx-N = oxidised nitrogen as N; NH4-N = ammonium nitrogen as N; DIN = dissolved inorganic
nitrogen (DIN = (NOx-N) + (NH4-N)); DON = dissolved organic nitrogen; TP = total phosphorus; DIP = dissolved inorganic phosphorus; PP = particulate phosphorus; DOP = dissolved organic phosphorus; and $ = the North and South Johnstone rivers
combined act as an end-of-system site.

Page | 80 www.reefplan.qld.gov.au
Table 7.8 The number of samples collected and the representivity rating for monitored sites in 2012–2013. Text in bold are end-of-system sites and the corresponding data, all others are sub-catchment sites.
NRM region Catchment Gauging
station River and site name
DON TP DIP PP DOP
n Rating n Rating n Rating n Rating n Rating
Cape York Normanby 105107A Normanby River at Kalpowar Crossing 0 0 0 0 0
Wet Tropics Barron 110001D Barron River at Myola 28 excellent 28 excellent 28 excellent 28 excellent 28 excellent
Johnstone 112004A North Johnstone River at Tung Oil$ 34 good 34 good 34 good 34 good 34 good
112101B South Johnstone River at Upstream Central Mill$ 47 excellent 47 excellent 47 excellent 47 excellent 47 excellent
Tully 113006A Tully River at Euramo 161 excellent 161 excellent 161 excellent 161 excellent 161 excellent
113015A Tully River at Tully Gorge National Park 34 moderate 34 moderate 34 moderate 34 moderate 34 moderate
Herbert 116001F Herbert River at Ingham 45 good 45 good 45 good 45 good 45 good
Burdekin Haughton 119101A Barratta Creek at Northcote 43 excellent 43 excellent 43 excellent 43 excellent 43 excellent
Burdekin 120001A Burdekin River at Home Hill
29 good 29 good 29 good 29 good 29 good
120002C Burdekin River at Sellheim 13 moderate 13 moderate 13 moderate 13 moderate 13 moderate
120205A Bowen River at Myuna 47 excellent 47 excellent 47 excellent 47 excellent 47 excellent
120301B Belyando River at Gregory Development Road 12 good 12 good 12 good 12 good 12 good
120302B Cape River at Taemas 18 good 18 good 18 good 18 good 18 good
120310A Suttor River at Bowen Development Road 20 good 20 good 20 good 20 good 20 good
Mackay
Whitsunday
Pioneer 125013A Pioneer River at Dumbleton Pump Station 103 excellent 104 excellent 104 excellent 103 excellent 103 excellent
Plane 126001A Sandy Creek at Homebush 26 good 26 good 26 good 26 good 26 good
Fitzroy Fitzroy 1300000 Fitzroy River at Rockhampton 23 good 23 good 23 good 23 good 23 good
130206A Theresa Creek at Gregory Highway 5 indicative 5 indicative 5 indicative 5 indicative 5 indicative
130302A Dawson River at Taroom 12 good 13 good 13 good 12 good 12 good
130504B Comet River at Comet Weir 8 good 8 good 8 good 8 good 8 good
Burnett Mary Burnett 136014A
Burnett River at Ben Anderson Barrage Head
Water 72 excellent 72 excellent 73 excellent 72 excellent 72 excellent
136002D Burnett River at Mt Lawless 10 indicative 20 indicative 10 indicative 10 indicative 10 indicative
136094A Burnett River at Jones Weir Tail Water 9 indicative 9 indicative 9 indicative 9 indicative 9 indicative
136106A Burnett River at Eidsvold 10 indicative 10 indicative 10 indicative 10 indicative 10 indicative
n = the number of concentration data points used for the load calculation; TSS = total suspended solids; TN = total nitrogen; PN = particulate nitrogen; NOx-N = oxidised nitrogen as N; NH4-N = ammonium nitrogen as N; DIN = dissolved inorganic
nitrogen (DIN = (NOx-N) + (NH4-N)); DON = dissolved organic nitrogen; TP = total phosphorus; DIP = dissolved inorganic phosphorus; PP = particulate phosphorus; DOP = dissolved organic phosphorus; and $ = the North and South Johnstone rivers
combined act as an end-of-system site.

Page | 81 www.reefplan.qld.gov.au