Total Return Bond Strategy - manulifeim.com
13
For a discussion of the risks associated with this strategy, please see the Investment Considerations page at the end of the presentation. Total Return Bond Strategy Quarterly Market & Strategy Review Fourth quarter 2021
Transcript of Total Return Bond Strategy - manulifeim.com

For a discussion of the risks associated with this strategy, please see the Investment Considerations page at the end of the presentation.
Total Return Bond StrategyQuarterly Market & Strategy Review
Fourth quarter 2021

For Institutional/Investment Professional Use Only. Not for distribution to the public.
Total Return Bond StrategyBonds were mixed on higher yields and a flatter curve
2QMSR.548778
As of December 31, 2021Source: US Federal Reserve, St. Louis Federal Reserve, ICE BofA Merrill Lynch
Intermediate yields rose as wellShort-term Libor moved higher
0.00
0.15
0.30
0.45
0.60
Jan-
21
Feb
-21
Mar
-21
Apr
-21
May
-21
Jun-
21
Jul-2
1
Aug
-21
Sep
-21
Oct
-21
Nov
-21
Dec
-21
3M Libor 12M Libor
Volatile MBS spreads
0.00
0.25
0.50
0.75
1.00
1.25
1.50
1.75
2.00
2.25
2.50
12/31/2021 9/30/2021
1.90
2.08
1.52
1.52
0.06
0.04
0.73
0.28
40
50
60
70
MBS (Nominal Spread)
55
56

For Institutional/Investment Professional Use Only. Not for distribution to the public.
Total Return Bond StrategyActively protecting the portfolio in a rising rate environment
3QMSR.548778
Asset Purchase
TaperingInterest Rate Hikes
Balance Sheet
Reduction
• Asset purchase tapering began in November and expected to complete in March. Higher
mortgage rates could cause extension risk for agency fixed-rate pools.
• Markets are expecting multiple interest rate hikes in 2022, potential for Fed to reduce its
balance sheet.
• Exposure to non-residential collateral through asset backed and commercial mortgage-
backed securities may help mitigate Fed policy impacts.
• Certain subsectors can be a source of floating rate securities – Agency CRT, CLOs, CMBS.
Fed policy shift highlights importance of diversification and active management
For Institutional/Investment Professional Use Only. Not for distribution to the public.
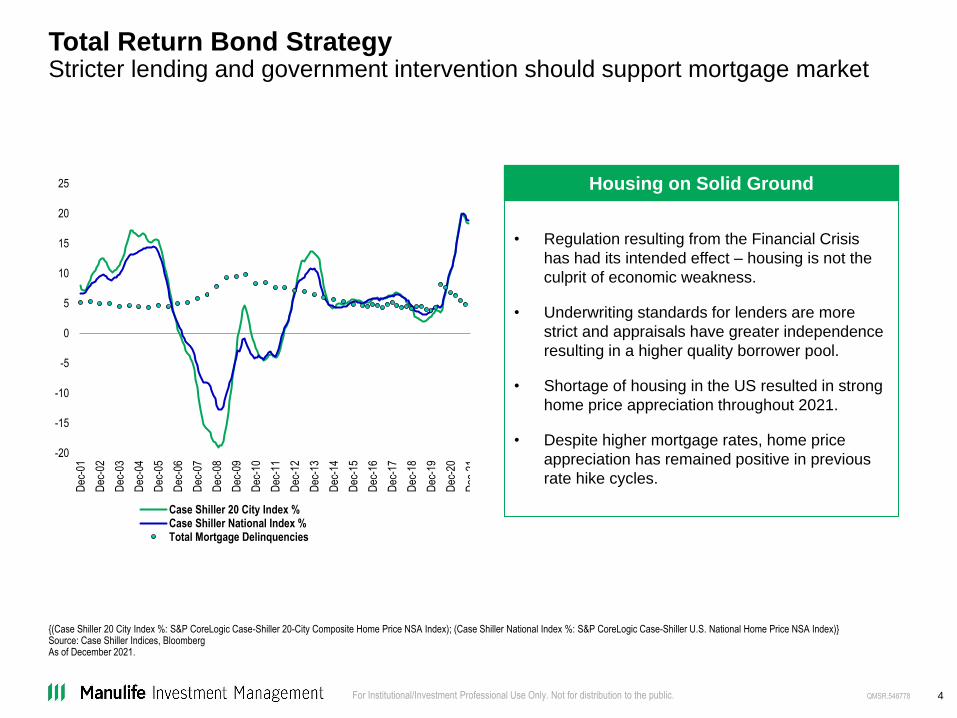
Total Return Bond StrategyStricter lending and government intervention should support mortgage market
4QMSR.548778
{(Case Shiller 20 City Index %: S&P CoreLogic Case-Shiller 20-City Composite Home Price NSA Index); (Case Shiller National Index %: S&P CoreLogic Case-Shiller U.S. National Home Price NSA Index)}Source: Case Shiller Indices, BloombergAs of December 2021.
• Regulation resulting from the Financial Crisis
has had its intended effect – housing is not the
culprit of economic weakness.
• Underwriting standards for lenders are more
strict and appraisals have greater independence
resulting in a higher quality borrower pool.
• Shortage of housing in the US resulted in strong
home price appreciation throughout 2021.
• Despite higher mortgage rates, home price
appreciation has remained positive in previous
rate hike cycles.
Housing on Solid Ground
-20
-15
-10
-5
0
5
10
15
20
25
Dec
-01
Dec
-02
Dec
-03
Dec
-04
Dec
-05
Dec
-06
Dec
-07
Dec
-08
Dec
-09
Dec
-10
Dec
-11
Dec
-12
Dec
-13
Dec
-14
Dec
-15
Dec
-16
Dec
-17
Dec
-18
Dec
-19
Dec
-20
Dec
-21
Case Shiller 20 City Index %Case Shiller National Index %Total Mortgage Delinquencies

For Institutional/Investment Professional Use Only. Not for distribution to the public.
Total Return Bond StrategyStrong positive results in challenging market environment
5QMSR.548778
Q4/2021 Performance ContributorsQ4/2021Strategy Performance
-0.16
2.97
0.01
-1.54
-0.39
-1.04
0.23
-1.04
-2.00
-1.50
-1.00
-0.50
0.00
0.50
1.00
1.50
2.00
2.50
3.00
3.50
4.00
Q4 2021 2021
Total Return Bond Bloomberg US Aggregate Index
Bloomberg US Securitized Index Bloomberg US Corporate Index
0.13
0.04
0.22
0.66
0.63
1.37
-0.08
0.02
-0.03
0.04
-0.07
0.03
-0.01
-0.14
-0.50 0.00 0.50 1.00 1.50
UST & Other
Corporate Bonds
CLO
ABS
RMBS
CMBS
Agency MBS
Q4 2021 2021
Performance shown is gross of fees, as of December 31, 2021.
Past performance is not indicative of future results. Performance calculated in USD.

For Institutional/Investment Professional Use Only. Not for distribution to the public.
Total Return Bond StrategyPortfolio Allocation and Outlook
6QMSR.548778
Source: Manulife Investment Management, as of December 31, 2021.
Cre
dit
-Sen
sit
ive
Inte
rest
Rate
-Sen
sit
ive
Subsector Market FactorsQoQ
Chg (%)
CLO
• Sector offers carry advantage versus corporate bonds
• Opportunities present in BBB to AAA tranches but need to be selective in quality
• Rising interest rates should benefit CLOs due to their floating rate coupons
-0.7%
CMBS
• Interest only securities offer value with rising interest rates
• Select opportunities in single asset single borrower transactions
• Uncertainty still lingers in CRE and property selection matters
-0.6%
ABS
• Student loan ABS offers relative value to other consumer ABS
• Esoteric ABS sectors such as container, franchise, and timeshare provide exposure to different collateral types, and a pickup in spread relative to consumer sectors.
1.4%
Non-Agency
RMBS
• Continued tight housing supply should drive home price appreciation in 2022, though a lower pace of appreciation should be expected with sustained higher mortgage rates and lower affordability.
• Agency CRT and MI CRT bonds in the top and middle of the capital structure offer relative value to other non-agency MBS sectors.
• The single-family rental sector offers another opportunity to leverage the strength in housing.
-2.8%
Agency MBS
• Tapering of MBS purchases has begun and expected to complete in March 2022
• Mortgage spreads have widened with tapering and discussion of balance sheet reduction occurring sooner than expected.
• The back up in mortgage rates to mid 3% leaves <25% of the MBS universe in-the-money to refinance. Expectations are for prepayment speeds to slow.
-1.2%

For Institutional/Investment Professional Use Only. Not for distribution to the public.
Total Return Bond StrategyStrong yield advantage, diversification benefit from securitized
7QMSR.548778
Performance and data shown is gross of fees, as of December 31, 2021.
Diversification does not guarantee a profit or eliminate the risk of a loss. Past performance is not indicative of future results. Performance calculated in USD.
2021 Q4 Overview
• With a YTW of 3.57% as of the end of December, the Strategy seeks to provide a substantial yield advantage over
investment grade fixed income sectors while maintaining a significantly shorter duration relative to most other sectors.
• Lower correlation to fixed income asset classes adds potential diversification benefits with traditional fixed income
allocations while maintaining investment grade average quality.
Since Inception
Correlation1 2 3 4 5 6
Total Return Bond
Strategy (1)1.00
Bloomberg US Aggregate
Index (2)0.45 1.00
Bloomberg US Treasury
Index (3)0.09 0.89 1.00
Bloomberg US Securitized
Index (4)0.28 0.89 0.83 1.00
Bloomberg US Corporate
Index (5)0.74 0.82 0.48 0.58 1.00
Bloomberg US High Yield
Index (6)0.64 0.20 -0.22 0.05 0.65 1.00
Yield to
Worst
Eff
Duration
Avg
Quality
Total Return Bond Strategy 3.57 3.33 Baa1
Bloomberg US Aggregate Index 1.75 6.76 Aa2
Bloomberg US Treasury Index 1.23 7.14 Aaa
Bloomberg US Securitized Index 1.97 4.76 Aa1
Bloomberg US Corporate Index 2.32 8.66 Baa1
Bloomberg US High Yield Index 4.20 3.82 B1

For Institutional/Investment Professional Use Only. Not for distribution to the public.
Risk-adjusted returns
8QMSR.548778
* Source: eVestment** The Bloomberg US HY Loan Index previously shown was discontinued on October 31, 2016. The S&P/LSTA Leveraged Loan Index was chosen to replace it as it was the most similar in composition.1 Inception Date: February 2011. Past performance is not indicative of future results. Performance is shown in USD, gross of fees and does not include advisory fees and other expenses an investor may incur, which when deducted will reduce returns. Changes in exchange rates may have an adverse effect.
December 31, 2021 — Since Inception Return and Risk Metrics (%)1
6.06
3.99
1.38
3.352.96
0.95
6.506.78
0.88
4.25
5.20
0.71
Annualized Since Inception Return Annualized Standard Deviation* Annualized Sharpe Ratio*
Total Return Bond Composite
Bloomberg US Aggregate Index
Bloomberg US High Yield Index
S&P/LSTA Leveraged Loan Index**
Return (%)
QTD 1-Year 3-Year 5-Year
Since
Incep. 2021 2020 2019 2018 2017
Total Return Bond Composite (Gross) -0.16 2.97 5.64 5.30 6.06 2.97 6.30 7.72 3.27 6.34
Bloomberg US Aggregate Index 0.01 -1.54 4.79 3.57 3.35 -1.54 7.51 8.72 0.01 3.54
Bloomberg US High Yield Index 0.71 5.28 8.83 6.30 6.50 5.28 7.11 14.32 -2.08 7.50
S&P/LSTA Leveraged Loan Index** 0.76 5.20 5.63 4.27 4.25 5.20 3.14 8.64 0.44 4.12

For Institutional/Investment Professional Use Only. Not for distribution to the public.
Total Return Bond StrategyBenchmark Definitions
9QMSR.548778
Index Definition
Bloomberg US High Yield Index
The Bloomberg US High Yield Index covers the universe of fixed rate, non-investment grade debt. Eurobonds and debt issues from countries designated as emerging
markets are excluded, but Canadian and global bonds (SEC registered) of issuers in non-EMG countries are included. Original issue zeroes, step-up coupon structures,
144-As and pay-in-kind bonds (PIKs, as of October 1, 2009) are also included.
Bloomberg US Aggregate IndexThe Bloomberg US Aggregate Bond Index represents securities that are US domestic, taxable, dollar-denominated. The index covers the US investment-grade fixed-rate
bond market, with index components for government and corporate securities, mortgage pass-through securities, and asset-backed securities.
Bloomberg US Government Index Comprised of the US Treasury and US Agency Indices, the US Government Index contains securities issued by the US Government.
Bloomberg US Corporate IndexThe Bloomberg US Corporate Index represents publicly issued US corporate and specified foreign debentures and secured notes that meet the specified maturity, liquidity,
and quality requirements. To qualify, bonds must be SEC-registered.
Bloomberg US 1-3 Year Corporate Index The Bloomberg US 1-3 Year Corporate Index is the 1-3 Year component of the Bloomberg US Corporate Index.
Bloomberg US 3-5 Year Corporate Index The Bloomberg US 3-5 Year Corporate Index is the 1-3 Year component of the Bloomberg US Corporate Index.
Bloomberg US Securitized IndexThe Bloomberg US Securitized Index consists of the securitized component of the Bloomberg US Aggregate Index. The index includes eligible Agency MBS, ABS, and
CMBS securities.
S&P/LSTA Leveraged Loan Index The S&P/LSTA Leveraged Loan Index represents the universe of syndicated leveraged loans. The index consists of US dollar denominated, senior secured term loans
with at least one year to maturity, with a minimum issue facility size of at least 50 million USD.
S&P CoreLogic Case-Shiller 20-City
Composite Home Price NSA Index
The S&P CoreLogic Case-Shiller 20-City Composite Home Price NSA Index seeks to measure the value of residential real estate in 20 major U.S. metropolitan areas:
Atlanta, Boston, Charlotte, Chicago, Cleveland, Dallas, Denver, Detroit, Las Vegas, Los Angeles, Miami, Minneapolis, New York, Phoenix, Portland, San Diego, San
Francisco, Seattle, Tampa and Washington, D.C.
S&P CoreLogic Case-Shiller U.S.
National Home Price NSA Index
The S&P CoreLogic Case-Shiller U.S. National Home Price NSA Index is a composite of single-family home price indices for the nine U.S. Census divisions and is
calculated monthly. It is included in the S&P CoreLogic Case-Shiller Home Price Index Series which seeks to measure changes in the total value of all existing single-
family housing stock.

For Institutional/Investment Professional Use Only. Not for distribution to the public.
Manulife Investment Management Total Return Bond Composite
1020210405.1035
Creation Date: January 1, 2018 Inception Date: February 1, 2011 Reporting Currency: USD
Schedule of Calendar Year Returns and Assets
Year End
Gross of Fees
Return (%)
Net of Fees
Return (%)
Benchmark
Return (%)
Composite 3-Yr
Std. Dev. (%)
Benchmark 3-Yr
Std. Dev. (%)
Number of
Portfolios End
of Period
Composite
Dispersion (%)
Total Assets
End of Period
(Millions)
Firm Assets
End of Period
(Millions)
2020 6.30 5.51 7.51 6.69 3.36 <=5 N/A 569 421,097
2019 7.72 6.92 8.72 1.55 2.87 <=5 N/A 532 422,034
2018 3.27 2.50 0.01 1.51 2.84 <=5 N/A 507 392,058
2017 6.34 5.55 3.54 1.59 2.78 <=5 N/A 460 N/A
2016 4.58 3.81 2.65 1.74 2.98 <=5 N/A 399 N/A
2015 2.66 1.92 0.55 2.15 2.88 <=5 N/A 454 N/A
2014 7.52 6.73 5.97 2.61 2.63 <=5 N/A 419 N/A
2013 2.89 2.04 -2.03 N/A N/A <=5 N/A 263 N/A
2012 16.27 15.50 4.23 N/A N/A <=5 N/A 241 N/A
Partial 2011 6.32 5.02 7.74 N/A N/A <=5 N/A 115 N/A
Firm Definition
For purposes of compliance with the Global Investment Performance Standards (GIPS®), our firm Manulife Investment Management “Manulife IM” was created on January 1, 2018 as a result of a consolidation of six firms that claimed compliance with GIPS®. Manulife IM comprises Manulife Investment Management (US) LLC, Manulife Investment Management (North America) Limited, Manulife Investment Management (Europe) Limited, Manulife Investment Management (Japan), Manulife Investment Management (Hong Kong) Limited, Manulife Investment Management (Singapore) Pte. Ltd., Manulife Investment Management Limited, Manulife Investment Management Private Markets (Canada) Corp. and John Hancock Trust Company. Effective January 1, 2021, the firm includes assets managed under contract by Manulife Investment Management Private Markets (US) LLC (“Manulife IM PM US”) and the unaffiliated managers SMA/Wrap business from John Hancock Investment Management LLC, a Manulife IM company.
Compliance Statement
Manulife Investment Management claims compliance with the Global investment Performance Standards (GIPS®) and has prepared and presented this report in compliance with the GIPS® standards. Manulife Investment Management has been independently verified for the periods 1/1/2018 through 12/31/2019. The verification report is available upon request. Verification assesses whether (1) the firm has complied with all the composite construction requirements of the GIPS® standards on a firm-wide basis and (2) the firm’s policies and procedures are designed to calculate and present performance in compliance with the GIPS® standards. Verification does not ensure the accuracy of any specific composite reports. Compliance with the GIPS® Standards for the predecessor firms were verified by a third party for the periods noted: MAM US 1/1/1993 to 12/31/2017, MAM UK 1/1/2008 to 12/31/2017, MAMJ 1/1/2006 to 12/31/2017, MAM HK 1/1/2006 to 12/31/2017, MAMS 6/5/2007 to 12/31/2017, and MAML 1/1/2007 to 12/31/2017. GIPS® is a registered trademark of CFA Institute. CFA Institute does not endorse or promote this organization, nor does it warrant the accuracy or quality of the content contained herein.
General Disclosure
A complete list of the Firm’s composite descriptions and policies regarding valuing portfolios, calculating performance, and preparing GIPS compliant reports are available upon request. All returns reflect the reinvestment of dividends and other earnings. Gross performance results do not reflect the deduction of investment management fees, and are net of commissions and foreign withholding tax. Net performance results reflect the application of the highest incremental rate of the standard investment advisory fee schedule to gross performance results. Actual fees may vary depending on, among other things, the applicable fee schedule and portfolio size. Advisory fees are available upon request. Dispersion of annual returns is measured by an asset-weighted standard deviation calculation of gross of fee returns. Dispersion is not presented when there are five or fewer accounts in the composite for the entire year. Past performance is not a guarantee of future results. For annual periods startingJanuary 1, 2011, the 3-year annualized ex-post standard deviation is not shown for the composite or the benchmark when 36 monthly composite returns are not available.
Composite Description
The Total Return Bond strategy includes all portfolios with a return objective of 6-10% net annualized over a market cycle. The strategy invests primarily in the securitized markets and is designed to generate high current income with controlled exposures to credit, prepayment and interest rate risk. Holdings include both investment and non-investment grade securities.
Fee Schedule
This report is intended for institutional investors and the standard investment advisory fee schedule is 0.60%.
Benchmark Description
The Bloomberg Barclays U.S. Aggregate Bond Index includes government securities, mortgage-backed securities, asset-backed securities and corporate securities to simulate the universe of bonds in the market. The maturities of the bonds in the index are more than one year.
Benchmark Change
Effective December 31, 2015 the benchmark was retroactively changed from the BofA Merrill Lynch LIBOR 3-Month Constant Maturity Index to the Bloomberg Barclays U.S. Aggregate Bond Index as this index better reflects the investment process and holdings of the composite. Returns for the BofA Merrill Lynch LIBOR 3-Month Index are available upon request.
GIPS® Report

For Institutional/Investment Professional Use Only. Not for distribution to the public. 11
Investment Considerations
A widespread health crisis such as a global pandemic
could cause substantial market volatility, exchange-
trading suspensions and closures, and affect portfolio
performance. For example, the novel coronavirus
disease (COVID-19) has resulted in significant
disruptions to global business activity. The impact of a
health crisis and other epidemics and pandemics that
may arise in the future, could affect the global
economy in ways that cannot necessarily be foreseen
at the present time. A health crisis may exacerbate
other pre-existing political, social and economic risks.
Any such impact could adversely affect the portfolio’s
performance, resulting in losses to your investment.
Any performance information shown is the investment
strategy composite gross of fees, including advisory
and investment management fees and other expenses
an investor would incur, but net of transaction costs,
unless otherwise noted; deduction of such expenses
would reduce returns. Net performance results reflect
the application of the highest incremental rate of the
standard investment advisory or management fee
schedule to gross performance results, unless
otherwise indicated. Changes in exchange rates may
have an adverse effect. Actual fees may vary
depending on, among other things, the applicable fee
schedule, portfolio size and/or investment
management agreement. For example, if $100,000
were invested and experienced a 10% annual return
compounded monthly for 10 years, its ending value,
without giving effect to the deduction of advisory or
investment management fees, would be $270,704
with an annualized compounded return of 10.47%. If
an advisory or investment management fee of 0.95%
of the average market value of the account were
deducted monthly for the 10-year period, the
annualized compounded return would be 9.43% and
the ending dollar value would be $246,355. Unless
otherwise noted, returns greater than 1 year are
annualized; calendar year returns for each one year
period end in December. Discrepancies may occur
due to rounding. Past performance does not
guarantee future results.
Performance information shown is generally for
discretionary strategies/solutions and managed by a
Manulife entity which is GIPS compliant and falls
under the definition of a corresponding Manulife GIPS
firm. Some investment strategies/solutions may not
be included in a GIPS compliant firm under certain
circumstances, such as SMA/UMA business in
Canada.
Any characteristics, guidelines, constraints, or other
information provided for this material was selected by
the firm as representative of the investment strategy
and is provided for illustrative purpose only, may
change at any time, and may differ for a specific
account. Each client account is individually managed;
actual holdings will vary for each client and there is no
guarantee that a particular client’s account will have
the same characteristics as described herein. Any
information about the holdings, asset allocation, or
sector diversification is historical and is not an
indication of future performance or any future portfolio
composition, which will vary. Portfolio holdings are
representative of the strategy, are subject to change
at any time, are not a recommendation to buy or sell a
security, and do not represent all of the securities
purchased, sold or recommended for the portfolio. It
should not be assumed that an investment in these
securities was or will be profitable. Top ten holdings
information combines share listings from the same
issuer, and related depositary receipts, into a singular
holding to accurately present aggregate economic
interest in the referenced company.
No investment strategy or risk management technique
can guarantee returns or eliminate risk in any market
environment. Diversification or asset allocation does
not guarantee a profit or protect against the risk of a
loss in any market. The indices referenced herein are
broad-based securities market indices and used for
illustrative purposes only. The indices cited are widely
accepted benchmarks for investment performance
within their relevant regions, sectors or asset classes,
and represent non-managed investment portfolios.
If derivatives are employed, note that investing in
derivative instruments involves risks different from, or
possibly greater than, the risks associated with
investing directly in securities and other traditional
investments and, in a down market, could become
harder to value or sell at a fair price.
Information about SFDR
Unless otherwise noted, any references in this
presentation to ESG or sustainability reflect the
general approach of Manulife Investment
Management to integrating sustainability risk
considerations into our investment decision-making
processes. Further details on Manulife Investment
Management’s general approach to sustainability are
available at www.manulifeim.com/institutional
/global/en/sustainability.
The source for all information shown is Manulife
Investment Management, unless otherwise noted.

For Institutional/Investment Professional Use Only. Not for distribution to the public. 12
Important Information
© 2022 Manulife Investment Management. All rights reserved.
Manulife, Manulife Investment Management, Stylized M Design, and
Manulife Investment Management & Stylized M Design are
trademarks of The Manufacturers Life Insurance Company and are
used by it, and by its affiliates under license.
This confidential document is for the exclusive use of the intended
institutional investors or their agents and may not be transmitted,
reproduced or used in whole or in part for any other purpose, nor
may it be disclosed or made available, directly or indirectly, in whole
or in part, to any other person without our prior written consent.
About Manulife Investment Management
Manulife Investment Management is the global wealth and asset
management segment of Manulife Financial Corporation. We draw
on more than a century of financial stewardship to partner with
clients across our institutional, retail, and retirement businesses
globally. Our specialist approach to money management includes
the highly differentiated strategies of our fixed-income, specialized
equity, multi-asset solutions, and private markets teams—along with
access to specialized, unaffiliated asset managers from around the
world through our multimanager model.
This material has not been reviewed by, is not registered with any
securities or other regulatory authority, and may, where appropriate,
be distributed by the following Manulife entities in their respective
jurisdictions. Additional information about Manulife Investment
Management may be found at manulifeim.com/institutional
Australia: Manulife Investment Management Timberland and
Agriculture (Australasia) Pty Ltd, Manulife Investment Management
(Hong Kong) Limited. Canada: Manulife Investment Management
Limited, Manulife Investment Management Distributors Inc.,
Manulife Investment Management (North America) Limited, Manulife
Investment Management Private Markets (Canada) Corp. China:
Manulife Overseas Investment Fund Management (Shanghai)
Limited Company. European Economic Area: Manulife Investment
Management (Ireland) Ltd. which is authorised and regulated by the
Central Bank of Ireland Hong Kong: Manulife Investment
Management (Hong Kong) Limited. Indonesia: PT Manulife Aset
Manajemen Indonesia. Japan: Manulife Investment Management
(Japan) Limited. Malaysia: Manulife Investment Management (M)
Berhad 200801033087 (834424-U) Philippines: Manulife
Investment Management and Trust Corporation. Singapore:
Manulife Investment Management (Singapore) Pte. Ltd. (Company
Registration No. 200709952G) South Korea: Manulife Investment
Management (Hong Kong) Limited. Switzerland: Manulife IM
(Switzerland) LLC. Taiwan: Manulife Investment Management
(Taiwan) Co. Ltd. United Kingdom: Manulife Investment
Management (Europe) Ltd. which
is authorised and regulated by the Financial Conduct Authority
United States: John Hancock Investment Management LLC,
Manulife Investment Management (US) LLC, Manulife Investment
Management Private Markets (US) LLC and Manulife Investment
Management Timberland and Agriculture Inc. Vietnam: Manulife
Investment Fund Management (Vietnam) Company Limited.
No Manulife entity makes any representation that the contents of
this presentation are appropriate for use in all locations, or that the
transactions, securities, products, instruments or services discussed
in this presentation are available or appropriate for sale or use in all
jurisdictions or countries, or by all investors or counterparties. All
recipients of this presentation are responsible for compliance with
applicable laws and regulations.
This material is intended for the exclusive use of recipients in
jurisdictions who are allowed to receive the material under their
applicable law. The opinions expressed are those of the author(s)
and are subject to change without notice. Our investment teams
may hold different views and make different investment decisions.
These opinions may not necessarily reflect the views of Manulife
Investment Management or its affiliates There can be no assurance
that actual outcomes will match the assumptions or that actual
returns will match any expected returns. The information and/or
analysis contained in this material has been compiled or arrived at
from sources believed to be reliable, but Manulife Investment
Management does not make any representation as to their
accuracy, correctness, usefulness or completeness and does not
accept liability for any loss arising from the use of the information
and/or analysis contained here. Neither Manulife Investment
Management or its affiliates, nor any of their directors, officers or
employees shall assume any liability or responsibility for any direct
or indirect loss or damage or any other consequence of any person
acting or not acting in reliance on the information contained here.
The information in this material may contain projections or other
forward-looking statements regarding future events, targets,
management discipline or other expectations, and is only current as
of the date indicated. The information in this material including
statements concerning financial market trends, are based on current
market conditions, which will fluctuate and may be superseded by
subsequent market events or for other reasons. This material was
prepared solely for informational purposes and does not constitute,
and is not intended to constitute, a recommendation, professional
advice, an offer, solicitation or an invitation by or on behalf of
Manulife Investment Management or its affiliates to any person to
buy or sell any security or to adopt any investment strategy, and
shall not form the basis of, nor may it accompany nor form part of,
any right or contract to buy or sell any security or to adopt any
investment strategy. Nothing in this material constitutes investment,
legal, accounting, tax or other advice, or a representation that any
investment or strategy is suitable or appropriate to your individual
circumstances, or otherwise constitutes a personal recommendation
to you. Neither Manulife Investment Management nor its affiliates
provide legal or tax advice, and you are encouraged to consult your
own lawyer, accountant, or other advisor before making any
financial decision. Prospective investors should take appropriate
professional advice before making any investment decision. In all
cases where historical performance is presented, note that past
performance does not guarantee future results and you should not
rely on it as the basis for making an investment decision.

For Institutional/Investment Professional Use Only. Not for distribution to the public. 13
Important Information (continued)
The distribution of the information contained in this presentation may
be restricted by law and persons who access it are required to
comply with any such restrictions. The contents of this presentation
are not intended for distribution to, or use by, any person or entity in
any jurisdiction or country in which such distribution or use would be
contrary to any applicable laws or regulations. By accepting this
material you confirm that you are aware of the laws in your own
jurisdiction relating to the provision and sale of the funds, portfolios
or other investments discussed in this presentation and you warrant
and represent that you will not pass on or use the information
contained in this presentation in a manner that could constitute a
breach of such laws by any Manulife entity or any other person.
Australia: Manulife Investment Management (Hong Kong) Limited
(Manulife IM (HK)) is exempt from the requirement to hold an
Australian financial services license under the Corporations Act in
respect to the financial services being offered in this material.
Manulife IM (HK) is regulated by the Securities and Futures
Commission of Hong Kong ("SFC") under Hong Kong laws, which
differ from Australian laws. This presentation is directed at
wholesale investors only.
China: No invitation to offer, or offer for, or sale of any security will
be made to the public in China (which, for the purposes of this
paragraph, does not include the Hong Kong or Macau Special
Administrative Regions or Taiwan) or by any means that would be
deemed public under the laws of China. The offering document of
the subject fund(s) has not been submitted to or approved by the
China Securities Regulatory Commission or other relevant
governmental authorities in China. Securities may only be offered or
sold to Chinese investors that are authorized to buy and sell
securities denominated in foreign exchange. Prospective investors
resident in China are responsible for obtaining all relevant approvals
from the Chinese government authorities, including but not limited to
the State Administration of Foreign Exchange, before investing.
Hong Kong: This material is provided to Professional Investors, as
defined in the Hong Kong Securities and Futures Ordinance and the
Securities and Futures (Professional Investor) Rules, in Hong Kong
only. It is not intended for and should not be distributed to, or relied
upon, by members of the public or retail investors.
Malaysia: This material was prepared solely for informational
purposes and is not an offer or solicitation by anyone in any
jurisdictions or to any person to whom it is unlawful to make such an
offer or solicitation.
Singapore: This material is intended for Accredited Investors and
Institutional Investors as defined in the Securities and Futures Act.
South Korea: This material is intended for Qualified Professional
Investors under the Financial Investment Services and Capital
Market Act ("FSCMA"). Manulife Investment Management does not
make any representation with respect to the eligibility of any
recipient of these materials to acquire any interest in any security
under the laws of Korea, including, without limitation, the Foreign
Exchange Transaction Act and Regulations thereunder. An interest
may not be offered, sold or delivered directly or indirectly, or offered,
sold or delivered to any person for re-offering or resale, directly or
indirectly, in Korea or to any resident of Korea, except in compliance
with the FSCMA and any other applicable laws and regulations. The
term “resident of Korea” means any natural person having his place
of domicile or residence in Korea, or any corporation or other entity
organized under the laws of Korea or having its main office in Korea.
Switzerland: This material is intended for Professional Clients,
including Institutional Clients, as defined in the Federal Financial
Services Act ("FinSA") and its implementing ordinance, at the
exclusion of Professional Clients with an opting-out pursuant to Art.
5 (1) FinSA ("Opting-Out Clients"), and/or Qualified Investors
pursuant to the Federal Collective Investment Schemes Act ("CISA")
and its implementing ordinances, at the exclusion of Opting-Out
Clients and Managed/Advisory Retail Clients pursuant to Art. 10
(3ter) CISA where relevant. The information provided in this material
is for information purpose only and does not constitute an offer, a
solicitation or a recommendation to contract a financial instrument or
a financial service as defined under FinSA. This material does not
constitute an implicit or explicit investment advice. The information
provided herein is general in nature and does not constitute an
advertisement of financial products in Switzerland pursuant to FinSA
and its implementing ordinance.
European Economic Area and United Kingdom: The data and
information presented is directed solely at persons who are
Professional Investors in accordance with the Markets in Financial
Instruments Directive (2004/39/EC) as transposed into the relevant
jurisdiction. Further, the information and data presented does not
constitute, and is not intended to constitute, "marketing" as defined
in the Alternative Investment Fund Managers Directive.
United States: Manulife Investment Management (US) LLC
(Manulife IM US) and Manulife Investment Management (North
America) Limited (Manulife IM NA) are indirect wholly owned
subsidiaries of Manulife. John Hancock Investment Management
LLC and Manulife Investment Management (US) LLC are affiliated
SEC-registered investment advisors using the brand name John
Hancock Investment Management. This material is not intended to
be, nor shall it be interpreted or construed as, a recommendation or
providing advice, impartial or otherwise.