VOC-fria linoljebaserade tr¤skyddsprodukter VOC-free linseed oil
Aquaculture APRIL 2003; 220 (1-4) : 737-747 http://dx.doi.org/10.1016/S0044-8486(99)00284-7 Copyright © 2003 Elsevier Science B.V. All rights reserved
Archimer http://www.ifremer.fr/docelec/Archive Institutionnelle de l’Ifremer
Total replacement of fish oil by soybean or linseed oil with a return to fish oil in Turbot (Psetta maxima)
C. Regost a, J. Arzel a, J. Robin a, G. Rosenlund b, S.J. Kaushik c,*
a : Fish Nutrition Laboratory, Unité mixte INRA-IFREMER, Centre de Brest IFREMER, 29280 Plouzané, France b : Nutreco Aquaculture Research Centre (ARC), P.O. Box 48, N-4001, Stavanger, Norway c : Fish Nutrition Laboratory, Unité mixte INRA-IFREMER, BP 3, 64310 Saint Pée-sur-Nivelle, France *: Corresponding author : [email protected], Tel.: +33-5-59-51-59-51; fax: +33-5-59-54-51-52
Abstract: The aim of the study was to investigate the replacement of fish oil by vegetable oils and the effects of a washout with a return to fish oil on growth performances and lipid metabolism. Three experimental fish meal based, isonitrogenous (crude protein content: 57.5%) and isolipidic (crude lipid content: 16.5%) diets, were formulated containing either 9% of added fish oil (FO), soybean oil (SO) or linseed oil (LO). Each diet was distributed to triplicate groups of 25 marketable size turbot (initial body weight of 579 g) grown in seawater at a water temperature of 17°C. Fish were fed once a day to visual satiety. At the end of the growth trial which lasted 13 weeks, all groups of turbot were fed FO diet for 8 weeks. The growth of turbot was high, but the incorporation of vegetable oils in the diets resulted in a slight decrease in growth as compared to those fed the fish oil based diet. Feed and protein efficiency and whole body composition were not affected by dietary lipid sources. Total lipid content was low in the muscle of turbot (below 2%), ventral muscle being fatter than dorsal muscle. Liver and muscle fatty acid (FA) composition reflected dietary FA composition. Liver and muscle of fish fed SO diet were rich in 18:2n-6 whereas those of fish fed LO diet were rich in 18:3n-3. Liver and muscle of fish fed SO and LO diets had lower levels of 20:5n-3 and 22:6n-3 in comparison to those of fish fed FO diet. In turbot, hepatic lipogenic enzyme activities were low and not influenced by dietary lipid source. At the end of the second period, after transfer to FO based diets, muscle FA composition of fish fed previously SO and LO diets was still different to those of fish fed the FO diet. The values of 18:2n-6 and 18:3n-3 respectively were lower than the values found at the end of the growth period but higher than those of fish fed the FO diet. An increase of FA levels, characteristic of fish oil, was observed in the liver and muscle of fish previously fed vegetable oils. Data obtained show that replacement of fish oil by vegetable oils is possible without any significant impact on growth performance of turbot, that dietary lipids are an effective vector to influence the nutritional quality of finished product and that a duration of 8 weeks is not sufficient to bring the FA profile of turbot of this size back to that of fish fed fish oil over the whole period.
1
1. INTRODUCTION
High dietary fat levels are commonly used in salmonid diets as an important source of energy
for protein sparing and to decrease nitrogenous losses (Aksnes et al., 1996). But there is a
concern that fish oil and fish meals are becoming more and more scarce (Barlow and Pike,
2001). In the context of research on the substitution of fish oil in diets of fish, several studies
(Reinitz and Yu, 1981; Hardy et al., 1987; Thomassen and Røsjø, 1989; Greene and
Selivonchick, 1990; Arzel et al., 1994; Guillou et al., 1995) have shown that at least in
salmonids, it is possible to totally replace fish oil by plant oil sources such as soybean oil,
corn oil, linseed oil and rapeseed oil without affecting growth. However, this kind of
substitution is known to modify muscle fatty acid composition (Thomassen and Røsjø, 1989;
Greene and Selivonchick, 1990; Arzel et al., 1994). In rainbow trout broodstock, it has also
been shown that both egg and milt fatty acid composition is affected by dietary vegetable oils
but without affecting reproductive performance (Corraze et al., 1993; Labbé et al., 1993,
1995).
In marine fish, partial substitution of fish oil by vegetable oils has been demonstrated in
gilthead sea bream or in European sea bass (Kalogeropoulos et al., 1992; Yildiz and Sener,
1997). However marine fish have a requirement for highly unsaturated fatty acids (HUFA)
which must be taken into consideration when vegetable oils are used in the diets. Turbot
require a dietary supply of 20:5 or 22:6n-3 fatty acids, since they cannot synthesize these fatty
acids from C18 precursors in significant amounts (Léger et al. 1979). Previous work has also
shown that the results of fish oil substitution in turbot depend on the n-3 content of the basal
diet used (Bell et al., 1994, 1999).
2
The aims of this study were (1) to evaluate growth performance, chemical composition
particularly fat and fatty acid composition and flesh quality of turbot fed diets in which fish
oil is replaced by soybean or linseed oil and (2) to evaluate the effects of a return to a diet
with fish oil on chemical composition and flesh quality. The flesh quality parameters will be
reported separately.
2. MATERIALS AND METHODS
2.1 Experimental diets
Three fish meal based isonitrogenous (digestible protein: 55% of dry matter) and isolipidic
(digestible fat: 16% of dry matter) diets were formulated containing 9% of fish oil (FO), 9%
of soybean oil (SO) or 9% of linseed oil (LO). Yttrium oxide (0.1%) was added as an
indicator for digestibility measurements. Diets were manufactured on an industrial scale by
Nutreco (Aquaculture Research Center, Stavanger, Norway), using a twin-screw extruder, in
the form of 9-mm diameter pellets. Ingredient and chemical composition of the diets are
reported in Table 1 and fatty acid (FA) composition in Table 2.
2.2 Digestibility measurements
Apparent digestibility coefficients (ADC) of the experimental diets were measured using the
indirect method. Digestibility and growth trials (described below) were conducted in the
experimental facilities of IFREMER (Centre de Brest, France) with identical groups of 25
turbot each. Turbot (Psetta maxima) obtained from a commercial farm were allotted to
cylindroconical tanks, each of which was equipped with a flat-bottom large-mesh basket and
supplied with sea water of constant temperature (17 ± 0.5°C) and with a salinity of 35‰ in a
flow-through system. Fish were fed to satiety once a day and faecal samples were collected
3

using a faeces-settling column. For each treatment, faecal samples were collected once a day
each morning over 2 weeks and were centrifuged (3000 × g at 6°C for 20min) and frozen
daily at –20°C. After freeze-drying, faeces were analysed for yttrium oxide, crude protein,
crude fat and gross energy. The ADC of the experimental diets was calculated as follows:
ADC (%) = 100 - % Tracer in Diet% Tracer in Faeces
% Nutrient or Energy in Faeces% Nutrient or Energy in Diet
100 ×⎛⎝⎜
⎞⎠⎟
2.3 Growth trial
The growth trial was conducted in the same experimental facilities as the digestibility trial for
a period of 13 weeks. Twenty-five turbot from the same source having a mean initial body
weight of 579 ± 1 g (mean ± sd) were randomly allotted to each tank (1000 l; flow rate of 14
l.mn-1). A 12/12h light/dark cycle was adopted. The three experimental diets were randomly
allotted and triplicate groups were fed by hand once a day to visual satiety (visual observation
of first feed refusal) over a 90 min period and feed intake was recorded. Each group was
weighed every three weeks to follow growth and feed utilisation.
2.4 Washout with fish oil
At the end of growth trial, 13 fish were withdrawn for analyses described below, and all the
three groups were fed with a FO diet for a subsequent 8 weeks, which corresponded to 952
degree days. At the end of this period each group of fish was weighed and sampled.
2.5 Samplings
At the beginning of the growth trial, five fish from an initial pool of fish were sampled and
stored at -20°C for analyses of whole body composition. At the end of the growth trial, the
same protocol of slaughter was followed for each tank. Fish were fasted two days before
4
slaughter. Fish were stunned, bled in cold water before dissection. Four fish per tank were
removed for comparative carcass analyses (water, ash, protein, fat and energy) and nutrient
retention calculation. Nine fish per tank were removed to weigh the liver and the digestive
tract for calculation of hepatosomatic index (HSI) and viscerosomatic index (VSI). Two fish
per tank were removed for lipid and fatty acid analyses in liver and muscle (dorsal and ventral
fillets without skin). Six livers were withdrawn from fish for analyses of enzyme activities
(glucose-6-phosphate dehydrogenase, acetyl Co-enzyme A carboxylase, fatty acid synthetase
and malic enzyme). At the end of the washout period, livers from six fish per tank were
removed for calculation of HSI and two fish from each tank for lipid and FA analyses of the
liver and muscle (dorsal and ventral fillets without skin).
2.6 Analytical methods
The fish for whole body composition were ground frozen and a representative portion was
freeze-dried and homogenised before analysis. Composition analyses of diets, faeces and
chemical composition of whole body and tissues were made following standard methods
(AOAC, 1984) : dry matter after desiccation in an oven (105°C for 24h), ash (incineration at
550°C for 12h), crude protein (Dumas, Nitrogen Analyser, Fison instrument, N × 6.25), crude
fat (dichloromethane extraction by Soxlhet method) and gross energy (IKA Adiabatic
Calorimeter C4000A).
For lipid analyses of liver and muscle, extraction was done according to Folch et al. (1957),
with chloroform being replaced by dichloromethane. The diets and faecal matter were pre-
digested in a solution containing 2% nitric acid and 2 g/L potassium chloride and yttrium was
determined with atomic absorption spectrophotometry (Varian, AA-20, wavelength 410 nm)
using a nitrous oxide-acetylene flame.
5
The separation of neutral lipids and phospholipids was performed according to the procedure
described by Juaneda and Rocquelin (1985). The total lipid extracts were fractionated on
silica cartridges (Sep-Pack, Waters), neutral lipids were eluted by chloroform and
phospholipids by methanol. Fatty acids methyl esters (FAME) were prepared following the
method of Morrison and Smith (1964) and separated by gas chromatography (Auto-system
Perkin-Elmer with a flame ionisation detector, BPX 70 capillary column: 25 m x 0.22 mm i.d.
x 0.25 μm d.f.; split-splitless injector, with helium as carrier gas). The injector and detector
temperatures were, respectively, 220°C and 260°C. Initial temperature of the oven was 50°C
which increased to 180°C by increments of 15°C/min, maintained for 5 min, then increased to
220°C by increments of 3°C/min. Data acquisition and handling were carried out by
connecting the GLC to a PE Nelson computer. The individual fatty acid methyl esters were
identified by comparing the retention times of authentic standard mixtures. The results of
individual FA composition were expressed as percent of total identified FA methyl esters.
For assays of hepatic lipogenic enzyme activities, liver samples were homogenised in three
volumes of ice-cold buffer (0.02M Tris-HCl, 0.25M sucrose, 2mM EDTA, 0.1M sodium
fluoride, 0.5mM phenyl methyl sulphonyl fluoride, 0.01M β-mercaptoethanol, pH 7.4) and
the homogenates were centrifuged at 20 000 × g at 4°C for 20 min. Soluble protein content of
liver homogenates was determined by the method of Bradford (1976) using bovine serum
albumin as the standard. Selected lipogenic enzyme activities were assayed on supernatant
fractions: glucose-6-phosphate dehydrogenase (G6PD; EC 1.1.1.49) according to Bautista et
al. (1988), malic enzyme (ME; EC 1.1.1.40) according to Ochoa (1955), fatty acid synthetase
(FAS, EC 2.3.1.38) according to Chang et al. (1967) and acetyl Coenzyme-A carboxylase
(ACoAC; EC 6.4.1.2) as per Holland et al. (1984). Enzyme activity units (IU) defined as
6
µmol substrate converted to product per min at assay temperature (30°C), were expressed as
units per mg hepatic soluble protein and per g liver tissue (wet weight).
2.7. Statistical analysis
All data were subjected to one-way analysis of variance to test the effects of experimental
diets. In cases where significant differences occurred (significance level =0.05), the Newman-
Keuls test was used to compare means. All statistical tests were performed using the STAT-
ITCF (Service des études statistiques, Paris, France) software. Principal component analysis
of fatty acid profiles was made using S-Plus software with a specific module.
3. RESULTS
3.1 Growth trial
Apparent digestibility coefficients (ADC %) of protein and fat were very high. The ADC of
dry matter was not affected by dietary lipid source. ADC of protein was around 96% and that
of energy near 90% for the different treatments. ADC of fat varied from 95.8% for the LO
diet to 98.2% for the SO diet, but no significant difference was observed. Growth
performance of turbot was high for fish of this size (initial body weight : 579 g). A significant
difference was observed in final body weights and growth rates: turbot fed diets SO and LO
had final body weights of 912 ± 2 g and 918 ± 4 g, lower than those of turbot fed the FO diet
(956 ± 4 g). However no significant differences were observed in feed efficiency (wet weight
gain / dry matter intake) which was 1.17 ± 0.02 or in protein efficiency ratio (wet weight gain
/ crude protein intake) which was 2.04 ± 0.02 in the three groups.
7
Moisture, ash, protein and fat contents of whole body were also not statistically different
among treatments (Table 3). Consequently, protein and energy retention (% of intake) which
were very high, were not influenced by dietary treatments (P > 0.05). HSI and VSI did not
vary significantly among treatments, viscera only representing between 2.5 to 2.6 % of body
weight.
No significant difference was observed between dietary treatments on moisture or lipid
contents of liver, ventral and dorsal muscles (Table 4). Liver lipid content was high and
varied from 18.8 to 22.6%. Muscle protein content was high at around 20%. Total lipid
content was low in the muscle, ventral muscle being fatter than dorsal muscle, but represented
only 2%. Phospholipids were constant (0.6%) in both muscles.
Within the same treatment, there was no difference between dorsal and ventral muscle FA
composition of neutral lipids or phospholipids. Hence, only the FA profiles of dorsal muscle
are presented here. FA composition of liver and muscle were clearly influenced by the FA
composition of the diets (Tables 5 and 6). In liver and muscle, concentrations of saturated,
monounsaturated FA (particularly 22:1n-11) as well as 20:5 and 22:6n-3 fatty acids were
significantly higher in fish fed the FO diet than in the other groups. Liver and muscle of fish
fed the SO diet were rich in 18:2n-6 and those of fish fed the LO diet were rich in 18:3n-3. In
the liver, the quantity of 20:2n-6 was significantly higher in fish fed the SO diet than in the
other groups and the quantity of 20:3n-3 was significantly higher in fish fed the LO diet than
in the other groups. FA composition of phospholipids were less influenced by dietary FA that
of neutral lipids and the concentrations of 20:5n-3 and 22:6n-3 were also higher in
phospholipids than in neutral lipids.
8
Data on the activities of the lipogenic enzymes assayed in turbot liver are reported in Table 7.
ACoAC, FAS and the two NADPH-generating dehydrogenases, G6PD and ME had low
activities and were not affected by dietary treatments (P > 0.05). Turbot fed the LO diet had
slightly lower G6PD activity than other groups, but there were no statistically significant
differences among treatments.
3.2 Finishing trial
After transfer to FO diets over 8 weeks, the growth performance was similar in all groups
(P>0.05). Although there was a significant difference in initial body weight at the beginning
of the second part (fish fed vegetable oils presented lower weights), no significant difference
was observed in final body weight, the values being 1259 ± 54 g for FO group, 1159 ± 39 g
for turbot fed previously SO diet and 1172 ± 42 g for those fed previously LO diet. The
growth rates were similar to that of the FO group during the previous growth trial. Feed
efficiency ratios (1.09 ± 0.06 to 1.17 ± 0.04) and protein efficiency ratios (1.90 ± 0.10 to 2.03
± 0.07) were not significantly different between treatments (P>0.05).
HSI values varied between 2.3 to 2.7% (Table 8). Although, fish previously fed the LO diet
had a significantly lower HSI than in the other groups, no significant difference was found in
liver lipid level. Dorsal and ventral muscle composition was also not statistically affected by
previous treatments, however protein level in dorsal muscle was higher in fish previously fed
LO than in the control FO group. Liver fatty acid composition showed few differences among
treatments (Table 9). No significant difference was observed for the sum of saturated fatty
acids, for 20:5n-3, and 22:6n-3. Fatty acid composition of dorsal muscle was reported in
Table 10. The FA compositions of dorsal and ventral muscles were similar. There were
9
always some differences in the fatty acid profiles among fish maintained on diet FO and those
previously fed diets with vegetable oils. This difference remained more marked in neutral
lipids than in phospholipids. In fish previously fed the SO diet, the levels of 18:2n-6 was
higher than in other groups. Likewise, 18:3n-3 was higher in fish previously fed the LO diet
than in the other groups. There were no significant differences among groups in the levels of
18:3n-6, 20:3n-6, 20:4n-6 and 18:4n-3 in either neutral or polar lipids.
The changes that occurred in the muscle neutral and polar lipid profiles before and after the
wash out period are depicted in Fig. 1. The polar lipid FA profile is distinct from that of the
neutral lipid fraction in all groups, reflecting the high levels of n-3 fatty acids in this fraction.
4. DISCUSSION
Due to the marine fish oil and phospholipids contained in the fish meal itself, the SO and LO
diets contained respectively 3.7 and 3.6% of EPA (eicosapentaenoic acid, 20:5n-3) and 5.6
and 5.5% of DHA (docosahexaenoic acid, 22:6n-3) supplying about 1.3% HUFA on a dry
matter basis. These amounts are sufficient to meet the EFA requirements of turbot, which is
estimated to be 0.8% (Gatesoupe et al., 1977), or even less (0.6%; Léger et al., 1979). The
digestibility of the nutrients and of energy was not affected by dietary lipid source and no
mortality of turbot was observed. The growth performance of turbot, although high, was
affected by dietary lipid sources, i.e. turbot fed diets with vegetable oils had lower growth
than those fed the fish oil based diet. Although theoretically, the supply of n-3 HUFA was
sufficient, it is possible that the supply of arachidonic acid also considered to be an EFA for
turbot (Castell et al., 1994; Sargent et al., 1999), was insufficient. In our study, 20:4n-6 was
supplied in low amounts, in the experimental diets both by fish meal and fish oil while linseed
10
oil as well as soybean oil were deficient in this fatty acid; these two latter oils contain 18:2n-6
(linoleic acid), which is not an available precursor for marine fish having negligible ability for
desaturation and elongation (Bell et al., 1986).
In the present study, growth rate of turbot was high and superior to our own earlier data
(Regost et al., 2001) on turbot of similar size with the same dietary lipid level at 17°C but
inferior to those reported by Devesa (1994) on turbot of 500-1000 g grown at higher
temperatures. Feed efficiency and protein efficiency ratio were not affected by dietary
treatment. Our data showed clearly that it is possible to replace fish oil by vegetable oil in
diets for turbot, considering the relatively low influence observed on growth. Bell et al.
(1994) found also no negative effect on growth of juvenile turbot fed a diet with linseed oil.
However, with a purified diet containing 19% of linseed oil with no added n-3 and n-6
HUFAs, Bell et al. (1999) obtained a reduction in growth rate of juvenile turbot and an
increase of mortality. For salmonids, fish oil can be replaced by soybean oil (Reinitz and Yu,
1981; Hardy et al., 1987; Greene and Selivonchick, 1990; Guillou et al., 1995) and linseed oil
(Mugrditchian et al., 1981; Greene and Selivonchick, 1990), as salmonids are known to
possess functional fatty acid desaturases (Bell et al., 1997; Seiliez et al., 2001).
No effect of dietary lipid source was observed in whole body or tissue composition of turbot,
as reported for other fish (Hardy et al., 1987; Greene and Selivonchick, 1990; Arzel et al.,
1994; Dosanjh et al., 1998). The high lipid content of liver is in accordance with Bell et al.
(1999) who showed that turbot had the ability to store large amounts of lipid in the liver like
other flatfish (Norvedt and Tuene, 1998). On the other hand, muscle lipid content of turbot
was low (between 1 to 2%), confirming earlier reports (Sérot et al., 1998; Regost et al., 2001).
11
In conformity with data for other fish (Reinitz and Yu, 1981, Polvi and Ackman, 1992; Arzel
et al., 1994; Bell et al., 1995; Guillou et al., 1995), the fatty acid composition of liver and
muscle reflected the FA composition of the diets. The effect of dietary oils was very marked
in the liver with 18:2n-6 representing 28% of FA in fish fed diet the soybean oil diet and
18:3n-3 representing 21% of FA in fish fed the linseed oil based diet. In the white muscle, this
effect was more pronounced in the neutral lipid fraction than in the polar lipids as generally
found in other species (Lie et al., 1986). As phospholipids are the essential component of
membranes, the polar lipid FA profile is generally more constant than that of the neutral
lipids, which is the fat storage form (Sargent et al., 1989). However, the FA composition of
tissues did not exactly reflect the FA profile of diets. The relationship between the
polyunsaturated fatty acid (PUFA) levels in the tissues and diets was most likely dependent
upon the relative essentiality of the specific FA (Skonberg et al., 1994). Turbot maintained a
high proportion of n-3, especially EPA and DHA, particularly in polar lipids, generally richer
in PUFA than neutral lipids (Henderson and Tocher, 1987). Polar lipids also had more than
2% of 20:4 n-6, slightly but significantly higher in the FO group than in the SO and LO
groups. The latter diets were deficient in 20:4n-6, an important precursor of physiological
mediators like prostaglandins and leukotrienes (Bell et al., 1986).
In the present study, an elongation of 18:2n-6 to 20:2n-6 for fish fed SO diet was observed in
turbot, particularly in the liver. But the intermediates of 20:4n-6 synthesis, 18:3n-6 and 20:3n-
6 remained at very low levels in all groups. For fish fed LO diet, 18:3n-3 was elongated to
20:3n-3 and a slight elongation of 18:2n-6 to 20:2n-6 was observed. Intermediates of n-3
desaturation and elongation process could be observed in both liver and muscle: more of
18:4n-3 and 20:4n-3 were encountered in turbot fed FO diet than in those fed vegetable oil
diets. Their relative presence seems dependent of the level of 18:4n-3 in the diets, rather than
12
that of 18:3n-3. In fact, turbot, as other marine fish, are known to have a very limited capacity
to synthesize HUFA from C18 precursors (Owen et al., 1975; Cowey et al., 1976).
Desaturases are known to have a better affinity for n-3 FA than for n-6 FA in turbot as in
mammals (Tocher, 1993). Our data confirm the observations of Bell et al. (1994) that turbot
can elongate C18 to C20 fatty acids in vivo; in vitro, Ghioni et al. (1999) found a limited
elongase activity in turbot cell lines. In turbot, a predominance of elongation over that of
desaturation of FA and especially the deficiency of Δ5-desaturase was also observed by Bell
et al. (1995) and Tocher (1993). Our data confirm that turbot are unable to convert linolenic
acid to EPA and DHA (Bell et al., 1999) possibly due to a deficiency of Δ5-desaturase and
“Δ4-like”-desaturase (Castell et al., 1994), with no sign of Δ6 desaturation.
Hepatic lipogenic enzyme activities in turbot were low as previously reported (Regost et al.,
2001). The activities of G6PD and ME were similar than those found in the earlier study. But
ACoAC activity levels in the present study were nearly three times lower than those observed
earlier (Regost et al., 2001). No effect of dietary lipid source was observed in hepatic
lipogenic enzyme activities. To our knowledge, no study has reported the influence of
vegetable oils on lipogenesis in marine fish. According to Shikata and Shimeno (1994), high
levels of EPA and DHA tend to inhibit hepatic lipogenic activities. Recently, Alvarez et al.
(2000) showed in vitro that the inclusion of EPA and DHA in diets induced a reduction of
lipogenic enzyme activities in hepatocytes of rainbow trout.
During the washout period, all turbot were fed the same diet, i.e. FO diet for two months and
all groups had comparable growth rates. The increase in HSI in all groups at the end of the
finishing trial can be related to an increase in liver fat content during the washout period.
Although differences in FA profiles among groups was still present, a decrease in 18:2n-6 and
13
18:3n-3 in the liver and muscle was observed. These reductions were more apparent in the
liver (64% for 18:2n-6 and 73% for 18:3n-3) than in the muscle (around 40% for 18:2n-6 and
18:3n-3 in neutral lipids and 50% for 18:3n-3 in phospholipids). Change to a fish-oil based
(FO) diet definitely had a positive effect on both neutral and polar lipids, although they did
not reach those of fish fed continuously with fish oil based diets. The ratios of EPA and DHA
increased in fish previously fed vegetable oils. In liver, the EPA, DHA and 22:5n-3 values
were not significantly different among the various groups. In muscle phospholipids, DHA
value of fish fed previously the LO diet no longer differed from that of the FO control. The
apparent decrease in the ratios of EPA and DHA in liver of fish fed the FO diet during the two
periods could be explained by the relative increase of liver fat content during the latter period.
This led to an increase of saturated and monounsaturated FA at the expense of PUFA. The
fact that, after two months on the same diet, fish did not fully recover a similar FA profile
suggest that time required for adaptation of tissue compositions to a new diet must be longer
for turbot of this size. It is also possible that at the end of the three months of growth trial, fish
fed vegetable oils had probably not reached a stable FA composition relative to their dietary
inputs.
5. CONCLUSION
Three months on diets containing vegetable oils only had a slight effect on growth of turbot as
compared to that of a control group fed fish oil. Liver and muscle FA profiles of turbot clearly
reflected FA profile of the diets. A switch to a FO-containing diet led to similar growth in all
groups. As regards the fatty acid profiled of fish, even after 2 months, the influence of
previous diets were still present, although a marked decrease in 18:2n-6 and 18:3n-3 fatty
14
acids characterising the vegetable oils and a significant increase of EPA and DHA was
observed.
ACKNOWLEDGEMENTS
C. Regost is a recipient of a financial scholarship from Région Bretagne (France) and
IFREMER. The authors would like to express their gratitude to Hervé Le Delliou for his
technical assistance with the chemical composition analysis.
REFERENCES
Aksnes, A., Hjertnes, T., Opstvedt, J., 1996. Effect of dietary protein level on growth and
carcass composition in Atlantic halibut (Hippoglossus hippoglossus L.). Aquaculture
145, 225-233.
Alvarez, M.J., Diez, A., Lopez-Bote, C.J., Gallego, M., Bautista, J.M., 2000. Short-term
modulation of lipogenesis by macronutrients in rainbow trout (Oncorhynchus mykiss)
hepatocytes. Br. J. Nutr. 84, 619-628.
AOAC (Association of Official Analytical Chemists) 1984. Official Methods of Analysis.
12th edition, Association of Official Analytical Chemists, Washington DC, USA,
1141p.
Arzel, J., Martinez Lopez, F.X., Métailler, R., Stéphan, G., Viau, M., Gandemer, G.,
Guillaume, J., 1994. Effect of dietary lipid on growth performance and body
composition of brown trout (Salmo trutta) reared in seawater. Aquaculture 123, 361-
375.
Barlow, S. M., Pike, I.H., 2001. Aquaculture feed ingredients in year 2010: Fish meal and fish
oil. In (C.E. Nash, Julien, V., Eds). Aquavision '98. 2nd Nutreco Aquaculture Business
15
Conference, Stavanger, Norway, 13-15 May 1998, Nutreco Aquaculture, Stavanger,
Norway, pp. 71-74.
Bautista, J.M., Garrido-Pertierra, A., Soler, G., 1988. Glucose-6-phosphate dehydrogenase
from Dicentrarchus labrax liver: kinetic mechanism and kinetic of NADPH inhibition.
Biochim. Biophys. Acta. 967, 354-363.
Bell, J.G., Tocher, D.R., MacDonald, F.M., Sargent, J.R., 1994. Effects of diets rich in
linoleic (18:2n-6) and α-linonenic (18:3n-3) acids on growth, lipid class and fatty acid
compositions and eicosanoid production in juvenile turbot (Scophtalmus maximus L.).
Fish Physiol. Biochem. 13, 105-118.
Bell, J.G., Tocher, D.R., MacDonald, F.M., Sargent, J.R., 1995. Effects of dietary borage oil
[enriched in γ-linoleic acid, 18:3(n-6)] or marine fish oil [enriched in eicosapentaenoic
acid, 20:5(n-3)] on growth, mortalities, liver histopathology and lipid composition of
juvenile turbot (Scophtalmus maximus). Fish Physiol. Biochem. 14, 373-383.
Bell, J.G., Tocher, D.R., Farndale, B.M., Cox, D.I., McKinney, R.W., Sargent, J.R., 1997.
The effect of dietary lipid on polyunsaturated fatty acid metabolism in Atlantic salmon
(Salmo salar) undergoing parr-smolt transformation. Lipids 32, 515-525.
Bell, J.G., Tocher, D.R., Farndale, B.M., McVicar, A.H., Sargent, J.R., 1999. Effects of
essentiel fatty acid-deficient diets on growth, mortality, tissue histopathology and fatty
acid compositions in juvenile turbot (Scophtalmus maximus). Fish Physiol. Biochem.
20, 263-277.
Bell, M.V., Henderson, R.J., Sargent, J.R., 1986. The role of polyunsaturated fatty acids in
fish. Comp. Biochem. Physiol. 83B, 711-719.
Bradford, M.M., 1976. A rapid and sensitive method for the quantification of microgram
quantities of protein utilising the principle of protein-dye binding. Anal. Biochem. 72,
248-254.
16
Castell, J.D., Bell, J.G., Tocher, D.R., Sargent, J.R., 1994. Effects of purified diets containing
different combinations of arachidonic and docohexanoic acid on survival, growth and
fatty acid composition of juvenile turbot (Scophthalmus maximus). Aquaculture 128,
315-353.
Chang, H.C., Seidman, I., Teebor, G., Lane, D.H., 1967. Liver acetyl-CoA-carboxylase and
fatty acid synthetase relative activities in the normal stade and in hereditary obesity.
Biochim. Biophys. Res. Comm.28, 682-686.
Corraze, G., Larroquet, L., Maisse, G., Blanc, D., Kaushik, S.J., 1993. Effects of temperature
and of dietary lipid origin on female broodstock performance and fatty acid composition
of the eggs of rainbow trout. In: Kaushik, S.J., Luquet, P. (Eds), Fish Nutrition in
Practice, INRA, Paris, Les Colloques, 61: 61-66.
Cowey, C.B., Owen, J.M., Adron, J.W., Middleton, C., 1976. Studies on the nutrition of
marine flatfish. The effect of different dietary fatty acids on the growth and fatty acid
composition of turbot (Scophthalmus maximus). Br. J. Nutr. 36, 479-486.
Devesa, S., 1994. Nutrition and feeding of cultured turbot (Scophthalmus maximus L.). In:
Lavens, P., Remmerswaal, R.A.M. (Eds.), Turbot Culture: Problems and Prospects,
European Aquaculture Society, Special Publication n°22, Gent, Belgium, 12pp.
Dosanjh, B.S., Higgs, D.A., McKenzie, D.J., Randall, D.J., Eales, J.G., Rowshandeli, N.,
Rowshandeli, M., Deacon, G., 1998. Influence of dietary blends of menhaden oil and
canola oil on growth, muscle lipid composition and thyroidal status of Atlantic salmon
(Salmo salar) in sea water. Fish Physiol. Biochem. 19, 123-134.
Folch, J., Lees, M., Sloane-Stanley, G.H., 1957. A simple method for the isolation and
purification of total lipids from animal tissues. J. Biol. Chem. 226, 497-509.
17
Gatesoupe, F.J., Léger, C., Métailler, R., Luquet, P., 1977. Alimentation lipidique du turbot
(Scophtalmus maximus L.). I. Influence de la longueur de chaîne des acides gras de la
série w3. Ann. Hydrobiol. 8, 89-97.
Ghioni, C., Tocher, D.R., Bell, M.V., Dick, J.M., Sargent, J.R., 1999. Low C18 to C20 fatty
acid elongase activity and limited conversion of stearidonic acid, 18:4(n-3), to
eicosapentaenoic acid, 20:5(n-3), in a cell line from turbot, Scophthalmus maximus.
Biochim. Biophys. Acta 1437, 170-181.
Greene, D.H.S., Selivonchick, D.P., 1990. Effects of dietary vegetable, animal and marine
lipids on muscle lipid and hematology of rainbow trout (Oncorhynchus mykiss).
Aquaculture 89, 165-182.
Guillou, A., Soucy, P., Khalil, M., Adambounou, L., 1995. Effects of dietary vegetable and
marine lipid on growth, muscle fatty acid composition and organoleptic quality of flesh
of brook charr (Salvelinus fontinalis). Aquaculture 136, 351-362.
Hardy, R.W., Scott, T.M., Harrell, L.W., 1987. Replacement of herring oil with menhaden oil,
soybean oil, or tallow in the diets of Atlantic salmon raised in marine net-pens.
Aquaculture 65, 267-277.
Henderson, R.J., Tocher, D.R., 1987. The lipid composition and biochemistry of freshwater
fish. Prog. Lipid Res. 26, 281-347.
Holland, R., Witters, L.A., Hardie, D.G., 1984. Glucagon inhibits fatty acid synthesis in
isolated hepatocytes via phosphorylation of acetyl CoA carboxylase by cyclic AMP-
dependent protein kinase. Eur. J. Biochem. 140, 325-333.
Juaneda, P., Rocquelin, G., 1985. Rapid and convenient separation of phospholipids and non-
phosphorus lipids from rat heart using silica cartridges. Lipids 20, 40-41.
18
Kalogeropoulos, N. Alexis, M. N., Henderson, R. J., 1992. Effects of dietary soybean and cod
liver oil levels on growth and body composition of gilthead bream (Sparus aurata).
Aquaculture 104,293-308.
Labbé, C., Loir, M., Maisse, G., Kaushik, S.J., 1993. Influence of temperature and dietary
lipid origin on fatty acid composition of spermatozoan plasma membrane phospholipids
in rainbow trout: Effect on sperm cryopreservation tolerance. In: Kaushik, S.J., Luquet,
P. (Eds), Fish Nutrition in Practice, INRA, Paris, Les Colloques, 61: 49-59.
Labbé, C., Maisse, G., Müller, K., Zachowski, A., Kaushik, S., Loir M., 1995. Thermal
acclimation in rainbow trout combined with a diet enriched in (n-3) or (n-6) fatty acids
affects the lipid composition of spermatozoa plasma membrane but not its fluidity.
Lipids 30, 23-33.
Léger, C., Gatesoupe, F.J., Metailler, R., Luquet, P., Fremont, L., 1979. Effect of dietary fatty
acids differing by chain lenghts and ω series on the growth and lipid composition of
turbot Scophthalmus maximus L. Comp. Biochem. Physiol. 64B, 345-350.
Lie, Ø., Lied, E., Lambertsen, G., 1986. Liver retention of fat and of fatty acids in cod (Gadus
morhua) fed different oils. Aquaculture 59, 187-196.
Morrison, W.R., Smith, L.M., 1964. Preparation of fatty acid methyl esters and
dimethylacetals from lipids with boron fluoride-methanol. J. Lipid Res. 5, 600-608.
Mugrditchian, D.S., Hardy, R.W., Iwaoka, W.T., 1981. Linseed oil and animal fat as
alternative lipid sources in dry diets for chinook salmon (Oncorhynchus tshawytscha).
Aquaculture 25, 161-172.
National Research Council (NRC), 1993. Nutrient Requirements of Fish. National Academy
Press, Washington, DC, 114 pp.
19
Nortvedt, R., Tuene, S., 1998. Body composition and sensory assessment of three weight
groups of Atlantic halibut (Hippoglossus hippoglossus) fed three pellet sizes and three
dietary fat levels. Aquaculture 161, 295-313.
Ochoa, S., 1955. Malic enzyme. In: Collowick, S.P., Kaplan, N.O. (Eds), Methods in
Enzymology. Vol. 1. Academic Press, New York, pp 739-753.
Owen, J.M., Adron, J.W., Middleton, C., Cowey, C.B., 1975. Elongation and desaturation of
dietary fatty acids in turbot Scophtalmus maximus L., and rainbow trout, Salmo
gairdnerii Rich. Lipids 10, 528-531.
Polvi, S.M., Ackman, R.G., 1992. Atlantic salmon (Salmo salar) muscle lipids and their
response to alternative dietary fatty acid sources. J. Agric. Food Chem. 40, 1001-1007.
Regost, C., Arzel, J., Cardinal, M., Robin, J., Laroche, M., Kaushik, S.J., 2001. Dietary lipid
level, hepatic lipogenesis and flesh quality in turbot (Psetta maxima). Aquaculture 193,
291-309.
Reinitz, G.L., Yu, T.C., 1981. Effects of dietary lipids on growth and fatty acid composition
of rainbow trout (Salmo gairdneri). Aquaculture 35,19-27.
Sargent, J., Henderson, R.J., Tocher, D.R., 1989. The lipids. In: Halver J.E. (Ed.), Fish
Nutrition, Academic Press, Inc., New York, USA. pp. 153-218.
Sargent, J., Bell, G., McEvoy, L., Tocher, D., Estevez, A., 1999. Recent developments in the
essential fatty acid nutrition of fish. Aquaculture 177, 191-199.
Seiliez I, Panserat S, Kaushik S, Bergot P., 2001. Cloning, tissue distribution and nutritional
regulation of a Δ6-desaturase-like in rainbow trout. Comp. Biochem. Physiol. 130B, 83-
93.
Sérot, T., Gandemer, G., Demaimay, M., 1998. Lipid and fatty acid compositions of muscle
from farmed and wild adult turbot. Aquacult. Int. 6, 331-343.
20
Shikata, T., Shimeno, S., 1994. Metabolic response to dietary stearic acid, linoleic acid, and
highly unsaturated fatty acid in carp. Fisheries Sci. 60, 735-739.
Skonberg, D.I., Rasco, B.A., Dong, F.M., 1994. Fatty acid composition of salmonid muscle
changes in response to a high oleic acid diet. J. Nutr. 124, 1628-1638.
Thomassen, M.S., Røsjø, C., 1989. Different fats in feed for salmon: influence on sensory
parameters, growth rate and fatty acids in muscle and heart. Aquaculture 79, 129-135.
Tocher, D.R., 1993. Elongation predominates over desaturation in the metabolism of 18:3 n-3
and 20:5 n-3 in turbot (Scophtalmus maximus) brain astroglial cells in primary culture.
Lipids 28, 267-272
Yildiz, M., Sener, E., 1997. Effect of dietary supplementation with soybean oil, sunflower oil
or fish oil on the growth of seabass (Dicentrarchus labrax L.). Workshop of the
CIHEAM Network on Technology of Aquaculture in the Mediterranean, 24-26 June
1996, Zaragoza, Spain, 9 pp.
21
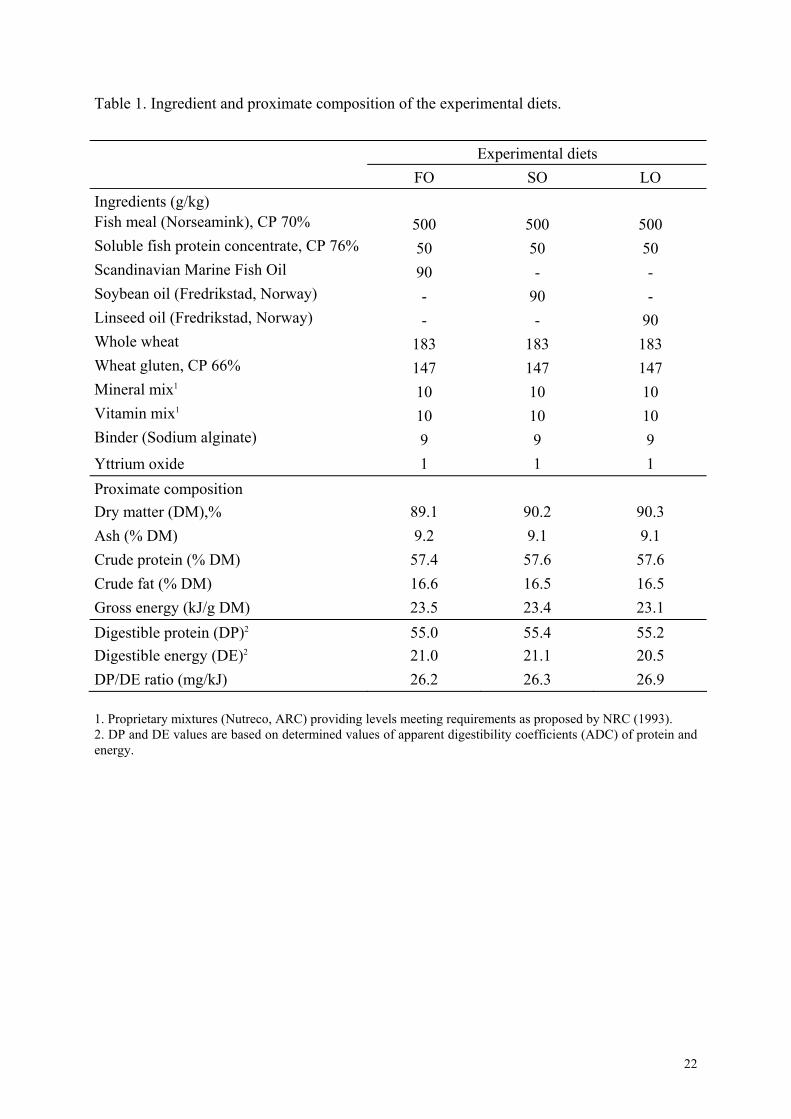
Table 1. Ingredient and proximate composition of the experimental diets.
Experimental diets FO SO LO Ingredients (g/kg) Fish meal (Norseamink), CP 70% 500 500 500 Soluble fish protein concentrate, CP 76% 50 50 50 Scandinavian Marine Fish Oil 90 - - Soybean oil (Fredrikstad, Norway) - 90 - Linseed oil (Fredrikstad, Norway) - - 90 Whole wheat 183 183 183 Wheat gluten, CP 66% 147 147 147 Mineral mix1 10 10 10 Vitamin mix1 10 10 10 Binder (Sodium alginate) 9 9 9 Yttrium oxide 1 1 1 Proximate composition Dry matter (DM),% 89.1 90.2 90.3 Ash (% DM) 9.2 9.1 9.1 Crude protein (% DM) 57.4 57.6 57.6 Crude fat (% DM) 16.6 16.5 16.5 Gross energy (kJ/g DM) 23.5 23.4 23.1 Digestible protein (DP) 55.0 55.4 55.2 2
Digestible energy (DE) 21.0 21.1 20.5 2
DP/DE ratio (mg/kJ) 26.2 26.3 26.9 1. Proprietary mixtures (Nutreco, ARC) providing levels meeting requirements as proposed by NRC (1993). 2. DP and DE values are based on determined values of apparent digestibility coefficients (ADC) of protein and energy.
22
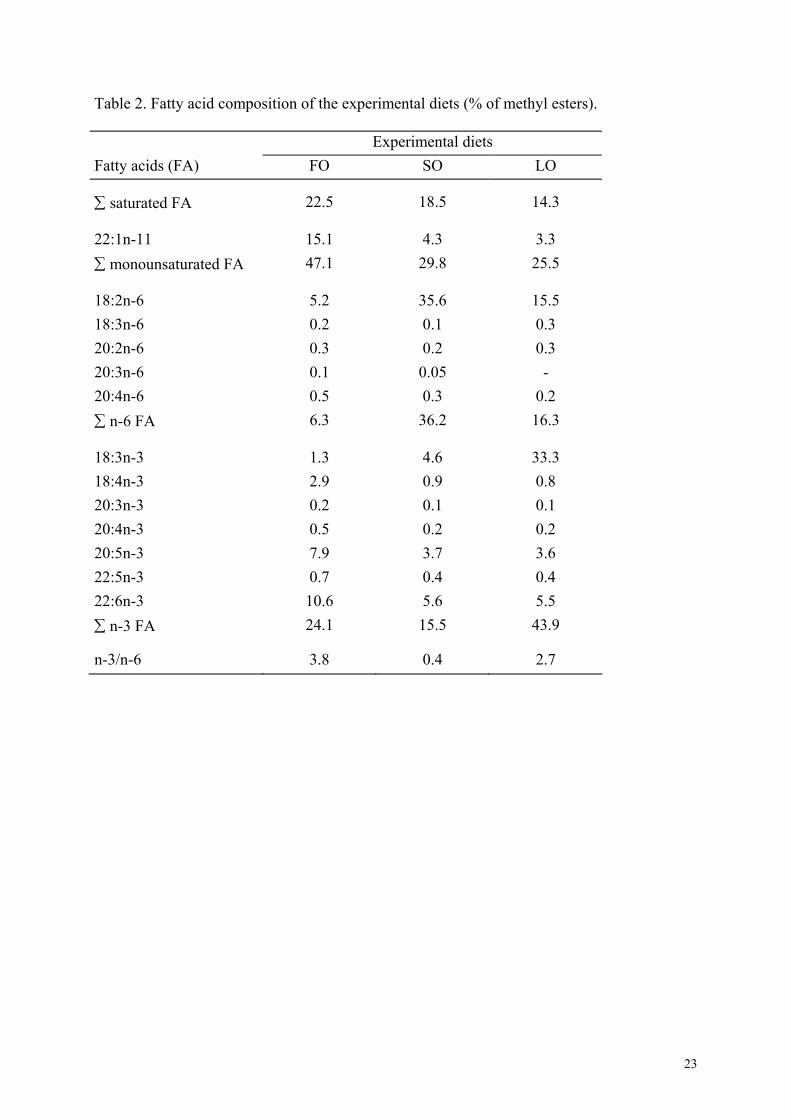
Table 2. Fatty acid composition of the experimental diets (% of methyl esters). Experimental diets Fatty acids (FA) FO SO LO
22.5 18.5 14.3 ∑ saturated FA
22:1n-11 15.1 4.3 3.3 47.1 29.8 25.5 ∑ monounsaturated FA
18:2n-6 5.2 35.6 15.5 18:3n-6 0.2 0.1 0.3 20:2n-6 0.3 0.2 0.3 20:3n-6 0.1 0.05 - 20:4n-6 0.5 0.3 0.2
6.3 36.2 16.3 ∑ n-6 FA
18:3n-3 1.3 4.6 33.3 18:4n-3 2.9 0.9 0.8 20:3n-3 0.2 0.1 0.1 20:4n-3 0.5 0.2 0.2 20:5n-3 7.9 3.7 3.6 22:5n-3 0.7 0.4 0.4 22:6n-3 10.6 5.6 5.5
24.1 15.5 43.9 ∑ n-3 FA
n-3/n-6 3.8 0.4 2.7
23
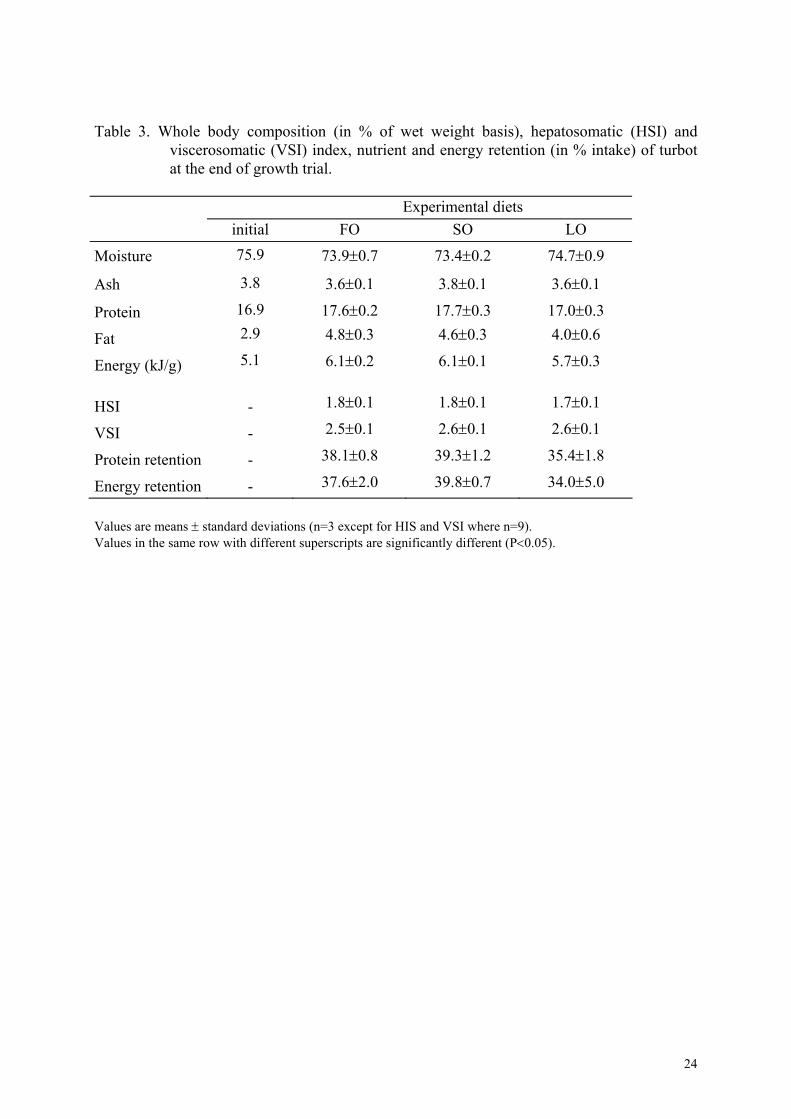
Table 3. Whole body composition (in % of wet weight basis), hepatosomatic (HSI) and viscerosomatic (VSI) index, nutrient and energy retention (in % intake) of turbot at the end of growth trial.
Experimental diets initial FO SO LO
75.9 73.9±0.7 73.4±0.2 74.7±0.9 Moisture
3.8 3.6±0.1 3.8±0.1 3.6±0.1 Ash 16.9 17.6±0.2 17.7±0.3 17.0±0.3 Protein 2.9 4.8±0.3 4.6±0.3 4.0±0.6 Fat 5.1 6.1±0.2 6.1±0.1 5.7±0.3 Energy (kJ/g)
HSI - 1.8±0.1 1.8±0.1 1.7±0.1
VSI - 2.5±0.1 2.6±0.1 2.6±0.1
38.1±0.8 39.3±1.2 35.4±1.8 Protein retention - 37.6±2.0 39.8±0.7 34.0±5.0 Energy retention -
Values are means ± standard deviations (n=3 except for HIS and VSI where n=9). Values in the same row with different superscripts are significantly different (P<0.05).
24
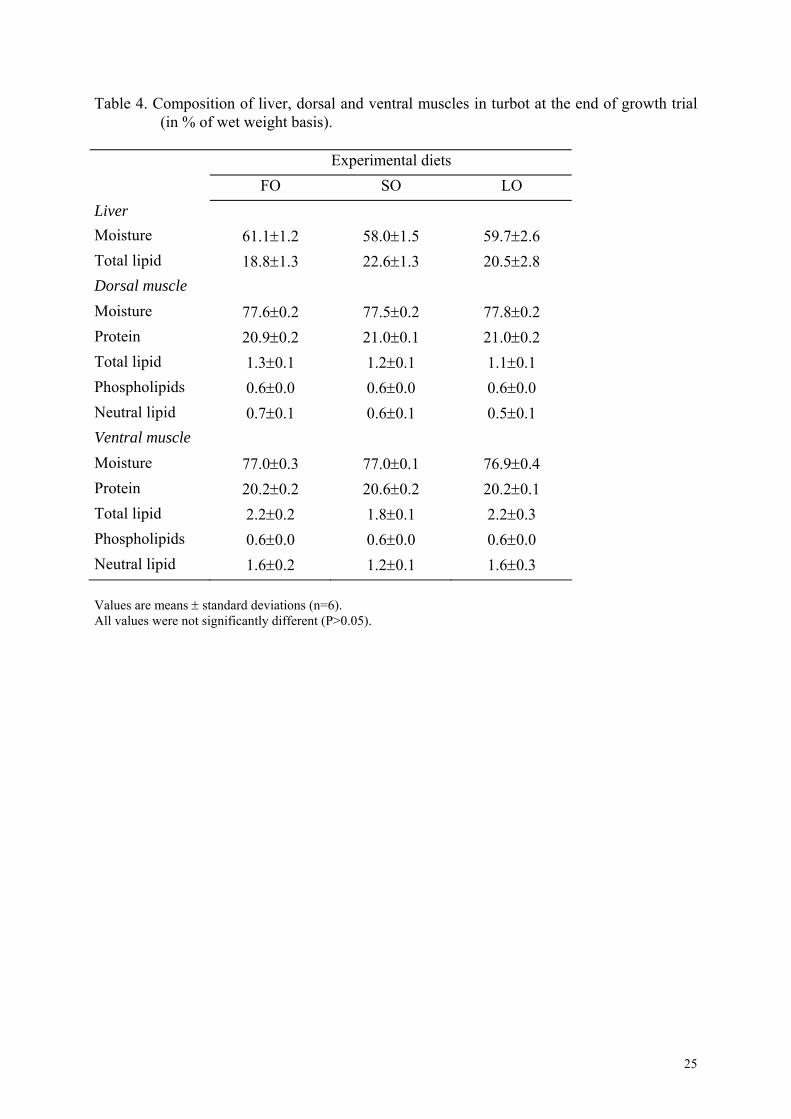
Table 4. Composition of liver, dorsal and ventral muscles in turbot at the end of growth trial (in % of wet weight basis).
Experimental diets FO SO LO Liver Moisture 61.1±1.2 58.0±1.5 59.7±2.6 Total lipid 18.8±1.3 22.6±1.3 20.5±2.8 Dorsal muscle Moisture 77.6±0.2 77.5±0.2 77.8±0.2 Protein 20.9±0.2 21.0±0.1 21.0±0.2 Total lipid 1.3±0.1 1.2±0.1 1.1±0.1 Phospholipids 0.6±0.0 0.6±0.0 0.6±0.0 Neutral lipid 0.7±0.1 0.6±0.1 0.5±0.1 Ventral muscle Moisture 77.0±0.3 77.0±0.1 76.9±0.4 Protein 20.2±0.2 20.6±0.2 20.2±0.1 Total lipid 2.2±0.2 1.8±0.1 2.2±0.3 Phospholipids 0.6±0.0 0.6±0.0 0.6±0.0 Neutral lipid 1.6±0.2 1.2±0.1 1.6±0.3 Values are means ± standard deviations (n=6). All values were not significantly different (P>0.05).
25
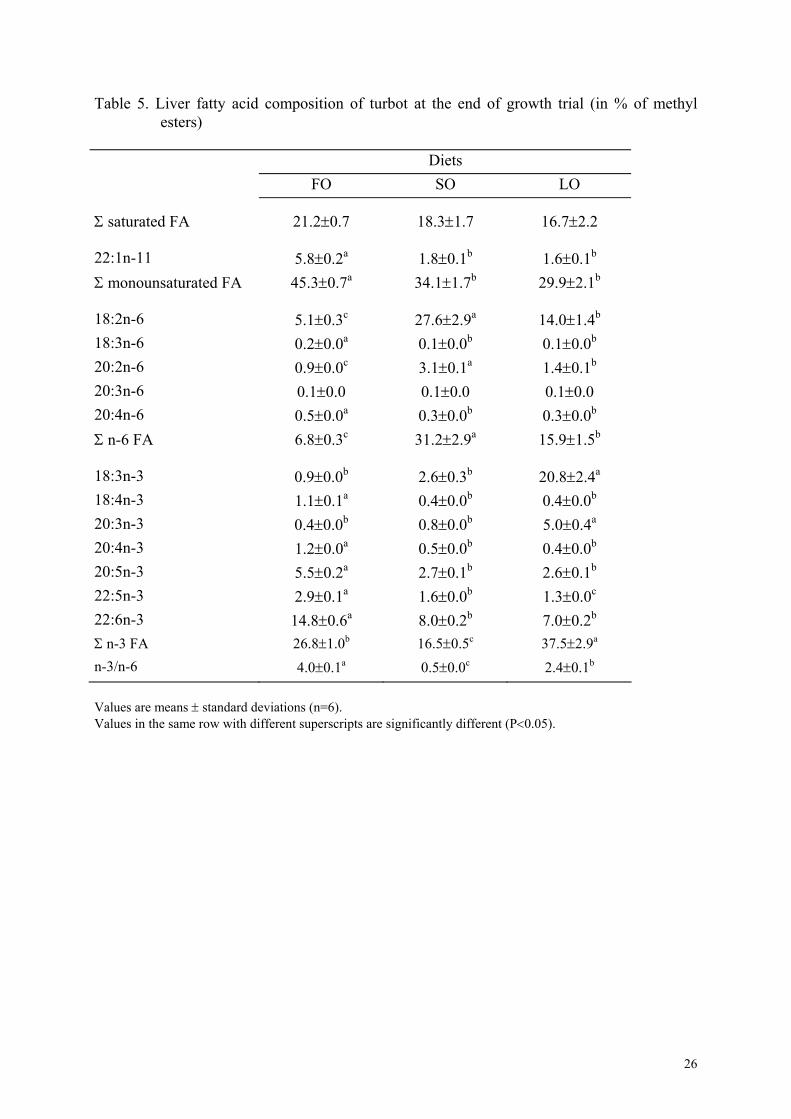
Table 5. Liver fatty acid composition of turbot at the end of growth trial (in % of methyl esters)
Diets FO SO LO
Σ saturated FA 21.2±0.7 18.3±1.7 16.7±2.2
22:1n-11 5.8±0.2a 1.8±0.1b 1.6±0.1b
Σ monounsaturated FA 45.3±0.7a 34.1±1.7b 29.9±2.1b
18:2n-6 5.1±0.3c 27.6±2.9a 14.0±1.4b
18:3n-6 0.2±0.0a 0.1±0.0b 0.1±0.0b
20:2n-6 0.9±0.0c 3.1±0.1a 1.4±0.1b
20:3n-6 0.1±0.0 0.1±0.0 0.1±0.0 20:4n-6 0.5±0.0a 0.3±0.0b 0.3±0.0b
Σ n-6 FA 6.8±0.3c 31.2±2.9a 15.9±1.5b
18:3n-3 0.9±0.0b 2.6±0.3b 20.8±2.4a
18:4n-3 1.1±0.1a 0.4±0.0b 0.4±0.0b
20:3n-3 0.4±0.0b 0.8±0.0b 5.0±0.4a
20:4n-3 1.2±0.0a 0.5±0.0b 0.4±0.0b
20:5n-3 5.5±0.2a 2.7±0.1b 2.6±0.1b
22:5n-3 2.9±0.1a 1.6±0.0b 1.3±0.0c
22:6n-3 14.8±0.6a 8.0±0.2b 7.0±0.2b
b c aΣ n-3 FA 26.8±1.0 16.5±0.5 37.5±2.9a c bn-3/n-6 4.0±0.1 0.5±0.0 2.4±0.1
Values are means ± standard deviations (n=6). Values in the same row with different superscripts are significantly different (P<0.05).
26
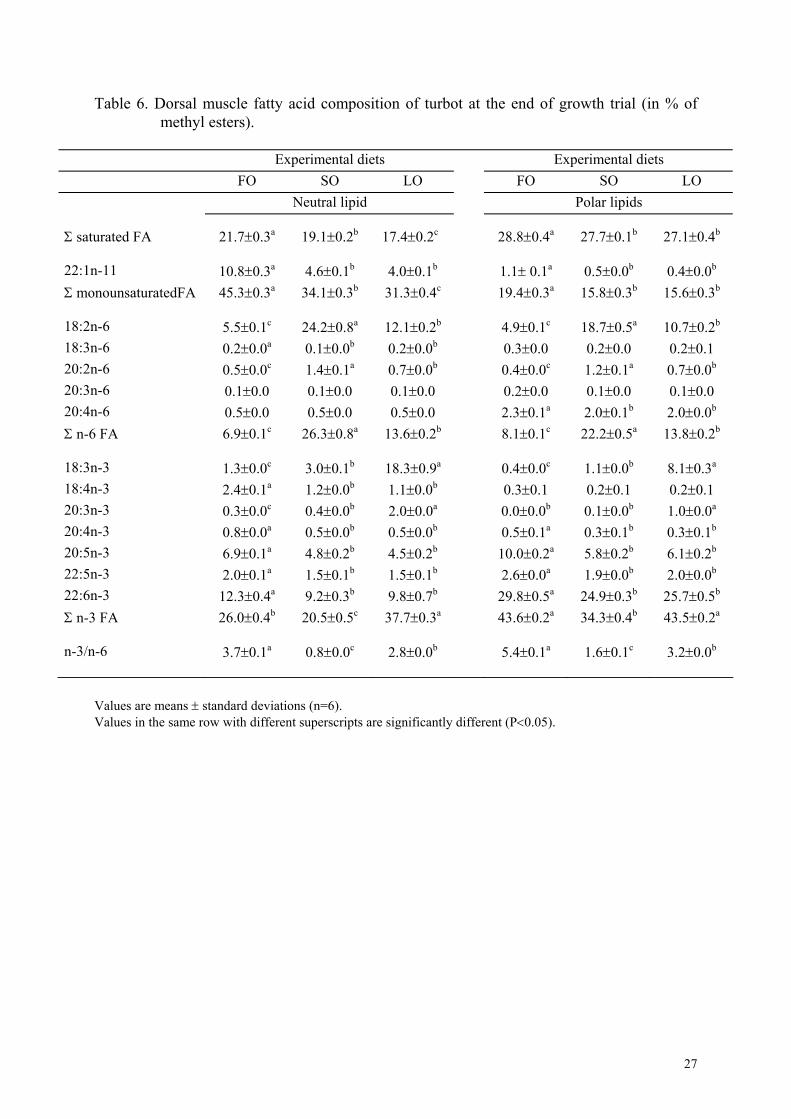
Table 6. Dorsal muscle fatty acid composition of turbot at the end of growth trial (in % of methyl esters).
Experimental diets Experimental diets
FO SO LO FO SO LO
Neutral lipid Polar lipids
a b c a b b 28.8±0.4Σ saturated FA 21.7±0.3 19.1±0.2 17.4±0.2 27.7±0.1 27.1±0.4
a b b a b b22:1n-11 10.8±0.3 1.1± 0.14.6±0.1 4.0±0.1 0.5±0.0 0.4±0.0a b c a b b 19.4±0.3Σ monounsaturatedFA 45.3±0.3 34.1±0.3 31.3±0.4 15.8±0.3 15.6±0.3
c a b c a b18:2n-6 5.5±0.1 4.9±0.124.2±0.8 12.1±0.2 18.7±0.5 10.7±0.2a b b18:3n-6 0.2±0.0 0.3±0.0 0.2±0.0 0.2±0.1 0.1±0.0 0.2±0.0c a b c a b20:2n-6 0.5±0.0 0.4±0.01.4±0.1 0.7±0.0 1.2±0.1 0.7±0.0
20:3n-6 0.1±0.0 0.1±0.0 0.1±0.0 0.2±0.0 0.1±0.0 0.1±0.0 a b b20:4n-6 0.5±0.0 0.5±0.0 0.5±0.0 2.3±0.1 2.0±0.1 2.0±0.0
c a b c a b 8.1±0.1Σ n-6 FA 6.9±0.1 26.3±0.8 13.6±0.2 22.2±0.5 13.8±0.2
c b a c b a18:3n-3 1.3±0.0 0.4±0.03.0±0.1 18.3±0.9 1.1±0.0 8.1±0.3a b b18:4n-3 2.4±0.1 0.3±0.1 0.2±0.1 0.2±0.1 1.2±0.0 1.1±0.0c b a b b a20:3n-3 0.3±0.0 0.0±0.00.4±0.0 2.0±0.0 0.1±0.0 1.0±0.0a b b a b b20:4n-3 0.8±0.0 0.5±0.10.5±0.0 0.5±0.0 0.3±0.1 0.3±0.1a b b a b b20:5n-3 6.9±0.1 10.0±0.24.8±0.2 4.5±0.2 5.8±0.2 6.1±0.2a b b a b b22:5n-3 2.0±0.1 2.6±0.01.5±0.1 1.5±0.1 1.9±0.0 2.0±0.0a b b a b b22:6n-3 12.3±0.4 29.8±0.59.2±0.3 9.8±0.7 24.9±0.3 25.7±0.5b c a a b a 43.6±0.2Σ n-3 FA 26.0±0.4 20.5±0.5 37.7±0.3 34.3±0.4 43.5±0.2
a c b a c bn-3/n-6 3.7±0.1 5.4±0.10.8±0.0 2.8±0.0 1.6±0.1 3.2±0.0
Values are means ± standard deviations (n=6). Values in the same row with different superscripts are significantly different (P<0.05).
27
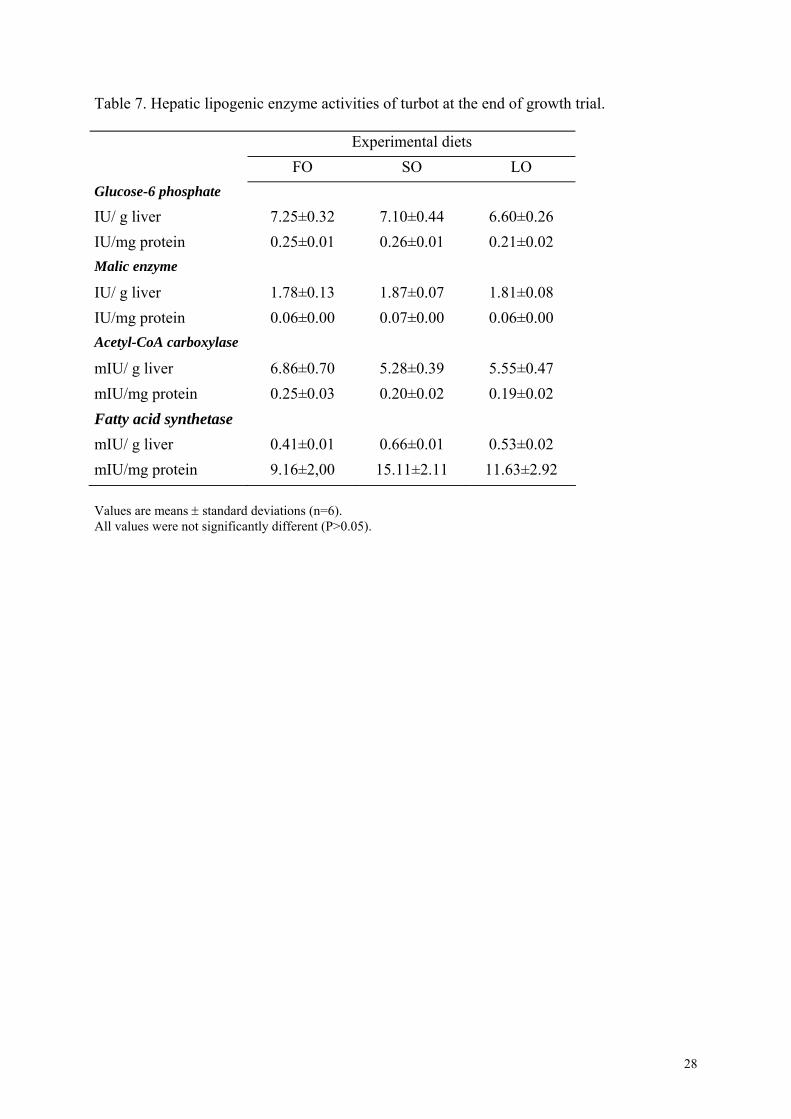
Table 7. Hepatic lipogenic enzyme activities of turbot at the end of growth trial.
Experimental diets FO SO LO Glucose-6 phosphate IU/ g liver 7.25±0.32 7.10±0.44 6.60±0.26 IU/mg protein 0.25±0.01 0.26±0.01 0.21±0.02 Malic enzyme IU/ g liver 1.78±0.13 1.87±0.07 1.81±0.08 IU/mg protein 0.06±0.00 0.07±0.00 0.06±0.00 Acetyl-CoA carboxylase mIU/ g liver 6.86±0.70 5.28±0.39 5.55±0.47 mIU/mg protein 0.25±0.03 0.20±0.02 0.19±0.02 Fatty acid synthetase mIU/ g liver 0.41±0.01 0.66±0.01 0.53±0.02 mIU/mg protein 9.16±2,00 15.11±2.11 11.63±2.92 Values are means ± standard deviations (n=6). All values were not significantly different (P>0.05).
28
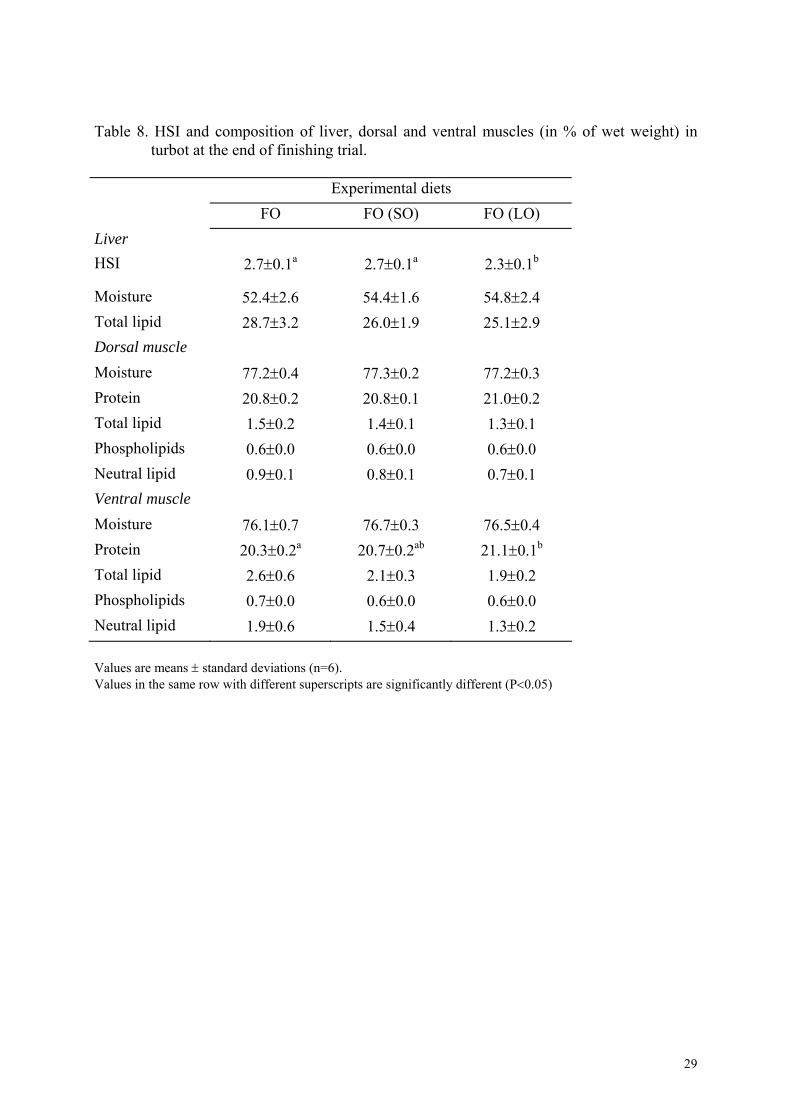
Table 8. HSI and composition of liver, dorsal and ventral muscles (in % of wet weight) in turbot at the end of finishing trial.
Experimental diets FO FO (SO) FO (LO) Liver HSI 2.7±0.1a 2.7±0.1a 2.3±0.1b
Moisture 52.4±2.6 54.4±1.6 54.8±2.4 Total lipid 28.7±3.2 26.0±1.9 25.1±2.9 Dorsal muscle Moisture 77.2±0.4 77.3±0.2 77.2±0.3 Protein 20.8±0.2 20.8±0.1 21.0±0.2 Total lipid 1.5±0.2 1.4±0.1 1.3±0.1 Phospholipids 0.6±0.0 0.6±0.0 0.6±0.0 Neutral lipid 0.9±0.1 0.8±0.1 0.7±0.1 Ventral muscle Moisture 76.1±0.7 76.7±0.3 76.5±0.4 Protein 20.3±0.2a 20.7±0.2ab 21.1±0.1b
Total lipid 2.6±0.6 2.1±0.3 1.9±0.2 Phospholipids 0.7±0.0 0.6±0.0 0.6±0.0 Neutral lipid 1.9±0.6 1.5±0.4 1.3±0.2
Values are means ± standard deviations (n=6). Values in the same row with different superscripts are significantly different (P<0.05)
29
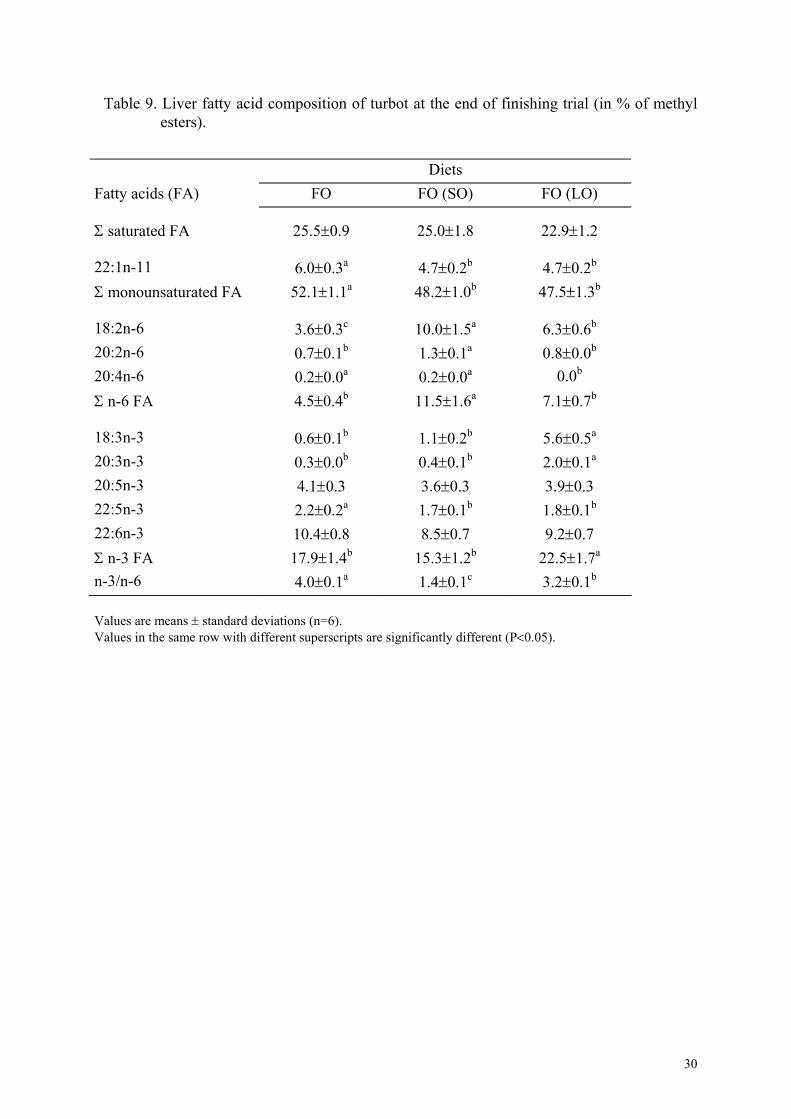
Table 9. Liver fatty acid composition of turbot at the end of finishing trial (in % of methyl esters).
Diets Fatty acids (FA) FO FO (SO) FO (LO)
Σ saturated FA 25.5±0.9 25.0±1.8 22.9±1.2
22:1n-11 6.0±0.3a 4.7±0.2b 4.7±0.2b
Σ monounsaturated FA 52.1±1.1a 48.2±1.0b 47.5±1.3b
18:2n-6 3.6±0.3c 10.0±1.5a 6.3±0.6b
20:2n-6 0.7±0.1b 1.3±0.1a 0.8±0.0b
20:4n-6 0.2±0.0a 0.2±0.0a 0.0b
Σ n-6 FA 4.5±0.4b 11.5±1.6a 7.1±0.7b
18:3n-3 0.6±0.1b 1.1±0.2b 5.6±0.5a
20:3n-3 0.3±0.0b 0.4±0.1b 2.0±0.1a
20:5n-3 4.1±0.3 3.6±0.3 3.9±0.3 22:5n-3 2.2±0.2a 1.7±0.1b 1.8±0.1b
22:6n-3 10.4±0.8 8.5±0.7 9.2±0.7 Σ n-3 FA 17.9±1.4b 15.3±1.2b 22.5±1.7a
n-3/n-6 4.0±0.1a 1.4±0.1c 3.2±0.1b
Values are means ± standard deviations (n=6). Values in the same row with different superscripts are significantly different (P<0.05).
30
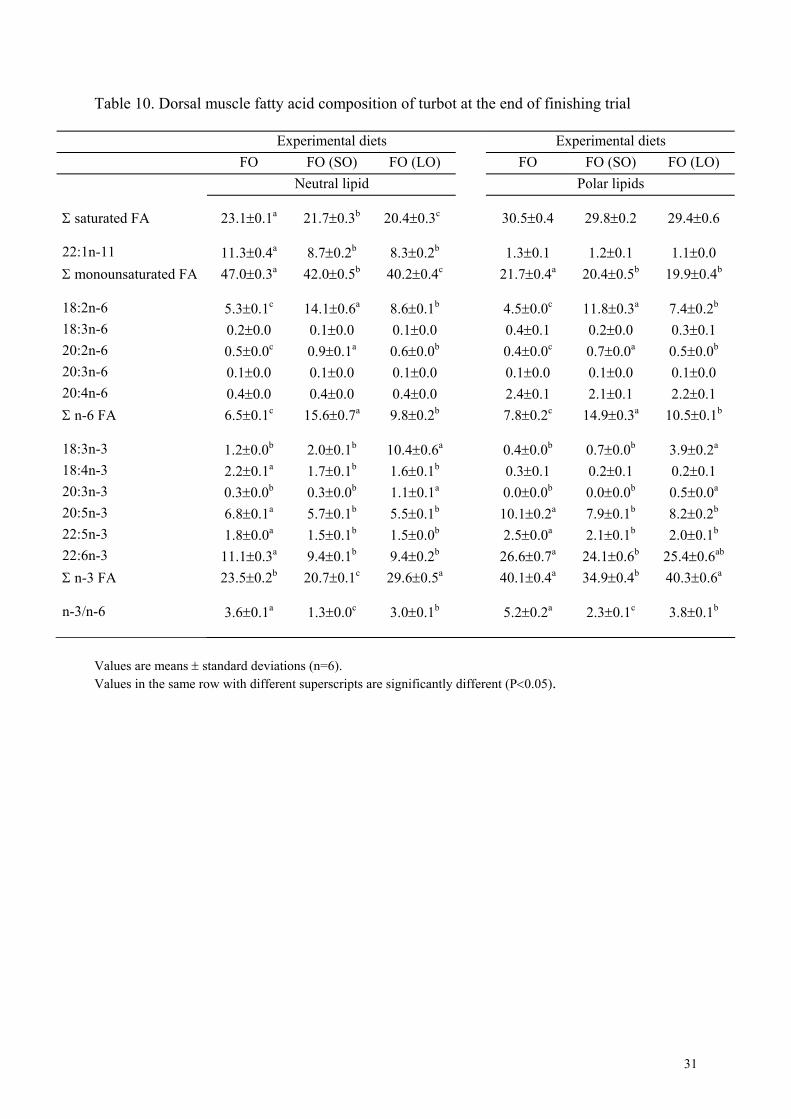
Table 10. Dorsal muscle fatty acid composition of turbot at the end of finishing trial
Experimental diets Experimental diets
FO FO (SO) FO (LO) FO FO (SO) FO (LO)
Neutral lipid Polar lipids
a b c 30.5±0.4 29.8±0.2 29.4±0.6 Σ saturated FA 23.1±0.1 21.7±0.3 20.4±0.3
a b b22:1n-11 11.3±0.4 1.3±0.1 1.2±0.1 1.1±0.0 8.7±0.2 8.3±0.2a b c a b b Σ monounsaturated FA 47.0±0.3 21.7±0.442.0±0.5 40.2±0.4 20.4±0.5 19.9±0.4
c a b c a b18:2n-6 5.3±0.1 4.5±0.014.1±0.6 8.6±0.1 11.8±0.3 7.4±0.218:3n-6 0.2±0.0 0.1±0.0 0.1±0.0 0.4±0.1 0.2±0.0 0.3±0.1
c a b c a b20:2n-6 0.5±0.0 0.4±0.00.9±0.1 0.6±0.0 0.7±0.0 0.5±0.020:3n-6 0.1±0.0 0.1±0.0 0.1±0.0 0.1±0.0 0.1±0.0 0.1±0.0 20:4n-6 0.4±0.0 0.4±0.0 0.4±0.0 2.4±0.1 2.1±0.1 2.2±0.1
c a b c a b Σ n-6 FA 6.5±0.1 7.8±0.215.6±0.7 9.8±0.2 14.9±0.3 10.5±0.1
b b a b b a18:3n-3 1.2±0.0 0.4±0.02.0±0.1 10.4±0.6 0.7±0.0 3.9±0.2a b b18:4n-3 2.2±0.1 0.3±0.1 0.2±0.1 0.2±0.1 1.7±0.1 1.6±0.1b b a b b a20:3n-3 0.3±0.0 0.0±0.00.3±0.0 1.1±0.1 0.0±0.0 0.5±0.0a b b a b b20:5n-3 6.8±0.1 10.1±0.25.7±0.1 5.5±0.1 7.9±0.1 8.2±0.2a b b a b b22:5n-3 1.8±0.0 2.5±0.01.5±0.1 1.5±0.0 2.1±0.1 2.0±0.1a b b a b ab22:6n-3 11.1±0.3 26.6±0.79.4±0.1 9.4±0.2 24.1±0.6 25.4±0.6b c a a b a 40.1±0.4Σ n-3 FA 23.5±0.2 20.7±0.1 29.6±0.5 34.9±0.4 40.3±0.6
a c b a c bn-3/n-6 3.6±0.1 5.2±0.21.3±0.0 3.0±0.1 2.3±0.1 3.8±0.1
Values are means ± standard deviations (n=6). Values in the same row with different superscripts are significantly different (P<0.05).
31
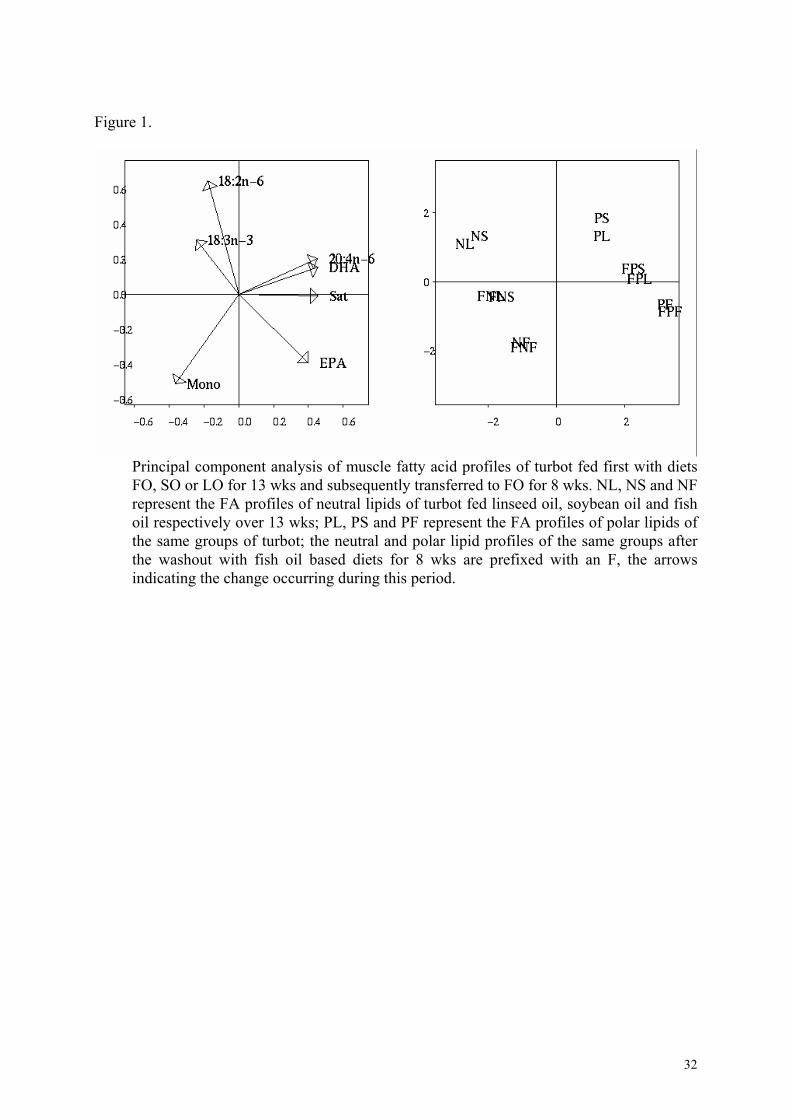
Figure 1.
Principal component analysis of muscle fatty acid profiles of turbot fed first with diets FO, SO or LO for 13 wks and subsequently transferred to FO for 8 wks. NL, NS and NF represent the FA profiles of neutral lipids of turbot fed linseed oil, soybean oil and fish oil respectively over 13 wks; PL, PS and PF represent the FA profiles of polar lipids of the same groups of turbot; the neutral and polar lipid profiles of the same groups after the washout with fish oil based diets for 8 wks are prefixed with an F, the arrows indicating the change occurring during this period.
32