TOTAL PHENOLIC AND TOTAL FLAVONOIDS CONTENT OF PITAYA PEELS BY
115
TOTAL PHENOLIC AND TOTAL FLAVONOIDS CONTENT OF PITAYA PEELS BY WATER EXTRACTION NG WEI CHET UNIVERSITI MALAYSIA PAHANG
Transcript of TOTAL PHENOLIC AND TOTAL FLAVONOIDS CONTENT OF PITAYA PEELS BY

TOTAL PHENOLIC AND TOTAL FLAVONOIDS CONTENT OF PITAYA PEELS BY
WATER EXTRACTION
NG WEI CHET
A thesis submitted in fulfillment of the
requirements of the award of degree of
Bachelor of Chemical Engineering
Faculty of Chemical and Natural Resources Engineering
Universiti Malaysia Pahang
APRIL 2009

ii
I declare that this thesis is entitled “Total Phenolic and Total Flavonoids Content of
Pitaya Peels by Water Extraction” is the result of my own research except as cited in the
references. The thesis has not been accepted for any degree and is not concurrently
submitted in candidature of any other degree.
Signature : …………………………
Name : NG WEI CHET
Date : 8 APRIL 2009

iii
Special dedication to my family members, my supervisor, staffs of FKKSA laboratory and all my beloved friends.
For all your love and support. Thank you very much.

iv
ACKNOWLEDGEMENT
In preparing this thesis, I have gained knowledge and experiences from many
specialists. Therefore, I would take this chance to acknowledge their contributions.
First and foremost, a special thank to my supervisor, Dr Mimi Sakinah for her
willingness in overseeing the progress of my research work from the initial phase till the
completion of this thesis. Her understanding, encouraging and personal guidance have
provided a good basis for the present thesis.
Last but not least, I would like to express my sincere gratitude to my family
members who always care and support me throughout my study at Universiti Malaysia
Pahang, UMP.

v
ABSTRACT
Residues from the processing of fruits and vegetables which are traditionally
considered an environmental problem is now widely recognized for obtaining high-
phenolic products. This paper was designed to study the total phenolic and total
flavonoids contents in the pitaya peels. The total phenolic content was determined by
using the Folin-Ciocalteu assay while the total flavnoids was measured using aluminum
chloride colorimetric assay by UV-visible spectrometer. The result showed that the
highest total phenolic content in pitaya peels was extracted at the optimum dose of
aluminum sulfate concentration of 25 mg/L (3.32 mg gallic acid equivalents (GAE)/ 25
g at 80oC, 3.21 mg GAE/25g at 60oC and 1.73 mg GAE/25g at 40oC). The greatest total
flavonoids content in pitaya peels was extracted (2.24 mg catechin equivalents (CE)/25 g
at 60oC, 1.79 mg CE/25g at 80oC and 1.60 mg CE/25g at 40oC) at the concentration of
aluminum sulfate of 30 mg/L. The results showed that the value of the total phenolic
content decreased when the concentration of aluminum sulfate of 25 mg/L due to the
fact that the high concentration of aluminum sulfate (more than 25 mg/L) could have
reacted with the phenolic compound of the pitaya peels to form another compound. The
total flavonoid was found to be extracted with the highest value at temperature of 60oC
and the lowest at 80oC. This shows that the flavonoids compound was somehow
destroyed at temperature of 80oC.

vi
ABSTRAK Sisa pemprosesaan buah-buahan dan sayur-sayuran yang selalunya menjadi
punca masalah alam sekitar kini semakin mendapat perhatian ramai kerana sisa tersebut
mengandungi jumlah kandungan fenolik yang memberangsangkan. Kajian ini bertujuan
untuk mengenal pasti jumlah kandungan fenolik dan jumlah kandungan flavonoids yang
terkandung dalam kulit buah naga. Jumlah kandungan fenolik ditentukan melalui kaedah
Folin-Ciocalteu, manakala jumlah kandungan flavonoids pula ditentukan melalui kaedah
kalorimetri aluminum klorida dengan bantuan alat UV-Vis spectrometer. Keputusan
kajian menunjukkan bahawa jumlah kandungan fenolik yang tertinggi dalam kulit buah
naga ialah 25 mg/L sebanyak (3.32 asid gallic bersamaan (GAE/ 25 g pada 80oC, 3.21
mg GAE/ 25g pada 60oC dan 1.73 mg GAE/ 25g pada 40oC) iaitu pada aluminum
sulfate yang optimum. Bagi jumlah kandungan flavonoids yang dapat dalam kulit buah
naga, adalah sebanyak (2.24 mg catechin bersamaan CE/25g pada 60oC, 1.79 mg
CE/25g pada 80oC dan 1.60 mg CE/ 25g pada 40oC) pada kepekatan aluminum sulfate
30 mg/L. Keputusan juga menunjukan kecerunan graf pada setiap suhu bagi jumlah
kandungan fenolik adalah menurun selepas 25 mg/L. Ini berkemungkinan adalah asid
yang berkepekatan tinggi (selepas kepekatan 25 mg/L) bertindakbalas dengan jumlah
kandungan fenolik komponen menjadikan ianya berubah kepada komponen yang
berlainan. Bagi jumlah kandungan flavonoids, penghasilannya semakin bertambah
apabila kepekatan aluminum sulfate dicampurkan. Walaubagaimanapun, jumlah
kandungan flavonoids hanya menunjukkan hasil yang banyak pada suhu 60oC dan bukan
pada suhu 80oC. Ini menunjukkan jumlah kandungan flavonoids telah diubahkan dari
segi struktur pada suhu 80oC dan mengakibatkan komponen itu menjadi bahan yang lain.

vii
TABLE OF CONTENTS
CHAPTER TITLE PAGE DECLARATION ii DEDICATION iii ACKNOWLEDGEMENT iv ABSTRACT v ABSTRAK vi TABLE OF CONTENTS vii LIST OF TABLES xiii LIST OF FIGURES xiv LIST OF ABBREVIATIONS xvii 1 INTRODUCTION 1.1 Background of Research 1 1.2 Problem Statement 2 1.3 Significance of Study 4 1.4 Objectives 6 1.5 Scope of Study 6

viii
2 LITERATURE REVIEW 2.1 Pitaya 8 2.1.1 Types of Pitaya 9 2.1.1.1 Yellow Pitaya 9 2.1.1.2 Red Pitaya 10 2.1.2 Plant Stem 11 2.1.3 Inflorescence 11 2.1.4 Fruit 11 2.1.5 Propagation 12 2.2 Polyphenols 12 2.3 Flavonoids 13 2.4 Natural Dyes 14 2.4.1 Art of Making Natural Dyes History 15 2.4.2 Types of Dyes 16 2.4.2.1 Lac Dye 16 2.4.2.2 Annatto 16 2.4.2.3 Harda 16 2.4.2.4 Himalayan Rhubard 17 2.4.2.5 Indigo Blue 17 2.4.2.6 Kamala Dye 17 2.4.2.7 Manju Phal 18 2.4.2.8 Gum Arabic 18 2.4.2.9 Trigonella Foenum Graecum 18

ix
2.4.2.10 Gold Dock 19 2.4.3 Uses of Dyes 19 2.4.3.1 Textile 19 2.4.3.2 Cosmestic 19 2.4.3.3 Edible Dyes 20 2.4.3.4 Food Items 20 2.4.3.5 Leather 20 2.5 Extraction 21 2.5.1 Method of Extraction 21 2.5.1.1 Aqueous Method 21 2.5.1.2 Alkaline Method 22 2.5.1.3 Acidic Method 22 2.5.1.4 Alcoholic Method 22 2.5.2 Extraction Technology 23 2.5.2.1 Solvent Extraction 23 2.5.2.2 Supercritical Fluid Extraction 24 2.5.2.3 Microwave Assisted Extraction 24 2.5.2.4 Continuous Steam Distillation Process 25 2.6 Advantages of Natural Dyes 25 2.7 Disadvantages of Natural Dyes 25 2.8 Aqueous Extraction 26 2.9 Total Phenolic Content (TPC) 27 2.10 Total Flavonoids (TF) 28

x
2.11 Ultra Violet Visible Spectrometer 29 2.12 Centrifuge 31 2.12.1 Differential Centrifugation 32 2.12.2 Density Gradient Centrifugation 32 2.12.3 Rate Zonal Separation 34 2.12.4 Isopycnic Separation 35 3 METHODOLOGY 3.0 Introduction 36 3.1 Methodology Flow Chart 36 3.2 Preparation of Sample 39 3.2.1 Drying of Samples 41 3.2.2 Blending of Pitaya Peels into The 43 Powder Form 3.3 Extraction of Pitaya Peels 44 3.3.1 Extraction of Pitaya Peels at The 44
First Stage
3.3.2 Extraction of Pitaya Peels at 45
Second Stage
3.4 Filtration of The Pitaya Peels From The Extraction 46
3.5 Flocculation of Natural Dye From Extraction of 47
Pitaya Peels
3.5.1 Preparation of Stock Solution of Aluminum 47
Sulfate

xi
3.5.2 Dilution of Concentration of 47
Aluminum Sulfate
3.5.3 Stirring of Mixture of Aluminum Sulfate 48
Solution and Pitaya Peels Filtrate
3.6 Filtration of Floc 49
3.7 Analysis of Total Phenolic Content and 51 Total Flavonoids 3.7.1 Preparation of 80% Methanolic 51 Pitaya Peels Extracts 3.7.2 Centrifugation 52 3.7.3 Analytical Determination of 54 Total Phenolic Content 3.7.4 Analytical Determination of 55 Total Flavonoids
4 RESULTS AND DISCUSSIONS
4.0 Results 57 4.1 Total Phenolic Content and Total Flavonoids Content 58 Obtained at 40oC 4.1.1 Total Phenolic Content 58 4.1.2 Total Flavonoids Content 61 4.2 Total Phenolic Content and Total Flavonoids Content 63 Obtained at 60oC 4.2.1 Total Phenolic Content 63 4.2.2 Total Flavonoids 65 4.3 Total Phenolic Content and Total Flavonoids Content 67 Obtained at 80oC

xii
4.3.1 Total Phenolic Content 67 4.3.2 Total Flavonoids 69 4.4 Comparison of The Total Phenolic Content at Different 71 Temperatures 4.5 Comparison of The Total Flavonoids at Different 75 Temperatures 4.6 Volume of Filtrate 78
4.7 Weight of Floc 82
4.8 Color of Supernatant at Different Temperatures 85
5 CONCLUSIONS AND RECOMMENDATIONS
5.1 Conclusion 88
5.2 Recommendations 89
REFERENCES 90

xiii
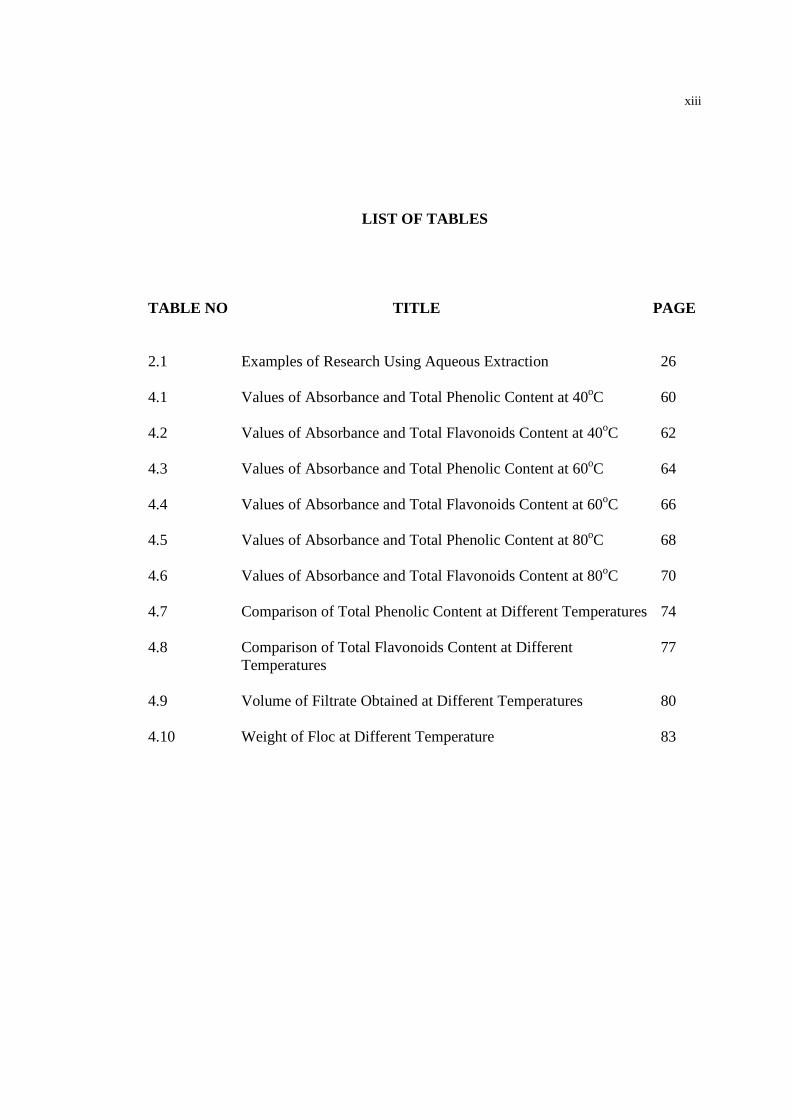
LIST OF TABLES
TABLE NO TITLE PAGE 2.1 Examples of Research Using Aqueous Extraction 26 4.1 Values of Absorbance and Total Phenolic Content at 40oC 60 4.2 Values of Absorbance and Total Flavonoids Content at 40oC 62 4.3 Values of Absorbance and Total Phenolic Content at 60oC 64 4.4 Values of Absorbance and Total Flavonoids Content at 60oC 66 4.5 Values of Absorbance and Total Phenolic Content at 80oC 68 4.6 Values of Absorbance and Total Flavonoids Content at 80oC 70 4.7 Comparison of Total Phenolic Content at Different Temperatures 74 4.8 Comparison of Total Flavonoids Content at Different 77 Temperatures 4.9 Volume of Filtrate Obtained at Different Temperatures 80 4.10 Weight of Floc at Different Temperature 83

xiv
LIST OF FIGURES
FIGURE NO TITLE PAGE 2.1 Yellow Pitaya 9 2.2 Red Pitaya with White Flesh 10 2.3 Red Pitaya with Red Flesh 10 2.4 Molecular Structure of The Flavonoids Backbone 28 2.5 A Diagram of The Component of A Typical Spectrometer 30 2.6 Refrigerated Centrifuge at FKKSA, UMP 31 2.7 Differential Centrifugation 33 2.8 Rate-zonal (size) Separation 34 2.9 Isopycnic Separation 35 3.1 The Flow Chart of the Extraction of Pitaya Peels by Water 37 3.2 Procedure of 80% Methanolic Extraction 38 3.3 Procedure of Total Phenolic Content Assay 38 3.4 Procedure of Total Flavonoids Assay 39 3.5 Sample of Pitaya Peels in Large Pieces 40 3.6 Cutting of Pitaya Peels into Small Pieces 40 3.7 The Fresh Pitaya Peels on the Tray 41 3.8 Pitaya Peels in the Oven Before Drying 42 3.9 Pitaya Peels After Being Dried 42

xv
3.10 Pitaya Peels Being Blended into Powder Form 45 3.11 Pitaya Peels in Powder Form 44 3.12 Each Plastic Sealed Bag Containing 25 g of Dried Pitaya Peels 45 3.13 Extraction of Pitaya Peels after 6 Hours 46 3.14 Pitaya Peels Filtrate and Aluminum Sulfate Solution 48 Being Stirred 3.15 Flocs Being Formed in the Solution 49 3.16 The Floc Being Filtered By Fabric Cotton 50 3.17 Wet Floc After Being Filtered for 24 Hours 50 3.18 The Mixture Being Shaken at 37oC in The Shaking 51 Incubator 3.19 The Mixture After Being Shaken for 1 Hour 52 3.20 Mixture Containing in the Container Being Placed in 53 Centrifuge 3.21 Mixture Before Being Centrifuged 53 3.22 The Clear Supernatant and The Sediment After Being 54 Centrifuged 3.23 Mixture to be Determined for Its Total Phenolic Content 55 at 765 nm 3.24 Mixture to be Determined for Its Total Flavonoids 56 at 510nm 3.25 Adjusting the Cuvette Position in the UV-Vis 56 Spectrometer 4.1 Total Phenolic Content Versus Concentration of 60 Aluminum Sulfate at 40oC 4.2 Total Flavonoids Versus Concentration of Aluminum 62 Sulfate at 40oC
xvi
4.3 Total Phenolic Content Versus Concentration of 64 Aluminum Sulfate at 60oC 4.4 Total Flavonoids Versus Concentration of Aluminum 66 Sulfate at 60oC 4.5 Total Phenolic Content Versus Concentration of 68 Aluminum Sulfate at 80oC 4.6 Total Flavonoids Content Versus Concentration of 70 Aluminum Sulfate at 80oC 4.7 Comparison of Total Phenolic Content at Different 74 Temperatures 4.8 Comparison of Total Flavonoids Content at Different 78 Temperatures 4.9 Filtrate Volume Versus Concentration of Aluminum 80 Sulfate at 40oC 4.10 Filtrate Volume Versus Concentration of Aluminum 81 Sulfate at 60oC 4.11 Filtrate Volume Versus Concentration of Aluminum 81 Sulfate at 80oC 4.12 Volume of Filtrate at Different Concentration of 82 Aluminum Sulfate 4.13 Weight of Floc Versus Concentration of Aluminum 84 Sulfate at 40oC 4.14 Weight of Floc Versus Concentration of Aluminum 84 Sulfate at 60oC 4.15 Weight of Floc Versus Concentration of Aluminum 85 Sulfate at 80oC 4.16 Supernatant Color at 40oC 86 4.17 Supernatant Color at 60oC 86 4.18 Supernatant Color at 80oC 87

xvii
LIST OF ABBREVIATIONS/SYMBOLS
% - Percent
AlCl3 - Aluminum chloride
CE - Catechin equivalent
F-C - Folin-Ciocalteu
G - Gram
g/L - Gram per liter
GAE - Gallic acid equivalent
kg - kilogram
L - Liter
mg/L - Milligram per liter
Na2CO3 - Sodium carbonate
NaNO2 - Sodium nitrate
NaOH - Sodium hydroxide
nm - Nanometer oC - Degree celsius
TF - Total flavonoids
TPC - Total phenolic content
UV-Vis - Ultra Violet-Visible
Vs - Versus
µL - Micro liter

CHAPTER 1
INTRODUCTION
1.1 Background of Research
Phenolic compounds are secondary metabolites of plants. They are naturally
present in fruits and vegetables. These compounds are a part of the everyday diet and
also used as medicines or supplements. Research has shown that fruits and vegetables
contain other antioxidant nutrients, in addition to vitamins C and E, and carotenoids,
which significantly contribute to their total antioxidant capacity. The major part of those
antioxidant nutrients is polyphenolic compounds, which are components of fruits and
vegetables having strong antioxidant capacity. Flavonoids have a wide range of
biological activities, such as cell-proliferation-inhibiting, apoptosis-inducing, enzyme-
inhibiting, antibacterial, and antioxidant effects. Moreover, some findings indicate that
flavonoids possess various clinical properties, such as antiatherosclerotic, anti-
inflammatory, antitumour, antithrombogenic, antiosteoporotic, and antiviral effects (Su
et al., 2008).
Since ancient times, the ability of natural dyes to color had been known. In the
earliest written record, the use of natural dyes was found in China dated 2600 BC.

2
Another proof to the use of natural dyes in ancient time is by the 4th century AD, dyes
such as woad, Brazilwood and etcaeteras where Brazil was named for the wood found
there. Natural dyes can be obtained from plants, animals and minerals. For example, the
turkey red was extracted from madder plant was so popular and used for dyeing until the
mid 1800s.
Pitaya ( Hylocereus undatus(Haw)) or dragon fruit which have been planted in
Viet Nam for almost 100 years (Mizrahi et al.,1997). Nowadays, coloring foodstuffs are
the most popular way to achieve desired hues because of their application does not
require certification (Stich et al., 1999; Stintzing et al., 2004). In addition, natural dyes
from the plants or fruits are believed to be safe as they are non-toxic, non-carcinogenic
and biodegradable nature. So, natural dyes are widely produced nowadays from natural
resources like from the plants or fruits which its colors can be extracted through various
types of method. It is then safe to be used after detoxification process.
1.2 Problem Statement
Polyphenol which it is widely used for the antioxidants are normally used in fats,
oils, soap and cosmetics to prevent oxidative rancidity. Other than the natural
antioxidants, artificial antioxidants such as butylated hydroxyanisole (BHA), butylated
hydroxytoluene (BHT) and propyl gallate (PG) are extensively used in food and some
commercial products. Recently, there has been a study finding out that those artificial
antioxidants may cause loss of nourishment and even produce toxic substances to harm
people’s health. Hence, phenolic antioxidants are strictly controlled for its use with the
definition of the amounts of these additives to be allowed added in foods. Thus, it is

3
crucial to find out more natural phenolic to supply to the needs of phenolic from the
natural sources. (Yong et al., 1999)
The present trend throughout the world is shifting towards the use of eco-friendly
and biodegradable commodities, ranging from food industry to textile industry. Hence,
the demand for natural dyes is increasing day by day (Bhuyan et al., 2004).
Recent studies by the European Union found out that the colouring, Red 2G
which is being used in all types of food especially in enhancing the colour of burgers
and sausages that could endanger the health of humans like destroying the genetic
material in cells and causing cancer has been banned with immediate effect by The
Health Ministry of Malaysia while EU had banned this type of colouring on July 27,
2007 (The Star, 2007). The Sudan Red is widely used for colouring solvents, oils, waxes
and floor polishes which is illegally used to enhance and maintain the colour of the food
products has been prohibited for use in food products by Regulations Relating to Food
Colorants (R.1008) of the Foodstuffs, Cosmetics and Disinfectant Act 54 of 1972 in
South Africa. Research indicates that the Sudan Red brings carcinogenic effect to human
beings, and genotoxic effect which is capable of causing damage to DNA.
While in textile industry, it can mostly produce and use approximately 1.3
million tones of dyes, pigments and dye precursors, valued at around $ 23 billion, almost
all of which is manufactured synthetically. However, synthetic dyes have some
limitations. First, the production process requires hazardous chemicals, creating worker
safety concerns. Second, they may generate hazardous wastes and third, these dyes are
not environment friendly (Sengupta et al., 2003). So in the textiles industry nowadays,
there is a revival of natural dyes in textiles is growing interest because of the green
chemistry, improved eco-balances and thereby leading to the niche products for special
markets (Bechtold et al., 2006).

4
Consumers nowadays are more aware of the poisonous of consuming artificial
dyes where it can lead to fatal and demanding for natural product or natural sources as
natural dyes lack of toxicity during production and having full biodegradation and
reduction of the environmental impact.
1.3 Significance of Study
Phenolic compounds are secondary metabolites in plants. Over the past 10 years,
there has been increasing interest in phenolic compounds and their role in human health
and nutrition. Some phenolic compounds present in natural products have higher
antioxidant activities than those of synthetic antioxidants. These polyphenolic
antioxidants can also be used to preserve foods because of their protective effects against
microorganisms.
Residues from the processing of fruits and vegetables, traditionally considered as
an environmental problem, are being increasingly recognized as sources for obtaining
high-phenolic products. The polyphenolics from waste materials deriving from agro-
industry production may be used as functional food ingredients and as natural
antioxidants to replace their synthetic equivalents that have experienced growing
rejection. (Zhou et al., 2008)
Natural dyes can offer not only a rich and varied source of dyestuff, but also the
possibility of an income through sustainable harvest of the dye plants. Another aspect to
be considered by an imaginary supplier of natural dyes has been identified during an
extensive study of possible future us of natural dyes, namely that the plant material

5
which contains the natural dye needs the same level of standardization as modern
synthetic dyes already have achieved at present (Ganglberger et al., 2003; Rappl, 2005).
Furthermore there is abundance of waste contributed by certain industries like in
Food industry which produces cans of Pitaya leaving the Pitaya peels which can be fully
utilized to be extracted for its natural red dyes by using aqueous extraction method
.Hence producing of natural dyes are much more to be encouraged to fulfill the demand
of the market and reduce the waste disposal.
Production of red natural dye from Pitaya waste is natural and its red colourants
are now growing interest from both food manufacturers and consumers in the continuing
replacement of synthetic dyes (Duhard et al., 1997). As we know the plants have
generally produced less amount of colouring component on extraction which do not
sufficient to provide for the needs of market. Also, there is a restriction in using the
natural dyes in comparison with synthetic dyes because of the cost of the yield of natural
dyes (Ali et al, 2008). With the appearance of synthetic dyes the use of natural dyes for
textile dyeing almost disappeared. The wide range of colours available with good
fastness properties at moderate costs was the main reason for the replacement of natural
dyes by their synthetic counterparts.
Hence, it is imperative to optimize more colouring component with keeping the
environment safe through alkaline extraction from Pitaya waste excluding any hazardous
application of organic solvents.
The present work is, therefore, undertaken to extract more colouring components
with keeping the environment friendly extraction procedure excluding the extensive
application of organic solvents.
6
1.4 Objectives
The current research is done to achieve the following objectives:
i) To determine the effect of temperature and the concentration of the
aluminum sulfate to the extraction of pitaya peels.
ii) To determine the amount of total phenolic and total flavonoids content exist
in the pitaya peels.
1.5 Scope of Study
The scopes of the study are:
i) Only Red Pitaya peels are used in the experiment.
ii) Aqueous extraction is involved in the experiment.
iii) Pitaya waste is heated in 250ml for 4 hours in the water with temperature
different at 40oC, 60oC and 80oC.
iv) Pitaya waste is heated in 125ml at second heating stage for 2 hours with
temperature different at 40oC.
v) The aqueous extraction involves using Aluminum Sulfate at different
concentration (mg/L) for 10, 15, 20, 25 and 30 mg/L.

7
vi) 80% methanol is used in methanolic extraction.
vii) Total Phenolic Content (TPC) is determined by using Folin-Ciocalteu
method.
viii) Total flavonoid content (TF) is determined by using the Catechin method.
xi) Each sample of TPC (Total Phenolic Content) and TF (Total Flavonoids) is
determined by UV-visible spectrometer.

CHAPTER 2
LITERATURE REVIEW
2.1 Pitaya
Pitaya (Hylocerus undatus (Haw.)) or Dragon Fruit is native to the Central
America which has been documented in Aztec literature since the 13th century. It was
then commercially grown in Colombia, Nicaragua and Vietnam (LJ Health Promotions,
2003). This fruit was then brought in by the French. Pitaya have been planted in Viet
Nam for more than 100 years, following their introduction by the French (Mizrahi et al.,
1997). In the local, dragon fruit is named as Thanh Long or in English, it is ‘Green
Dragon’. The green color is its immature color before ripening. While the ‘dragon’ is
used to name the fruit as its appearance has ‘dragon-like’ scales or bracts on the surface.
Dragon fruit is considered to be the member of Cactaceae. The trailing cladodes, stems
modified to act as leaves, bear spectacular ovoid fruit year-round which are a bright red
colour when it is ripened or becomes mature. The fruit contains white, crimson or dark
red color, or some with pale-yellow flesh depending on the cultivar and the flesh is
interspersed with small black seeds (Hoa et al., 2006).

9
2.1.1 Types of Pitaya
2.1.1.1 Yellow Pitaya
Yellow Pitaya (Selenicereus megalanthus) is a vine cactus that needs a trellis
system for support. In Israel net-houses are required to avoid photo-inhibition and
bleaching of its stems. Colombia was the first country to sell S. megalanthus in the
world market under the name of “yellow pitaya”. This plant can tolerate high
temperatures more than the other vine cacti, yields spiny fruits where the spines abscise
easily upon ripening (Figure 2.1). The fruits are smaller than the other vine cacti fruits
but the taste is superior, hence, the higher prices obtained in the markets in comparison
with the others. Most of the plantations in Colombia have been uprooted due to the
heavy infestation with fungi.
Figure 2.1 Yellow Pitaya (Wikimedia, 2008)

10
2.1.1.2 The Red Pitaya
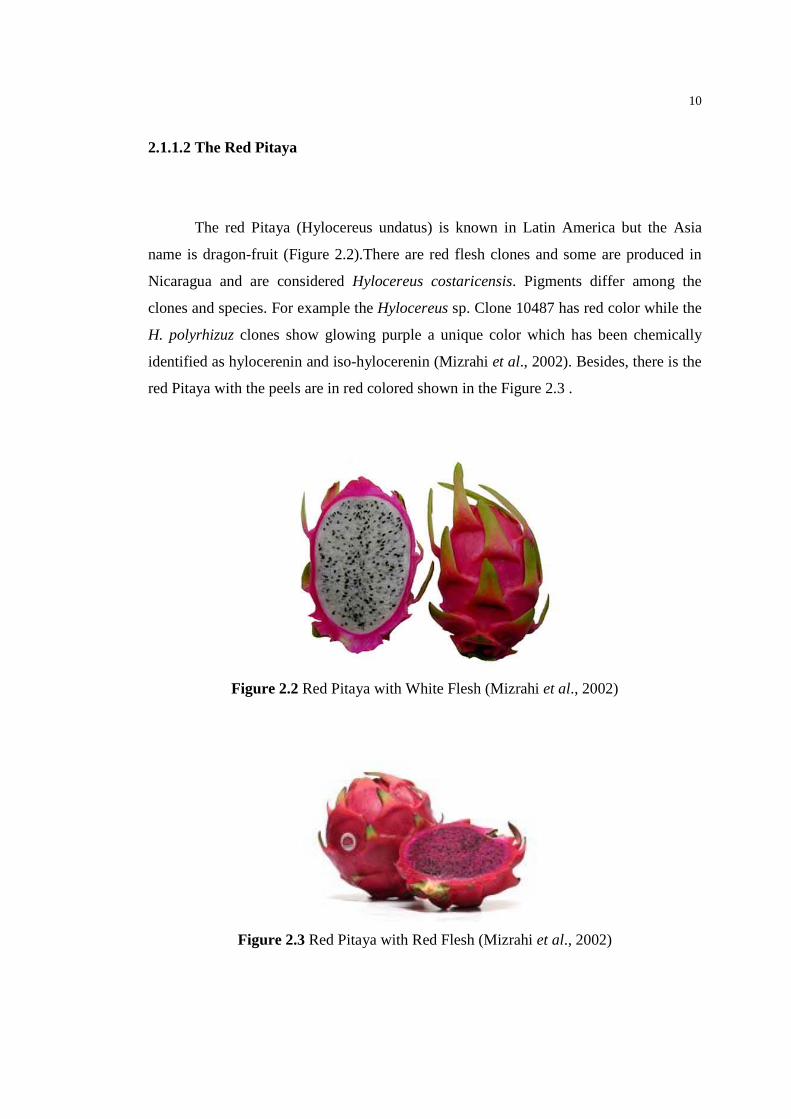
The red Pitaya (Hylocereus undatus) is known in Latin America but the Asia
name is dragon-fruit (Figure 2.2).There are red flesh clones and some are produced in
Nicaragua and are considered Hylocereus costaricensis. Pigments differ among the
clones and species. For example the Hylocereus sp. Clone 10487 has red color while the
H. polyrhizuz clones show glowing purple a unique color which has been chemically
identified as hylocerenin and iso-hylocerenin (Mizrahi et al., 2002). Besides, there is the
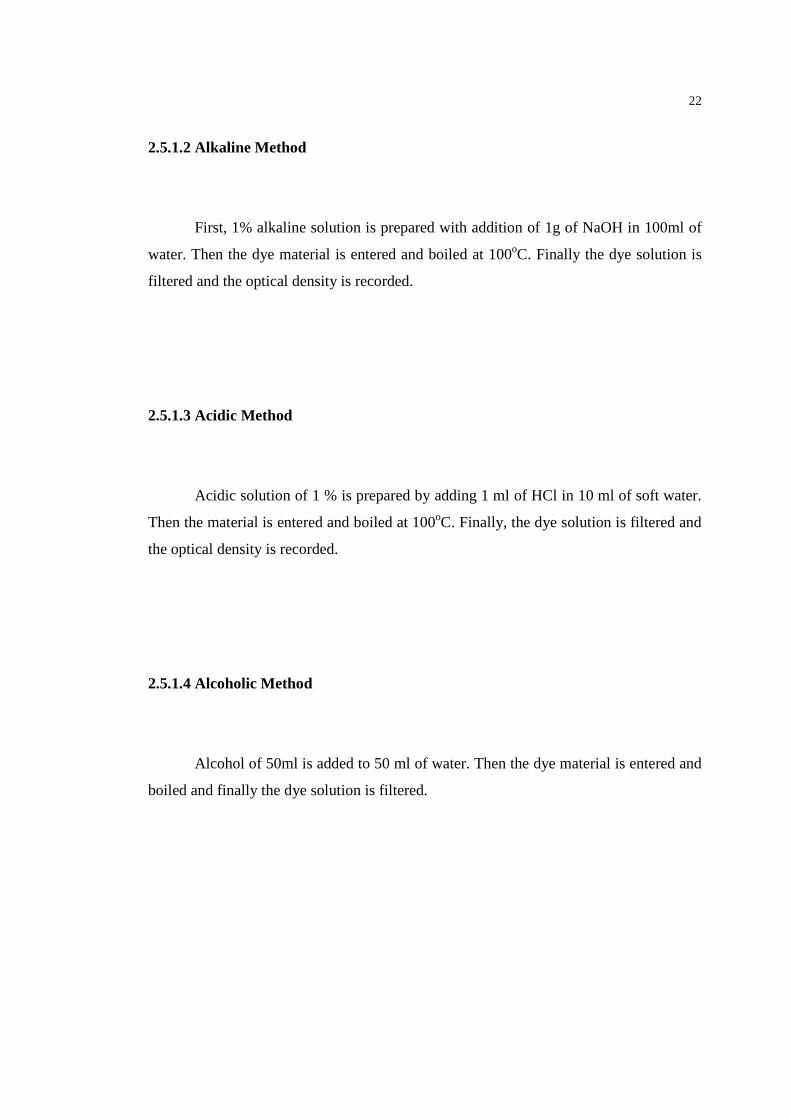
red Pitaya with the peels are in red colored shown in the Figure 2.3 .
Figure 2.2 Red Pitaya with White Flesh (Mizrahi et al., 2002)
Figure 2.3 Red Pitaya with Red Flesh (Mizrahi et al., 2002)

11
2.1.2 Plant Stem
Pitayas are the fast growing, perennial, terrestrial, epiphytic, and vine-like cacti.
The appearance is triangular which are 3-sided, sometimes 4 or 5-sided. It is green,
fleshy and having many branched stems. For each of the stem segment, it has 2 flat,
wavy wings, with corneous margins and may have 1-3 small spines or be spineless. The
stem forms root which is adhered to the surface upon which they grow and the stem may
reach about 6.1m long.
2.1.3 Inflorescence
The flowers of the pitaya are hermaphroditic which means a plant having
stamens and pistils in the same flower (Oxford Dictionary, 2005). However, some
species and cultivars are self incompatible. The showy, edible, white flowers are very
large, fragrant, bell shaped and may be 36 cm long and 23 cm wide. The stamens and
lobed stigmas are cream colored.
2.1.4 Fruit
The pitaya fruit is fleshy berry, oblong and the thickness is about 11cm with red
or yellow peels with scales. The pulp maybe white, red or magenta depending on the
species. They are seeds in the pulp which are very small, numerous and black.

12
2.1.5 Propagation
Pitaya can be propagated from seed, however, the fruit and stem characteristics
are variable, and the time from planting to fruit production may be up to around 7 years.
Asexual propagation is preferred, and currently, the stem cuttings method is widely
applied by most people. The entire stem segments of 12-38 cm are usually used. To
make the stem base, the stem has to be cut slanted then being treated with fungicide and
dry and heal for 7-8 days in dry, shady location before being planted. Another method
which is applying root hormone to the cuttings after curing but before it is done before
planting. This cutting method grows very fast and many produce fruit in about 6 to 9
months after planting. Longer cuttings usually reach the trellis supports faster than
shorter ones. Another method which is not commonly practiced is the Pitayas may be
grafted. Grafting has potential for selection of rootstocks adaptable to various soil types
and problems. Cutting takes about 4-6 months to develop a good root system in pots and
be ready for planting.
2.2 Polyphenols
Polyphenols are antioxidants in plants that is believed to have a substantial
amount of health benefits. Among the most well known of the polyphenols are the
flavonoids which are grouping of several thousand individual compounds. These
cmpounds are found together in many different foods, all contributing in a unique way to
an individual’s overall health. They are most commonly introduced to the body through
the consumption of fruits and vegetables.
13
In addition of flavonoids, other classes of polyphenols include tannins (both
condensed tannins and hydrolysable tannins), and lignins. Each of these polyphenols can
be found from many different sources. For example, tannins are prevalent in wines, tea
and fruits. Nearly all the plants will carry at least some of these polyphenols.
Polyphenols work by eliminating free radicals in the body, which are known to
cause a number of health problems. It is thought polyphenols help prevent premature
aging and help prevent cancer, among other things. Some, such as tannins, may even
have antibiotic benefits as well.
The effect of tannins can be seen in a number of different applications. It is the
substance responsible for the browning, or tanning, of leather. In fact, that is how the
group of chemicals received their name. In fact, that is how the group of chemicals
received their name. Tannic acid can be seen in some lakes and rivers, especially those
in the tropical and subtropical areas populated with cypress trees. However, it should be
noted that some tannic acid may be harmful to the body.
2.3 Flavonoids
Flavonoids, which is also referred as bioflavonoids, are polyphenol antioxidants
found naturally in plants. They are secondary metabolites, meaning they are organic
compounds that have no direct involvement with the growth or development of plants.
Flavonoids are plant nutrients that when being consumed in the form of fruits and
vegetables are non-toxic as well as potentially beneficial to human body.

14
Flavonoids are widely disbursed throughout plants. It gives the flowers and fruits
of many plants their vibrant colors. They also play a role in protecting the plants from
microbe and insect attacks. More importantly, the consumption of foods containing
flavonoids has been linked to numerous health benefits. Though research shows
flavonoids alone provide minimal antioxidant benefit due to slow absorption by the
body, there is indication that they biologically trigger the production of natural enzymes
that fight disease.
Recent research indicates that flavonoids can be nutritionally helpful by
triggering enzymes that reduce the risk of certain cancers, heart disease, and age-related
degenerative diseases. Some research also indicates flavonoids may help prevent tooth
decay and reduce the occurrence of common ailments such as the flu. These potential
health benefits, many of which have been proven, have become of particular interest to
consumers and food manufacturers. Food that contain high amount of flavonoids include
blueberries, red beans, cranberries and blackberries. Many of other foods, including red
and yellow fruits and vegetables and some nuts, also contain flavonoids. Red wine and
certain tea also are rich in flavonoids as well.
2.4 Natural Dye
No chemical dye has the luster, that under-glow of rich colour, the delicious
aromatic smell, that soft light and shadow that gives so much pleasure to the eye. These
colours are alive (Thurston, 1972). Dyes can be derived from nature through herbs and
plants, flowers, seeds, barks and roots. Natural dyes give subtle, rich, warm colors that
unique. They have a mystery and life that fascinates and satisfies. Natural dyes can be
categorized as either substantive adjective.

15
2.4.1 Art of Making Natural Dyes History
The art of making natural dyes is one of the oldest known to man and date back
to the dawn of Civilization. In India, it was widely used for the colouring of fabrics and
other materials. Though the very earliest dyes were discovered by accident using berries
and fruits. With the experimentation and gradual development the natural dyes have
resulted into a highly refined art.
India’s expertise in natural dyes date back to ancient times. Using mordant to
hold fast the dyes or resists to selectivity prevent them from touching the cloth were
printed bales of whisper soft textiles. From 19th centuries, block printed resist dyes
textiles from Gujarat and Deecan adorned Europeans and their homes. The discovery of
synthetic dyes in the west in 19th century dealt a massive blow to Indian Textile
Industry. Some of the chemical dyes earlier found associated with hazards effecting
human life creating skin diseases and lungs problems. The environmentalist, therefore,
started searching the substitute of synthetic items which has led the use of more natural
dyes. In recent days the inherent advantages of natural dyes has resulted in the revival
and use of natural dyes.

16
2.4.2 Types of Natural Dyes
2.4.2.1 Lac Dye
It is extracted from lacifer lacca insect. It is used for dyeing of wool, silk and
cotton fibers. It gives reddish with tin mordant and purplish with copper mordant.
2.4.2.2 Annatto
It is prepared from the seed of annatto. It is used in the dyeing of silk and wool.
It gives orange and peach colour. Its botanical name is bixin.
2.4.2.3 Harda
It is prepared from fruits of Harda and it yields yellow and gray colours with
aluminum and ferrous mordant respectively. It can be used in coloration of wool and
silk.

17
2.4.2.4 Himalayan Rhubard
It is manufactured from Himalayan herb. The roots of this plants is used fro the
manufacture of dye stuff. It gives yellow and oranges. It can be used directly and with
Alum Mordant on wool or silk.
2.4.2.5 Indigo Blue
It is a fermented dyes of leaves of indigo ferra tinctoria. It gives blue colour. It
can dye cotton, wool and silk.
2.4.2.6 Kamala Dye
It is prepared from the deposits on flowers of Kamala tree. It gives yellow colour
on wool and silk. It can be used directly of with mordant as well.

18
2.4.2.7 Manju Phal
It is manufactured from the nut galls of Manju Phal tree. It is used for dyeing of
silk and wool, both directly or with mordant. It gives cream and grey colours with alum
and iron mordant.
2.4.2.8 Gum Arabic
It is manufactured from the bark of Indian Gum Arabic tree. It is used for dyeing
of cotton with mordant. It yields brown shade having very good fastness.
2.4.2.9 Trigonella Foenum Graecum
It is prepared from the fenugreek seeds. It is used in the dyeing of cotton fabrics.
It gives yellow shade with metallic mordents like copper sulphate and feerous sulphate.

19
2.4.2.10 Gold Dock
It is prepared from rumexmaritinus seeds. It yields brown colour on cotton with
alum, copper sulphate and ferrous sulphate mordants.
2.4.3 Uses of Dye
2.4.3.1 Textile
There is a big potential for the use of natural dyes in textile industry. These dyes
can be used for coloration of textile material at different stages such as on the yarn, on
the fabric and even can be applied on the apparels.
2.4.3.2 Cosmetics
The natural dyes from dolu and rind of pomegranate are used in coloration of
lipsticks and other cosmetics. They are manufactured by water extraction method. The
coloring matter can be extracted with Super Critical Fluid Extraction Method.

20
2.4.3.3 Edible Dyes
Most common dye, which can be used for coloration of the edible items, are
annatto seeds. The water soluble extract can be used for coloration of butter and oil
soluble extract can be used for colouration of ghee and ice cream. They are simple
extracts of annotto seeds, which give 55 to 60% yields when their extract is prepared.
Lac dye is also derivative of lac and is similar to cochineal and has been in use for
colouring food besides fabrics since ancient times.
2.4.3.4 Food Items
This is the sector where natural dyes can be consumed in appreciable amount.
This sector consumes 10 to 20 ton of natural dyes in a year. Moreover, the consumption
of natural dyes in beverage sector can be up to 20 to 40 ton per year.
2.4.3.5 Leather
Leather industry is already using natural tannin for tanning of leather sole.
However, this use is confined to cottage and small-scale leather units. The large
manufacturers are using Chrome Tanning. At present, none of the leather units are using
natural dyes for coloration of their product. If sufficient and offensive efforts are done,
the natural dyes can capture in leather sector in a big way.

21
2.5 Extraction of Natural Dyes
The natural dyes extraction is broadly divided into extraction method and
extraction technology.
2.5.1 Method of Extraction
The extraction methods of natural dye basically depend on medium in which the
dye is extracted. There are mainly four methods used in extraction of natural dyes where
they are aqueous method, alkaline method, acidic method and alcoholic method.
2.5.1.1 Aqueous Method
The known amount of dyestuff is boiled in 100 ml of soft water at 100oC. Then
the dye solution is filtered and finally the optical density is recorded.

22
2.5.1.2 Alkaline Method
First, 1% alkaline solution is prepared with addition of 1g of NaOH in 100ml of
water. Then the dye material is entered and boiled at 100oC. Finally the dye solution is
filtered and the optical density is recorded.
2.5.1.3 Acidic Method
Acidic solution of 1 % is prepared by adding 1 ml of HCl in 10 ml of soft water.
Then the material is entered and boiled at 100oC. Finally, the dye solution is filtered and
the optical density is recorded.
2.5.1.4 Alcoholic Method
Alcohol of 50ml is added to 50 ml of water. Then the dye material is entered and
boiled and finally the dye solution is filtered.

23
2.5.2 Extraction Technology
The extraction can be carried out in aqueous, acid or alkaline medium. At
present, small scale producers/ manufacturers are using extraction technology method.
Even the local dyers using more crude method for extraction using metallic flax and
crude process in refined way using blender condenser, distillation plant and drier and
crystallization unit with the capacity of 300 ton per year. The modern techniques of
extraction are carried out with the use of extraction plant, reverse osmosis process and
the latest is supercritical fluid extraction method. This method is very common in
developed countries.
2.5.2.1 Solvent Extraction
This technique was developed just before the dawn of twentieth century. Now it
has been commercialized in recent years. This technology has been improved to reduce
waste generation and eco-effectiveness of extraction technology. Ultrasonic extraction
followed by micro-wave extraction of solid finds extensive use mainly on organic
solvents extraction

24
2.5.2.2 Supercritical Fluid Extraction
This is a further advancement making significant step over the use of
conventional solvent extraction technology. It uses CO2 as extraction media. This
technique is used for the extraction of natural products in food, pharmaceuticals and
chemical industries too.
It makes it possible to work at moderate temperature without affecting the
organoleptic qualities and the active ingredients of the extracts obtained. Moreover, it
makes it possible to obtain 100% natural extracts, completely free from extraction
solvent residues. At the end of the extraction, an expansion phase which is achieved by
reducing pressure causes the CO2 to change from the supercritical state to the gaseous
state which enables it to be removed completely from the CO2 extract obtained.
2.5.2.3 Microwave Assisted Extraction Technology
This is a high-speed method used to selectively target compounds from various
raw materials. The technology uses a microwave applicator as the energy source during
solvent extraction. The advantage of this technology faster the processing, produce
better yield, improve quality, lower energy consumption, reduce solvent level and low
capital investments.
25
2.5.2.4 Continuous Steam Distillation Process
The Continuous Steam Distillation Process is a separation process using steam as
a media but instead of batch type, this process is continuous. The process consists of a
totally insulated pneumatic conveying system using super heated steams as a carrier gas.
2.6 Advantages of Natural Dyes
i) High diversity of rich and complex colours.
ii) Different colours go well together and rarely clash.
iii) Beauty of the results.
iv) Not dependent on non-renewable materials.
v) Allow the replication of ancient technique.
2.7 Disadvantages of Natural Dyes
i) Require large quantities in comparison to chemical dyes. However,
several natural dyes are sold as extracts and small amount of cochineal,

26
bazilwood and logwood dye in large amount of fiber.
ii) Longer time required for dyeing. However, if you are using the sun as
as an energy source, you can leave the dye vat unattended for a long time.
iii) May be more costly.
2.8 Aqueous Extraction
The aqueous extraction is where the solvent involved is only water used to
extract the component in the interested substances. It is preferable in most of the
research especially involving plants or fruits for medication or consuming purposes
simply because this method is 100% safe for human being to consume as no chemical
solvent is introduced in during the process. Table 2.1 shows the research that involving
fruits or vegetables extraction using water.
Table 2.1 Examples of research using aqueous extraction
No. Description Reference
1. Extraction of Mucilage from whole white mustard
seed.
(David et al., 2000)
2. Extraction of Jordanian plant species to determine
its antioxidant and total phenolic content.
(Tawaha et al.,2007)
3. Direct extraction of oil from sunflower seeds by
twin-screw extruder.
(Evon et al., 2007)
4. Extraction of Bryophyllum Pinnatum Leaf for
determination of neuropharmacological effects.
(Salahdeen et al., 2006)

27
5. Determination of aqueous extracts of galls of
Querus infectoria as antibacterial agents.
(Basri et al., 2004)
6. Extraction of medicinal plants . (Nair et al., 2006)
7. Rosemary extracts added in gelatins from tuna-skin
and bovine-hide gelatin.
(Gomez-Estaca et al., 2008)
8. Extraction of Labiateae, Vitaceae and Cyperaceae
for antimicrobial activity against bacteria.
(Parekh et al., 2006)
9. Production of anti-inflammatory activity. (Falodun et al., 2006)
10. Extraction of Harpagophytum procumbens Roots
for African traditional medicine for treatment.
(Mahomed et al., 2006)
11. Extraction of Nigerian savannah plants for
comparative in vitro trypanocidal activities.
( Atawodi, 2004)
2.9 Total Phenolic Content (TPC)
Phenolic compounds are secondary metabolites in plants. In past 10 years,
phenolic compounds has increased the interest of its role in human health and nutrition
(Tew et al., 2002). In some phenolic compounds, it contains natural products which have
higher antioxidant activities than those in synthetic antioxidants (Lu et al., 2000). These
compounds are capable of modulating the activity of many enzymes (Carlo et al., 1999)
suggesting their involvement in biochemical and physiological processes, not only in
plants, but also in animals and humans (Rusak et al., 2008).These polyphenolic
antioxidants is suitable to be used for preserving the foods as it has protective effects
against microorganisms (Cowan, 1999; Vattem et al., 2004).

28
2.10 Total Flavonoids (TF)
Flavonoids are polyphenolic compounds which are commonly known for its
antioxidant activity. They are widely distributed in plants for their functions including
producing blue or red pigmentation to the fruits or vegetable and protection for the fruits
being attacked by the insect. The characteristics of flavonoids are also widely found in
some other foods such as tea, peanut, coffee, almond, beer, chocolate and wine.
Research found out that the flavonoids have strong antioxidant which is
important for the use in biological function and health. Nowadays, the new finding for
the use of flavonoids is beneficial to the health which can conquer the cancer and heart
disease (Filippos et al., 2007). However, the flavonoids are highly metabolized which
can change their chemical structure and diminish their ability to function as an
antioxidant when it is in human body. It will treat the flavonoids are foreign compounds
and modify them for rapid excretion in urine and bile. By following the activity of the
flavonoids, this process helps remove the unwanted compound is inducing, called Phase
II enzymes that is able to eliminate mutagens and carcinogens. Hence, it is valuable for
cancer prevention material (Stauth, 2007).
Figure 2.4 Molecular structure of The Flavonoids Backbone

29
2.11 Ultra Violet Visible Spectrometer
The UV-vis spectrometer consists of a light source, a sample compartment, a
diode-array detector, and a data acquisition computer. The sample compartment is
between the light source and the detector. The spectrometer measures the amount of
ultraviolet and visible light transmitted by a sample placed in the sample compartment.
Typically liquid samples are used, contained in a transparent ‘cuvette’ or ‘cell’. A flow-
through cell for kinetics experiments is currently in the sample compartment but another
standard cuvette can easily be substituted for it. The sample compartment in
spectrometer is made for 1 cm cuvette.
The wavelength at which a chemical absorbs light is a function of its electronic
structure, so a UV/Vis spectrum can be used to identify some chemical species. For a
particular chemical, the amount of the light absorbed is related to the amount of the
chemical between the light source and the detector, so a UV/Vis spectrum cab be used to
quantify some chemical species. To use UV/Vis data for quantitation ‘Transmittance’,
(T, the percentage of light transmitted by the sample) must be converted to
‘Absorbance’.
‘Beer’s Law’ states that absorbance and concentration in solution are linearly
related to a given chemical, so long as the length of the path through the solution is
fixed. Actually, this linear dependence only hold below Absorbance of 2. When less
than 1% of the light is transmitted (A>2), the detector behaves non-linearly. A UV/Vis
spectrum is only useful for quantifying chemical species after ‘calibration’. A series of
solutions of known concentration must be analyzed and their absorbencies are recorded.

30
UV-visible Spectrometry function is relatively straightforward. A beam of light
from a visible and/ or UV light source (colored red) is separated into its component
wavelengths by a prism or diffraction grating. Each monochromatic (single wavelength)
beam in turn is split two equal intensity beams by a half-mirrored device. One beam, the
sample beam (colored magenta), passes through a small transparent container (cuvette)
containing a solution of the compound being studied in a transparent solvent. The other
beam, the reference (colored blue), passes through an identical cuvette containing only
the solvent. The intensities of these light beams are then measured by electronic
detectors and compared. The intensity of the reference beam, which should have no light
absorption, is defined as Io. The intensity of the sample beam is defined as I over a short
period of time, the spectrometer automatically scans all the component wavelengths in
the manner described. The ultraviolet (UV) region scanned is normally from 200 to
400nm, and the visible portion is fro 400 to 800 nm.
Figure 2.5 A diagram of The Components of A Typical Spectrometer

31
2.12 Centrifuge
Centrifugation is one of the most important and widely applied research
techniques in biochemistry, cellular and molecular biology, and in medicine. A
centrifuge is a piece of equipment driven by a motor that puts an object in rotation
around a fixed axis, applying force perpendicular to the axis. Current research and
clinical applications rely on isolation of cells, subcellular organelles, and
macromolecules, often in high yields.
A centrifuge uses centrifugal force (g-force) to isolate suspended particles from
their surrounding medium on either a batch or a continuous-flow basis. Applications for
centrifugation are many and may include sedimentation of cells and viruses, separation
of subcellular organelles, and isolation of macromolecules such as DNA, RNA, proteins,
or lipids.
Figure 2.6 Refrigerated Centrifuge at FKKSA, UMP

32
2.12.1 Differential Centrifugation
Separation is achieved primarily based on the size of the particles in differential
centrifugation. This type of separation is commonly used in simple pelleting and in
obtaining partially-pure preparation of subcellular organelles and macromolecules. For
the study of subcellular organelles, tissue or cells are first disrupted to release their
internal contents. This crude disrupted cell mixture is referred to as a homogenate.
During centrifugation of a cell homogenate, larger particles sediment faster than smaller
ones and this provides the basis for obtaining crude organelle fractions by differential
centrifugation. A cell homogenate can be centrifuged at a series of progressively higher
g-forces and times to generate pellets of partially-purified organelles.
When a cell homogenate is centrifuged, unbroken cells and heavy nuclei pellet to
the bottom of the tube. The supernatant can be further centrifuged to pellet subcellular
organelles of intermediate velocities such as mitochondria, Iysosomes, and microbodies.
Some of these sedimenting organelles can be obtained in partial purity and are typically
contaminated with other particles. Repeated washing of the pellets by resuspending in
isotonic solvents and re-pelleting may result in removal of contaminants that are smaller
size (Figure 2.7) obtaining partially-purified organelles by centrifugal separation
(density gradient separation).

33
Figure 2.7 Differential Centrifugation (Rickwood et al., 2001)
2.12.2 Density Gradient Centrifugation
Density gradient centrifugation is the preferred method to purify subcellular
organelles and macromolecules. It can be generated by placing layer after layer of
gradient such as sucrose in a tube with the heaviest layer at the bottom and the lightest at
the top in either a discontinuous or continuous mode. The cell fraction to be separated is
placed on top of the layer and centrifuged. Density gradient separation can be classified
into two categories where they are Rate-zonal separation and Isopycnic separation.

34
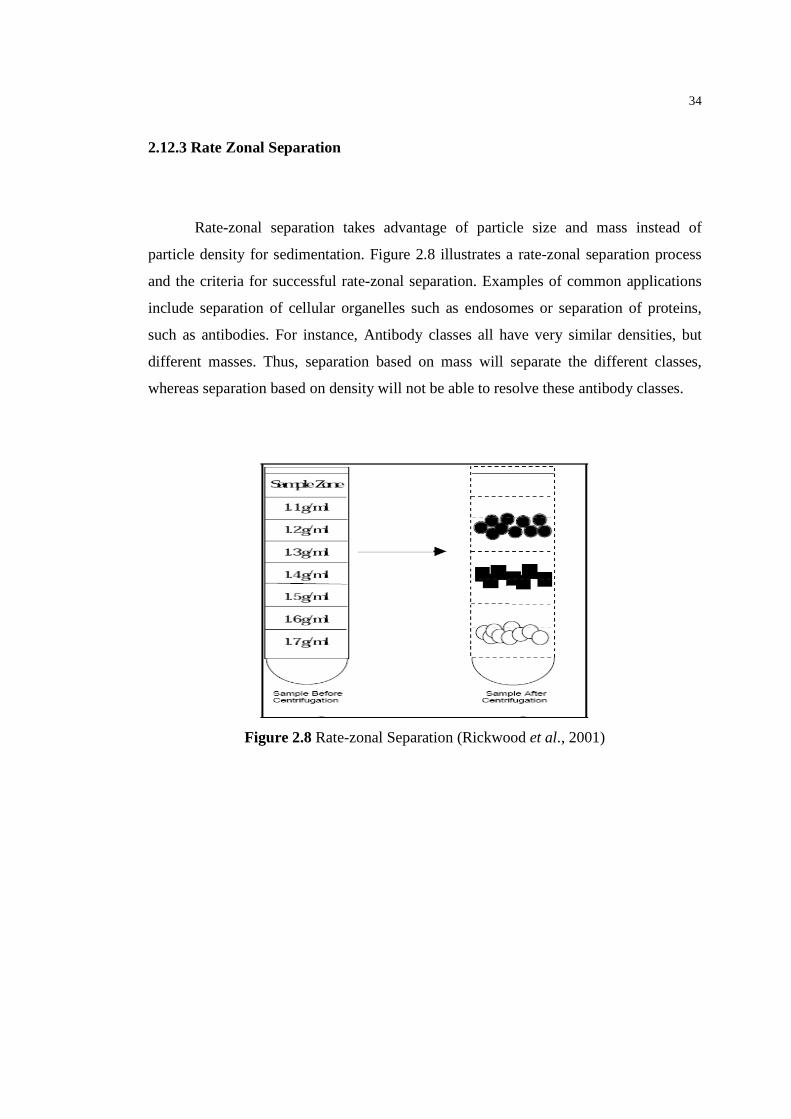
2.12.3 Rate Zonal Separation
Rate-zonal separation takes advantage of particle size and mass instead of
particle density for sedimentation. Figure 2.8 illustrates a rate-zonal separation process
and the criteria for successful rate-zonal separation. Examples of common applications
include separation of cellular organelles such as endosomes or separation of proteins,
such as antibodies. For instance, Antibody classes all have very similar densities, but
different masses. Thus, separation based on mass will separate the different classes,
whereas separation based on density will not be able to resolve these antibody classes.
Figure 2.8 Rate-zonal Separation (Rickwood et al., 2001)

35
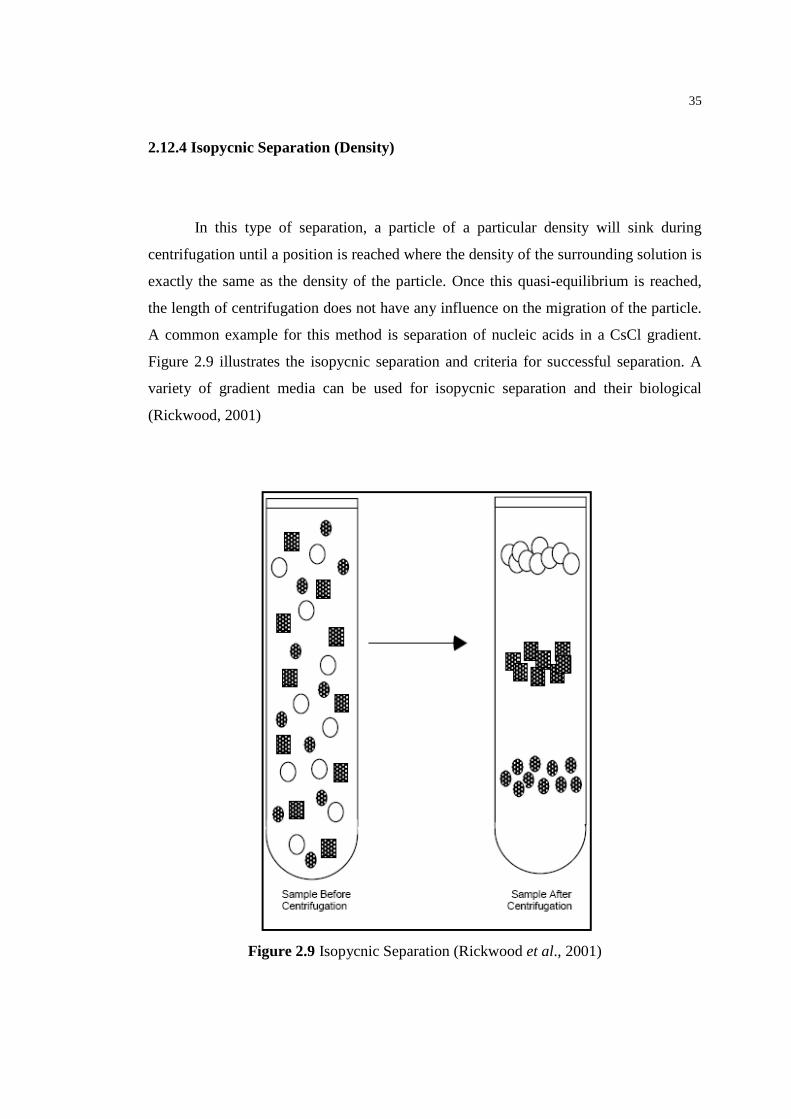
2.12.4 Isopycnic Separation (Density)
In this type of separation, a particle of a particular density will sink during
centrifugation until a position is reached where the density of the surrounding solution is
exactly the same as the density of the particle. Once this quasi-equilibrium is reached,
the length of centrifugation does not have any influence on the migration of the particle.
A common example for this method is separation of nucleic acids in a CsCl gradient.
Figure 2.9 illustrates the isopycnic separation and criteria for successful separation. A
variety of gradient media can be used for isopycnic separation and their biological
(Rickwood, 2001)
Figure 2.9 Isopycnic Separation (Rickwood et al., 2001)

CHAPTER 3
METHODOLOGY
3.0 Introduction In chapter 3, it discusses about the methodology with a specific focus on the
running of extraction of Pitaya peel. This method of extraction of pitaya peels by using
water as its solvent simply because of the natural of the water that do not bring harmful
side effect to human being and environmental friendly. The method that has been used
for this study is based on the study of which the title is Process balance and product
quality in the production of natural indigo from Polygonum tinctorium Ait applying
low-technology methods by Bechtold et al. (2003).
3.1 Methodology of Flow Chart
Methodology flow chart is used as a guideline for the experiment. As illustrated
in Figure 3.1, the process begins with the first heating stage and end with analysis by
using Ultra Violet visible spectrometer.
37
Figure 3.1 The Flow Chart of the Extraction of Pitaya Peels by Water
25g of dried Pitaya peels was added into 350mL of water and extracted with temperature ranging from 40oC to 80oC for 4 hours in the oven
The mixture was added with 150mL of water at temperature of 40oC for 2 hours and being filtered to obtain the filtrate.
Aluminum Sulfate solution with concentration (mg/L) ranging from 10 to 30 mg/L was added to the filtrate.
The floc was filtered by cotton fabric.
10g of wet floc was added into 80% of methanol.
Analysis
Total Phenolic Content (TPC)
Total Flavonoids (TF)
The mixture was centrifuged at 6000 rpm for 30 minutes. Supernatant was used for analysis
Pitaya peels were dried in the oven at 60oC and then being milled into particle size.
38
Figure 3.2 Procedure of 80% Methanolic Extraction
Figure 3.3 Procedure of Total Phenolic Content Assay
50 uL of methanolic extract was added to 5 mL of water.
500 uL of 1M Folin reagent and 500 uL of 20% w/v Na2CO3 were added in the mixture.
The mixture was mixed for 1 hour at room temperature.
The samples were analyzed by UV-vis spectrometer at 765 nm.
10 g of wet floc was added into 10 mL of 80% methanol in the flask
The solution was shaken for 2 hours at 37oC
The solution was filled in the centrifuge container in Refrigerated Centrifuge for 30 min at 6000 rpm.
The supernatant was taken for analysis of TPC and TF.
39
Figure 3.4Procedure of Total Flavonoids Assay
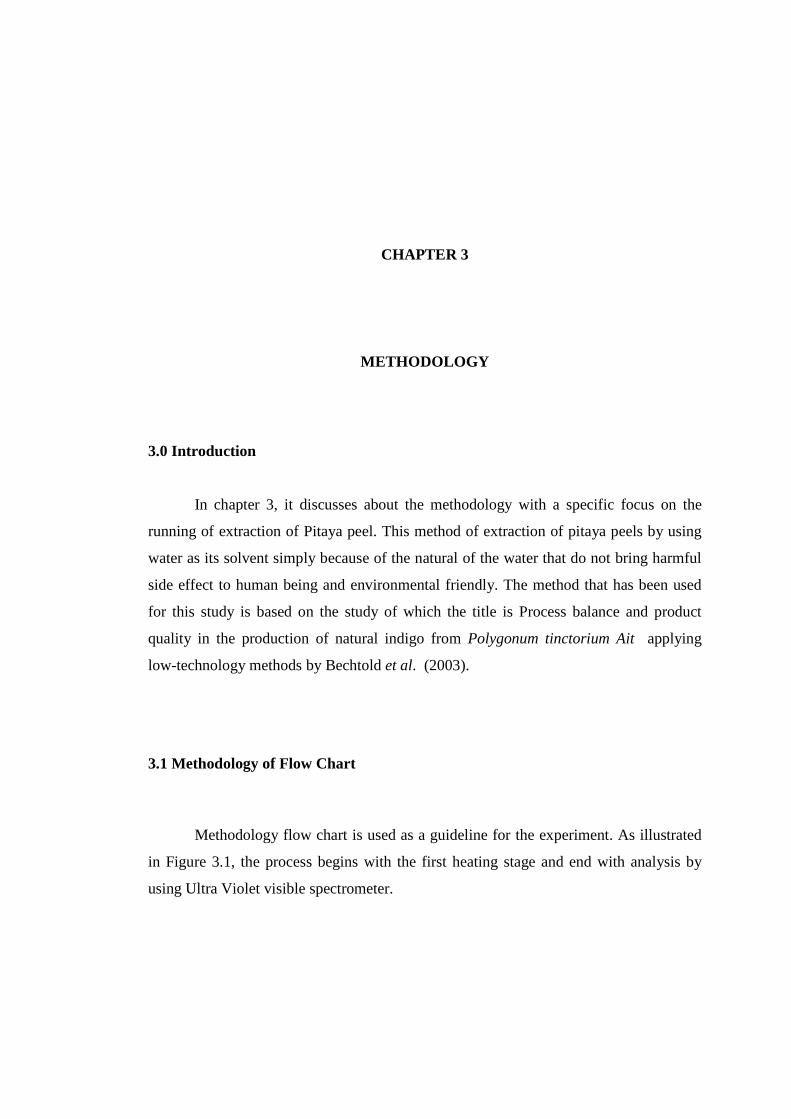
3.2 Preparation of Sample
Fresh pitaya was brought from the farm located at Kuantan Road for 40kgs. All
the pitaya fruits that have been bought from the farm were then being peeled at the same
time to ensure the condition of the properties is same for every single piece of the peels
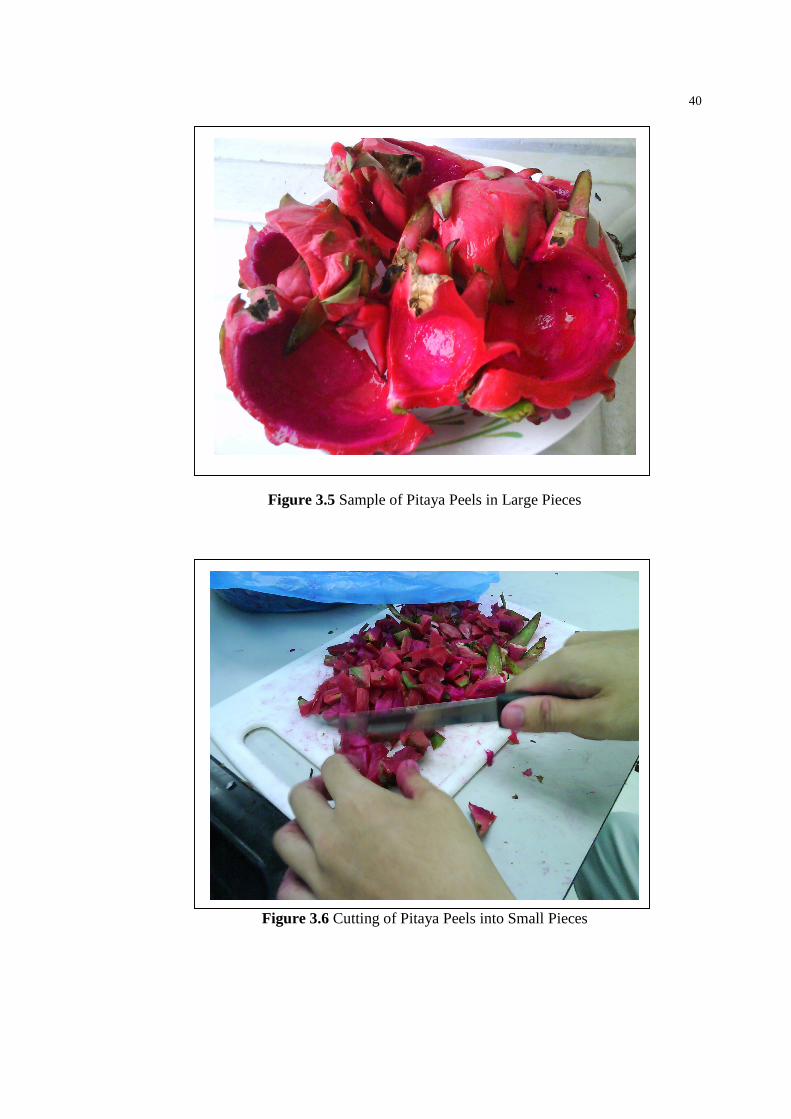
(Figure 3.5). After that, the peels were cut into pieces (about 2 x 2 cm in size) so that the
area exposed is larger instead of drying the whole big piece of the pitaya peels. The
process of cutting the pitaya peels is shown in the Figure 3.6
0.23 mL sample from 80% methanolic extract was added with 1.25 mL of water.
75 mL of 5% NaNO2 was added in the solution.
After 6 min at room temperature, 150mL of 10% AlCl3 was added in the previous solution.
After 5 min at room temperature, 0.5mL of 1M NaOH was added and mixed.
The samples were analyzed by UV-vis spectrometer at 510 nm.

40
Figure 3.5 Sample of Pitaya Peels in Large Pieces
Figure 3.6 Cutting of Pitaya Peels into Small Pieces

41
3.2.1 Drying of Pitaya Peels
Before the drying of pitaya peels in the oven, it was weighed by using the
balance provided in FKKSA lab. Then the tray was covered with aluminum foil to
ensure that the peels were not contaminated by any possible chemical substances. In the
Figure 3.7, it shows that the pitaya peels distributing evenly on the tray. Figure 3.8
shows pitaya peels being heated at temperature of 60oC for 24 hours in the oven
(HERAEUS/ MODEL UT 6). According to the previous study, temperature of 60oC is
suitable for the fruit of pitaya as it would not destroy its properties. After 24 hours, the
dried pitaya peels (Figure 3.9) were weighed to ensure its amount is enough for the use
in this experiment.
Figure 3.7 The Fresh Pitaya Peels on the Tray

42
Figure 3.8 Pitaya Peels in the Oven Before Drying
Figure 3.9 Pitaya Peels After Being Dried
43
3.2.2 Blending of Pitaya Peels into the Powder Form
Dried pitaya peels were then being blended by using the stainless steel blender
provided in the lab of FKKSA. Small amount of dried pitaya peels was added into the
blender so that all the dried pitaya peels would be blended into powder form. As shown
in the Figure 3.10, the pitaya peels were being blended into powder form. Figure 3.11
shows the dried pitaya peels in powder form.
Figure 3.10 Pitaya Peels Being Blended into Powder Form

44
Figure3.11 Pitaya Peels in Powder Form
3.3 Extraction of Pitaya Peels
3.3.1 Extraction of Pitaya Peels at the First Stage
In this experiment, extraction of pitaya waste by using water was introduced by
Bechtold et al. (2006). Based on this journal, the extraction was done at two stages. The
first one is the temperature varies from 40 to 80oC for 4 hours while the second stage is
at temperature of 40oC for 2 hours.
The dried pitaya peels were weighed and five grams of it was packed into each
plastic sealed bag as shown in the Figure 3.12. Each 5 g of dried pitaya peels was
introduced into the 1L conical flask. Then water of 350 ml was added into it. The
mixture was being stirred and put in the oven in FKKSA laboratory for 4 hours. For
convenience purpose, five conical flasks containing the 25 g of dried pitaya peels and

45
350ml of water were put in the oven at the same time for temperature of 40oC, 60oC and
80oC for 4 hours.
Figure 3.12 Each Plastic Sealed Bag Containing 25 g of Dried Pitaya Peels
3.3.2 Extraction of Pitaya Peels at Second Stage
After the first stage of extraction of pitaya peels was done for 4 hours and at the
temperature as stated. The mixture was then continued to be extracted at the temperature
of 40oC for 2 hours. Figure 3.13 shows that the extraction of pitaya peels in the conical
flasks after 2 hours at the temperature of 40oC.

46
Figure 3.13 Extraction of Pitaya Peels After 6 Hours
3.4 Filtration of The Pitaya Peels From The Extraction
After the extraction processes were completely done for the two stages heating of
pitaya peels in the conical flasks in the oven. The mixtures were then filtered by using
the fabric cotton to separate the pitaya peels and the filtrate. The filtrate obtained was
measured by using measuring cylinder and put aside to be ready for being added in the
different concentration of solution of aluminum sulfate.

47
3.5 Flocculation of Natural Dye From Extraction of Pitaya Peels
Flocculation is the process of binding small particles in the water together into
larger, heavier clumps which settle out relatively quickly. The larger particles are known
as floc. Properly formed floc will be settled out of the water quickly.
3.5.1 Preparation of Stock Solution of Aluminum Sulfate
For the preparation of stock solution of aluminum sulfate, 10g of alum was
weighed by using the analytical balance. It was then put in the 1L of volumetric flask
and 1L of water was added into it. The alum was dissolved by mixing it with the
magnetic stirrer.
3.5.2 Dilution of Concentration of Aluminum Sulfate
Concentration of aluminum sulfate is also one of the variables in this study. In
this experiment, concentration of aluminum sulfate is varies from 10mg/L, 15 mg/L,
20mg/L, 25mg/L and 30mg/L. In order to get the different concentration from the stock
solution, amount of the volume needed from the stock solution to obtain the desired
concentration of aluminum sulfate was calculated.

48
3.5.3 Stirring of Mixture of Aluminum Sulfate Solution and Pitaya Peels Filtrate
After the calculated concentration of aluminum sulfate from 10 to 30mg/L and
the filtrate of pitaya peels were mixed into the 5 beakers respectively, the stirring
process was done in the Basic Science Laboratory at FKKSA of Universiti Malaysia
Pahang. The mixtures were stirred at the speed at 20 rpm which is the best speed to be
used according to the previous study for 30 minutes. As shown in the Figure 3.14, the
mixtures being stirred at the speed of 20 rpm. The floc was formed slowly during the
stirring (Figure 3.15).
Figure 3.14 Pitaya Peels Filtrate and Aluminum Sulfate Solution Being Stirred

49
Figure 3.15 Flocs Being Formed in the Solution
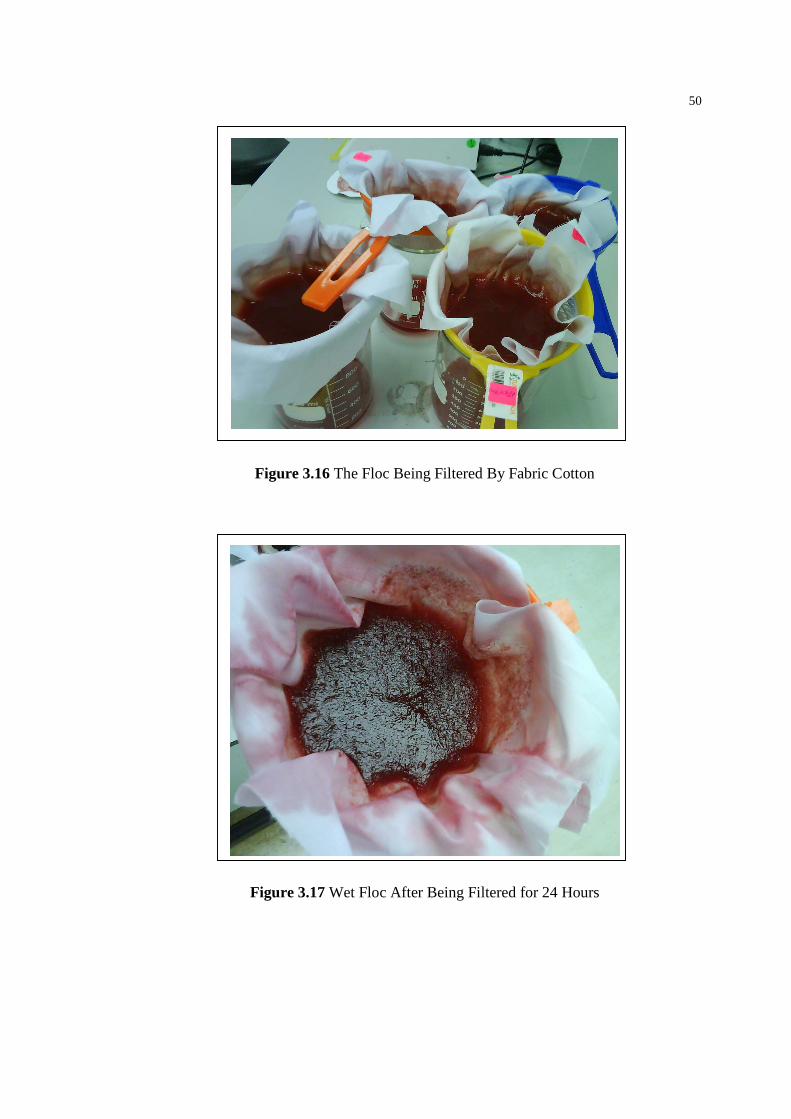
3.6 Filtration of Floc
After 30 minutes stirring of the mixture at speed of 20 rpm, the floc formed was
needed to be filtered out by using fabric cotton as shown in the Figure 3.16. The floc
was used for the analysis of total phenolic content and total flavonoids. The filtration of
the floc process was left for 24 hours to ensure the filtrate was filtered out at maximum.
Figure 3.17 shows the floc obtained after 24 hours.

50
Figure 3.16 The Floc Being Filtered By Fabric Cotton
Figure 3.17 Wet Floc After Being Filtered for 24 Hours

51
3.7 Analysis of Total Phenolic Content and Total Flavonoids
3.7.1 Preparation of 80% Methanolic Pitaya Peels Extracts
For the method to prepare the 80% of methanol, 10mL of water was mixed with
8mL of methanol to obtain 80% of methanolic solution. Then 10g of wet floc extracted
from the pitaya peels extracts were weighed and 10 uL of 80% methanolic solution was
mixed with it in the 250 mL of conical flask. Aluminum foil was used as a lid to avoid
the vapour of the 80% methanolic escape in the air.
After all the conical flasks filled with 10g of floc and 10 uL of 80% methanolic
solution were sealed with aluminum foils, they were then being put in the shaking
incubator as shown in Figure 3.18 at 6000 rpm for one hour at 37oC. Figure 3.19 shows
the mixture in the conical flask after being shaken under the specific condition as stated
above.
Figure 3.18 The Mixture Being Shaken at 37oC in The Shaking Incubator

52
Figure 3.19 The Mixture After Being Shaken for 1 Hour
3.7.2 Centrifugation
After shaking for mixture of the floc from the pitaya peels extracts and the 80%
of methanolic solution for one hour at the temperature of 37oC, the mixture were then
brought to be centrifuged at the speed of 6000 rpm for 30 minutes. The mixture has to be
filled in the 10mL container with tightly closed of the lid. When placing the container in
the Centrifuge, balancing is important as imbalance of the placement of the containers in
the Centrifuge would affect the spinning of the machine. Figure 3.20 shows that the
containers being placed in the Centrifuge. Figure 3.21 shows that the mixture before
being centrifuged while Figure 3.22 shows the clear supernatant after being centrifuged.
The sediment can be seen clearer than before being centrifuged.
53
Figure 3.20 The Mixture Containing in the Container Being Placed in Centrifuge
Figure 3.21 The Mixture Before Being Centrifuged

54
Figure 3.22 The Clear Supernatant and The Sediment After Being Centrifuged
3.7.3 Analytical Determination of Total Phenolic Content
The total phenolic content (TPC) was determined according to the Folin-
Ciocalteu method. 50 uL of extract (80% methanolic pitaya peels extract) was fixed in
5mL of distilled deionized water. Folin-Ciocalteu reagent (500uL, 1M) and Na2CO3
(500 uL, 20% w/v) were added, and the mixture was mixed thoroughly and allowed to
stand for 60 min at room temperature before the absorbance was measured at 765 nm.
The final results were expressed as gallic acid equivalents (GAE) in milligrams per gram
of wet weight. The total Phenolic Content of Pitaya is determined according to the Folin-
Ciocalteu colorimetric method (Bao et al., 1999). Figure 3.23 shows the mixture waiting
for being analysed at 765 nm.

55
Figure 3.23 Mixture to be Determined for Its Total Phenolic Content at 765 nm
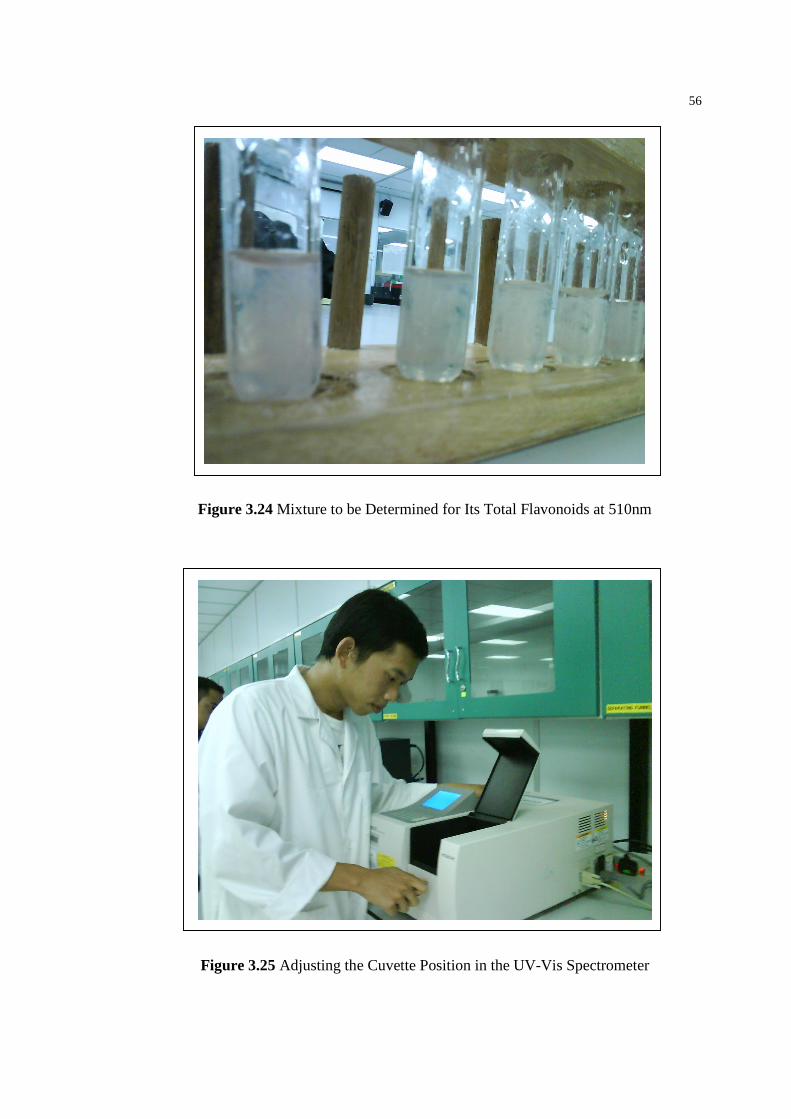
3.7.4 Analytical Determination of Total Flavonoids
Total flavonoid content was measured by the aluminum chloride colorimetric
assay. An aliquot (1ml) of 80% methonlic extracts was added to 10ml volumetric flask
containing 4ml of added H2O. The flask was added 0.3ml of 5% NaNO2. After 5 min,
0.3ml of the 10% AlCl3 was added. At 6 min, 2ml of 1M of NaOH was added and the
total volume was made up to 10ml add with H2O. The solution was mixed well and the
absorbance was measured against prepared reagent blank at 510nm (Figure 3.25) in the
UV-vis spectrometer. Total flavonoid content of pitaya peels were expressed as mg
catechin equivalents (CE)/25 g dry mass. Samples were analysed in duplicates. Figure
3.24 shows the mixture waiting to be analysed at 510 nm.

56
Figure 3.24 Mixture to be Determined for Its Total Flavonoids at 510nm
Figure 3.25 Adjusting the Cuvette Position in the UV-Vis Spectrometer

CHAPTER 4
RESULTS AND DISCUSSIONS
4.0 Result
The Folin-Ciocalteau assay is a fast and simple method to rapidly determine the
content of phenolics in samples. Phenolics or polyphenols are secondary plant
metabolites that are ubiquitously present in plants and plants products. Many of the
phenolics have been shown to contain high level of antioxidant activities. This
information has led to the determination of the total phenolic content of the sample
understudy. Furthermore, several studies have reported a significant correlation between
antioxidant activity present in some tropical vegetables with their total phenolic content,
suggesting that plants containing high phenolics can be a good source of antioxidants. In
addition, various studies have shown that phenolic antioxidants such as quercetin have
potential application as therapeutic drugs against free radical reactions (Rusak et al.,
2008).

58
4.1 Total Phenolic Content and Total Flavonoids Obtained at 40oC
The Folin-Ciocalteu method measures the reduction of the reagent by phenolic
compounds with the formation of a blue complex that can be measured at 750 nm
against gallic acid as a standard.
In this study, the objective of this experiment is to extract the natural color from
the pitaya waste by using water as the solvent in this extraction method. At the end of
this experiment, the total phenolic content and the total flavanoids that content in the
pitaya waste were determined by using UV-spectrometer.
4.1.1 Total Phenolic Content
In this work, water was used to extract the total phenolic and flavanoids content
from the pitaya peels. The temperature was varying from 40oC to 80oC. In order to
improve the flocculation and precipitation of the natural red color, different
concentration of the aluminum sulfate was also varied from 10mg/L to 30mg/L. Table
4.1 shows the absorbance of the red color by using the UV-spectrometer, and the total
phenolic content and total flavanoids content are expressed as gallic acid equivalents and
quercetin equivalents respectively.
From the data obtained which is shown in Table 4.1, the extract of the total
phenolic content in the pitaya peels was found to have increased as the concentration of
the aluminum sulfate increased. For this 40oC heating extraction of the pitaya peels,
59
10mg/L of the concentration of alum provided the lowest absorbance value which is
only 0.074 %T ABS at 710nm wavelength. This absorbance value can also be expressed
as 1.286 mg GAE/g. For the highest absorbance value that was obtained from this
extraction of pitaya waste is 0.174 %T ABS where it was contributed by the
concentration of alum at 25mg/L. Its gallic acid equivalent is 6.780 mg GAE/g. For the
concentration of alum sulfate solution at 25mg/L to 30mg/L, the value of the absorbance
has a slight decrease with the different of 0.769 %T ABS. Heating of the pitaya waste at
40oC could have said to provide average the total phenolic content ranging from 6.011 to
6.505 mg GAE/g.
From the concentration of 10mg/L of aluminum sulfate solution to 15 mg/L,
there is an increase of 61.86 % of the total phenolic content. From concentration of
15mg/L to 20 mg/L of aluminum sulfate, there is also an increase of the total phenolic
content of 27.12 % and also it does for concentration of 20 mg/L to 25 mg/L of
aluminum sulfate solution, the increase of the total phenolic content is 6.35 %. So it is
clear that the total phenolic content increases from 10mg/L to 25 mg/L of concentration
of aluminum sulfate solution with 55.51 %. But there is a sudden decrease with 80 % in
the total phenolic content from 25 mg/L to 30 mg/L of the aluminum sulfate solution.

60
Table 4.1 Value of absorbance and total phenolic content at 40oC
Temperature
40oC
Concentration of Aluminum Sulfate, mg/L
10
15
20
25
30
Absorbance,
%T ABS
0.059
0.072
0.080
0.082
0.068
Total
Phenolic
Content,
mg GAE/ga
0.451
1.181
1.621
1.731
0.932
a Total Phenolic Content is expressed as mg gallic acid equivalents (GAE) in 25 g of dry weight material.
Total Phenolic Content vs Concentration of Aluminum Sulfate
0
0.5
1
1.5
2
10 15 20 25 30
Concentration of Aluminum Sulfate, mg/L
To
tal P
hen
olic
Co
nte
nt,
mg
GA
E/g
Figure 4.1 Total Phenolic Content Versus Concentration of Aluminum Sulfate at 40oC

61
4.1.2 Total Flavonoids
While for the total flavonoids content in this study, its content increased when
there is an increase in the concentration of the aluminum sulfate (Table 4.2). From the
graph (Figure 4.2), it shows the amount of total flavanoids increases gradually. For this
40oC heating extraction of the pitaya waste, 10 mg/L of the concentration of alum
provided the lowest absorbance value which is only 0.066 %T ABS at 510 nm
wavelength. This absorbance value can also be expressed in 1.213 mg CE/g. For the
highest absorbance value that was obtained from this extraction of pitaya waste is 0.085
%T ABS where it was contributed by the concentration of alum at 30 mg/L.
At the concentration of aluminum sulfate at 10 mg/L, the value of the total
flavonoids that can be obtained is 1.21 mg CE/g while at concentration of 15mg/L of the
alum sulfate solution, the value of the total flavonoids is 1.253 mg CE/g, so there is an
increase of the total flavonoids of 3.24 %. For the concentration at 15 mg/L to 20mg/L
of aluminum sulfate solution, the percentage of the increase in the total flavonoids is
3.15 While from 20 mg/L to 25 mg/L of concentration of aluminum sulfate, there is also
an increase in the total flavonoids of 8.68 %, and for the last one, from 25 mg/L to 30
mg/L concentration of aluminum sulfate, the increase is 11.62 %. It is very obvious to
see that there is an increase of the total flavonoids in 40oC extraction from 10 mg/L to 30
mg/L of the concentration of aluminum sulfate with the percentage of 72.11.

62
Table 4.2 Absorbance value and the total flavanoids at 40oC
Temperature
40oC
Concentration of Aluminum Sulfate, mg/L
10
15
20
25
30
Absorbance,
%T ABS
0.066
0.068
0.07
0.076
0.085
Total
Flavanoids ,
mg QE/gb
1.213
1.253
1.294
1.417
1.603
b Total Flavanoid Content is expressed as catechin equivalents (CE) in 25 g of dry weight material.
Total Flavanoids vs Concentration of Aluminum Sulfate
0
0.5
1
1.5
2
10 15 20 25 30
Concentration of Aluminum Sulfate, mg/L
To
tal
Fla
van
oid
s,
mg
CE
/ g
Figure 4.2 Total Flavonoids Versus Concentration of Aluminum Sulfate at 40oC

63
4.2 Total Phenolic and Total Flavonoids Content Obtained at 60oC
4.2.1 Total Phenolic Content
Pitaya waste that was being heated in the oven by using water at the first heating
stage at 60oC for 4 hours, it was then heated again at 40oC for 2 hours according to the
previous study. Only then it was filtered and aluminum sulfate was added with
concentration ranging from 10 mg/L to 30 mg/L. The result (Table 4.3) shows that the
total phenolic content of the pitaya waste increased gradually.
From the data collected in Table 4.3, the value of the absorbance for the
extraction of pitaya waste at 60oC has increased gradually from 10 mg/L to 30 mg/L of
concentration of Alum. But there is a decrease in the value of total phenolic content at
25 mg/L concentration of alum and then increase again at 30 mg/L concentration of
alum. It can be explained for this happen as the optimum dose for the extraction of this
experiment is at 20 mg/L of concentration of alum to be used.
The total phenolic content increased from 0.846 to 2.055 mg GAE/g from
concentration of aluminum sulfate solution at 40oC at 10 mg/L to 15 mg/L with 58.82 %.
While from 15 mg/L to 20 mg/L of the concentration of aluminum sulfate solution being
added, the value of the total phenolic content increased with amount of 1.15 mg GAE/g
where the increase in the percentage is 35.96. From 20 mg/L to 25 mg/L of the
concentration of aluminum sulfate solution, it shows that there is a sudden decrease of
the total phenolic content where 48.22 % has been decreased but it increased with 11.26
% after 25 mg/L of the concentration of aluminum sulfate solution with the value of total
phenolic content at 30 mg/L of concentration of aluminum sulfate is 2.44. So, from 10

64
mg/L to 20 mg/L of the concentration of aluminum sulfate, there is an increase of
73.63% in the total phenolic content.
Table 4.3 Values of absorbance and total phenolic content at 60oC
Temperature
60oC
Concentration of Aluminum Sulfate, mg/L
10
15
20
25
30
Absorbance,
%T ABS
0.066
0.088
0.109
0.09
0.095
Total
Phenolic
Content ,
mg GAE/ga
0.846
2.055
3.209
2.165
2.439
a Total Phenolic Content is expressed as mg gallic acid equivalents (GAE) in 25 g of dry weight material.

65
Total Phenolic Content vs Concentration of Aluminum Sulfate
0
0.5
1
1.5
2
2.5
3
3.5
10 15 20 25 30
Concentration of Aluminum Sulfate, mg/L
To
tal
Ph
en
oli
c C
on
ten
t,
mg
GA
E/g
Figure 4.2 Total Phenolic Content Versus Concentration of Aluminum Sulfate at 60oC
4.2.2 Total Flavonoids
While for the study of total flavonoids content in this experiment, it is clearly
showing that the total flavonoids content increase its content gradually as the
concentration of the aluminum sulfate is increased. The lowest value of total flavonoids
content is 1.458 mg CE/g at the concentration of aluminum sulfate of 10 mg/L. The
highest value of the total flavonoid content is 2.238 mg CE/g at the concentration of 30
mg/L.
In the extraction of the pitaya peels, the concentration of aluminum sulfate
produced total flavonoids at 10 mg/L and 15 mg/L are 1.46 mg CE/g and 1.62 mg CE/g
respectively. The percentage of the increase of the total flavonoids is 10.22. From 15

66
mg/L to 20 mg/L concentration of aluminum sulfate, the total flavonoids increased from
1.62 CE/g to 1.83 CE/g, which has increased 11.44 %, while from 20 mg/L to 25 mg/L
of concentration of aluminum sulfate, the total flavonoids increased with amount of
0.276 mg CE/g equivalent to 13.09 %. Then from 25 mg/L to 30 mg/L of the aluminum
sulfate concentration solution, the total flavonoids increased to 2.24 mg CE/g. Overall
the total flavonoids in this extraction of pitaya peels at the temperature of 60oC has
increased gradually from 10 mg/L to 30 mg/L of the concentration of aluminum sulfate
solution.
Table 4.4 Values of absorbance value and total flavonoids content at 60oC
Temperature
60oC
Concentration of Aluminum Sulfate, mg/L
10
15
20
25
30
Absorbance,
%T ABS
0.078
0.086
0.0.096
0.109
0.115
Total
Flavanoids ,
mg QE/gb
1.458
1.624
1.833
2.109
2.238
b Total Flavanoid Content is expressed as catechin equivalents (CE) in 25 g of dry weight material.

67
Total Flavanoids vs Concentration of Aluminum Sulfate
0
0.5
1
1.5
2
2.5
10 15 20 25 30
Concentration of Aluminum Sulfate, mg/L
To
tal
Fla
va
no
ids
, m
g C
E/ 2
5g
Figure 4.4 Total Flavonoids Versus Concentration of Aluminum Sulfate at 60oC
4.3 Total Phenolic and Total Flavonoids Obtained at 80oC
4.3.1 Total Phenolic
In this experiment, the data in Table 4.5 shows the lowest value of the total
phenolic contents obtained is 1.286 mg GAE/g at the concentration of alum sulfate at 10
mg/L. While for the highest value of total phenolic content is 3.319 mg GAE/g at the
concentration of aluminum sulfate at 20 mg/L. So it can be concluded that the optimum
dosage for this experiment to extract the optimum total phenolic content is at 20 mg/L of
the concentration of aluminum sulfate.

68
From the graph in the Figure 4.5, it shows that initially the value of the total
phenolic content increased from from 10 mg/L until 20 mg/L of concentration of
aluminum sulfate solution for 61.26 % but the value of the total phenolic content
decreased start from 20 mg/L until 30 mg/L of the concentration of aluminum sulfate
solution for 36.42 %. From the concentration of aluminum sulfate solution at 10 mg/L to
15 mg/L, there is 23.03 % increase in the total phenolic content, also for the
concentration of aluminum sulfate solution at 15 mg/L to 20 mg/L, where there is 49.67
% increase in the total phenolic content. While for the concentration of aluminum sulfate
solution from 20 mg/L to 25 mg/L, it decreased for 39.17 % of the total phenolic content
also same for 25 mg/L to 30 mg/L of the concentration of aluminum sulfate where 13.02
% decrease in the value of total phenolic content.
Table 4.5 Values of absorbance value and total phenolic content at 80oC
Temperature
80oC
Concentration of Aluminum Sulfate, mg/L
10
15
20
25
30
Absorbance,
%T ABS
0.074
0.081
0.111
0.094
0.089
Total
Phenolic
Content ,
mg GAE/ga
1.286
1.670
3.319
2.385
2.101
a Total Phenolic Content is expressed as mg gallic acid equivalents (GAE) in 25 g of dry weight material.

69
Total Phenolic Content vs Concentration of Aluminum Sulfate
00.5
11.5
22.5
33.5
10 15 20 25 30
Concentration of Aluminum Sulfate, mg/L
To
tal P
he
no
lic C
on
ten
t,
mg
GA
E/ 2
5g
Figure 4.5 Total Phenolic Content Versus Concentration of Aluminum Sulfate at 80oC
4.3.2 Total Flavonoids
While for the study of total flavonoids content in this experiment, the data in
Table 4.6 the lowest value obtained is 0.433 mg CE/g at the concentration of aluminum
sulfate of 10 mg/L. For the highest total flavanoids content is 1.833 mg CE/g at the
concentration of aluminum sulfate at 20 mg/L.
From the graph obtained in Figure 4.6, it shows that there is an increase in the
value of total flavonoids from 10 mg/L to 20 mg/L of the concentration of aluminum
sulfate solution, after that there is just a small decrease in the value of the total
flavonoids for 4.56 % from 20 mg/L to 30 mg/L concentration of aluminum sulfate
solution. At 10 mg/L of the concentration of aluminum sulfate solution, the value of the

70
total flavonoids is 1.33 mg CE/g and it increased to 1.39 mg CE/g at 15 mg/L
concentration of aluminum sulfate solution. Only 4.49% of the total flavonoids is
increased and it is also for the total flavonoids increased from the concentration of
aluminum sulfate solution from 15 mg/L to 20 mg/L, where 21.97 % of the total
flavonoids is increased. But the value of the total flavonoids decreased from 1.79 mg
CE/g to 1.69 mg CE/g, where only 6.08 % has been decreased, the value of the total
flavonoids then increased to 1.71 mg CE/g at the concentration of aluminum sulfate of
30 mg/L. So from the overall, there is an increase of the total flavonoids with 25.47%
from 10 mg/L to 20 mg/L of the concentration of aluminum sulfate solution. Meanwhile,
there is a decrease of total flavonoids with 4.57 % from 20 mg/L to 30 mg/L of the
concentration of aluminum sulfate solution.
Table 4.6 Values of absorbance and total flavonoids content at 80oC
Temperature
80oC
Concentration of Aluminum Sulfate, mg/L
10
15
20
25
30
Absorbance,
%T ABS
0.026
0.075
0.096
0.089
0.090
Total
Flavanoids ,
mg CE/gb
0.433
1.396
1.833
1.686
1.707
b Total Flavanoid Content is expressed as catechin equivalents (CE) in 25 g of dry weight material.

71
Total Flavanoids vs Concentration of Aluminum Sulfate
0
0.5
1
1.5
2
10 15 20 25 30
Concentration of Aluminum Sulfate, mg/L
To
tal
Fla
von
oid
s,
mg
CE
/ 25
g
Figure 4.6 Total Flavonoids Content Versus Concentration of Aluminum Sulfate at
80oC
4.4 Comparison of The Total Phenolic Content at Different Temperatures
From the graph in Figure 4.7, it shows clearly that the extraction at 40oC of
pitaya waste using water produced the lowest content of total phenolic among the 60oC
and 80oC. The reason for the extraction produced at the low content of total phenolic at
40oC is because at this temperature which might be considered as low, is not enough to
extract the optimum total phenolic contented in the pitaya waste.
With the comparison of the total phenolic content at the concentration of
aluminum sulfate at 10 mg/L, we can see from the graph showing that total phenolic
content produced at the highest value is at temperature of 80oC which is 1.286 mg
GAE/mg. The lowest value of total phenolic content is 0.451 mg GAE/g which is at the

72
temperature of 40oC. For heating at temperature of 60oC, the total phenolic content is
0.846 mg GAE/g.
For the comparison of total phenolic content at 15 mg/L, concentration of
aluminum sulfate, the highest value of total phenolic content is 2.055 mg GAE/g at 60oC
while for the lowest value of total phenolic content is 1.181 mg GAE/g at the
temperature of 40oC. For heating at the first stage which the temperature at 80oC, the
total phenolic content has the value of 1.670 mg GAE/g.
Concentration of aluminum sulfate at 20 mg/L actually can be said to be at the
optimum dose for this extraction of total phenolic content from the pitaya waste by using
water. From the graph (Figure 4.7), it shows very clear that it produced the highest value
of total phenolic content among the concentration of aluminum sulfate used ranging
from 10 to 30 mg/L. The highest value of the total phenolic content is 3.319 mg GAE/g
which is at the temperature of 80oC. The lowest value of the total phenolic content is
1.621 mg GAE/g at the temperature of 40oC. For heating the pitaya waste at temperature
of 60oC, its total phenolic content is 3.209 mg GAE/g.
At the concentration of 25 mg/L of aluminum sulfate, the highest value of total
phenolic content is 2.385 mg GAE/g which is at the temperature of 80oC while for the
lowest value of total phenolic content is 1.731 mg GAE/g at the temperature of 40oC.
For extraction of pitaya waste at temperature of 60oC, the value of the total phenolic
content is 2.165 mg GAE/g.
At 30 mg/L of concentration of aluminum sulfate, extraction of pitaya waste at
the temperature of 60oC has produced the highest value of total phenolic content which
is 2.439 mg GAE/mg. The lowest value of total phenolic content is 0.932 mg GAE/mg

73
which is at the temperature of 40oC. For temperature of 80oC, the value of the total
phenolic content is 2.101 mg GAE/g.
The different between the values of the highest total phenolic content at 80oC
which is 3.310 mg GAE/g and the lowest total phenolic content at 40oC which is 3.210
mg GAE/g is 47.7 %. While when the highest value of total phenolic content is
compared with the second highest total phenolic content where the value is 3.210 mg
GAE/g, the different is 3.1%.
It is very clear to see from the graph shown in Figure 4.7 that the different
temperatures have produced the highest total phenolic content at the concentration of
aluminum sulfate at 25 mg/L only. So it can be concluded that the optimum dose of
concentration of aluminum sulfate to be used for the extraction of pitaya peels is at 25
mg/L.
The graph also shows clearly that the values of the total phenolic content
decreased start after 25 mg/L of the concentration of aluminum sulfate for all the
temperatures. The reason for this phenomenon can be said that the high concentration of
aluminum sulfate (larger than 25 mg/L) would have been very acidic. The high acidity
of the aluminum sulfate reacted with the compound of total phenolic content which have
changed it to the another type of compound. Since the total phenolic content have been
changed to the another compound after the reaction of the high concentration of
aluminum sulfate, hence, the total phenolic content could not be detected during the
analysis for it content.

74
Table 4.7 Comparison of total phenolic content at different temperatures
Total
Phenolic
Content,
mg GAE/g
Concentration of Aluminum Sulfate, mg/L
10
15
20
25
30
40 oC
0.451
1.181
1.621
1.731
0.932
60 oC
0.846
2.055
3.209
2.165
2.439
80 oC
1.286
1.670
3.319
2.385
2.101
Total Phenolic Content vs Concentration of Aluminum Sulfate
00.5
11.5
22.5
33.5
10 15 20 25 30
Concentration of Aluminum Sulfate, mg/L
To
tal
Ph
eno
lic
Co
nte
nt,
m
g G
AE
/ 25
g
40°C
60°C
80°C
Figure 4.7 Comparison of Total Phenolic Content at Different Temperatures

75
4.5 Comparison of The Total Flavonoids at Different Temperatures
Total flavonoids are compared with different concentration of aluminum sulfate
in the graph shown in Figure 4.8. From the graph in Figure 4.8, it is clearly showing that
the extraction at 80oC is in the middle of the two lines. While the blue color line which
represents the extraction at the temperature of 40oC is at the bottom which also means it
has the lowest content of total flavanoids at that specific temperature. While for the top
one the line of pink is seen to have the highest content of total flavonoids among all
three variables temperature. The highest content of total flavonoids is at the temperature
of 60oC. So for the pitaya waste to be extracted for its optimum content, temperature of
60oC is the most preferable compared with 40oC and 80oC.
Concentration of aluminum sulfate at 10 mg/L produced at almost the same
amount of total flavonoids content in the pitaya peels. The highest of the total flavonoids
content that was extracted is 1.457 mg CE/g at the temperature of 60oC. While for the
lowest content of total flavonoids in 10mg/L concentration of aluminum sulfate is 1.212
mg CE/g which is at the temperature of 40oC. For temperature at 80oC, the extraction of
the content of total flavonoids from pitaya peels is found to be at 1.457 mg CE/g.
For the concentration of aluminum sulfate at 15 mg/L, it shows the highest
extraction of total flavonoids is at the temperature of 60oC which the value is 1.624 mg
CE/g. Lowest content of total flavonoids being extracted in this concentration of
aluminum sulfate is 1.253 mg CE/g at the temperature of 40oC. Meanwhile, under the
temperature of 80oC, the extraction of total flavonoids was able to be obtained is found
to be 1.396 CE/g.
Extraction of pitaya waste at the concentration of 20 mg/L was studied in this
research as well. The highest total flavonoids content that could be obtained in this

76
concentration of aluminum sulfate was found to be at the temperature of 60oC which the
value of the total flavonoids content is 1.833 mg CE/g. The lowest total flavonoids
content that was obtained from this concentration of aluminum sulfate is at the
temperature of 40oC where the value of the content of total flavonoids is 1.294 mg CE/g.
For the extraction of pitaya waste at the temperature of 80oC, the value of total
flavonoids obtained is 1.789 mg CE/g.
Pitaya peels being extracted at 25 mg/L of the concentration of aluminum sulfate
was found to have the highest content of total flavonoids at the temperature of 60oC and
value is 2.109 mg CE/g. While value of the total flavonoids being extracted out from the
pitaya waste found to be at the lowest one is 1.417 mg CE/g at the temperature of 40oC.
For the extraction at the temperature of 80oC, the value of total flavanoids is 1.686 mg
CE/g.
Finally for the concentration of aluminum sulfate at 30 mg/L, the highest value
of total flavonoids is 2.238 mg CE/g at the temperature of 60oC. The lowest value of
total flavonoids in this extraction method at this concentration is 1.603 mg CE/g at the
temperature of 40oC. For the temperature of 80oC, the extraction of the total flavonoids
is found to be at the value of 1.707 mg CE/g.
The different between the values of the highest of the total flavonoids at 60oC
which is 2.23 mg CE/g and lowest of the total flavonoids content at 1.71 mg CE/g at
40oC of the concentration of aluminum sulfate at 30 mg/L is 28.2 %. While comparing
with the second highest value of total flavonoids content at 80oC is 23.3 %.
From the graph of the comparison of the three different temperatures producing
the total flavonoids content, it is clear to see that the values of the total flavonoids

77
content was getting much higher when the concentration of aluminum sulfate increased.
It can be said that the total flavonoids compound was not reacted with the aluminum
sulfate when the concentration was increased whilst it can be extracted more and the
total flavonoids content increased when the concentration of aluminum sulfate is higher.
The graph also shows that the value of the total flavonoids being extracted at the
temperature of 60oC but not 80oC because it can be explained that the total flavonoids
compound was destroyed by the temperature which is higher than 60oC. As a result, total
flavonoids could not be detected during the analysis for its content. Hence, the total
flavonoids content can be higher at the temperature of the range of 60oC to
80oC.
Table 4.8 Comparison of total flavonoids content at different temperatures
Total
Flavonoids
Content,
mg CE/g
Concentration of Aluminum Sulfate, mg/L
10
15
20
25
30
40 oC
1.212
1.252
1.293
1.416
1.602
60 oC
1.457
1.623
1.833
2.109
2.238
80 oC
1.333
1.395
1.789
1.686
1.707

78
Total Flavonoids vs Concentration of Aluminum Sulfate
0
0.5
1
1.5
2
2.5
10 15 20 25 30
Concentration of Aluminum Sulfate, mg/L
To
tal
Fla
von
oid
s,m
g C
E/
25g
40°C
60°C
80°C
Figure 4.8 Total Flavonoids Versus Concentration of Aluminum Sulfate at Different
Temperatures
4.6 Volume of Filtrate
Volume of filtrate was obtained from the filtration by using the cotton fabric.
The floc was used for the determination of total phenolic content and total flavonoids
analysis while the filtrate obtained is just to show the relation between the concentration
of the aluminum sulfate and the filtrate collected after one day filtration process. The
result is shown in Table 4.9.
For the extraction of pitaya waste at the temperature of 40oC, it shows that the
volume of filtrate increases when there is an increase in the concentration of the
aluminum sulfate. The filtrate volume was measured using measuring cylinder and the
reading is 195 mL at the concentration of 10 mg/L which is the highest volume that was

79
obtained. While for the lowest filtrate volume that was measured is 70 mL at the
concentration of aluminum sulfate of 30 mg/L.
Extraction of pitaya waste at temperature of 60oC can be seen to have the same
trend as in the temperature of 40oC, where the higher the concentration of aluminum
sulfate was added to the solution, the lesser the volume of filtrate could be obtained. So
in this extraction of pitaya waste at 60oC, the highest volume of filtrate that was
measured is 122 mL while for the lowest one, which is 62 mL at the temperature of
60oC.
While for the extraction at the temperature of 80oC, the trend of increase in the
volume of filtrate is same as in the previous variables, 40oC and 60oC. The highest
volume of filtrate that was obtained is in the concentration of aluminum sulfate of
10mg/L. For the volume which is at the lowest value is at 30mg/L, concentration of
aluminum sulfate.
Hence, it can be concluded that the increase in the concentration of the aluminum
sulfate would actually decrease the volume of the filtrate from the after filtration of the
floc by using the cotton fabric in this experiment. This phenomenon is because the
higher the concentration of the aluminum sulfate is able to form more floc in the
solution. Aluminum sulfate functions as a coagulant to coagulate the red dyes extraction
from after the heating of the pitaya waste with different temperature.

80
Table 4.9 Volume of filtrate obtained at different temperature
Volume of
Filtrate, ml
Concentration of Aluminum Sulfate, mg/L
10 15 20 25 30
40oC 195 95 71 73 70
60oC 122 120 95 62 62
80oC 80 60 40 39 35
Volume of Filtrate vs Concentration of Aluminum Sulfate
0
50
100
150
200
250
10 15 20 25 30
Concentration of Aluminum Sulfate, mg/L
Vo
lum
e o
f F
iltr
ate,
ml
Figure 4.9 Filtrate Volume Versus Concentration of Aluminum Sulfate at 40oC

81
Volume of Filtrate vs Concentration of Aluminum Sulfate
0204060
80100120140
10 15 20 25 30
Concentration of Aluminum Sulfate, mg/L
Vo
lum
e o
f F
iltr
ate,
ml
Figure 4.10 Filtrate Volume Versus Concentration of Aluminum Sulfate at 60oC
Volume of Filtrate vs Concentration of Aluminum Sulfate
0
20
40
60
80
100
10 15 20 25 30
Concentration of Aluminum Sulfate, mg/L
Vo
lum
e o
f F
iltr
ate,
ml
Figure 4.11 Filtrate Volume Versus Concentration of Aluminum Sulfate at 80oC

82
Figure 4.12 Volume of Filtrate at Different Concentration of Aluminum Sulfate
4.7 Weight of Floc
The extraction of the pitaya waste process was done by heating it in the oven, the
pitaya waste was filtered by using the plastic sieve. The filtrate is collected and then
concentration of aluminum sulfate ranging from 10mg/L, 15mg/L, 20mg/L, 25mg/L and
30 mg/L was added into five beakers respectively. The solution in the five beakers was
stirred at the speed of 20 rpm for 45 minutes. During the stirring process, the floc could
be seen increase in its size. After 45 minutes, the stirring process was stopped and the
filtration of this solution was done by using cotton fabric.
From the graph that is shown in Figure 4.13, it shows the weight of the floc
obtained at the extraction of pitaya peels at 40oC increased in its weight gradually from

83
67.94 g to 285.8 g. The percentage of weight floc being increased from 10 mg/L to 30
mg/L of the concentration of aluminum sulfate is 76.
For the extraction of pitaya peels at 60oC, it has the same trend like the one in the
extraction of pitaya peels at 40oC where from 10 mg/L to 30 mg/L of the concentration
of aluminum sulfate solution, the weight of the floc obtained increase as well for
33.41%.
At the temperature of 80oC of the extraction of pitaya peels, the trend of the
graph as shown in Figure 4.15 is the wet floc weight increases gradually from 10 mg/L
to 30 mg/L of the concentration of aluminum sulfate solution with 29.67 %.
Table 4.10 Weight of floc at different temperatures
Weight of
Floc, g
Concentration of Aluminum Sulfate, mg/L
10
15
20
25
30
40oC 67.94 175.00 223.32 277.2 285.8
60oC 195.88 248.9 244.95 280.56 294.17
80oC 187.1 211.6 238.00 249.48 266.06

84
Weight of Wet Floc vs Concentration of Aluminum Sulfate
050
100150200250300350
10 15 20 25 30
Concentration of Aluminum Sulfate, mg/L
Wei
gh
t o
f W
et F
loc,
g
Figure 4.13 Weight of Floc Versus Concentration of Aluminum Sulfate at 40oC
Weight of Wet Floc vs Concentration of Aluminum Sulfate
050
100150
200250300350
10 15 20 25 30
Concentration of Aluminum Sulfate, mg/L
Wei
gh
t o
f W
et F
loc,
g
Figure 4.14 Weight of Floc Versus Concentration of Aluminum Sulfate at 60oC

85
Weight of Wet Foc vs Concentration of Aluminum Sulfate
0
50
100
150
200
250
300
10 15 20 25 30
Concentration of Aluminum Sulfate, mg/L
Wei
gh
t o
f W
et F
loc,
g
Figure 4.15 Weight of Floc Versus Concentration of Aluminum Sulfate at 80oC
4.8 Color of Supernatant at Different Temperatures
From the observation during the experiment, the brightness of the color of the
supernatant changed from low to high of the concentration of the aluminum sulfate. As
shown in the figures below, it is clear to see the color getting pale when the
concentration of the aluminum sulfate is higher. It can be explained that the acidity of
the aluminum sulfate can actually result in reducing of the brightness of the pitaya peels
red color.

86
Figure 4.16 Supernatant Color at 40oC
Figure 4.17 Supernatant Color at 60oC

87
Figure 4.18 Supernatant Colors at 80oC

CHAPTER 5
CONCLUSION AND RECOMMENDATIONS
5.1 Conclusion
Experiment of the extraction of total phenolic and total flavonoids content
involving temperature ranging from 40oC to 80oC and also the different concentration of
aluminum sulfate from 10 mg/L to 30 mg/L. After this experiment had been done, this
study found out that different temperatures at different concentration of aluminum
sulfate do influence the value of the total phenolic and total flavonoids content. From the
observation during the experiment, the color of the supernatant was observed that the
colors of extract change due to the concentration of aluminum sulfate.
From this study, the highest value of total phenolic content is 3.31 mg GAE/ 25 g
at the temperature of 80oC. While for the highest value of total flavonoids content is 2.23
mg CE/ 25 g at the temperature of 60oC. From overall, temperature of 40oC produced the
less total phenolic and total flavonoids content among all the temperatures studied in this
experiment. Here, it can be concluded that temperature of 80oC could have produced
higher total phenolic content and the total flavonoids could have produced at

89
temperature at 60oC. So, it is clearly showing that temperature of 40oC is not enough to
extract the total phenolic and total flavonoids content.
5.2 Recommendations
This study can actually be improved by many aspects either in chemical used or
the equipments used to analyze the total phenolic and total flavonoids content to obtain
the high accuracy of the extract values from the pitaya peels.
The coagulant used in this study is aluminum sulfate. It is recommended that the
α-cyclodextrin is to be used as the flocculant to improve the flocculation of the extract of
pitaya peels. By using this flocculant, it might show the obvious different of the values
of total phenolic and total flavonoids content at different temperatures.
The presented data for total phenolic and total flavonoid content are a basis for
assessment of the preventive role of fruits and vegetables against free radicals effects.
There is a necessarily to study towards in-depth on the spectrum of multiple phenolics
and flavonoids representatives. Betacyanins should also be studied because it also
contributes to the total phenolics due to its phenols structure in the molecules.
The temperature to extract the pitaya peels can be up to 80oC to study that
whether the higher temperature could have extracted higher total phenolic content whilst
the temperature with small interval from 60oC to 80oC to obtain the exact temperature of
total flavonoids to be extracted at its highest temperature between the range.
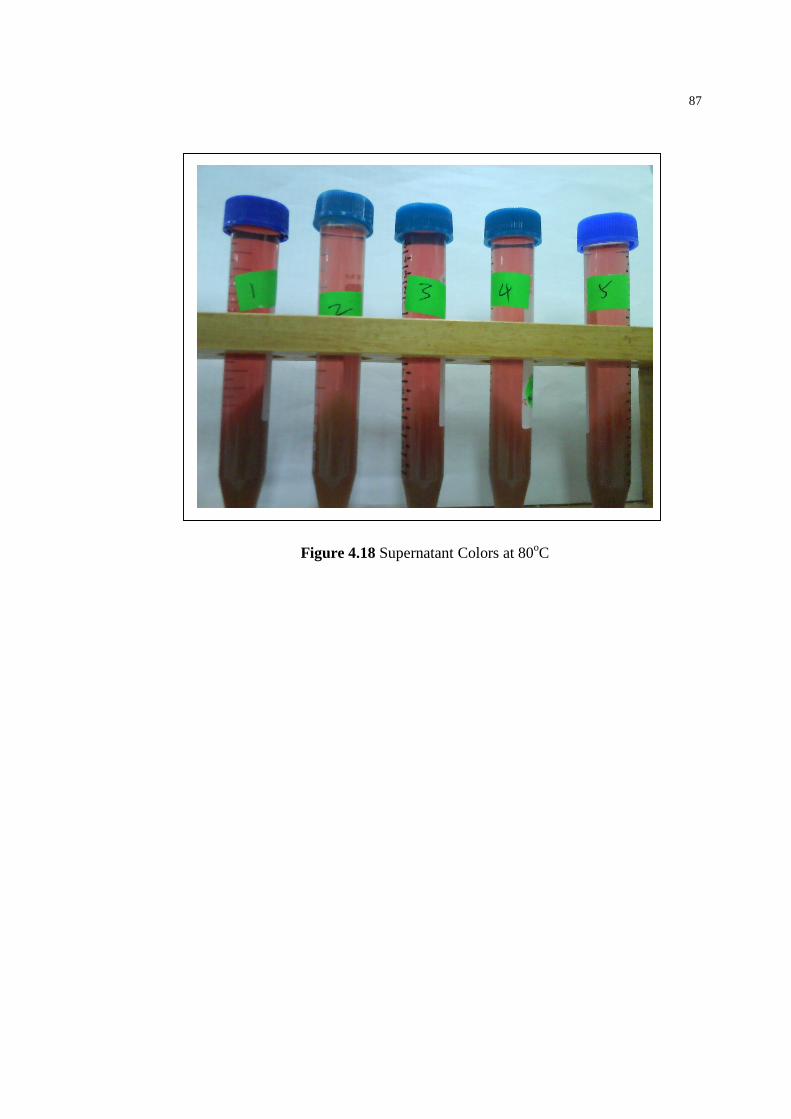
90
REFERENCES
Ali, S., Hussain, T. and Nawaz, R., (2008). Optimatization of Alkaline Extraction of
Natural Dye From HennaLleaves and Its Dyeing on Cotton by Exhaust Method.
Journal of Cleaner Production.
Atawodi, S.E. (2004). Comparative in Iitro Trypanocidal Activities of Petroleum Ether,
Chloroform, Methanol and Aqueous Extracts of Some Nigerian Savannah Plants.
African Journal of Biotechnology, Vol.4 (2), pp. 177-182.
Basri, D.F. and Fan, S.H. (2004). The Potential of Aqueous And Acetone Extracts of
Galls of Quercus Infectoria As Antibacterial Agents. Department of Biomedical
Science, Universiti Kebangsaan Malaysia.
Bechtold, T., Mahmud-Ali, A. and Mussak, R. (2006). Natural Dyes For Textile Dyeing:
A Comparison of Methods to Assess The Quality of Canadian Golden Rod Plant
Material. Dyes and Pigments, 75; 287-293.
Bechtold, T., Turcanu, A., Ganglberger, E. and Geissler, S. (2003). Natural Dyes in
Modern Textile Dyehouses-How to Combine Experiences of Two Centuries to
Meet The Demands of The Future. J Clean Prod 2003; 11: 499-509.
Bhuyan, R., Saikia, C.N., and Das, K.K. (2004). Extraction And Identification of Colour
Components From The Bark of Mimusops Elengi And Terminalia Arjuna and
Evaluation of Their Dyeing Characteristics on Wool. Indian Journal of Fibre &
Textile Research; 29:470–6.
Carlo, D., G., Mascolo, N., Izzo, A. A. and Capasso, F. (1999). Flavonoids: Old and
New Aspects of A Class of Natural Therapeutic Drugs. Life Sciences, 65, 337-
353

91
Cowan, M. M. (1999). Plant Products as Antimicrobial Agents. Clinical Microbiology
Review, 12(4), 564-582.
David, T.B., and Levente, L.D. ( 2000 ). Rapid Aqueous Extraction of Mucilage from
Whole White Mustard Seed.
Druding, S.S. (2007, November 30). Dye History From 2600 BC to The 20th Century.
Dye Seminar at Covergence ’82.
Duhard, V., Garnier, J.C. and Megard, D. (1997). Comparison of The Stability of
Selected Anthocyanin Colorants in Drink Model Systems. Agro-Food-Industry
Hi-Tech, 8, 28–34.
Evon, Ph., Vandenbossche, V., Pontalier, P.Y. and Rigal, L. (2007). Direct Extraction
of Oil From Sunflower Seeds by Twin-screw Extruder According to An Aqueous
Extraction Process: Feasibility Study and Influence of Operation Conditions.
Industrial Crops and Products, 26(3), P.351-359.
Falodun, A., Okunrobo, L.O. and Uzoamaka, N. (2006). Phytochemical Screening and
Anti-inflammatory Evaluation of Methanolic and Aqueous Extracts of Euphorbia
Heterophylla Linn (Euphorbiaceae). African Journal of Biotechnology, Vol.5,
pp.529.
Filippos, V., Emmanouil, T., Carl, D., Guenter, V., Georg, K. and Nickolas, P. (October
2007). Biotechnology of Flavonoids and Other Phenylpropanoid-Derived
Natural Products. Part I: Chemical Diversity, Impacts on Plant Biology and
Human Health. Biotechnology Journal 2 (10).
Ganglberger, E., Geissler, S., Farb and Stoff, (2003). Sustainable Development
Durchneue Kooperationen und Prozesse, Project Report. Wien.
Bundesministerium fur Verkehr, Innovation und Technologie.

92
Gómez-Estaca, J., Bravo, L., Gómez-Guillén, M.C., Alemán, A., and Montero, P.
(2008). Antioxidant Properties of Tuna-skin and Bovine-hide Gelatin Films
Induces by The Addition of Oregano and Rosemary Extracts. Food Chemistry
112; 18-25.
Hoa, T.T, Clark, C.J., Waddell, B.C. and Woolf, A.B. (2006). Postharvest Quality of
Dragon Fruit (Hylocereus undatus) Following Disinfesting Hot Air Treatments.
Postharvest Biology and Technology 41; 62-69.
Li, H., Wang, X., Yong, L., Li, P. and Wang, H. (2008). Polyphenoic Compounds and
Antioxidant Properties of Selected China Wines. Food Chemistry, 112; 454-460.
LJ Health Promotions. Retrived November 11, 2008, from
http://www.dragonfruit.com.my/about.html
Lu, Y., and Foo, Y. (2000). Antioxidant and Radical Scavenging Activities of
Polyphenols From Apple Pomace. Food Chemistry, 68, 81-85.
Mahomed, I.M. and Ojewole, J.A.O. (2006). Oxytocin-Like Effect of Harpagophytum
Procumbens Dc [Pedaliaceae] Secondary Root Aqueous Extract On Rat Isolated
Uterus. Afr. J. Trad. CAM 3(1); 82-89.
Marinova, D., Ribarova, F. and Atanassova, M. (2005) Total Phenolics and Total
Flavonoids in Bulgarian Fruits and Vegetables. Journal of the University of
Chemical Technology and Metallurgy, page 255-260.
Mizrahi, Y., Nerd, A. and Nobel, P.S. (1997). Cacti As Crops. Hort. Rev. 18, 291–319.
Nair, R., Chanda, S.(2006). Activity of Some Medicinal Plants Against Certain
Pathogenic Bacterial Strains. Indian Journal of Pharmacol, Volume 38; 142-4.

93
Norziah, M. H., Ruri, A. S. and Fazilah, A. (2008). Utilization of Red Pitaya Fruit Peels
for Value Added Food Ingredients. International Conference on Environmental
Research and Technology (ICERT 2008).
Parekh, J., and Chanda, S.(2006). In-vitro Antimicrobial Activities of Extracts of
Launaea Procumbens Roxb. (Labiateae), Vitis vinifera L. (Vitaceae) and
Cyperus rotundus L. (Cyperaceae). African Journal of Biomedical Research,
Vol.9; 89-93.
Rappl, B. (2005). Trademark Farb and Stoff e Von der Idee zum marktfahigen
Handelsprodukt: Pflanzenfarben fur die Textilindustrie, project report. Wien:
Bundesministerium fur Verkehr, Innovation und Technologie.
Rickwood, D. and Graham, J.M. (2001). Biological Centrifugation. Springer Verlag.
Rusak, G., Komes, D., Likic, S., Horzic, D. and Kovac, M. (2008). Phenolic Content
and Antioxidative Capacity of Green and White Tea Extracts Depending on
Extraction Condition and The Solvent Used. Food Chemistry, 110; 852-858.
Salahdeen, H.M. and Yemitan, O.K.(2006). Neuropharmacological Effects of Aqueous
Leaf Extract of Bryophyllum Pinnatum in Mice. African Journal of Biomedical
Research, vol.9; 101-107.
Sengupta, S. and Singh, B. R. (2003). Natural “Green” Dyes for the Textile Industry.
The Massachusetts Toxics Use Reduction Institute, University of Massachusetts
Lowell, 2003.
Singleton, V.L. and Rossi, J.A. (1965). Colorimetryof Total Phenolics with
Phosphomolybdic-phosphotungstic Acid Reagents. American Journal of Enology
and Viticulture, 16, 144-158.

94
South Texas Unit of The Herb Society of America (1993). Dyeing. Retrieved November
10, 2008, from http://www.herbsociety-stu.org/Dyeing.htm#Resources
Stauth, D. (2007). Studies Force New View on Biology, Nutritional Action of
Flavonoids. Linus Pauling Institute. Retrieved from
http://www.eurekalert.org/pub_releases/2007-03/osu-sfn030507.php
Stich, E., Kloos, K. and Hoeck, H. (1999). Natur, Technik und Recht: miteinander, nicht
Gegeneinander. Zucker- und Subwaren Wirts-chaft, 52, 10–14.
Stintzing, F. C., and Carle, R. (2004). Functional Properties of Waterman, P. G. (1998).
Alkaloid chemosystematics. In G. A. Cordell anthocyanins and betalains in
plants, food, and in human (Ed.). The alkaloids – Chemistry and
pharmakology ,vol. 50, nutrition. Trends in Food Science and Technology, 15,
19–38.
Su, M. S., Shyu, Y. T. and Chien, P. J. (2008) Antioxidant Activities of Citrus Herbal
Product Extracts. Food Chemistry , page 892-896.
Suzuki, M., Watanabe, T., Miura, A., Harashima, E., Nakagawa, Y. and Tsuji, K.
(2002). An Extraction Solvent Optimum for Analyzing Polyphenol Contents by
Folin-Denis assay. Nippon Shokuhin Kagaku Kaishi, 49, 507-511.
Tapiero, H., Tew, K. D., Nguyen, B. G. and Mathé, G. (2002). Polyphenols: Do They
Play A Role in The Prevention of Human Pathologies. Biomedicine and
Pharmacotherapy, 56, 200-207.
Tawaha, K., Alali, F.Q., Gharaibeh, M., Mohammad, M. and El-Elimat, T. (2007).
Antioxidant Activity and Total Phenolic Content of Selected Jordanian Plant
Species. Food Chemistry 104, 1372-1378.

95
The Star. October 12, 2007. “ Dye Used in Burgers and Sausages Banned”. Retrieved from http://thestar.com.my/news/story.asp?file=/2007/10/12/nation/19148893&sec=na tion Vattem, D. A., Lin, Y.-T. and Shetty, L. K. (2004). Antimicrobial Activity Against Select
Food-borne Pathogens by Phenolic Antioxidants Enriched in Cranberry Pomace
by Solid-state Bioprocessing Using The Food Grade Fungus Rhizopus
Oligosporus. Process Biochemistry, 39, 1939-1946.
Wu, L. C., Hsu, H. W., Chen, Y.C., Chiu, C. C., Lin, Y.I. and Annie, H. (2005)
Antioxidant and anitproliferative activities of red pitaya. Food Chemistry page
319-327.
Yongnian, N., and Liu, C.(1999). Artificial Neural Networks and Multivariate
Calibration for Spectrophotometric Differential Kinetic Determinations of Food
Antioxidants. Food Chemistry .Volume 396, page 221-230.
Zhou, S.H., Fang, Z.X., Lu, Y., Chen, J.C., Liu, D.H. and Ye, X.Q. (2008). Phenolics
and Antioxidant Properties of Bayberry (Myrica rubra Sieb. Et Zucc.) Pomace.
Food Chemistry, 112; 394-39