Total P Absorbance Genesys R01 - Missouri State University · · 2011-03-16Total Phosphorus...
23
Standard Operating Procedure for: Total Phosphorus Analyses Using Genesys 10S UV-Vis (Total P Absorbance Genesys R01.doc) Missouri State University and Ozarks Environmental and Water Resources Institute (OEWRI) Prepared by: __________________________________ Date: _____________ OEWRI Quality Assurance Coordinator Approved by: __________________________________ Date: _____________ OEWRI Director Approved by: __________________________________ Date: _____________ MSU Chemistry Faculty
Transcript of Total P Absorbance Genesys R01 - Missouri State University · · 2011-03-16Total Phosphorus...

Standard Operating Procedure for:
Total Phosphorus Analyses Using Genesys 10S UV-Vis (Total P Absorbance Genesys R01.doc)
Missouri State University
and
Ozarks Environmental and Water Resources Institute (OEWRI)
Prepared by: __________________________________ Date: _____________ OEWRI Quality Assurance Coordinator Approved by: __________________________________ Date: _____________ OEWRI Director Approved by: __________________________________ Date: _____________ MSU Chemistry Faculty

ID: Total P Absorbance Genesys Revision: 1 June 2010
Page 2 of 22
Table of Contents 1 Identification of the test method .................................................................................... 3 2 Applicable matrix or matrices ........................................................................................ 3 3 Detection Limit ................................................................................................................ 3 4 Scope of the test method ............................................................................................... 3 5 Summary of test method ................................................................................................ 3 6 Definitions ........................................................................................................................ 3 7 Interferences .................................................................................................................... 5 8 Health and safety ............................................................................................................ 6 9 Personnel qualifications ................................................................................................. 6 10 Equipment and supplies ................................................................................................. 6 11 Reagents and standards ................................................................................................ 7 12 Sample collection, preservation, shipment and storage ............................................. 8 13 Quality control ................................................................................................................. 9 14 Calibration and standardization .................................................................................. 10 15 Procedure ...................................................................................................................... 10 16 Data acquisition, calculations, and reporting............................................................. 15 17 Computer hardware and software ............................................................................... 16 18 Method performance ..................................................................................................... 16 19 Pollution prevention ..................................................................................................... 16 20 Data assessment and acceptable criteria for quality control measures .................. 16 21 Corrective actions for out-of-control or unacceptable data ...................................... 17 22 Waste management ...................................................................................................... 17 24 Tables, diagrams, flowcharts and validation data ..................................................... 18 25 APPENDIX A: Variations from EPA Method 365.2..................................................... 19

ID: Total P Absorbance Genesys Revision: 1 June 2010
Page 3 of 22
1 Identification of the test method Total phosphorus by Genesys 10S UV-Vis spectrophotometer (EPA 365.2).
2 Applicable matrix or matrices
This method is suitable for the analysis of water samples collected from rivers, streams, lakes, and wastewater.
3 Detection Limit
The detection limit is ≤ 0.005 mg TP/L. 4 Scope of the test method
This Standard Operating Procedure provides Missouri State University (MSU) laboratory personnel with guidance on the procedure for determining total phosphorus (TP) in surface water samples. This method is not applicable to samples preserved with HgCl2.
5 Summary of test method
5.1 All forms of phosphorus, including organic phosphorus, are converted to orthophosphate by an acid-persulfate digestion. The persulfate digestion procedure and phosphate determination follow EPA 365.2, with the size of the sample reduced.
5.1 A 10-mL volume of a well-mixed water sample is combined with sulfuric acid and
ammonium or potassium persulfate and heated to approximately 120ºC in an autoclave or pressure cooker. This quantitatively converts phosphorus compounds to orthophosphate.
5.2 The digested sample is then analyzed for orthophosphate based on its reaction
with a combined reagent containing ammonium molybdate, antimony potassium tartrate, and ascorbic acid to form intensely-colored molybdenum blue.
5.3 The desired performance criteria for this measurement are:
a. Detection limit: 0.005 mgTP/L b. Precision: ≤ 20% c. Accuracy: ≤ 20% d. Minimum Quantification Interval: 0.001 mg TP/L
5.5 According to EPA 365.2 the applicable range for the method is 0.01 mg TP/L to
0.5 mg TP/L and may be extended by dilution. EPA 365.2 describes performance for undigested orthophosphate samples but not for digested samples.
6 Definitions 6.1 The definitions and purposes below are specific to this method, but have been
conformed to common usage as much as possible. 6.2 AMP standard: The AMP standard is used to confirm effective digestion of
organic phosphorus.
ID: Total P Absorbance Genesys Revision: 1 June 2010
Page 4 of 22
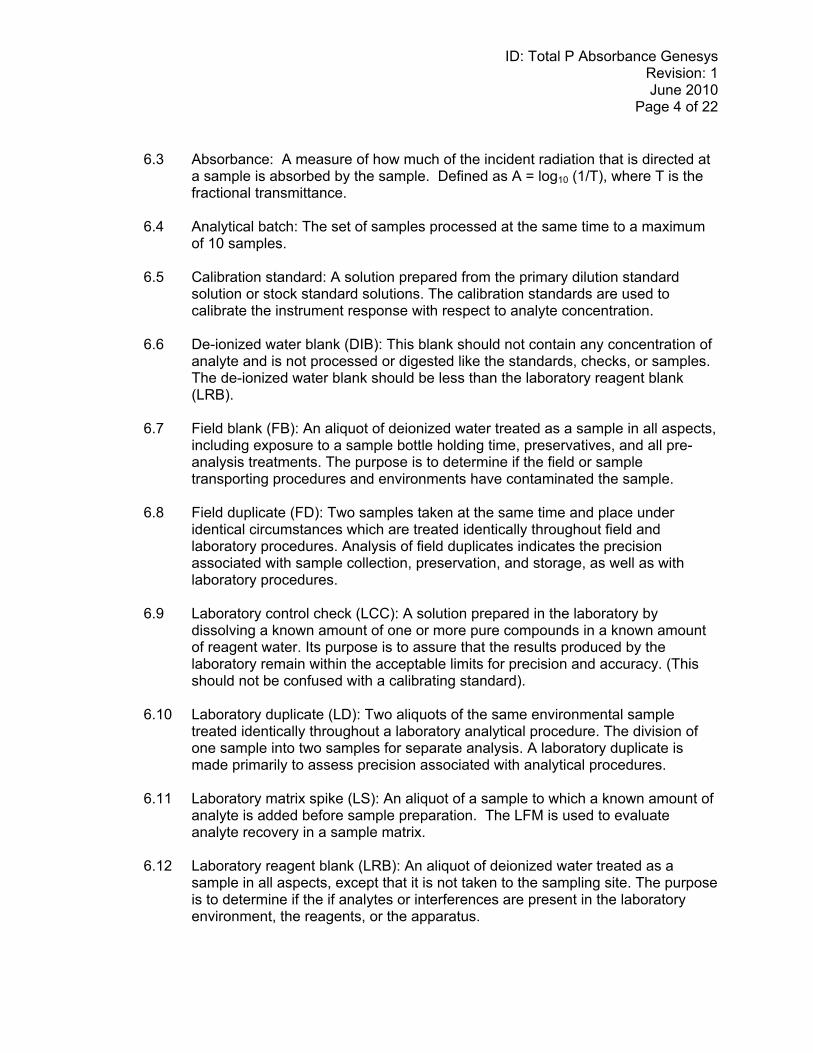
6.3 Absorbance: A measure of how much of the incident radiation that is directed at
a sample is absorbed by the sample. Defined as A = log10 (1/T), where T is the fractional transmittance.
6.4 Analytical batch: The set of samples processed at the same time to a maximum
of 10 samples.
6.5 Calibration standard: A solution prepared from the primary dilution standard solution or stock standard solutions. The calibration standards are used to calibrate the instrument response with respect to analyte concentration.
6.6 De-ionized water blank (DIB): This blank should not contain any concentration of
analyte and is not processed or digested like the standards, checks, or samples. The de-ionized water blank should be less than the laboratory reagent blank (LRB).
6.7 Field blank (FB): An aliquot of deionized water treated as a sample in all aspects,
including exposure to a sample bottle holding time, preservatives, and all pre-analysis treatments. The purpose is to determine if the field or sample transporting procedures and environments have contaminated the sample.
6.8 Field duplicate (FD): Two samples taken at the same time and place under
identical circumstances which are treated identically throughout field and laboratory procedures. Analysis of field duplicates indicates the precision associated with sample collection, preservation, and storage, as well as with laboratory procedures.
6.9 Laboratory control check (LCC): A solution prepared in the laboratory by
dissolving a known amount of one or more pure compounds in a known amount of reagent water. Its purpose is to assure that the results produced by the laboratory remain within the acceptable limits for precision and accuracy. (This should not be confused with a calibrating standard).
6.10 Laboratory duplicate (LD): Two aliquots of the same environmental sample
treated identically throughout a laboratory analytical procedure. The division of one sample into two samples for separate analysis. A laboratory duplicate is made primarily to assess precision associated with analytical procedures.
6.11 Laboratory matrix spike (LS): An aliquot of a sample to which a known amount of
analyte is added before sample preparation. The LFM is used to evaluate analyte recovery in a sample matrix.
6.12 Laboratory reagent blank (LRB): An aliquot of deionized water treated as a
sample in all aspects, except that it is not taken to the sampling site. The purpose is to determine if the if analytes or interferences are present in the laboratory environment, the reagents, or the apparatus.

ID: Total P Absorbance Genesys Revision: 1 June 2010
Page 5 of 22
6.13 Method detection limit (MDL): The lowest level at which an analyte can be detected with 99 percent confidence that the analyte concentration is greater than zero. a. To calculate the MDL: b. Prepare a solution with the concentration of TP near the estimated MDL c. Analyze seven portions of this solution over a period of at least three days d. Include all sample processing steps in the determination e. Calculate the standard deviation (s). f. From a table of the one-sided t distribution select the value of t for 7 – 1 =
6 degrees of freedom at the 99% level. This value is 3.14 g. The product 3.14 times s is the desired MDL.
6.12 Minimum Quantification Interval: is the lowest level that can be quantitated accurately and is generally defined as four times the method detection limit = 4(MDL).
6.13 Noise: A general term used to describe small, irregular, random variations in the
spectrophotometer reading. 6.14 Relative Percent Difference (RPD): calculated as the difference between a
sample and duplicate results, divided by the average of the sample and duplicate results, multiplied by 100%.
6.15 Quality control check sample (QCC): A sample containing analytes of interest at
known concentrations (true values). The quality control check sample is obtained from a source external to the laboratory or is prepared from standards obtained from a different source than the calibration standards. The purpose is to check laboratory performance using test materials that have been prepared independently from the normal preparation process.
7 Interferences
7.1 No interferences are normally observed for copper, iron, or silicate. However, high concentrations of iron can cause precipitation of, and subsequent loss, of phosphorus.
7.2 Arsenate may interfere when present at concentrations higher than phosphorus. 7.3 Sample turbidity and natural color may interfere. Turbidity may be removed by
centrifugation or filtration after digestion. 7.4 Phosphate adsorbed on glass surfaces may affect measurements at low
phosphate levels. Use of acid-washed glassware dedicated to this analysis prevents this interference.
7.5 A number of sources suggest that there is a problem with deposition of reaction
products on cell windows. Some methods incorporate a surfactant to minimize this effect.

ID: Total P Absorbance Genesys Revision: 1 June 2010
Page 6 of 22
8 Health and safety 8.1 This analysis involves handling freshwater samples that may contain live
microorganisms and therefore pose some threat of infection. Laboratory personnel who are routinely exposed to such water samples are encouraged to protect themselves from water borne illnesses by wearing clean disposable gloves and washing their hands frequently.
8.2 The calibration standards, samples, and most reagents used in this method pose
no unusual hazard to an analyst employing standard safety measures including protective clothing and safety goggles. Care must be taken when handling concentrated sulfuric acid and sodium hydroxide. Analysts should review the MSDSs for all chemicals used in this analysis.
8.3 This procedure requires use of an autoclave or pressure cooker capable of
heating samples to 120ºC. All safety directions for using these devices should be followed carefully.
9 Personnel qualifications
Laboratory and field personnel shall have a working knowledge of this analytical procedure and will have received training from an MSU employee knowledgeable of the proper sample analysis procedures. Prior to the first batch of sample analyses, the analyst will complete a demonstration of capability exercise as described below in the Quality control section.
10 Equipment and supplies
10.1 Balance: analytical, capable of accurately weighing to the nearest 0.0001 g. 10.2 Glassware: Class A volumetric flasks and pipettes or plastic containers as
required. Samples may be stored in plastic or glass. 10.3 Glass culture tubes: with linerless polypropylene caps, 20 mm OD and 150 mm
long. Clean before first use by heating to 120ºC with digestion reagent. Rinse with 6M HCl and deionized water between uses.
10.4 Spectrophotometer: A Genesys 10S UV-Vis spectrophotometer capable of
measurements at 880 nm with a path length of 5.0 cm or longer is required. 10.5 Spectrophotometer cells: Cells, including flow cells, with path lengths of 1.0 cm
or longer, can be used. This procedure employs a masked rectangular flow cell with a 5.0 cm path length and screw fittings for tubing. Masterflex 96410-14 tubing is connected to the flow cell tubing so the peristaltic pump can be used to delivered sample to the cell.
10.6 50mm Rectangular Long Pathlength Cell Holder: containing the 5.0 cm flow cell.
The flow cell is not to be removed from this holder. 10.7 Heating unit: Use either an autoclave or pressure cooker capable of heating
samples to 121°C (15 – 20 PSI).

ID: Total P Absorbance Genesys Revision: 1 June 2010
Page 7 of 22
11 Reagents and standards 11.1 Deionized water (DI): Use deionized water that has been purified with a
Barnstead/Thermolyne purification system that includes ion exchange and organic purification cartridges. Use this water for all procedures.
11.2 Sulfuric acid, 5.4M (11N): Cautiously add 310 mL concentrated sulfuric acid to
an equal volume of water. CAUTION: This mixture will become very hot. Dilute to 1 L.
11.3 Antimonyl potassium tartrate solution: Dissolve 0.3 g K(SbO)C4H4O6 - ½H2O (antimony potassium tartrate hemihydrate) in about 50 mL water and dilute to 100 mL. Store at 4°C in a dark bottle.
11.4 Ammonium molybdate reagent: Dissolve 4 g (NH4)6Mo7O24 - 4H2O in 100 mL
deionized water. Store at 4°C in a plastic bottle. Note: This solution (4% (w/v) ammonium molybdate) is commercially available.
11.5 Ascorbic acid, 0.1M: Dissolve 1.76 g ascorbic acid in deionized water and dilute
to 100 mL. This solution is stable for approximately 1 week if stored at 4°C. 11.6 Combined reagent: Mix the above reagents (11.2 – 11.5) in the following
portions for 100 mL of the mixed reagent. 23 mL 11N H2SO4 (11.2), 5 mL antimony potassium tartrate (11.3), 15 mL ammonium molybdate (11.4), 30 mL ascorbic acid (11.5), and enough water to make 100 mL (about 27 mL). a. Each solution should be at room temperature before mixing. b. Mix in the specified order and mix well after each addition. c. If turbidity forms in the combined reagent, shake and let stand for a few
minutes until turbidity disappears before proceeding. d. The stability of the solution is limited. It should be prepared fresh for each
day’s run, and used for a maximum of 8 hours. 11.7 Ammonium persulfate: Use ACS reagent grade (NH4)2S2O8. Dissolve in water at
concentration of 0.32 g per mL. Prepare volume appropriate to the number of samples that will be run (at 0.25 mL per sample) – see Table 1. Prepare fresh daily. (0.25 mL = 0.08 g (NH4)2S2O8).
Table 1. Numbers of samples and volume of Ammonium persulfate needed.
Maximum number of samples (NH4)2S2O8 (g) Volume (mL)
40 3.2 10.0
100 8.0 25.0
200 16.0 50.0
11.8 Sodium hydroxide solution, 6M: Dilute 31 mL 50% NaOH solution (commercially available) to 100 mL. Store in plastic bottles.
ID: Total P Absorbance Genesys Revision: 1 June 2010
Page 8 of 22
11.9 Sodium hydroxide solution, 1M: Dilute 10 mL 6M NaOH (11.8) with 50 mL water. 11.10 Phosphate stock solution (1,000 mg P/L): This standard is commercially
available. Alternately, dissolve 2.197 g anhydrous KH2PO4 and dilute to 500 mL in a volumetric flask. 1.00 mL =1.00 mg PO4
3 - P. Two batches of stock solution are needed, using different sources of phosphate (e.g., different lot numbers from the same supplier or different suppliers). Use one batch to prepare calibration standards and the other to produce quality control standards.
11.11 Phosphate intermediate solution (10.0 mg P/L): Dilute 5.00 mL of the phosphate
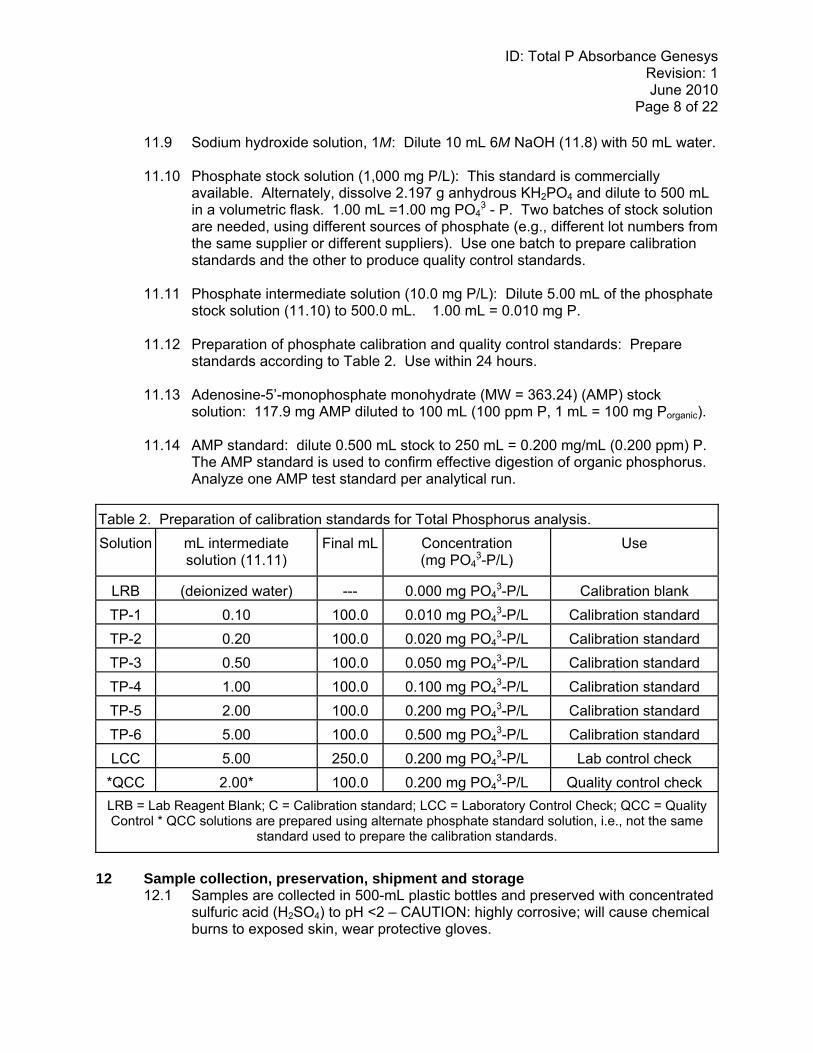
stock solution (11.10) to 500.0 mL. 1.00 mL = 0.010 mg P. 11.12 Preparation of phosphate calibration and quality control standards: Prepare
standards according to Table 2. Use within 24 hours. 11.13 Adenosine-5’-monophosphate monohydrate (MW = 363.24) (AMP) stock
solution: 117.9 mg AMP diluted to 100 mL (100 ppm P, 1 mL = 100 mg Porganic).
11.14 AMP standard: dilute 0.500 mL stock to 250 mL = 0.200 mg/mL (0.200 ppm) P. The AMP standard is used to confirm effective digestion of organic phosphorus. Analyze one AMP test standard per analytical run.
Table 2. Preparation of calibration standards for Total Phosphorus analysis. Solution mL intermediate
solution (11.11) Final mL Concentration
(mg PO43-P/L)
Use
LRB (deionized water) --- 0.000 mg PO43-P/L Calibration blank
TP-1 0.10 100.0 0.010 mg PO43-P/L Calibration standard
TP-2 0.20 100.0 0.020 mg PO43-P/L Calibration standard
TP-3 0.50 100.0 0.050 mg PO43-P/L Calibration standard
TP-4 1.00 100.0 0.100 mg PO43-P/L Calibration standard
TP-5 2.00 100.0 0.200 mg PO43-P/L Calibration standard
TP-6 5.00 100.0 0.500 mg PO43-P/L Calibration standard
LCC 5.00 250.0 0.200 mg PO43-P/L Lab control check
*QCC 2.00* 100.0 0.200 mg PO43-P/L Quality control check
LRB = Lab Reagent Blank; C = Calibration standard; LCC = Laboratory Control Check; QCC = Quality Control * QCC solutions are prepared using alternate phosphate standard solution, i.e., not the same
standard used to prepare the calibration standards.
12 Sample collection, preservation, shipment and storage
12.1 Samples are collected in 500-mL plastic bottles and preserved with concentrated sulfuric acid (H2SO4) to pH <2 – CAUTION: highly corrosive; will cause chemical burns to exposed skin, wear protective gloves.

ID: Total P Absorbance Genesys Revision: 1 June 2010
Page 9 of 22
12.2 Sample bottles are stored on ice for transport to the laboratory.
12.3 Preserved and refrigerated samples can be stored for up to 28 days. 13 Quality control
13.1 Quality control program: The minimum requirements of the quality control program for this analysis consist of an initial demonstration of laboratory capability and the periodic analysis of laboratory reagent blanks and other laboratory solutions as a continuing check on performance. The laboratory must maintain performance records that define the quality of the data that are generated.
a. Analyses of matrix spike and matrix spike duplicate samples are required
to demonstrate method accuracy and precision and to monitor matrix interferences (interferences caused by the sample matrix). The procedure and QC criteria for spiking are described in Sections 13.4 and 15.1.
b. Analyses of laboratory blanks are required to demonstrate freedom from contamination.
c. The laboratory shall, on an ongoing basis, demonstrate through calibration verification and analysis of the ongoing precision and recovery sample that the analysis system is in control.
d. The laboratory should maintain records to define the quality of data that is generated.
13.2 Initial demonstration of performance. The following must be satisfied before the
analytical procedure may be used for samples and before a new analyst may analyze samples.
a. Method Detection Limit (MDL) – To establish the ability to detect the
analyte, the analyst shall determine the MDL by carrying through 7 or more separately prepared reagent blank solutions through the analytical procedure in Section 15. The average value, X, and the standard deviation of the values, s, shall be calculated. The MDL is equal to 3s (3 x standard deviation). The MDL and average value, X, should both be less than or equal to 0.005 mg P/L.
b. Initial Precision and Recovery – To establish the ability to generate
acceptably precise and accurate results, the operator shall perform 10 replicates of a mid-range standard (0.200 mg TP/L), according to the procedure in Section 9. Using the results of the replicates compute the average value, S, and the standard deviation, s, for the analyte. The value of X should be within 10% of the true value. The standard deviation should be less than or equal to 10% of the average value.
13.3 The DIB, LRB, LCC, QCC and AMP should be measured along with the
standards at the start of the analytical cycle. The criteria are listed in Table 3.

ID: Total P Absorbance Genesys Revision: 1 June 2010
Page 10 of 22
Table 3. Quality control solution and acceptable ranges.
Solution Acceptable range Comments DIB < 0.005 mg TP/L Less than LRB LRB ≤ 0.005 mg TP/L Ideally less than or equal to the required detection limit
LCC 0.180 - 0.220 mg TP/L Within ± 10% of the true value
QCC 0.180 - 0.220 mg TP/L Within ± 10% of the true value
AMP 0.180 - 0.220 mg TP/L Within ± 10% of the true value
13.4 With each sample batch of ten samples, the following should also be run (acceptance criteria noted):
Table 4. Quality control samples and acceptance criteria.
Solution Acceptance Criteria DIB < 0.001 mg TP/L LRB Ideally < 0.001 mg TP/L
LCC 0.180 - 0.220 mg TP/L or 100 ± 10%recovery
LD greater of ± 20% or ± 0.005 mg TP/L
FD greater of ± 20% or ± 0.005 mg TP/L
LS-1 and LS-2 both 100 ± 20% recovery 14 Calibration and standardization
Calibration: Obtain a standard curve by plotting absorbance of standards (including the reagent blank) versus concentration. The data will be fit to a linear equation using a spreadsheet program such as Excel.
15 Procedure
15.1 Preparation of laboratory-fortified matrix (LFM): Prepare two LFM samples using 10-mL aliquots of a water sample (or a smaller aliquot diluted to 10 mL) from the same sample. Spike each with 0.200 mL phosphate standard solution. (This should increase observed concentration by 0.200 mg/L.) Carry each through the sample preparation and analysis procedure (15.3 and following).
15.2 Preparation of samples and standards – digestion: All samples and standards
(including quality control solutions) should be processed in the same manner. a. Adjust the pH of a well-mixed sample to 6.0 to 8.0 using 6M NaOH and
1M H2SO4 or HCl. b. Transfer 10 mL of a well-mixed sample (or an aliquot of sample diluted to
10 mL) to a screw-cap culture tube. c. Add 0.25 mL of the (NH4)2S2O8 solution (11.7) and 0.2 mL 5.4 M H2SO4 to
each tube and mix.
ID: Total P Absorbance Genesys Revision: 1 June 2010
Page 11 of 22
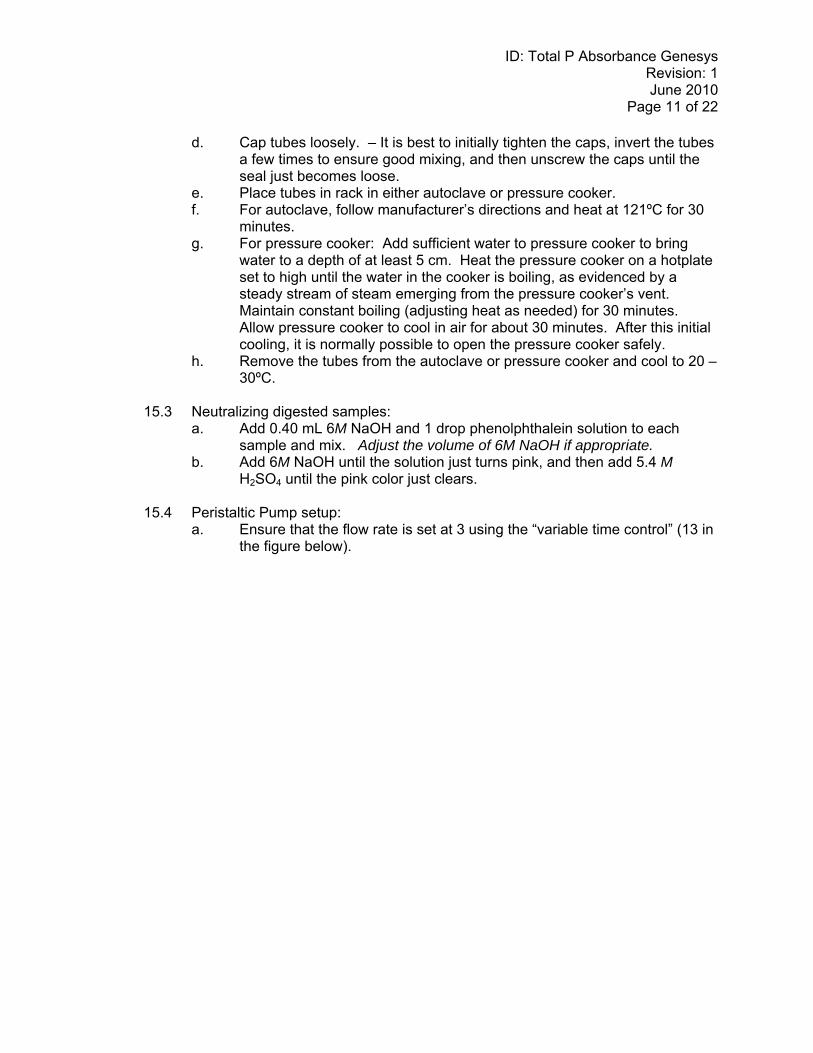
d. Cap tubes loosely. – It is best to initially tighten the caps, invert the tubes a few times to ensure good mixing, and then unscrew the caps until the seal just becomes loose.
e. Place tubes in rack in either autoclave or pressure cooker. f. For autoclave, follow manufacturer’s directions and heat at 121ºC for 30
minutes. g. For pressure cooker: Add sufficient water to pressure cooker to bring
water to a depth of at least 5 cm. Heat the pressure cooker on a hotplate set to high until the water in the cooker is boiling, as evidenced by a steady stream of steam emerging from the pressure cooker’s vent. Maintain constant boiling (adjusting heat as needed) for 30 minutes. Allow pressure cooker to cool in air for about 30 minutes. After this initial cooling, it is normally possible to open the pressure cooker safely.
h. Remove the tubes from the autoclave or pressure cooker and cool to 20 – 30ºC.
15.3 Neutralizing digested samples:
a. Add 0.40 mL 6M NaOH and 1 drop phenolphthalein solution to each sample and mix. Adjust the volume of 6M NaOH if appropriate.
b. Add 6M NaOH until the solution just turns pink, and then add 5.4 M H2SO4 until the pink color just clears.
15.4 Peristaltic Pump setup: a. Ensure that the flow rate is set at 3 using the “variable time control” (13 in the figure below).

ID: Total P Absorbance Genesys Revision: 1 June 2010
Page 12 of 22
b. Ensure that the tubing is correctly fitted into the pump head (10 in the figure above). Carefully push the lever (9) on the pump head (10) down to secure the tubing into place.
c. Check that the waste container is empty and make sure that the waste
line coming from the pump head directis waste into the container. 15.5 Spectrophotometer setup:
a. Open the sipper door and make sure that the 5cm flow cell and corresponding cell holder is installed. If not, carefully loosen the captive thumbscrews and pull the baseplate of the cell holder straight up and out of the sample compartment (see figure below) Never grab the cell itself, always transfer the cell and cell holder by touching the baseplate only. Install the 5cm flow cell holder by carefully lowering the cell holder straight down into the sample compartment aligning the baseplate with the alignment pin holes. Tighten the captive thumbscrews. Do not over-tighten the thumbscrews. Securely attach larger waste tubing to the smaller tubing coming from the outlet port on the flowcell (7 in the figure in section 15.4). Insert the sipper spout into the slot and carefully tighten the screw to secure the spout into place. Thread the inlet port tubing (intake tubing) through the sipper spout.

ID: Total P Absorbance Genesys Revision: 1 June 2010
Page 13 of 22
b. Place a beaker of DDI water near the sipper spout. Wipe the intake tubing with a chem-wipe and place the tubing into the beaker ensuring that it is submerged appropriately so that DDI continues to pass through the flow cell during the sample color development period.
c. Draw deionized water through the sample tube to deliver liquid to the inlet
port of the flow cell by flipping the “Flow Direction Indicator” (14) up to induce clockwise flow. Ensure that there are no leaks where the waste tubing is attached to the outlet port.
d. Ensure that no tubing will be crimped or tangled while closing the sipper
door and close the sipper door. e. Turn on the Genesys 10S using the switch in the back of the instrument. f. The SmartStart screen should appear. Use the ↑↓ buttons to select the
“TPA” test from the SmartStart screen. If the SmartStart screen is not illustrated press Utility to display the Utility screen, then use the down arrow to highlight the Stored Tests Directory and press Enter. Highlight the “TPA” test and press Select Test using the corresponding function key.
15.6 Color development:
a. To the first ten tubes, add 1.5 mL mixed molybdate reagent solution and mix, noting time.
b. Samples that appear turbid should be centrifuged or filtered. c. Just before starting measurements, add mixed molybdate reagent
solution to the next ten tubes, again noting time. d. Add mixed molybdate reagent to other tubes to maintain an
approximately 10 minute interval between time of mixing and measurement.
15.7 Spectroscopic measurements:
a. Ensure that the samples in the rack are arranged appropriately. The sequence should be as follows: DIB, LRB, each of the standards starting with the standard with the lowest concentration, LRB, QCC, LCC, AMP, LRB, DIB, and then samples. The QCC, LCC, AMP, LRB, and DIB will be analyzed after every set of 10 samples.
b. Press Run Test. c. Keep the intake tubing in the DDI water and draw DDI water (the blank
that zero’s the instrument) through the intake tube and watch for the air bubble to appear in the waste line. Double de-ionized water must be used
ID: Total P Absorbance Genesys Revision: 1 June 2010
Page 14 of 22
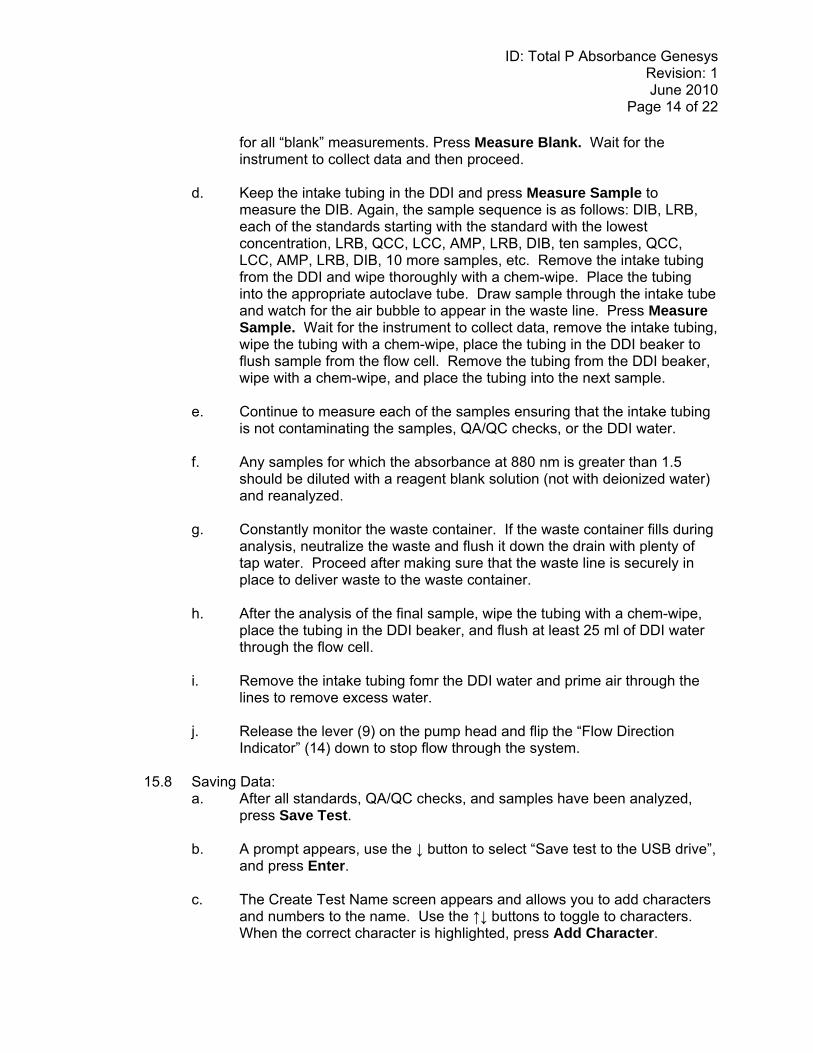
for all “blank” measurements. Press Measure Blank. Wait for the instrument to collect data and then proceed.
d. Keep the intake tubing in the DDI and press Measure Sample to
measure the DIB. Again, the sample sequence is as follows: DIB, LRB, each of the standards starting with the standard with the lowest concentration, LRB, QCC, LCC, AMP, LRB, DIB, ten samples, QCC, LCC, AMP, LRB, DIB, 10 more samples, etc. Remove the intake tubing from the DDI and wipe thoroughly with a chem-wipe. Place the tubing into the appropriate autoclave tube. Draw sample through the intake tube and watch for the air bubble to appear in the waste line. Press Measure Sample. Wait for the instrument to collect data, remove the intake tubing, wipe the tubing with a chem-wipe, place the tubing in the DDI beaker to flush sample from the flow cell. Remove the tubing from the DDI beaker, wipe with a chem-wipe, and place the tubing into the next sample.
e. Continue to measure each of the samples ensuring that the intake tubing
is not contaminating the samples, QA/QC checks, or the DDI water. f. Any samples for which the absorbance at 880 nm is greater than 1.5
should be diluted with a reagent blank solution (not with deionized water) and reanalyzed.
g. Constantly monitor the waste container. If the waste container fills during
analysis, neutralize the waste and flush it down the drain with plenty of tap water. Proceed after making sure that the waste line is securely in place to deliver waste to the waste container.
h. After the analysis of the final sample, wipe the tubing with a chem-wipe,
place the tubing in the DDI beaker, and flush at least 25 ml of DDI water through the flow cell.
i. Remove the intake tubing fomr the DDI water and prime air through the
lines to remove excess water. j. Release the lever (9) on the pump head and flip the “Flow Direction
Indicator” (14) down to stop flow through the system.
15.8 Saving Data: a. After all standards, QA/QC checks, and samples have been analyzed,
press Save Test. b. A prompt appears, use the ↓ button to select “Save test to the USB drive”,
and press Enter.
c. The Create Test Name screen appears and allows you to add characters and numbers to the name. Use the ↑↓ buttons to toggle to characters. When the correct character is highlighted, press Add Character.
ID: Total P Absorbance Genesys Revision: 1 June 2010
Page 15 of 22
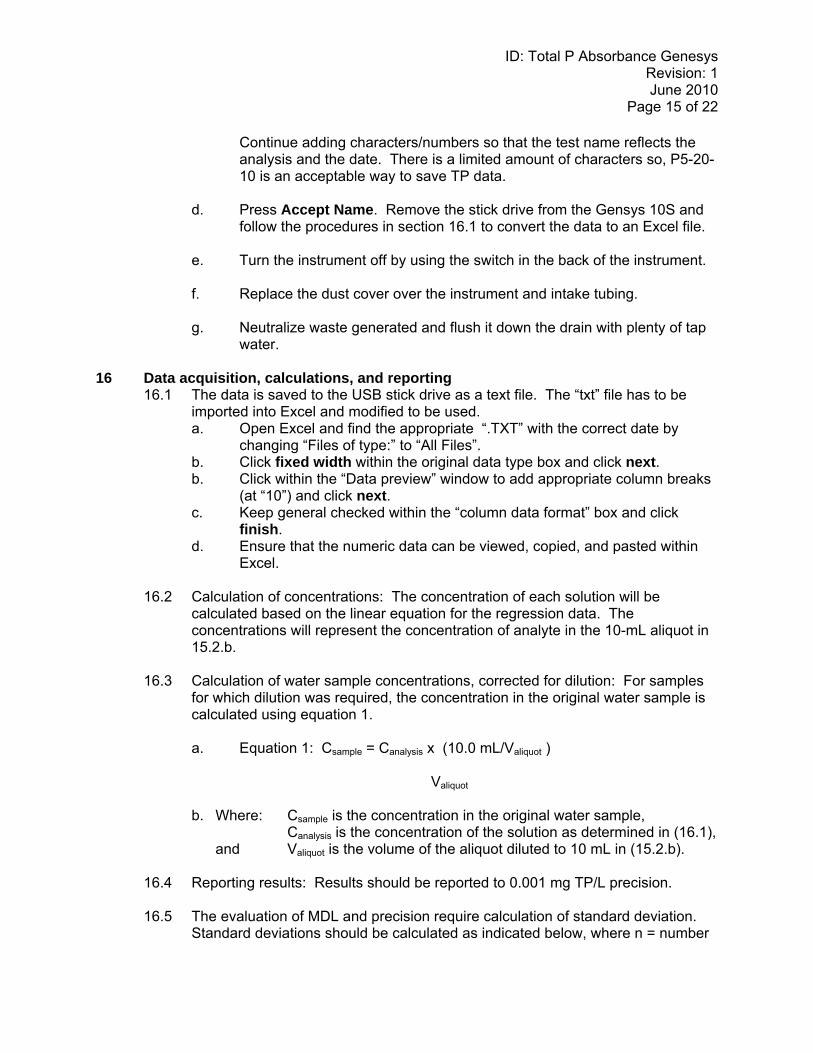
Continue adding characters/numbers so that the test name reflects the analysis and the date. There is a limited amount of characters so, P5-20-10 is an acceptable way to save TP data.
d. Press Accept Name. Remove the stick drive from the Gensys 10S and
follow the procedures in section 16.1 to convert the data to an Excel file. e. Turn the instrument off by using the switch in the back of the instrument. f. Replace the dust cover over the instrument and intake tubing. g. Neutralize waste generated and flush it down the drain with plenty of tap
water.
16 Data acquisition, calculations, and reporting 16.1 The data is saved to the USB stick drive as a text file. The “txt” file has to be
imported into Excel and modified to be used. a. Open Excel and find the appropriate “.TXT” with the correct date by changing “Files of type:” to “All Files”. b. Click fixed width within the original data type box and click next. b. Click within the “Data preview” window to add appropriate column breaks (at “10”) and click next. c. Keep general checked within the “column data format” box and click finish. d. Ensure that the numeric data can be viewed, copied, and pasted within Excel. 16.2 Calculation of concentrations: The concentration of each solution will be
calculated based on the linear equation for the regression data. The concentrations will represent the concentration of analyte in the 10-mL aliquot in 15.2.b.
16.3 Calculation of water sample concentrations, corrected for dilution: For samples
for which dilution was required, the concentration in the original water sample is calculated using equation 1.
a. Equation 1: Csample = Canalysis x (10.0 mL/Valiquot ) Valiquot b. Where: Csample is the concentration in the original water sample, Canalysis is the concentration of the solution as determined in (16.1),
and Valiquot is the volume of the aliquot diluted to 10 mL in (15.2.b).
16.4 Reporting results: Results should be reported to 0.001 mg TP/L precision. 16.5 The evaluation of MDL and precision require calculation of standard deviation.
Standard deviations should be calculated as indicated below, where n = number

ID: Total P Absorbance Genesys Revision: 1 June 2010
Page 16 of 22
of samples, x = concentration in each sample. Note: This is the sample standard deviation calculated by the STDEV function in Microsoft Excel.
16.6 Calculation of recoveries: Recovery of matrix spike solutions shall be calculated as indicated below, where S = concentration observed for spiked sample, U = concentration observed for unspiked sample, and 0.200 is the concentration increase expected upon spiking. Both S and U are concentrations based on (16.1), i.e., not adjusted for dilution of an aliquot. The factor 1.02 corrects for the small volume change upon spiking.
17 Computer hardware and software
17.1 Word: This document and attached bench sheet are prepared using Microsoft Word. The Word document file name for this SOP is: 3010R01 Total P.doc
17.2 Excel: Quality control charts are created using Excel.
18 Method performance 18.1 The desired performance criteria for this measurement are:
a. Detection limit: 0.005 mgTP/L b. Precision: ± 20% c. Accuracy: ± 20% d. Minimum Quantification Interval: 0.001 mg TP/L
18.2 According to EPA 365.2 the applicable range for the method is 0.01 mg TP/L to
0.5 mg TP/L and may be extended by dilution. EPA 365.2 describes performance for undigested orthophosphate samples but not for digested samples.
19 Pollution prevention 19.1 All wastes from these procedures shall be collected and disposed of according to
existing waste policies within the MSU Chemistry Department. 19.2 Volumes of reagents made should mirror the number of samples being analyzed.
These adjustments should be made to reduce waste
20 Data assessment and acceptable criteria for quality control measures 20.1 The analyst should review all data for correctness (e.g., calculations).
( ) 21
2
2
1⎟⎟⎟⎟⎟
⎠
⎞
⎜⎜⎜⎜⎜
⎝
⎛
−
−=
∑∑n
nx
xs
200.002.1cov% USeryre −×
=

ID: Total P Absorbance Genesys Revision: 1 June 2010
Page 17 of 22
20.2 Precision values are calculated for pairs of duplicate analyses. Record the
precision values as a percent on the total phosphorus bench sheet. The desired precision is ± 20%.
20.3 The desired detection limit is 0.005 mgP/L 20.4 Percent recovery is calculated for LCC, QCC and spiked samples. Record these
values on the bench sheet. The desired recoveries are; 100 ± 10% for LCC and QCC and 100 ± 20% for spiked samples.
20.5 The completed bench sheet is reviewed by the OEWRI QA/QC manager.
21 Corrective actions for out-of-control or unacceptable data 21.1 Quality control charts will be created for charting precision (REP), accuracy (LCC
and LFM) and laboratory reagent blank (LRB) values. 21.2 The results for precision, accuracy and LRB data are compared to the acceptable
values for this analysis; ± 20%, 100 ± 10% (LCC), 100 ± 20% (LFM) and 0.005 mgP/L, respectively.
21.3 If a precision value exceeds 20% then the analyst should write in the comments
section of the bench sheet: “These data are associated with an out-of-control duplicate analysis. The UCL = 20%.” Note: “UCL” is the Upper Control Limit (i.e., 20%).
21.4 If an accuracy value exceeds the UCLs for LCC or LFM, then the analyst should
write in the comments section of the bench sheet: “These data are associated with an out-of-control LCC (or LFM) analysis. The limit is 100 ± 10% (or ± 20%).”
21.5 If a LRB value exceeds 0.005 mg/L then the analyst should write in the
comments section of the bench sheet: “These data are associated with a LRB value that exceeds the detection limit of 0.005 mg/L.” The laboratory manager may request that the flow cell be flushed with a mild Citranox© solution if LRB values are consistently elevated. Never put a cell in an ultrasonic cleaning bath or in an oven. Never use acetone on a cell.
21.6 If there is sufficient volume of sample remaining for all samples, the analytical
batch may be re-analyzed. Quality control data from the first run must be recorded on the control charts.
21.7 If data are unacceptable for any reason, the analyst should review their analytical
technique prior to conducting this analysis again.
22 Waste management 22.1 The wastes generated in this method are hazardous because of a low final pH.
The samples may be neutralized by the addition of water in accumulation container (e.g., a large beaker or flask). Add sufficient amounts of water to

ID: Total P Absorbance Genesys Revision: 1 June 2010
Page 18 of 22
adjust the pH to between 2 and 12.5. When the pH is > 5 (for acidic wastes) the solution can be discarded in the laboratory drain followed by an equal volume of water.
22.2 Outdated chemicals are discarded following the procedures of the MSU
Environmental Management Department
23 References 23.1 EPA Method 365.2, Phosphorus, All Forms (Colorimetric, Ascorbic Acid, Single
Reagent). 23.2 Standard Methods for the Examination of Water and Waste Water, Method 4500-
P, Phosphorus, APHA, 19th Edition, 1995, especially B. Sample Preparation, and E. Ascorbic Acid Method.
23.3 “21.0: Determination of Total Phosphorus,” EPA Handbook of Methods for Acid
Deposition Studies: Laboratory Analysis for Surface Water Chemistry,” EPA publication 600/4-87/026, August 1987.
23.4 Genesys 10S UV-Vis User Guide. Thermo Scientific, October 2009.
24 Tables, diagrams, flowcharts and validation data
24.1 Tables and diagrams can be found within this document. There are no flowcharts.
24.2 Appendix A describes the variations from EPA 365.2. See next page. 24.3 Appendix B describes routine verification methods performed using the Genesys
10S spectrophotometer and presents validation data associated with system conversion.
ID: Total P Absorbance Genesys Revision: 1 June 2010
Page 19 of 22
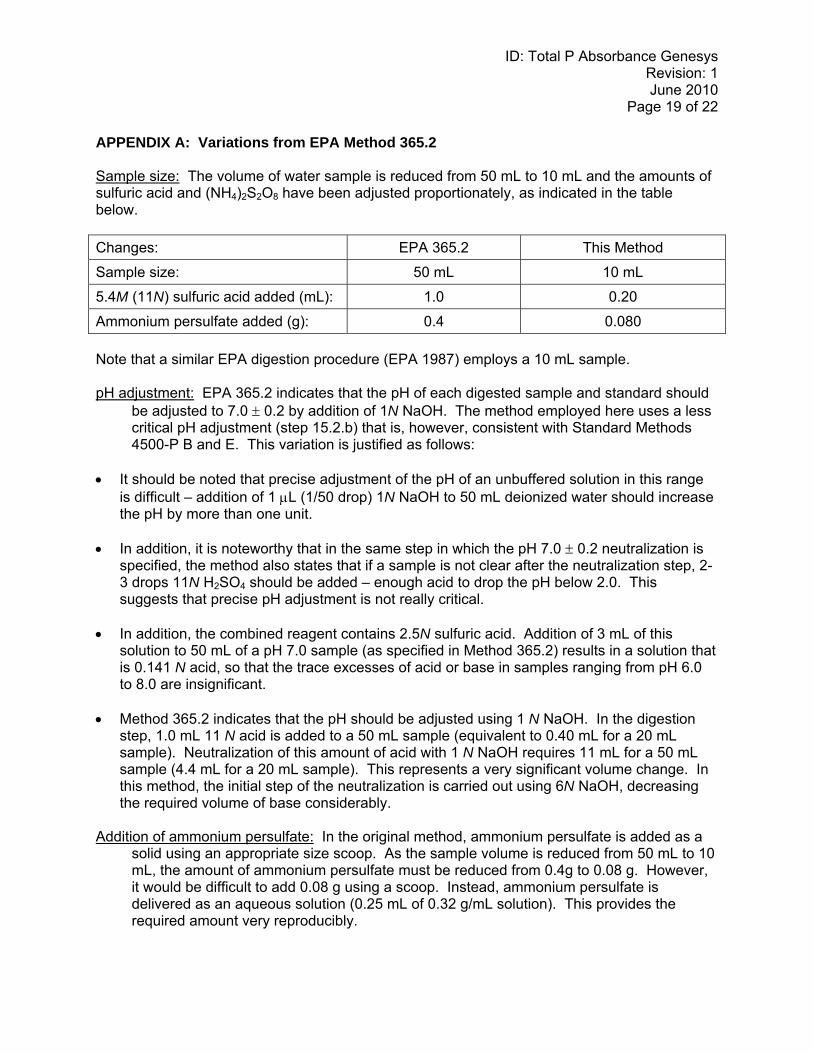
APPENDIX A: Variations from EPA Method 365.2 Sample size: The volume of water sample is reduced from 50 mL to 10 mL and the amounts of sulfuric acid and (NH4)2S2O8 have been adjusted proportionately, as indicated in the table below. Changes: EPA 365.2 This Method
Sample size: 50 mL 10 mL
5.4M (11N) sulfuric acid added (mL): 1.0 0.20
Ammonium persulfate added (g): 0.4 0.080 Note that a similar EPA digestion procedure (EPA 1987) employs a 10 mL sample. pH adjustment: EPA 365.2 indicates that the pH of each digested sample and standard should
be adjusted to 7.0 ± 0.2 by addition of 1N NaOH. The method employed here uses a less critical pH adjustment (step 15.2.b) that is, however, consistent with Standard Methods 4500-P B and E. This variation is justified as follows:
• It should be noted that precise adjustment of the pH of an unbuffered solution in this range
is difficult – addition of 1 μL (1/50 drop) 1N NaOH to 50 mL deionized water should increase the pH by more than one unit.
• In addition, it is noteworthy that in the same step in which the pH 7.0 ± 0.2 neutralization is specified, the method also states that if a sample is not clear after the neutralization step, 2-3 drops 11N H2SO4 should be added – enough acid to drop the pH below 2.0. This suggests that precise pH adjustment is not really critical.
• In addition, the combined reagent contains 2.5N sulfuric acid. Addition of 3 mL of this solution to 50 mL of a pH 7.0 sample (as specified in Method 365.2) results in a solution that is 0.141 N acid, so that the trace excesses of acid or base in samples ranging from pH 6.0 to 8.0 are insignificant.
• Method 365.2 indicates that the pH should be adjusted using 1 N NaOH. In the digestion step, 1.0 mL 11 N acid is added to a 50 mL sample (equivalent to 0.40 mL for a 20 mL sample). Neutralization of this amount of acid with 1 N NaOH requires 11 mL for a 50 mL sample (4.4 mL for a 20 mL sample). This represents a very significant volume change. In this method, the initial step of the neutralization is carried out using 6N NaOH, decreasing the required volume of base considerably.
Addition of ammonium persulfate: In the original method, ammonium persulfate is added as a
solid using an appropriate size scoop. As the sample volume is reduced from 50 mL to 10 mL, the amount of ammonium persulfate must be reduced from 0.4g to 0.08 g. However, it would be difficult to add 0.08 g using a scoop. Instead, ammonium persulfate is delivered as an aqueous solution (0.25 mL of 0.32 g/mL solution). This provides the required amount very reproducibly.

ID: Total P Absorbance Genesys Revision: 1 June 2010
Page 20 of 22
Preparation of combined reagent: EPA 365.2 requires preparation of both 11 N and 5 N sulfuric acid, for digestion and combined reagent preparation, respectively. In this method, 11 N sulfuric acid is used to prepare the mixed reagent, eliminating the need for the 5 N sulfuric acid and reducing waste generation.
Detection limits: The desired detection limit for this method is < 0.005 mg TP/L. Method 365.2, an EPA method intended for measuring phosphorus in surface waters, does not specify a detection limit, though it does specify that the method is applicable to samples in the range of 0.01 to 0.5 mg P/L. In the Precision and Accuracy section, reproducibility for a 0.029 mg P/L orthophosphate sample was ±0.010 mg P/L, suggesting a detection limit substantially higher than 0.005 mg P/L. Note that the performance data described for EPA 365.2 is based on undigested orthophosphate samples. APPENDIX B: Routine Verification Methods and Initial Validation Data Performance Verification: Tests include internal wavelength accuracy, wavelength repeatability, resolution, and noise that check the performance of the Genesys 10S UV/Vis spectrophotometer. These tests will be conducted biannually or when performance issues arise and will be recorded in the instrument log book to document reliability of the instrument and data produced. Press Tests to access the Performance Verification tests. Use the ↑↓ buttons to highlight “Performance Verification” and press Enter. 1. Wavelength Accuracy – Internal: This test locates the peaks of the internal xenon lamp and
displays the expected and measured wavelengths for the peaks. The xenon lamp has fundamental lines at 229 nm, 529 nm, and 883 nm that are an essential property of the lamp and serve as a standard. Wavelength and tolerance values are preset and cannot be changed.
a. Ensure that the cell holder is empty. b. Use the ↑↓ buttons to highlight “Wavelength Accuracy – Internal” and press Enter. c. Press Start Test. d. The Performance Verification screen will indicate a pass or fail for each wavelength. Record the date, time, and results of the test in the instrument log book. e. If the test fails, repeat the test twice to verify that that the test is failing consistently. Contact the laboratory supervisor if the test fails consistently. 2. Wavelength Repeatability: This test measures the ability of the spectrophotometer to return
to an identical wavelength in a repeatable manner. The fundamental line at 529 nm serves as the standard for this test. Wavelength and tolerance values are preset and cannot be changed.
a. Ensure that the cell holder is empty. b. Use the ↑↓ buttons to highlight “Wavelength Repeatability” and press Enter.

ID: Total P Absorbance Genesys Revision: 1 June 2010
Page 21 of 22
c. Press Start Test. d. The Performance Verification screen will indicate a pass or fail for each wavelength. Record the date, time, and results of the test in the instrument log book. e. If the test fails, repeat the test twice to verify that that the test is failing consistently. Contact the laboratory supervisor if the test fails consistently. 3. Resolution: This test measures the ability of the spectrophotometer to resolve adjacent
features in a spectrum. The test is performed by using a 0.02% (v/v) solution of toluene in hexane and requires a hexane blank. Wavelength and tolerance values are preset and cannot be changed.
a. Replace the single cell holder with the 6-position cell holder. b. Use the ↑↓ buttons to highlight “Resolution” and press Enter. c. Ensure that hexane blank is in the blank position and that the toluene in hexane is in cell 1. d. Press Start Test. e. The Performance Verification screen will indicate a pass or fail for each wavelength. Record the date, time, and results of the test in the instrument log book. f. If the test fails, repeat the test twice to verify that that the test is failing consistently. Contact the laboratory supervisor if the test fails consistently. 4. Noise: This test measures the amount of noise at 340 nm. Perform and record the 0A
measurement only. a. Ensure that the cell holder is empty. b. Use the ↑↓ buttons to highlight “Noise Measurement” and press Enter. c. Press Start Test. d. The Performance Validation screen will indicate a pass or fail for each wavelength located below “@0A”. Record the date, time, and results of the test in the instrument log book. e. If the test fails, repeat the test twice to verify that that the test is failing consistently. Contact the laboratory supervisor if the test fails consistently. Initial Data Validation: Validation samples were analyzed using a Spectronic Unicam 20 Genesys and then the Genesys 10S UV/VIS immediately after sample treatment. The data from each instrument was plotted to validate that data produced from the Genesys 10S was comparable to that derived by using the Spectronic Unicam 20 Genesys that was previously used for all nutrient analyses prior to converting nutrient analyses to the Genesys 10S spectrophotometer exclusively. The validation plot is below. Values plotted produced a positive linear relationship with an acceptable coefficient of determination, (R2) so data produced using both instruments was comparable and future outcomes using past procedures and the Genesys 10S will produce comparable results. add plot
ID: Total P Absorbance Genesys Revision: 1 June 2010
Page 22 of 22
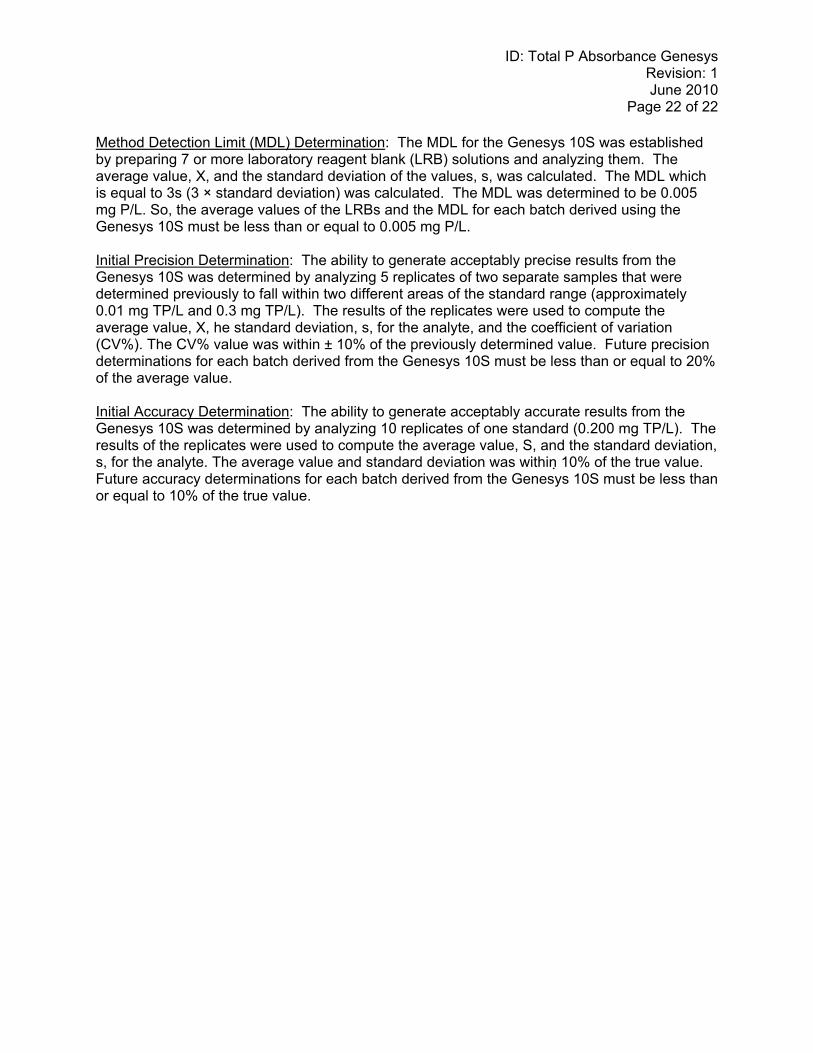
Method Detection Limit (MDL) Determination: The MDL for the Genesys 10S was established by preparing 7 or more laboratory reagent blank (LRB) solutions and analyzing them. The average value, X, and the standard deviation of the values, s, was calculated. The MDL which is equal to 3s (3 × standard deviation) was calculated. The MDL was determined to be 0.005 mg P/L. So, the average values of the LRBs and the MDL for each batch derived using the Genesys 10S must be less than or equal to 0.005 mg P/L. Initial Precision Determination: The ability to generate acceptably precise results from the Genesys 10S was determined by analyzing 5 replicates of two separate samples that were determined previously to fall within two different areas of the standard range (approximately 0.01 mg TP/L and 0.3 mg TP/L). The results of the replicates were used to compute the average value, X, he standard deviation, s, for the analyte, and the coefficient of variation (CV%). The CV% value was within ± 10% of the previously determined value. Future precision determinations for each batch derived from the Genesys 10S must be less than or equal to 20% of the average value. Initial Accuracy Determination: The ability to generate acceptably accurate results from the Genesys 10S was determined by analyzing 10 replicates of one standard (0.200 mg TP/L). The results of the replicates were used to compute the average value, S, and the standard deviation, s, for the analyte. The average value and standard deviation was within 10% of the true value. Future accuracy determinations for each batch derived from the Genesys 10S must be less than or equal to 10% of the true value.
Filename: Total P Absorbance Genesys R01.doc Directory: C:\Documents and Settings\dlg1955\Local Settings\Temporary
Internet Files Template: C:\Documents and Settings\dlg1955\Application
Data\Microsoft\Templates\Normal.dotm Title: Standard Operating Procedure for: Subject: Author: CNAS Keywords: Comments: Creation Date: 6/11/2010 1:57:00 PM Change Number: 3 Last Saved On: 6/11/2010 1:58:00 PM Last Saved By: CNAS Total Editing Time: 1 Minute Last Printed On: 3/16/2011 2:36:00 PM As of Last Complete Printing Number of Pages: 22 Number of Words: 6,769 (approx.) Number of Characters: 38,586 (approx.)