Total Maximum Daily Loads for Fecal Coliform in Soquel ... · Total Maximum Daily Loads for Fecal...
80
California Regional Water Quality Control Board Central Coast Region Total Maximum Daily Loads for Fecal Coliform in Soquel Lagoon, Soquel Creek, and Noble Gulch Final Project Report Prepared on February 27, 2008 For the March 20-21, 2008 Water Board Meeting Adopted by the California Regional Water Quality Control Board Central Coast Region on ______________, 200x Approved by the State Water Resources Control Board on ______________, 200x and the Office of Administrative Law on ______________,200x and the United States Environmental Protection Agency on ________________. 200x
Transcript of Total Maximum Daily Loads for Fecal Coliform in Soquel ... · Total Maximum Daily Loads for Fecal...

California Regional Water Quality Control Board Central Coast Region
Total Maximum Daily Loads for Fecal Coliform
in Soquel Lagoon, Soquel Creek, and Noble Gulch
Final Project Report Prepared on February 27, 2008
For the March 20-21, 2008 Water Board Meeting
Adopted by the California Regional Water Quality Control Board
Central Coast Region on ______________, 200x
Approved by the
State Water Resources Control Board on ______________, 200x
and the Office of Administrative Law
on ______________,200x and the
United States Environmental Protection Agency on ________________. 200x

CALIFORNIA REGIONAL WATER QUALITY CONTROL BOARD CENTRAL COAST REGION
895 Aerovista Place, Suite 101, San Luis Obispo, California 93401 Phone � (805) 549-3147
http://www.waterboards.ca.gov/centralcoast/
To request copies of the Basin Plan Amendment and Total Maximum Daily Loads for Fecal coliform in Soquel Lagoon, Soquel Creek, and Noble Gulch, please contact Christopher Rose at (805) 592-4770, or by
email at [email protected]. Documents also are available at: http://www.waterboards.ca.gov/centralcoast/TMDL/index.htm

STATE OF CALIFORNIA
ARNOLD SCHWARZENEGGER, Governor LINDA S. ADAMS, Agency Secretary, California Environmental Protection Agency
State Water Resources Control Board
Tam Doduc, Chair Civil Engineer, Water Rights Gary Wolff, Vice Chair Professional Engineer, Water
Quality Charles R. Hoppin Water Quality
Arthur G. Baggett, Jr. Attorney, Water Supply & Water Rights
Frances Spivey-Weber Public Member
Dorothy Rice, Executive Director
California Regional Water Quality Control Board Central Coast Region
Jeffrey S. Young, Chair Water Supply
Russell M. Jeffries, Vice Chair Industrial Water Use Leslie S. Bowker County Government Monica S. Hunter Public Gary C. Shallcross Recreation, Fish or Wildlife David T. Hodgin Water Quality Daniel M. Press Water Quality John H. Hayashi Irrigated Agriculture
Vacant Municipal Government
Roger Briggs, Executive Officer Michael Thomas, Assistant Executive Officer
This report was prepared under the direction of
Christopher Rose, TMDL Program Manager
By
Kim Sanders, Environmental Scientist
with the assistance of
Shanta Keeling, Environmental Scientist
Angela Carpenter, Environmental Scientist

CONTENTS
CONTENTS........................................................................................................................I
1. PROJECT DEFINITION......................................................................................... 1
1.1. Introduction............................................................................................................. 1
1.2. Listing Basis............................................................................................................ 1
1.3. Beneficial Uses........................................................................................................ 2
1.4. Water Quality Objectives........................................................................................ 2 1.4.1. Water Contact Recreation ..................................................................................... 3 1.4.2. Non-Contact Water Recreation............................................................................. 3 1.4.3 Shellfish Harvesting........................................................................................ 3 1.4.4 Other Applicable Beneficial Uses.......................................................................... 3
1.5. Waste Discharge Prohibition.................................................................................. 4
2. WATERSHED DESCRIPTION.............................................................................. 5
2.1. Location, Climate, and Hydrology.......................................................................... 5
2.2. Land Use ................................................................................................................. 9
3. DATA ANALYSIS.................................................................................................. 11
3.1. Water Quality Data............................................................................................... 11 3.1.1. Soquel Creek....................................................................................................... 12 3.1.2. Noble Gulch ........................................................................................................ 16 3.1.3. Bates Creek ......................................................................................................... 17 3.1.4. Storm Drains ....................................................................................................... 17 3.1.5. Data Analysis Method......................................................................................... 17
3.2. Data Analysis Summary........................................................................................ 18 3.2.1. Soquel Creek....................................................................................................... 19 3.2.2. Noble Gulch .................................................................................................. 19 Bates Creek ................................................................................................................... 20 3.2.3. Storm Drains ................................................................................................. 20
TMDL for Pathogens in Soquel Lagoon March 20-21, 2008
ii
3.3. Identification of Impaired Reaches ....................................................................... 21 3.3.1. Soquel Creek....................................................................................................... 21 3.3.2. Noble Gulch .................................................................................................. 22 3.3.3. Bates Creek ................................................................................................... 22 3.3.4. Storm Drains ................................................................................................. 22 3.3.5. Impaired Reaches.......................................................................................... 22
3.4. Microbial Source Analysis Results ....................................................................... 23
4. SOURCE ANALYSIS............................................................................................. 28
4.1. Sources of Pathogen Indicator Organisms Investigated ...................................... 28 4.1.1. Sanitary Sewer Collection System Spills and Leaks .......................................... 28 4.1.2. Storm Drain Discharges to Municipally Owned and Operated Storm Sewer Systems (MS4) Required to be Covered by an NPDES Permit.................................... 34 4.1.3. Onsite Wastewater Treatment System Discharges ............................................. 37 4.1.4. Domesticated Animal Discharges....................................................................... 39 4.1.5. Homeless Person/Encampment Discharges Not Draining to an MS4 ................ 40 4.1.6. Natural Sources................................................................................................... 41
4.2. Source Analysis Conclusions .................................................................................. 42
4.3. Comparison with Sources in Other Pathogen Impaired Waters ............................ 43
5. CRITICAL CONDITIONS AND SEASONAL VARIATION ........................... 44
5.1. Critical Conditions and Uncertainties.................................................................. 44
5.2. Seasonal Variations .............................................................................................. 44
5.3. Conclusion ............................................................................................................ 45
6. NUMERIC TARGETS........................................................................................... 46
7. LINKAGE ANALYSIS .......................................................................................... 47
8. TMDL CALCULATIONS AND ALLOCATIONS ............................................. 47
8.1. Wasteload and Load Allocations .......................................................................... 48
8.2. Margin of Safety.................................................................................................... 50
9. PUBLIC PARTICIPATION.................................................................................. 52
10. IMPLEMENTATION PLAN ............................................................................ 53

TMDL for Pathogens in Soquel Lagoon March 20-21, 2008
iii
10.1. Implementation Actions ........................................................................................ 53 10.1.1. Sanitary Sewer Collection System Spills and Leaks ....................................... 53 10.1.2. Storm Drain Discharges to Municipally Owned and Operated Storm Sewer Systems Required To Be Covered By an NPDES Permit (MS4s) ............................... 54 10.1.3 Private Sewer Laterals .................................................................................. 55 10.1.4. Domesticated Animal Discharges..................................................................... 55 10.1.5. Homeless Person/Encampment Discharges Not Draining to an MS4 .............. 57
10.2. Evaluation of Implementation Progress ............................................................... 57
10.3. Timeline and Milestones ....................................................................................... 58
10.4. Economic Considerations ..................................................................................... 59
11. MONITORING PLAN ....................................................................................... 65
11.1. Introduction........................................................................................................... 65
11.2. Monitoring Sites, Frequency, and Responsible Parties........................................ 65
11.3. Reporting............................................................................................................... 69
REFERENCES................................................................................................................ 70
12. APPENDIX-A DATA ......................................................................................... 72
13. APPENDIX-B DATA ANALYSIS .................................................................... 72
14. APPENDIX-C MICROBIAL SOURCE TRACKING DATA........................ 72
15. APPENDIX-D USE ATTAINABILITY ANALYSIS ...................................... 72

TMDL for Pathogens in Soquel Lagoon March 20-21, 2008
iv
LIST OF FIGURES Figure 2-1. Waterbodies within the Soquel Watershed................................................ 6 Figure 2-2. Soquel Lagoon Boundaries.......................................................................... 7 Figure 2-3. City of Capitola Average Monthly Precipitation from October 1996 through April 2006............................................................................................................ 8 Figure 2-4. City of Capitola and the Forest of Nisene Marks State Park Boundaries............................................................................................................................................. 9 Figure 3-1. Soquel Creek, Noble Gulch, and Bates Creek Sampling Stations showing station numbers. Below each station number is the percent of data exceeding 400 MPN over the number of samples since January 1, 2003 (for example, Station S07 exceeded the 400 MPN objective 29 percent of the time based on 58 samples). Noble Gulch and Bates Creek Sampling Stations were shaded to separate them from the Soquel Creek stations. ........................................................................... 14 Figure 3-2. Soquel Creek and Noble Gulch Ribotyping Data Collection Stations.. 24 Figure 4-1. Locations where the sewer main crosses under Soquel Creek (A: Porter Street between Soquel Wharf Road and Main Street, B: Near Nob Hill at Soquel Creek sampling station toward Soquel Wharf Road, and C.: Stockton Avenue Bridge).............................................................................................................................. 30 Figure 4-2. Total Domestic Sewage Spilled into Soquel Creek/Lagoon and Storm Drain System from 2001 to 2005. Blue bars represent total spills to Soquel Creek/Lagoon and Storm Drains. Red bars represent total spills only to Soquel Creek/Lagoon. ................................................................................................................. 31

TMDL for Pathogens in Soquel Lagoon March 20-21, 2008
v
LIST OF TABLES Table 2-1 Land uses in major subwatersheds of the Soquel Lagoon Watershed1. ... 10 Table 3-1. Santa Cruz County Environmental Health Services Fecal Coliform Sampling Locations and Period of Data Record in Soquel Creek.............................. 12 Table 3-2. Santa Cruz County Environmental Health Services Fecal Coliform Sampling Locations and Period of Data Record in Noble Gulch ............................... 16 Table 3-3. Santa Cruz County Environmental Health Services Fecal Coliform Sampling Locations and Period of Data Record in Bates Creek................................ 17 Table 3-4. Soquel Creek Percent Violations of Water Quality Objectives since January 1, 2003 ............................................................................................................... 19 Table 3-5. Noble Gulch Percent Violations of Water Quality Objectives ................ 20 Table 3-6. Bates Creek Percent Violations of Water Quality Objectives ................. 20 Table 4-1. Annual Spill Volume and Number of Spills within the Santa Cruz County Sanitation District ............................................................................................. 32 Table 5-1. Soquel Creek and Noble Gulch Seasonal Analysis ................................... 45 Table 8-1. Allocations and Responsible Parties .......................................................... 49 Table 11-1. Monitoring Required................................................................................. 67

TMDL for Pathogens in Soquel Lagoon March 20-21, 2008
1
1. PROJECT DEFINITION
1.1. Introduction Soquel Lagoon was identified as impaired for pathogens and was placed on the 1996 Clean Water Act 303(d) list of impaired waters. Based on historic and recent data, concentrations exceeded the water quality objectives for fecal coliform. Staff proposed allocations and implementation actions for identified controllable sources. The California Regional Water Quality Control Board, Central Coast Region (Water Board) staff is proposing to remove the shellfish harvesting beneficial use in the Soquel Lagoon as part of this project. Supporting documentation is included in the Use Attainability Analysis contained in Appendix-D. Clean Water Act Section 303(d) requires the State to establish TMDLs at levels that attain water quality objectives. The State must also incorporate seasonal variations and a margin of safety into TMDLs to account for any lack of knowledge concerning the relationship between load limits and water quality.
1.2. Listing Basis According to the USEPA Protocol for Developing Pathogen TMDLs, “the numbers of pathogenic organisms present in polluted waters generally are few and difficult to isolate and identify, as well as highly varied in their characteristic and type (United States Environmental Protection Agency, Protocol for Developing Pathogen TMDLs, January 2001).” Therefore, scientists and public health officials typically choose to monitor nonpathogenic bacteria that are usually associated with pathogens transmitted by fecal contamination but are more easily sampled and measured. These associated bacteria are called indicator organisms, or a fecal indicator bacteria (FIB). Indicator organisms indicate the potential presence of human and animal pathogenic organisms. When large fecal coliform populations are present in the water, it is assumed that there is a greater likelihood that pathogens are present. The Basin Plan uses fecal coliform concentrations as water quality objectives to represent pathogenic organisms. Soquel Lagoon was placed on the 303(d) list of impaired waters in 1996. The Soquel Lagoon was placed on the list of impaired waters based on fecal indicator bacteria data from the Santa Cruz County Environmental Health Department; the data had exceedances of water quality objectives in all years for which there was data (1986 to 1994). Additional data collected between 1994 and 2005 also had exceedances of water quality objectives.

TMDL for Pathogens in Soquel Lagoon March 20-21, 2008
2
1.3. Beneficial Uses The Basin Plan describes beneficial uses for water bodies in the Central Coast Region. The Soquel Lagoon beneficial uses are:
� Contact and Non-contact Recreation, � Wildlife Habitat, � Cold Freshwater Habitat, � Migration of Aquatic Organisms, � Spawning, Reproduction and/or Early Development, � Rare, Threatened or Endangered Species, � Estuarine Habitat, � Commercial and Sport Fishing, and � Shellfish Harvesting.
Central Coast Water Board staff is proposing to remove the shellfish harvesting beneficial use in the Soquel Lagoon. This is primarily based on the fact that staff found no evidence of the shellfish harvesting beneficial use in the Soquel Lagoon (Lagoon), nor the potential to support such a use. Hydraulic modifications, seasonal Lagoon closure to tidal circulation, lack of suitable physical conditions and lack of evidence of any historic (since 1975) or current shellfish harvesting have led Central Coast Water Board staff to propose removal of the shellfish harvesting beneficial use in the Lagoon. Appendix-D, “Use Attainability Analysis for the Soquel Lagoon,” provides the basis for staff’s proposal.
1.4. Water Quality Objectives The Basin Plan states, “Controllable (emphasis added) water quality shall conform to the water quality objectives contained herein. When other conditions cause degradation of water quality beyond the levels or limits established as water quality objectives, controllable conditions shall not cause further degradation of water quality.” This requirement applies to all waters of the State. The Basin Plan contains specific water quality objectives for fecal coliform (Basin Plan, pg. III-10); the applicable objectives are listed in the following subsections and apply to all the waterbodies that are part of this project. Escherichia coli (E. coli) are often used as fecal indicator bacteria. The Basin Plan does not include water quality objectives for E. coli. However, the United States Environmental Protection Agency (USEPA) recommends E. coli not exceed a log mean of 126 CFU per 100 mL, based on not less than generally 5 samples equally spaced over a 30-day period (USEPA, Ambient Water Quality Criteria for Bacteria-1986, January 1986).

TMDL for Pathogens in Soquel Lagoon March 20-21, 2008
3
1.4.1. Water Contact Recreation The following water quality objective protects the water contact beneficial use: Fecal coliform concentration, based on a minimum of not less than five samples for any 30-day period, shall not exceed a log mean of 200 per 100 mL, nor shall more than 10 percent of samples collected during any 30-day period exceed 400 per 100 mL.1 All the waterbodies assigned allocations in this project are designated this beneficial use.
1.4.2. Non-Contact Water Recreation The following water quality objective protects the non-contact water beneficial use: Fecal coliform concentration, based on a minimum of not less than five samples for any 30-day period, shall not exceed a log mean of 2000 per 100 mL, nor shall more than 10 percent of samples collected during any 30-day period exceed 4000 per 100 mL.
1.4.3 Shellfish Harvesting The following water quality objective protects the shellfish harvesting beneficial use. However, please note that staff is proposing to remove the shellfish harvesting beneficial use (from the Soquel Lagoon) as part of this project. If this beneficial use is removed, then the following water quality objective will not apply. At all areas where shellfish may be harvested for human consumption, the median total coliform concentration throughout the water column for any 30-day period shall not exceed 70 per 100 mL, nor shall more than 10 percent of the samples collected during any 30-day period exceed 230 per 100 mL for a five tube decimal dilution test or 330 per 100 mL when a three-tube decimal dilution test its used. The Central Coast Water Board is proposing to remove the shellfish harvesting beneficial use; therefore, these objectives will not apply if the proposal is approved.
1.4.4 Other Applicable Beneficial Uses The Basin Plan does not include explicit numeric objectives for fecal coliform for the protection of other surface water beneficial uses.
1 Throughout this report, fecal coliform units are expressed as colony forming unit (CFU), organisms, count (#/100ml or CFU/100 ml) and most probable number (MPN). All unit expressions are considered equivalent fecal coliform bacteria concentration measures (Reference: Protocol for Developing Pathogen TMDLs).
TMDL for Pathogens in Soquel Lagoon March 20-21, 2008
4
1.5. Waste Discharge Prohibition The Basin Plan contains the following waste discharge prohibition (Chapter Five, Section IV.B).
“Waste discharges to the following inland waters are prohibited: All surface waters within the San Lorenzo River, Aptos-Soquel, and San Antonio Creek Subbasins and all water contact recreation areas except where benefits can be realized from direct discharge of reclaimed water.”
The Soquel Lagoon is within the Aptos-Soquel Subbasin, and as such, no waste discharges are allowed to this waterbody. The Central Coast Water Board adopted the prohibition in 1975; the prohibition was intended to apply to point source discharges. In 2004, the State Water Resources Control Board (State Board) adopted the Policy for Implementation and Enforcement of the Nonpoint Source Pollution Control Program, May 20, 2004 (Nonpoint Source Implementation Policy). The Nonpoint Source Implementation Policy requires the Central Coast Water Board to regulate all nonpoint sources (NPS) of pollution using the administrative permitting authorities provided by the Porter-Cologne Water Quality Control Act. Administrative permitting authorities include Waste Discharge Requirements (WDRs), waivers of WDRs, or Basin Plan prohibitions. Responsible parties are to participate in the development and implementation of NPS Pollution Control Implementation Programs designed around their type of nonpoint source discharge. Staff is proposing that the existing prohibition for San Lorenzo River, Aptos-Soquel, and San Antonio Creek Subbasins be modified (modified prohibition) to include specific types of nonpoint sources of pollution. The proposed modified prohibition is being developed concurrently with this TMDL, but is a proposed basin plan amendment made part of the pathogen TMDL for the San Lorenzo River Watershed ((also being developed concurrently, see Resolution No. RB3-2008-0001).

TMDL for Pathogens in Soquel Lagoon March 20-21, 2008
5
2. WATERSHED DESCRIPTION
2.1. Location, Climate, and Hydrology Soquel Creek flows from its headwaters in the Santa Cruz Mountains toward the city of Capitola and drains into the Pacific Ocean. The Soquel Lagoon (the Lagoon) is formed in Soquel Creek’s southernmost reach within the City of Capitola. According to the U.S. Census Bureau, the City of Capitola population in the year 2004 was approximately 9,640. The Soquel Lagoon Watershed (Watershed) is approximately 42 square miles and is made up of several subwatersheds, including: Soquel Lagoon, Soquel Creek, Bates Creek and Noble Gulch (see Figure 2-1). The largest of the three, the Soquel Creek subwatershed, drains approximately 38 square miles. Two waterbodies, Noble Gulch (the Gulch) and Bates Creek, drain into the downstream most, and most urbanized, two miles of Soquel Creek. Noble Gulch is piped underground for the last 0.4 mile prior to draining into the Lagoon from the northeast. Bates Creek drains into Soquel Creek from the northeast approximately two miles north of the mouth of the Lagoon. Several other creeks flow into Soquel Creek in the upper Soquel Watershed (Figure 2-1). Capitola Public Works Department constructs a sandbar across the mouth of the Lagoon each year in May and monitors breaching in the winter to avoid flooding. The Lagoon’s northernmost boundary is loosely defined as “somewhere between the Railroad Trestle and Nob Hill,” based on the observance of “the saltwater prism, which during high tide can extend as far upstream as Nob Hill” (personal communication, Steve Peters, Water Quality Specialist, Health Services Agency, County of Santa Cruz, March 9, 2006). Nob Hill is a market located adjacent to the Lagoon approximately 0.7 miles north of the mouth of the Lagoon. Figure 2-2 illustrates the approximate location of the Lagoon in relation to other land references.

TMDL for Pathogens in Soquel Lagoon March 20-21, 2008
6
Figure 2-1. Waterbodies within the Soquel Watershed

TMDL for Pathogens in Soquel Lagoon March 20-21, 2008
7
Figure 2-2. Soquel Lagoon Boundaries
Soquel Lagoon inland boundary varies between the railroad trestle and Nob Hill
Soquel Lagoon approximate downstream end

TMDL for Pathogens in Soquel Lagoon March 20-21, 2008
8
The Watershed has a Mediterranean climate. Summers are warm and dry, cooled at times by fog at lower elevations due to the proximity of the Pacific Ocean. Winters are cool and wet. Average annual precipitation from October 1996 thorough April 2006 was approximately 21.80 inches at the City of Capitola (Figure 2-3). The wettest time of the year was generally from December to April.
����
����
����
����
����
����
����
�� �
��� � �
� ���� ��
��
����
���
������
��������
��� ��
! "����
#������
��������������� ������������
Figure 2-3. City of Capitola Average Monthly Precipitation from October 1996 through April 2006
Information provided in the Assessment of Sources of Bacterial Contamination At Santa Cruz County Beaches (Ricker and Peters, 2006) indicated that flow based on measurements at the mouth of Soquel Creek was 4.3 cubic feet per second (cfs) during mid-summer. The document also indicated that flow in Soquel Creek, approximately 0.7 mile upstream from the mouth, was 4.0 cfs and in Noble Gulch was 0.2 cfs. Both flow rates were estimates during mid-summer months. The flow rate estimate at approximately 0.7 mile upstream from the mouth was based on flow at the United States Geologic Survey gauge approximately 0.9 mile upstream of this location and was adjusted for input from the outfalls at this location. Outfall flow was based on the document, Soquel Watershed Assessment and Enhancement Project Plan (D.W. Alley, et al., 2003). The flow rate estimate in Noble Gulch was based on visual observation, and is an estimate of typical conditions. Although both of the later flow rates were estimates, they provide an idea of relative flow of the two waterbodies.

TMDL for Pathogens in Soquel Lagoon March 20-21, 2008
9
2.2. Land Use The Watershed includes lands under the jurisdiction of the City of Capitola, the County of Santa Cruz, and California State Parks system. Figure 2-4 illustrates the California State Parks and City of Capitola lands in the Soquel Lagoon watershed.
Figure 2-4. City of Capitola and the Forest of Nisene Marks State Park Boundaries

TMDL for Pathogens in Soquel Lagoon March 20-21, 2008
10
Land uses in the Watershed include bare lands, pasture, urbanized areas, and naturally vegetated lands that include areas covered with forest, shrubs, and grasses. Ninety three percent of the land in the Soquel Creek Subwatershed is covered by naturally occurring vegetation. The second largest land use is urban at seven percent. The majority of urban land use is concentrated in the southern tip of Soquel Creek Subwatershed while forest and other naturally vegetated land uses cover the remainder. Pasture/hay, bare ground, and open water account for a combined area of less than one percent of the land area in the Soquel Creek Subwatershed. Sixty eight percent of Noble Gulch Subwatershed is urban development, while 32 percent is naturally occurring vegetation. The Bates Creek Subwatershed is farther upstream away from the more urbanized section of the Watershed than Noble Gulch. Therefore the majority of land (84 percent) is covered by naturally occurring vegetation. However, 10 percent of the land use is urban, and six percent is pasture/hay. Table 2-1 summarizes the land uses occurring in the project Watershed.
Table 2-1 Land uses in major subwatersheds of the Soquel Lagoon Watershed1.
Land Use / percent of area covered by type Subwatershed Urban Naturally Vegetated Pasture/hay Soquel Creek 7% 93% Noble Gulch 68% 32% Bates Creek 10% 84% 6% 1 Staff used data which represents land uses from 1988 to 1994. (Land uses have not changed significantly since 1994.)

TMDL for Pathogens in Soquel Lagoon March 20-21, 2008
11
3. DATA ANALYSIS
3.1. Water Quality Data This section discusses the water quality data staff used to develop these TMDLs, the results of water quality analyses, and the impacted areas. Staff analyzed data from water quality sampling conducted by two sources: 1) The County of Santa Cruz Environmental Health Services, and 2) The Coastal Watershed Council (CWC). Data provided by the County was collected from 1986 to 2006; however, water board staff used only data collected from 2003 to 2006 between the Lagoon mouth and the West Branch of Soquel Creek at San Jose and Olive Springs Roads. Staff also analyzed Santa Cruz County data from 2003 to 2006 from Noble Gulch and Bates Creek. Data provided by the CWC was collected in 2004 and 2005 from storm drains in the Capitola area. Staff analyzed CWC data from those storm drains that emptied into the Lagoon. There were several stations sampled along Noble Gulch with very small data sets. Santa Cruz County staff tried to isolate areas of highest contamination and sampled some of the locations only a few times or less since 2003. The data was not included here due to the small sample sizes and because staff concluded the data would not change the conclusions in this report. The data is included in Appendix A. Additional data provided by the County of Santa Cruz was submitted late in the writing of this Final Project Report. Staff reviewed the data and concluded it would not change the implementation strategies of this report. However, staff included one of the data sets in this analysis because it replaced a former data set that had questionable data quality. The remainder of the data that was submitted late is included in Appendix A.

TMDL for Pathogens in Soquel Lagoon March 20-21, 2008
12
3.1.1. Soquel Creek Fecal coliform sampling activities for Soquel Creek are shown in the table below.
Table 3-1. Santa Cruz County Environmental Health Services Fecal Coliform Sampling Locations and Period of Data Record in Soquel Creek
Station # Station Location
Number of Samples
from 2003 to 2006
Frequency of Samples from 2003 to 2006
Total Period of
Record1
S0 Soquel Creek at Flume Outlet 211
2003 - Irregular 2004 to 2006 -
Weekly 1987 to 2006
S04 Soquel Creek Above Stockton Bridge East 6 Irregular 1987 to 2005
S07 Soquel Creek at Railroad Trestle 58 Irregular 1986 to 2006
S23 Soquel Creek at Nob Hill 82 Irregular 1986 to 2006
S2315 Soquel Creek at Porter Street Bridge 35 Irregular 2003 to 2006
S6 West Branch Soquel Creek
at San Jose at Olive Springs Road
42 Irregular 2003 to 2006
The County collected fecal coliform samples at the most downstream station in Soquel Creek (Soquel Creek at Flume Outlet; SO) at least weekly from 2003 to 2006 with the exception of three months in 2003 (Figure 3-1). Approximately eight to 10 samples were collected each month in 2005 and January of 2006 from the same station. Four additional stations in the lowest 1.75 miles of Soquel Creek and Lagoon (SO4-S2315) were sampled irregularly (Table 3-1). A fifth station (S6; approximately 4.5 miles upstream of Soquel Lagoon) was sampled irregularly. Santa Cruz County staff sampled additional stations along Soquel Creek a few times since 2003. There were 12 total samples collected from six different sites in an approximately 0.5 mile reach upstream of the Soquel Creek at Porter Street Bridge station. Water Board staff included the stations (S232, S2321, S24, S234, S253, and S275) and data in Appendix A. Staff did not include the data in Table 3.1 because of the number of stations with such small data sets. The sampling stations of Soquel Lagoon and Creek from the mouth to the upper watershed provided information as follows. Staff determined stations downstream of and 1 Data collection periods of record may contain gaps. Only data from 2003 to 2006 were used in the analysis.

TMDL for Pathogens in Soquel Lagoon March 20-21, 2008
13
including the Soquel Creek at Railroad Trestle sampling station (S07) provided information on fecal coliform levels in the Noble Gulch Subwatershed. Stations from the Soquel Creek at Nob Hill sampling station (S23) to the Soquel Creek at Porter Street Bridge sampling station (S2315) provided information regarding fecal coliform for a reach above the Lagoon but still within the urban section of the Soquel watershed and including some of Bates Creek watershed. The West Branch Soquel Creek at San Jose at Olive Springs Road sampling station (S6; Figure 3-2) provides information regarding water quality from approximately half way upstream in the watershed, which is a receiving water for mostly rural residential and naturally vegetated land. Figure 3-1 and Figure 3-2 illustrate monitoring site locations and proportion of data exceeding water quality objectives.
TMDL for Pathogens in Soquel Lagoon March 20-21, 2008
14
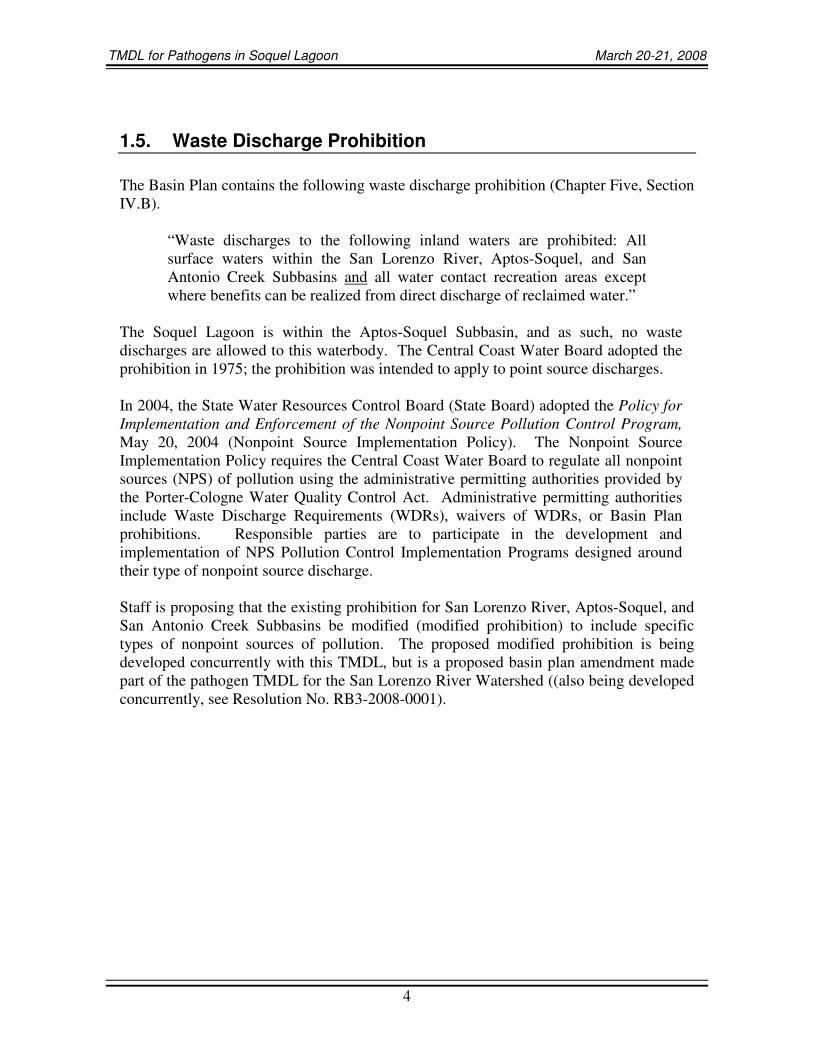
Figure 3-1. Soquel Creek, Noble Gulch, and Bates Creek Sampling Stations showing station numbers. Below each station number is the percent of data exceeding 400 MPN over the number of samples since January 1, 2003 (for example, Station S07 exceeded the 400 MPN objective 29 percent of the time based on 58 samples). Noble Gulch and Bates Creek Sampling Stations were shaded to separate them from the Soquel Creek stations.
12/82

TMDL for Pathogens in Soquel Lagoon March 20-21, 2008
15
Figure 3-2. West Branch Soquel Creek at San Jose at Olive Springs Road Sampling Station (S6). (This Sampling Station was too far upstream in the Watershed to include on Figure 3-1). The Bates Creek Sampling Station (S3) from Figure 3-1 was included for reference. Both stations show percent exceedance over number of samples since January 1, 2003.)
TMDL for Pathogens in Soquel Lagoon March 20-21, 2008
16
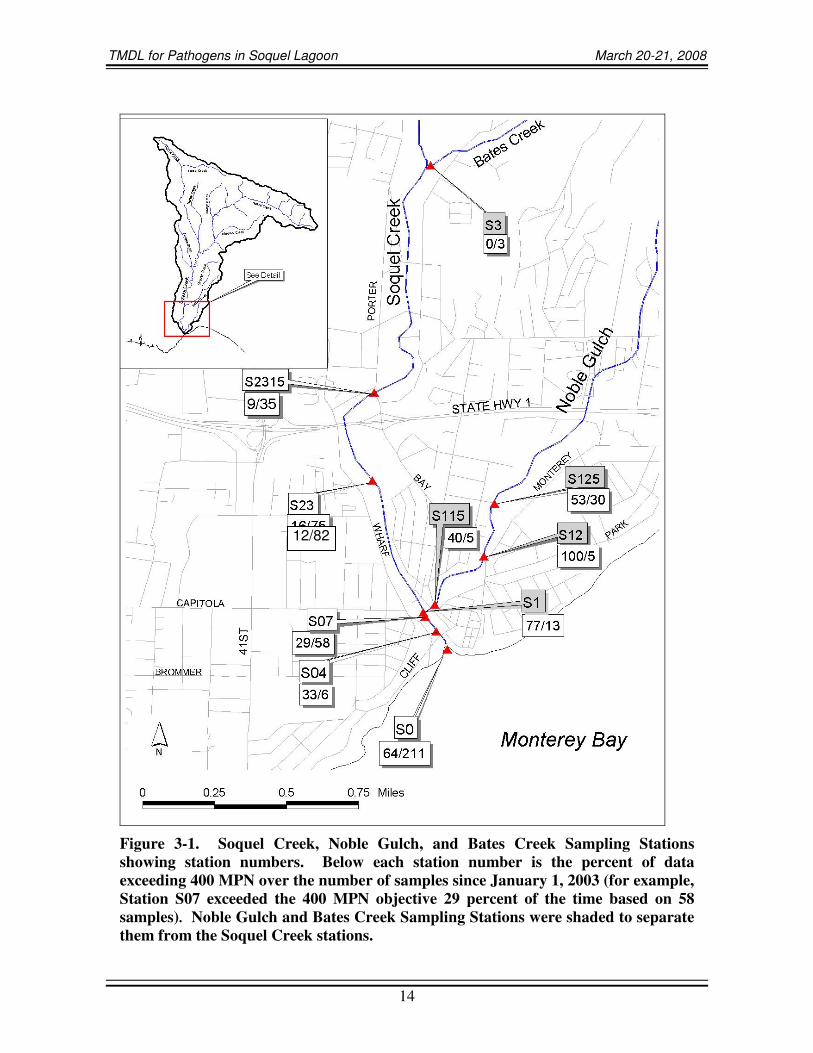
3.1.2. Noble Gulch Recent fecal coliform sampling activities for Noble Gulch are shown in the Table below.
Table 3-2. Santa Cruz County Environmental Health Services Fecal Coliform Sampling Locations and Period of Data Record in Noble Gulch
Station # Station Location
Number of Samples from 2003 to 2006
Frequency of Samples from 2003
to 2006
Total Period of Record1
S1 Noble Gulch at Soquel Creek 13 Irregular 1986 to 2005
S115 Noble Gulch at Pacific Cove Entrance 5 Irregular 2005
S12 Noble Gulch at Tunnel at Bay 5 Irregular 2003 to 2005
S125 Noble Gulch at St. Joe’s Church 30 Irregular 2003 to 2006
Santa Cruz County Environmental Health Services sampled four stations on Noble Gulch irregularly (Figure 3-1). All data is included in Appendix 1 of this report. Although Noble Gulch flowed at approximately 0.05 the rate of the flow of Soquel Creek (see Section 2.1), it discharged directly into the Lagoon. Therefore, analyzing data from Noble Gulch was important to the water quality analysis of this report.
1 Data collection periods of record may contain gaps.

TMDL for Pathogens in Soquel Lagoon March 20-21, 2008
17
3.1.3. Bates Creek Recent fecal coliform sampling activities for Bates Creek are shown in the Table below.
Table 3-3. Santa Cruz County Environmental Health Services Fecal Coliform Sampling Locations and Period of Data Record in Bates Creek
Station # Station Location
Number of Samples
from 2003 to 2006
Frequency of Samples from 2003 to 2006
Total Period of
Record1
S3 Bates Creek at Soquel Creek 3 Irregular 2004 to 2005
The County collected fecal coliform samples at one Bates Creek station (Bates Creek at Soquel Creek; S3) on three occasions in 2004 and 2005 (Figure 3-1). This sampling site was just upstream of the confluence of Soquel Creek and Bates Creek. Although this is a small data set, it is included here to show that this is the only data from 2003 to 2006 and to support the conclusion in the monitoring section that more data is needed from this Creek.
3.1.4. Storm Drains Santa Cruz County staff collected very few water samples from 2003 to 2006 in storm drains that drain to Soquel Creek because the sampling stations were either under the water level of Soquel Creek and could not be sampled, or they were dry. Therefore, staff did not use data from these samples in their analysis. The data provided by CWC used in this report was E. coli data collected at two storm drain sampling stations. Two samples were collected in 2004 and eight samples were collected in 2005 from two storm drains that emptied into Soquel Creek and Lagoon (the data is included in Appendix A). Staff analyzed the 2005 data only, because the 2004 data set was small. Staff reviewed the 2004 data and determined it would not change the conclusions of this report. One station, the Creekside sampling station, was located approximately 0.8 mile upstream of the mouth of the Lagoon and a second station, the Monterey Ave. station, was located along Monterey Ave. approximately 0.3 mile northeast of the Lagoon.
3.1.5. Data Analysis Method Staff analyzed Santa Cruz County Environmental Health water quality sampling results using a program titled “Fecal Coliform Investigation and Analysis Spreadsheet”
TMDL for Pathogens in Soquel Lagoon March 20-21, 2008
18
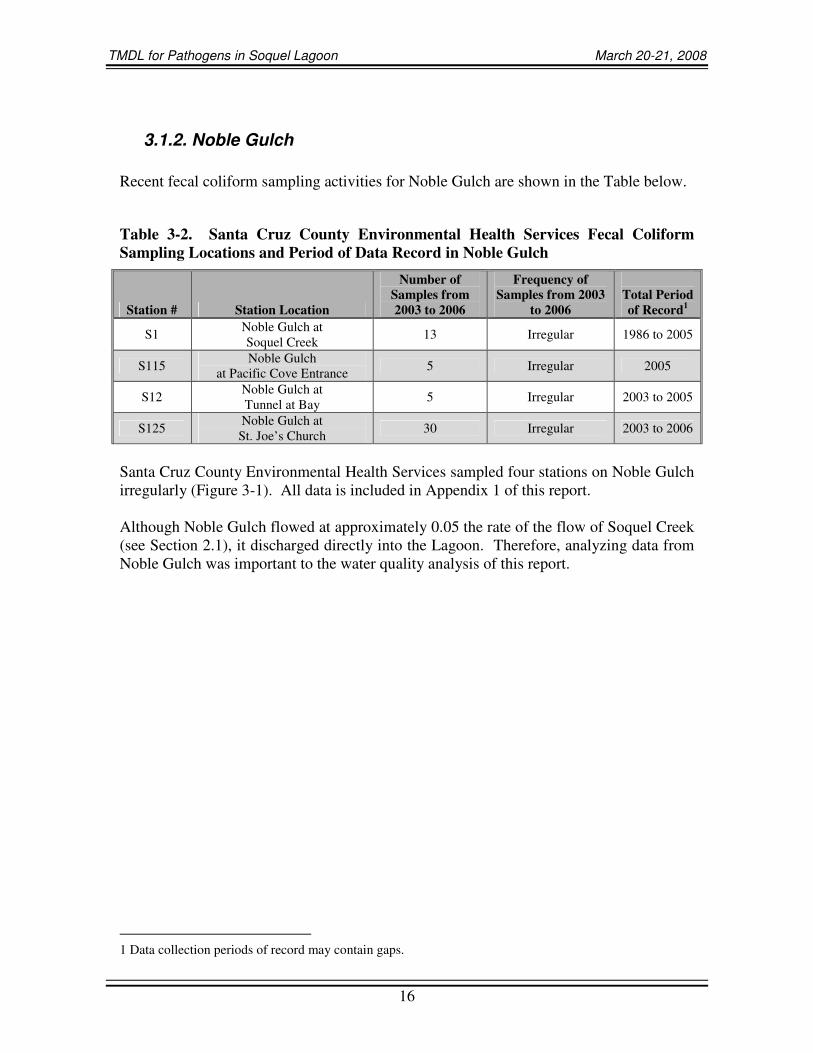
(FECIA). FECIA is a fully automated spreadsheet designed to assist in characterization and quantification of pathogenic indicator organism water quality objectives exceedances. Observed data are compared against specified values equal to water quality objectives to determine the magnitude and frequency of exceedances. Staff used the FECIA program to generate the data analysis figures and tables located in Appendix B of this report. Figures were generated for each sampling station. Each figure displays analyzed data collected from 2003 to 2006 as shown in the tables in Section 3.1. The figures display either the water contact recreation beneficial use geometric mean water quality objective or the water contact recreation beneficial use maximum water quality objective. The maximum water quality objective (400 MPN) was used when the County of Santa Cruz took less than five samples in a 30-day period. Concentration ranges, the range of concentrations within the 25th -75th percentile range, the mean concentration, and the median concentration are shown in the resulting FECIA analysis. Some sampling stations lacked enough data for staff to conclude impairment based on water quality objectives. Therefore, staff based their conclusions regarding impairment on the Water Quality Control Policy For Developing California’s Clean Water Act Section 303(d) List (State Water Resources Control Board, adopted on September 2004). Staff also generated tables that summarized data on a monthly basis. Tables were generated for each sampling station. Each table shows the mean, median, minimum, maximum, the 25th percent deviation, the 75th percent deviation, the number of water quality objective exceedances, the sample count, and the percent sample exceedance. There were only two 2004 CWC data samples, therefore formal analysis was unnecessary. CWC data from 2005 was analyzed by creating an Excel table of data and statistics. The data from both years and the Excel table of the 2005 statistics are located in Appendix 1 of this report.
3.2. Data Analysis Summary This section summarizes data analysis results contained in Appendices A and B. For each station sampled by Santa Cruz County, the percent violation of the geometric mean and maximum water quality objective are provided as well as the number of sample sets used to calculate the percent violation. FECIA calculated violations of the geometric mean water quality objective when five or more samples were available in a 30-day period. Sampling stations are listed from the most downstream station (top row of the table) to the most upstream station (bottom row of the table) on all three waterbody tables.

TMDL for Pathogens in Soquel Lagoon March 20-21, 2008
19
3.2.1. Soquel Creek Table 3-4 shows the percent violation of the geometric mean objective, maximum water quality objective, and the number of samples used to determine the percent violation of these objectives in Soquel Creek.
Table 3-4. Soquel Creek Percent Violations of Water Quality Objectives since January 1, 2003
Geometric Mean Water Quality Objective (200 MPN fecal
coliform)
Maximum Water Quality Objective (400 MPN fecal
coliform) Station
# Station Location % Violations Number of Samples Sets % Violations Number of
Samples
S0 Soquel Creek at Flume Outlet 87 193 64 211
S04 Soquel Creek Above Stockton Bridge East 100 2 33 6
S07 Soquel Creek at Railroad Trestle 80 25 29 58
S23 Soquel Creek at Nob Hill 19 53 15 82
S2315 Soquel Creek at Porter Street Bridge (1) (1) 9 35
S6 West Branch Soquel
Creek at San Jose at Olive Springs Road
(1) (1) 7 42
(1) Insufficient data to calculate geometric mean Note that samples from each of the monitoring stations in Soquel Creek exceeded one or both of the fecal coliform water quality objectives. Staff did not analyze the 12 samples from the 0.5 mile reach upstream of the Soquel Creek at Porter Street Bridge sampling station using FECIA analysis. However, staff considered this data in determining the impaired reaches. Staff noted that only one of the 12 samples exceeded the maximum water quality objective (at 810 MPN/100mL; the maximum water quality objective is 400 MPN/100mL). All except one of the remaining 11 samples were less than 200 MPN/100mL.
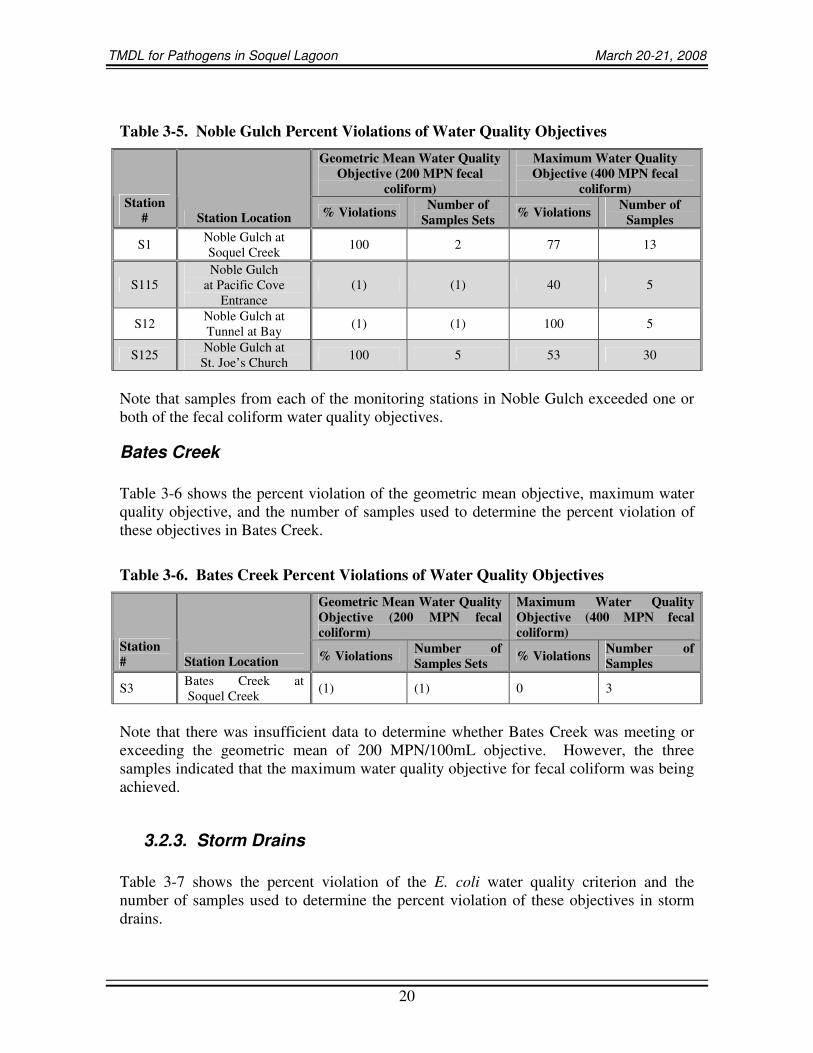
3.2.2. Noble Gulch Table 3-5 shows the percent violation of the geometric mean objective, maximum water quality objective, and the number of samples used to determine the percent violation of these objectives in Noble Gulch.
TMDL for Pathogens in Soquel Lagoon March 20-21, 2008
20
Table 3-5. Noble Gulch Percent Violations of Water Quality Objectives
Geometric Mean Water Quality Objective (200 MPN fecal
coliform)
Maximum Water Quality Objective (400 MPN fecal
coliform) Station
# Station Location % Violations Number of Samples Sets % Violations Number of
Samples
S1 Noble Gulch at Soquel Creek 100 2 77 13
S115 Noble Gulch
at Pacific Cove Entrance
(1) (1) 40 5
S12 Noble Gulch at Tunnel at Bay (1) (1) 100 5
S125 Noble Gulch at St. Joe’s Church 100 5 53 30
Note that samples from each of the monitoring stations in Noble Gulch exceeded one or both of the fecal coliform water quality objectives.
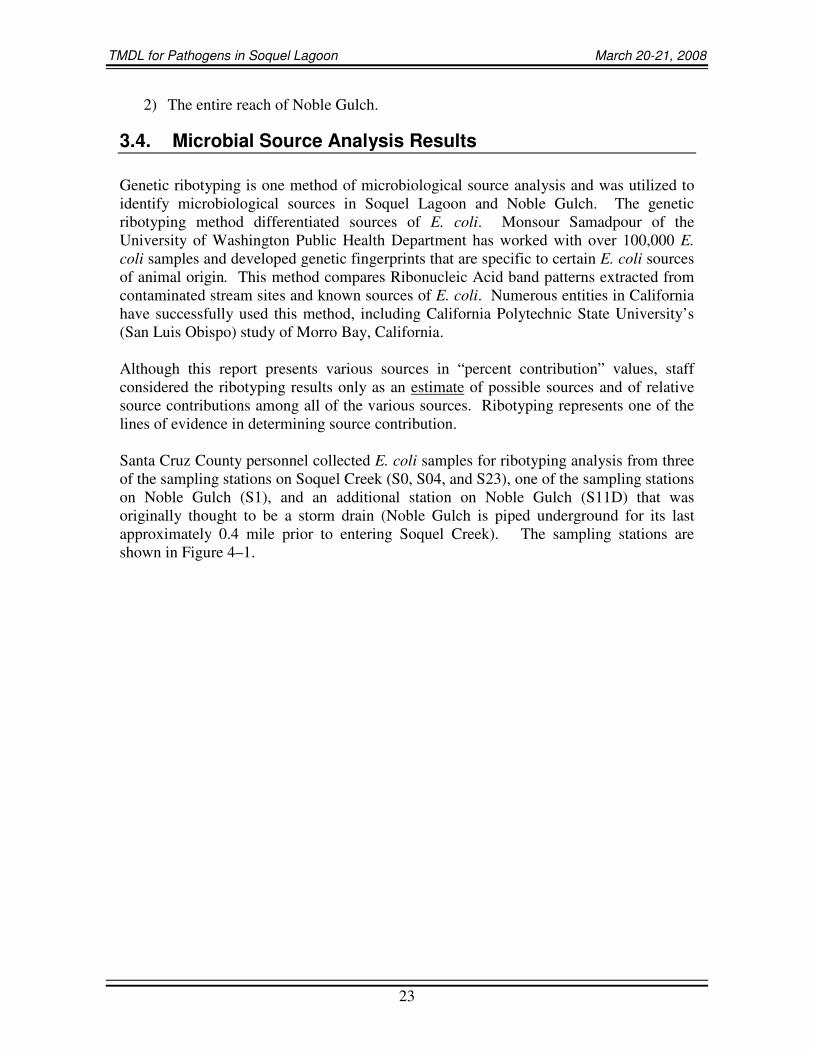
Bates Creek Table 3-6 shows the percent violation of the geometric mean objective, maximum water quality objective, and the number of samples used to determine the percent violation of these objectives in Bates Creek.
Table 3-6. Bates Creek Percent Violations of Water Quality Objectives
Geometric Mean Water Quality Objective (200 MPN fecal coliform)
Maximum Water Quality Objective (400 MPN fecal coliform)
Station # Station Location % Violations Number of
Samples Sets % Violations Number of Samples
S3 Bates Creek at Soquel Creek (1) (1) 0 3
Note that there was insufficient data to determine whether Bates Creek was meeting or exceeding the geometric mean of 200 MPN/100mL objective. However, the three samples indicated that the maximum water quality objective for fecal coliform was being achieved.
3.2.3. Storm Drains Table 3-7 shows the percent violation of the E. coli water quality criterion and the number of samples used to determine the percent violation of these objectives in storm drains.

TMDL for Pathogens in Soquel Lagoon March 20-21, 2008
21
Table 3-7. Coastal Watershed Council 2005 E. coli Data and Statistics
Location Date E. coli
(MPN/100mL)
%of samples >E. coli Target
(235MPN)
Number of
Samples Creekside 7/27/2005 5
8/29/2005 379 9/29/2005 20 10/26/2005 173 25% 4
Monterey Ave. 7/27/2005 323
8/29/2005 3873 9/29/2005 598 10/26/2005 4884 100% 4
3.3. Identification of Impaired Reaches This section characterizes the impaired reaches of Soquel Creek, Noble Gulch, Bates Creek, and the status of storm drains sampled by CWC in terms of E. coli levels. The subwatersheds and the waterbodies are identified using Figures 2-5 and 3-1.
3.3.1. Soquel Creek Soquel Creek was impaired from the mouth of the Lagoon upstream to the Soquel Creek at Porter Street Bridge sampling station (the first sampling station that did not have impaired water quality). The percentage of exceedances at each sampling station decreased moving upstream from 64 percent at the mouth of the Lagoon to nine percent at the Soquel Creek at Porter Street Bridge station. The trend of decreasing fecal coliform levels extended into the next approximately 0.5 mile unimpaired reach upstream of the Soquel Creek at Porter Street Bridge sampling station. Staff concluded this reach was unimpaired based on 12 samples from six stations within this 0.5 mile reach. Although a robust data set was lacking at any one station within the reach, considered together, there was only one data point out of 12 that exceeded the maximum water quality objective in this reach. The farthest upstream station (West Branch Soquel Creek at San Jose at Olive Springs Road, approximately 4.5 miles upstream of the Lagoon) at which data was collected exceeded the water quality objective in seven percent of the samples. Staff determined this station was also unimpaired.

TMDL for Pathogens in Soquel Lagoon March 20-21, 2008
22
3.3.2. Noble Gulch Fecal coliform objectives were exceeded in Noble Gulch at three of the four sampling stations downstream of and including the Noble Gulch at St. Joe’s Church sampling station, approximately 0.6 mile upstream of the confluence of Noble Gulch and Soquel Creek. Although the unanalyzed data sets (described above in Section 3.1) for this waterbody were small, the data, when considered together, supported the conclusion that Noble Gulch was impaired. All of the data (nine samples collected in February and March of 2005 within an approximately 0.75 mile reach upstream from Highway One) at four stations exceeded the water quality objective. Staff concluded all reaches of Noble Gulch were impaired because there were no monitoring stations meeting water quality objectives.
3.3.3. Bates Creek
Only one station was sampled in Bates Creek located just prior to the confluence of Bates and Soquel Creeks. No fecal coliform maximum objective (400 MPN per 100 mL) exceedances were recorded at this station for the 3 samples collected from 2004 to 2005. Staff was unable to make a conclusion regarding the potential impairment of this waterbody due to the small data set. However, sampling of Soquel Creek immediately downstream of Bates Creek is required in the monitoring plan in Section 11. Samples from this location will help to determine water quality from Bates Creek.
3.3.4. Storm Drains E. coli water quality criterion was exceeded at the Creekside and Monterey Ave (CWC) sampling stations in 2005. Exceedances at the Creekside station occurred one time out of four. Exceedances at the Monterey Ave. station occurred four times out of four. Both storm drains empty into Soquel Creek. Although the sample sizes were small, Central Coast Water Board staff concluded this data suggests that stormwater discharges carry pathogens to Soquel Creek. Additionally, staff concluded that more samples should be collected from storm drains in this area. The Monitoring Plan in Section 11 of this report establishes requirements for the County of Santa Cruz to sample storm drains.
3.3.5. Impaired Reaches Staff developed the TMDLs in this report for the impaired reaches of the waterbodies described above and the corresponding subwatersheds. Staff summarized the impaired reaches as:
1) Soquel Lagoon and Soquel Creek from the mouth of the Lagoon upstream to the Soquel Creek at Porter Street Bridge sampling station, and
TMDL for Pathogens in Soquel Lagoon March 20-21, 2008
23
2) The entire reach of Noble Gulch.
3.4. Microbial Source Analysis Results Genetic ribotyping is one method of microbiological source analysis and was utilized to identify microbiological sources in Soquel Lagoon and Noble Gulch. The genetic ribotyping method differentiated sources of E. coli. Monsour Samadpour of the University of Washington Public Health Department has worked with over 100,000 E. coli samples and developed genetic fingerprints that are specific to certain E. coli sources of animal origin. This method compares Ribonucleic Acid band patterns extracted from contaminated stream sites and known sources of E. coli. Numerous entities in California have successfully used this method, including California Polytechnic State University’s (San Luis Obispo) study of Morro Bay, California. Although this report presents various sources in “percent contribution” values, staff considered the ribotyping results only as an estimate of possible sources and of relative source contributions among all of the various sources. Ribotyping represents one of the lines of evidence in determining source contribution. Santa Cruz County personnel collected E. coli samples for ribotyping analysis from three of the sampling stations on Soquel Creek (S0, S04, and S23), one of the sampling stations on Noble Gulch (S1), and an additional station on Noble Gulch (S11D) that was originally thought to be a storm drain (Noble Gulch is piped underground for its last approximately 0.4 mile prior to entering Soquel Creek). The sampling stations are shown in Figure 4–1.

TMDL for Pathogens in Soquel Lagoon March 20-21, 2008
24
Figure 3-2. Soquel Creek and Noble Gulch Ribotyping Data Collection Stations
Ribotyping samples were collected between January 13, 2004 and March 17, 2005. Percent source contributions from samples collected during both wet and dry seasons combined are presented in Table 3-8. Table 3-9 contains the percent source contributions separated into wet and dry seasons.

TMDL for Pathogens in Soquel Lagoon March 20-21, 2008
25
Table 3-8. Percent Source Contributions from Ribotyping Data
Sites
Soquel Creek at Flume Outlet (SO)
Soquel Creek Above
Stockton Bridge East
(S04)
Soquel Creek at Nob Hill
(S23)
Noble Gulch at
Soquel Creek (S1)
Noble Gulch at Blue Gum
and Riverview
(S11D)
Dates 1/13/04 to
9/21/04 6/6/05 to 2/17/05
1/21/04 to 2/17/05
1/13/03 to 2/17/05
7/11/05 to 9/28/05
Source Percent Source Contribution Bird 54 46 48 64 36
Wildlife 7 31 10 16 21 Rodent 13 7 14 10 14
Dog 13 10 9 2 21 Human 6 0 6 4 4
Unknown 5 1 9 4 0 Cat 1 4 3 0 0
Horse 0 0 1 0 1 Cow 0 0 0 0 0
Marine Mammal 0 0 0 0 0 Total Water Samples 36 21 51 16 9
Total Isolate Samples 112 68 151 50 28
Based on this combined wet and dry season study, birds were the largest contributing source of E. coli at 36 percent or more from all five sampling stations. Other sources, wildlife (raccoon, deer, and opossum), dog, and rodent were present at all five stations and contributed a significant percentage of the fecal coliform. We also observed a four to six percent human contribution to fecal coliform at all but one of the sampling stations, Soquel Creek above Stockton Bridge East. However, this station was downstream of another station that did have a human source. Horse was identified as contributing one percent of the fecal coliform isolates in both Soquel Creek and Noble Gulch. Dog, human, horse, and cat sources were considered controllable sources because they are present as a result of human activities and land management. Bird, wildlife, and rodent sources are generally considered natural and uncontrollable because their presence is generally not a result of human activities. However, bird, wildlife, and rodent sources are controllable to some degree. For example, these animals are attracted to trash dumpsters and areas where human activities involving food occur. Therefore, they are present partially as a result of human activities. Some of their waste can be controlled by managing those human activities.

TMDL for Pathogens in Soquel Lagoon March 20-21, 2008
26
Table 3-9. Variation of Fecal Coliform Sources During Wet and Dry Seasons (January 2003 - September 2005)
Sites
Soquel Creek at
Flume Outlet (SO)
Soquel Creek Above
Stockton Bridge East
(S04)
Soquel Creek at Nob Hill
(S23)
Noble Gulch at
Soquel Creek (S1)
Noble Gulch at Blue Gum
and Riverview
(S11D)
Dates 1/13/04 to
9/21/04 6/6/05 to 2/17/05
1/21/04 to 2/17/05
1/13/03 to 2/17/05
7/11/05 to 9/28/05
Wet1 Dry2 Wet1 Dry2 Wet1 Dry2 Wet1 Dry2 Wet1 Dry2 Total Water
Samples 36 21 51 16 9
Total Isolate Samples 10 102 10 58 22 129 19 31 0 28
Total Days of Wet Season Sampling 1 1 2 2 0
Source Percent Source Contribution Bird 40 55 40 47 32 51 63 65 (1) 36
Wildlife 10 7 10 34 23 8 32 6 (1) 21 Marine Mammal 0 0 0 0 0 0 0 0 (1) 0
Dog 30 12 10 10 5 9 5 0 (1) 21 Human 10 6 0 0 5 6 0 6 (1) 4 Horse 0 0 0 0 5 0 0 0 (1) 4 Cow 0 0 0 0 0 0 0 0 (1) 0 Cat 0 1 20 2 0 4 0 0 (1) 0
Unknown 10 5 0 2 14 9 0 6 (1) 4 Rodent 0 15 20 5 18 13 0 16 (1) 14
1 Wet = Samples collected during a time when rain occurred within the previous 72 hours 2 Dry = Samples collected during a time when more than 72 hours occurred without rain (1) No samples collected during the wet season at this station. There was not enough wet season data to draw conclusions about wet versus dry season sources (Table 3-9). In order to accurately characterize the relative contribution from different sources of fecal contamination at a particular location, it is important to analyze 50-100 bacterial isolates (individual colonies) collected from that location over time (Assessment of Sources of Bacterial Contamination At Santa Cruz County Beaches, Ricker and Peters, 2006). None of the above data sets collected on wet days were based on sufficient isolate numbers. However, data derived from wet season sampling can still be used in terms of identifying at least some of the contributing sources. This is why wet and dry season data was analyzed in Table 4.1 after being combined. No contribution from cows was recorded in this study. However, had there been greater numbers of samples collected in the wet season, particularly after the first rain event, cow or other livestock animal sources, in addition to a higher contribution from horses, may have been detected. Farm animal contribution is discussed further in Section 4.2.6. A second reason for performing wet season sampling is to determine if the human component increases during wet weather. This would suggest that onsite-wastewater

TMDL for Pathogens in Soquel Lagoon March 20-21, 2008
27
treatment systems are dysfunctional and/or that the sewer collection system is leaking and waste is transported to storm drain systems during storm events. Additional information included in Sections 4.2.1 and 4.2.5 was used to determine whether or not septic or sewer systems were a significant source of pathogens to the Soquel Lagoon.
TMDL for Pathogens in Soquel Lagoon March 20-21, 2008
28
4. SOURCE ANALYSIS This source analysis was based on existing water quality data, wastewater spill data, microbial source data, land use, flow estimates, discussions with staff at County of Santa Cruz Health Services Agency, City of Capitola Public Works, Santa Cruz County Sanitation District (SCCSD), Coastal Watershed Council, and observations made in the field. This analysis also considered information provided in a report prepared by the County of Santa Cruz, Environmental Health Services, Water Resources Program titled Assessment of Sources of Bacterial Contamination at Santa Cruz County Beaches prepared in March, 2006.
4.1. Sources of Pathogen Indicator Organisms Investigated This section discusses pathogen sources of concern in the Soquel Watershed that are subject to regulation by the Central Coast Water Board. The modes by which various sources provided in Tables 3-8 and 3-9 reach the Soquel Lagoon are discussed.
4.1.1. Sanitary Sewer Collection System Spills and Leaks Sewage can reach the Lagoon from sewer line overflows (spills) or leaks. Sewage spills can occur when roots, grease buildup, or other debris block sewer lines. Some spills from the Santa Cruz County Sanitation District’s (SCCSD’s) collection system reached the Soquel Lagoon in 2002, 2003, and 2004. Leaks can occur from cracked lines or lines with faulty connections. When sewer lines are blocked or leaking, sewage may run onto the street, into gutters, and into storm drains. Sewer leaks can also occur in small volumes and below the ground. These types of leaks often continue unnoticed. SCCSD provided evidence that several sewer main lines were leaking prior to and including last year. Sewage spills and leaks contain human waste. Ribotyping analysis indicated that at two Lagoon sampling stations humans generated six percent of the sampled fecal coliform. Humans were also identified as generating four percent of the fecal coliform in two stations on Noble Gulch. Staff concluded that sewage was a likely source of pathogens in the Lagoon; however, staff also concluded that current management practices and permit requirements are adequate to control these sources. The Watershed does not have a Waste Water Treatment Plant (WWTP) within its boundaries. However, the Watershed has a collection system that collects wastewater from the City of Capitola and a portion of Santa Cruz County within the Watershed’s boundaries and takes this wastewater to the City of Santa Cruz’s WWTP. The SCCSD’s Waste Discharge Requirements (WDR), Order No. R3-2005-0043, addresses the County’s collection system. Areas of the Soquel Watershed not connected to the SCCSD collection system are on onsite-wastewater treatment systems. The State Water Resources Control Board adopted Statewide General Waste Discharge Requirements for Sanitary Sewer Systems (Water Quality Order No. 2006-0003 (Sanitary

TMDL for Pathogens in Soquel Lagoon March 20-21, 2008
29
Sewer Order) on May 2, 2006. The Sanitary Sewer Order requires public agencies that own or operate sanitary sewer systems to develop and implement sewer system management plans. The goal of the sewer system management plan is to provide a plan and schedule to properly manage, operate, and maintain all parts of the sanitary sewer system. This will help reduce and prevent sanitary sewer overflows and releases, as well as mitigate any sanitary sewer overflows and releases that do occur. The State Board General Waste Discharge Requirements for Sanitary Sewer Systems do not impose additional requirements beyond those requirements already adopted by the Central Coast Water Board. The SCCSD main line (main) crosses underneath Soquel Creek and the Lagoon. The main crosses Soquel Creek at Porter Street between Soquel Wharf Road and Main Street, and the Soquel Lagoon near the Nob Hill at Soquel Creek sampling station where the main crosses toward Soquel Wharf Road. It crosses in a third location at the Stockton Avenue Bridge. Locations are labeled A, B, and C, respectively, on Figure 4-1. The main also parallels Noble Gulch throughout most of its reach (within approximately 25 to 400 feet). The main is inspected once every year during routine cleaning (personal communication, Diane Romeo, Sanitation Engineering, SCCSD, May 5, 2006). The SCCSD Engineering and Operations Staff supplied a report, Capitola Video Results (March, 2006), summarizing an inspection of sections of the sewer main in the City of Capitola. The report indicated that the sewers adjacent to Soquel Creek and in the upper village area were constructed primarily in the 1960s of rigid clay or asbestos concrete. It also summarized the results of the investigation of approximately 4,460 feet of sewer main that was televised in February 2006 after winter storm events produced 0.71 inches of rain. There were only a few spots where water was observed trickling into the pipe due to saturated soils. However, due to cracking, offset joints, chipping, and non-water tight lateral connections showing a slime build up (indicative of water leaking into the system), it was evident that the sewer main was most likely leaking inwardly and outwardly. The report also indicated that several lateral connections at the main were leaking (lateral connections are discussed in Section 4.2.2.f.). During the wet season, these conditions contribute to sewer system overflow (or spills) by rainfall and groundwater infiltration. Conversely, sewage exfiltration potential exists in dry seasons (exfiltration occurs when sewage leaks underground). The report indicated that the sewer main in the worst condition was along Cherry and San Jose Avenues located in the Esplanade section of Capitola, which is east of and adjacent to the Lagoon. Several sections were cracked and lateral connections extended into the sewer main with slime build up below. Many as-built plans were missing and the mapping of the sewer lines was incomplete. Some of the manholes in the Capitola village area showed inlet piping that may or may not be abandoned. Occasionally, sewer mains that were considered abandoned were determined functional and connected to residences. Furthermore, some of the manholes were constructed of brick. Water in the rainy season can leak around the bricks and into the sewer system causing overflows (or spills).

TMDL for Pathogens in Soquel Lagoon March 20-21, 2008
30
Figure 4-1. Locations where the sewer main crosses under Soquel Creek (A: Porter Street between Soquel Wharf Road and Main Street, B: Near Nob Hill at Soquel Creek sampling station toward Soquel Wharf Road, and C.: Stockton Avenue Bridge)
Additionally, sections of main along Riverview Avenue (located approximately 125 to 200 feet from the Lagoon) were found in poor condition in past inspections. Furthermore, a videotape prepared last year showed that the Soquel Wharf Road sewer main was in poor condition with areas where a portion of the pipe was missing. Of the 13 manholes on this sewer, at least nine were constructed of brick (Capitola Video Results, SCCSD Operations and Engineering, 2006). Several hundred feet of sewer main located east of Soquel Creek were replaced with PVC
SOQUEL LAGOON

TMDL for Pathogens in Soquel Lagoon March 20-21, 2008
31
pipe since the 1980s. Communication with Rachel Lather of the SCCSD in July of 2006 indicated that a section of the sewer main was replaced recently along Riverview Avenue in the Esplanade area between Oak Drive and Gilroy Drive. Other sections along Riverview Avenue were replaced previous to that section. Lather also described sections of the main scheduled for replacement in 2006 and 2007 that include an additional section along Riverview Avenue, and several sections within the Esplanade. Repairs will also include taking the sewer main off the cliff face along Grand Avenue where it was exposed. The section of main on Soquel Wharf Road will not be replaced in the coming year due to the topography and geology of the area in which it is located. Other sections of main were thought to be in worse condition and to have a greater impact on water quality. Lather also told Central Coast Water Board staff that there was close communication with John Ricker, Water Resources Program Coordinator, Health Services Agency, County of Santa Cruz, when prioritizing the Capital Improvement Projects of the SCCSD for the following year. Furthermore, the SCCSD submitted a Collection System Management Plan per the requirements of the WDR in February of 2006. The plan summarized how sections of the main are inspected and by whom, assumptions about the system used to project long term Capital Improvement Projects, and the basis for priority of replacement. Collection system replacement is based on investigations of the general condition of the system. The sewers’ problems were not just leaks, but also blocks and spills. Sewer main blocks that did not require clean up action, in addition to blocks that resulted in spills were partially due to the faultiness of the collection system as described above. Staff concluded that blocks and spills were also due to obstructions such as grease, wood, rags, and hair. Spill data was compiled into the following graph in Figure 4-2.
1
10
100
1000
10000
100000
1000000
2001 2002 2003 2004 2005
Gal
lons
Figure 4-2. Total Domestic Sewage Spilled into Soquel Creek/Lagoon and Storm Drain System from 2001 to 2005. Blue bars represent total spills to Soquel Creek/Lagoon and Storm Drains. Red bars represent total spills only to Soquel Creek/Lagoon.

TMDL for Pathogens in Soquel Lagoon March 20-21, 2008
32
Table 4-1 shows the total annual spill volumes and the number of spills that occurred from January 1, 2001 through September 11, 2005 within the SCCSD boundaries.
Total Spills to Storm Drains and Surface Waters
Total Spills to Soquel Creek/Lagoon
Gallons 65 0 2001 Number
of Spills 3 0
Gallons 132 100 2002 Number
of Spills 3 1
Gallons 109,250 109,000 2003 Number
of Spills 4 2
Gallons 535 510 2004 Number
of Spills 4 2
Gallons 240 0 2005 Number
of Spills 8 0
Table 4-1. Annual Spill Volume and Number of Spills within the Santa Cruz County Sanitation District
From 2001 through 2005, 22 spills were reported that were a result of SCCSD collection system failure within the Soquel Watershed. The largest spill volume occurred in 2003 amounting to 109,205 gallons, of which 109,000 gallons reached Soquel Creek. Two spills that occurred that year were relatively large with one measuring 100,000 gallons and the other measuring 9,000 gallons. The 9,000-gallon spill also entered Noble Gulch. The total volume of spills in each of the other four years was 535 gallons or less. Spills did not reach the Soquel Lagoon in 2001 and 2005. The SCCSD implemented an overflow emergency response plan to minimize the effects of spills upon surface waters. When spills occurred, the SCCSD determined if the spills entered storm drains. If the spill entered the storm drain, they determined where the spill migrated and “trapped” the spill. The SCCSD extracted the spills from the storm drains and hauled the sewage to the wastewater treatment plant. Spills that did not reach water bodies were vacuumed, absorbed, raked-up, or diluted with fresh water. Based upon the information above, Central Coast Water Board staff concluded collection system leaks were a chronic problem. This source contributes to exceedance of water quality objectives. However, staff concluded that collection system problems are being sufficiently addressed through the current practices of the SCCSD and the annual reports they must submit in compliance with their WDR.
TMDL for Pathogens in Soquel Lagoon March 20-21, 2008
33
4.1.1.a Private Laterals/Private Pump Station Spills The SCCSD provided a report regarding videotaped sewer lines in the City of Capitola (Capitola Video Results, SCCSD Operations and Engineering, 2006) summarized above in Section 4.2.1. The report indicated that lateral connections to the sewer main were missing saddles (which help to make them water tight), and that the mortar (also to keep them water tight) was cracked or non-existent. Many laterals showed slime build up at the connection to the main indicating that water was leaking into the main. The report also indicated that lateral connections were leaking inwardly and outwardly and that some lateral connections were “break-in” style with lateral pipe extending into the sewer main that could have contributed to blockages. Furthermore, most of the laterals were found “low lying” with the lateral flow line below the flow line of the main with solids and standing water in the lateral. However, because the inspection only televised the sewer main it was difficult to determine the condition of the lateral pipes themselves. Rachel Lather of the SCCSD acknowledges that laterals are a problem in the Capitola Village but is uncertain as to the extent of the problem. She also said that some laterals in the Village could have been built as long ago as the 1930s (personal communication, June 26, 2006). The SCCSD provided spill reports from 2001 to 2006. One spill in 2002 estimated at 37 gallons was the only reported spill from a private lateral. There were no spills reported from private pump stations. However, Russ Bateson, Operations Manager of the SCCSD, indicated that there were approximately 10 spills per year throughout the district (including other watersheds in addition to Soquel) from private laterals that went unreported (personal communication, June 28, 2006). When the main is replaced or repaired, lateral connections along that section of the main are repaired by the SCCSD as well (personal communication, Diane Romeo, Sanitation Engineering, SCCSD, May 11, 2006). Repair of the sewer main was discussed in Section 4.2.1 above and is discussed in Section 10.1.1 below. The report described sections of the main that were recently replaced and in good condition, but that had leaking lateral connections. These sections of main will not be replaced again until they need repair. Therefore the leaking lateral connections will not be replaced either, unless homeowners replace them. Staff concluded it was highly probable that the lateral pipes were leaking and that the sewage was transported to the Lagoon. Furthermore, as stated in Section 4.1.1 ribotyping analysis indicated that at two Lagoon sampling stations humans generated six percent of the sampled fecal coliform. Humans were also identified as generating four percent of the fecal coliform in two stations on Noble Gulch. The SCCSD recently adopted a Code (Santa Cruz County District Code Sections 7.04.325 and 7.04.375; March 2006) regarding sanitary sewer collection system maintenance of systems serving four or more units. Staff concludes that the ordinance may only reduce this source by a small amount as the ordinance does not address private laterals. Summarized, the Code requires that owners of such properties:

TMDL for Pathogens in Soquel Lagoon March 20-21, 2008
34
1) Maintain their sanitary sewer system to prevent overflows, including flushing once during an eighteen month period;
2) Immediately stop an overflow if one occurs and have the problem repaired by a licensed plumber within five working days;
3) Report spills to the SCCSD within 24 hours and submit a written report; and 4) Certify that the sanitary sewer system was inspected prior to the sale of the
house or building if the house or building was constructed, or the sewer system was inspected, more than 20 years prior to the date of sale.
The district may impose penalties of up to $2,500.00 against a property owner who fails to perform any act required in the ordinance if the spill reaches public or private property other than the property owner’s property.
Staff concluded that private laterals were a likely source of pathogens in the Lagoon, and that implementation actions regarding reducing private laterals as a source are necessary. The Implementation Plan in Section 10 recommends methods to minimize this source. Staff concluded that private pump station spills were not a significant source of pathogens in the Lagoon.
4.1.2. Storm Drain Discharges to Municipally Owned and Operated Storm Sewer Systems (MS4) Required to be Covered by an NPDES Permit
Storm drain discharges have the potential to contain human waste from municipal system sewage spills and leaks (discussed in Section 4.2.1). Storm drain discharges also have the potential to contain urban runoff, including pet waste and dumpster leachate, which are controllable sources, and bird and rodent waste, which are sources that are controllable to some degree (as explained in Section 3.4.1). Based on the ribotyping analysis (Section 4.1) and land use that is mainly urban surrounding the Lagoon, staff concluded that these sources were likely present in the storm drain discharge within the Soquel Watershed and that these sources lead to exceedances of water quality objectives and criterion in Soquel Lagoon and Creek. These sources and their transport mechanisms are discussed below. Water samples collected via the CWC within storm drains were few. Although the sample sizes were small, Central Coast Water Board staff concluded this data may suggest stormwater discharges carry pathogens to Soquel Creek but this should be considered in conjunction with other evidence (such as urban runoff pathogen contributions in other watersheds, ribotyping data, and land uses). Additionally, staff concluded that more samples should be collected from storm drains in this area. Noble Gulch was impaired throughout the range of sampling stations. Whatever is contributing to the Monterey Ave (storm drain) station could also contribute to impairment of Noble Gulch as it is very close in proximity. One reason for small sample sizes in this watershed by CWC was that storm drains chosen for sampling were dry during the sampling periods. The Monitoring Plan in Section 11 of this report establishes requirements for the County of Santa Cruz to sample storm drains.

TMDL for Pathogens in Soquel Lagoon March 20-21, 2008
35
The City of Capitola received funds from the Clean Beaches Initiative Grant Program to reduce pathogenic indicator organism inputs at Capitola Beach and Soquel Creek. The Village Drainage Improvement Plan (City of Capitola, 2004) described the top priority projects to be implemented with the funds. The number one priority of the Plan was a dry weather diversion system that was recently completed. The diversion system is expected to improve water quality and reduce pathogen loading from the sources described above in the Lagoon during the time of operation, May through October. Runoff from the Esplanade and restaurants between the Esplanade and Soquel Creek was identified as a key source of pathogenic indicator organism pollution. A portion of this runoff directly entered the Lagoon through the Fog Bank outfall. The diversion, which included the construction of a small subsurface pump station, will redirect this runoff to the sanitary sewer system and eventually to the wastewater treatment facility in the City of Santa Cruz.
4.1.2.a. Controllable Bird Waste Fecal coliform ribotyping results indicate birds were a source of fecal coliform in the Lagoon (46 percent or greater at all three Soquel Creek sampling stations) and in Noble Gulch. Birds frequent locations such as dumpsters and trash cans as feeding sites. Birds were known to congregate in the Lagoon area on sandbars. They were also attracted to this area due to the presence of outdoor seating at restaurants and people that feed birds. Bird waste may reach storm drains and surface waters when storms occur or in other forms of urban runoff. Bird waste associated with dumpsters, trashcans, and trash that is littered can be controlled. Employees from restaurants adjacent to the Lagoon have not been observed rinsing bird waste off roofs. However, restaurateurs periodically pressure wash their sidewalks with water that drains to storm drains (personal communication, Steve Peters, Water Quality Specialist, Health Services Agency, County of Santa Cruz, March 30, 2006). Staff observed one esplanade restaurant employee pressure washing their patio during field reconnaissance; the Implementation Plan in Section 10 recommends methods to minimize wash water that may contain bird pathogens as a source.
4.1.2.b. Pet Waste From the ribotyping analysis, 21-percent of the identified isolates originated from dogs in Noble Gulch (at Blue Gum and Riverview). Fecal coliform from cats was also identified in Soquel Creek, to a lesser degree. Noble Gulch was narrow and fairly steep in stretches, and lacked a wide floodplain. Therefore, residences surrounding Noble Gulch were located proximal to this waterbody. Residences along Soquel Creek were also very close to the Creek in some stretches. There was the potential for residences adjacent to waterbodies in the Soquel Watershed to dispose of their pet waste by depositing it directly into the waterbody. Pet wastes can also reach these waterbodies via storm drain discharges during wet seasons through surface runoff. During dry seasons, pet wastes can reach storm drains if wash water or excess water from other sources comes into contact with pet waste. Staff observed several leashed dogs in Perry Park adjacent to the Lagoon during field
TMDL for Pathogens in Soquel Lagoon March 20-21, 2008
36
reconnaissance (March 16, 2006). Staff observed numerous signs in this park and two additional Soquel Creek adjacent parks that advise dog walkers to pick up after their dog. Bags were also provided for picking up dog waste. The Capitola Municipal Code includes an ordinance that requires dog owners/walkers to immediately remove and dispose of dog feces after defecation on public property (6.12.100 Public defecation). The County of Santa Cruz has a similar ordinance (6.12.080 Animal defecation prohibited where). The presence of signs and disposal bags likely helped to reduce dog waste from entering storm drain systems and ultimately the Lagoon, however, dogs continued to contribute pathogens to the Lagoon. The Implementation Plan in Section 10 recommends methods to minimize these sources.
4.1.2.c. Controllable Rodent and Wildlife Waste Microbial source tracking results indicated rodents and wildlife contributed pathogen indicator organisms to the Lagoon. Controllable rodent and wildlife waste can reach the Lagoon through storm water discharges. The Implementation Plan in Section 10 recommends methods to minimize this source.
4.1.2.d. Dumpster Leachate When it rains, rainwater can enter dumpsters and discharge leachate. This occurs when dumpsters are uncovered and containers leak. During dry seasons, bird waste may reach surface waters when trash-holding areas are hosed off or washed. Wash water may reach storm water drains and surface waters. During field reconnaissance staff observed two recycling dumpsters upside down next to a restaurant on a sidewalk over-hanging the Lagoon. The dumpsters appeared to have been hosed out with water and were drying. The maintenance of trash receptacles in sanitary condition is in progress (Assessment of Sources of Bacterial Contamination At Santa Cruz County Beaches, Ricker and Peters, 2006). However, an evaluation of this program is needed. The Implementation Plan in Section 10 recommends methods to evaluate the progress of sanitary trash receptacle maintenance.
4.1.2.e. Human Waste Discharges Illegal human waste discharges can reach surface waters via storm drains. Staff concluded homeless persons in non-riparian areas were a source of human pathogens in the Lagoon. Supporting this conclusion was the finding that humans were identified as contributing four to six percent of the fecal coliform in water samples from all but one sampling station. Tamara Doan of the Coastal Watershed Council, who collects water samples in the Watershed, stopped monitoring the storm drain pipe draining Highway One to Soquel Creek in 2004 because homeless persons were living in the pipe. Personal effects believed to belong to homeless persons were observed in 2005, however, no persons were observed. Central Coast Water Board staff received information from the Capitola Police
TMDL for Pathogens in Soquel Lagoon March 20-21, 2008
37
Department that evidence of homeless encampments included ground covers under shrubs in commercial areas or camping in vehicles (personal communication, Todd Mayer, Captain, Capitola Police Department, May 4, 2006; forwarded through email from Steve Jesberg, Public Works Director, City of Capitola, May 4, 2006). Law enforcement cited overnight sleepers and campers. The City of Capitola Public Work department broke down large encampments (personal communication, Todd Mayer, Captain, Capitola Police Department, May 4, 2006; forwarded through email from Steve Jesberg, Public Works Director, City of Capitola, May 4, 2006). There was no specific confirmation that homeless encampments were affecting surface waters. However, because evidence of homeless encampments have been observed in non-riparian areas and because sanitary disposal facilities are not always available for these sites, Central Coast Water Board staff determined it was highly likely that human waste reached surface waters. Additionally, as discussed in Section 3.4.1, humans were a source of the fecal coliform in the water samples collected in Soquel Creek. Staff proposes actions regarding homeless persons and encampments in the Implementation Plan in Section 10.
4.1.3. Onsite Wastewater Treatment System Discharges Onsite wastewater treatment systems (OWTSs) are potential sources of fecal coliform in surface waters. However, Water Board staff concluded OWTSs were not contributing to water quality impairment in Soquel Watershed. Staff suspected that rare onsite-wastewater treatment system failures occurred at rural residences in the upper Subwatersheds of Soquel Creek, Noble Gulch, and in the Subwatershed of Bates Creek. During dry periods, sewage from failing onsite-wastewater treatment systems probably did not reach a waterway unless a failure occurred close to a creek. However, on rare occasions during wet periods pathogen indicator organisms from failed onsite-wastewater treatment systems may have flowed to ditches, roadways, creeks, and ultimately Soquel Creek. Soquel Creek was impaired up to the Soquel Creek at Porter St. Bridge sampling location. This sampling location indicated no impairment. Upstream of this station for approximately 0.5 mile, residences and business were on the Santa Cruz Sanitary Sewer Collection System. Any OWTSs would have been located upstream of this unimpaired reach. Therefore, staff concluded OWTSs were not a contributor to the impairment in Soquel Creek. Furthermore, development within in the Soquel Watershed is recent and of low density relative to development within the San Lorenzo watershed in which there is encroachment of homes and OWTSs to the San Lorenzo River. Soquel Creek generally has a wider floodplain and most of the relatively new development meets current septic standards (personal communication, John Ricker, Water Resources Program Coordinator,

TMDL for Pathogens in Soquel Lagoon March 20-21, 2008
38
Health Services Agency, County of Santa Cruz, April 20, 2006). The entire reach of Noble Gulch was impaired. Dwellings not connected to the Santa Cruz Sanitary Sewer Collection System begin at approximately the north end of Ashwood Way, north of Soquel Drive, and adjacent to Noble Gulch OWTSs extended north into less developed areas. Staff found approximately nine dwellings within 125 feet of the Gulch and of those, three were within about 50 feet of the Gulch. Staff assumed that each dwelling had an associated OWTS. The soil mapping units in which the dwellings were located (identified in the USDA Soil Survey for Santa Cruz County, California, 1980) had slow permeability with the potential for OWTS absorption fields to not function properly. However, John Ricker, Santa Cruz County Environmental Health Services, Water Resources Division Director, was contacted and said that there were no problem areas that he knew of in the entire Soquel Watershed. Staff determined that because: (1) Nobel Gulch was impaired downstream of these OWTSs (but not upstream of the OWDSs) ���������������� ���������� ������������ ������ ������� ��������������� ���������������� �������� �������� ��������������!��������� ����������������� �������� �������"��#������������������������� ����������������������� ��������$��!��%�!��&; (2) there were a small number of suspect systems upstream of this impaired reach; and (3) there was no other evidence of failing systems, staff would not name OWTSs as a source and will not require implementation for OWTSs. However, if staff finds evidence during the implementation phase of the TMDL that septic systems are a source causing exceedance of water quality objectives, staff will address this source accordingly. Although staff concluded OWTSs were not a source leading to the impairment of surface waters in this Watershed as this time, municipalities and the Water Board either already have or are drafting regulatory maintenance plans. Santa Cruz County currently has an ordinance (7.38.035 Requirement of Adequate Sewage Disposal) that requires adequate individual sewage disposal and maintenance of the individual sewage disposal system. There is currently no regular inspection of these systems. The County of Santa Cruz and the City of Capitola proposed implementing an OWTSs maintenance and management program to reduce OWTS failures in their draft Storm Water Management Plan (SWMP), but an explanation of the OWTSs maintenance and management program was not included in the SWMP. Furthermore, the Central Coast Water Board has not yet approved the SMWP. Additionally, Water Board staff is in the process of developing revisions to existing Basin Plan criteria for onsite wastewater systems. The proposed criteria include recommendations and requirements for proper siting, design, maintenance and management of onsite wastewater systems. The proposed Basin Plan revisions also will require municipalities to develop onsite wastewater management plans (which the current criteria only recommend). In addition Water Board staff is in the process of developing a waiver of waste discharge requirements for owners of onsite wastewater systems that will ensure proper siting, design, maintenance and management. All owners of new onsite wastewater systems will have to enroll in the waiver if they plan to operate in areas
TMDL for Pathogens in Soquel Lagoon March 20-21, 2008
39
without onsite wastewater management plans approved by the Executive Officer. Local permitting agencies will be required to characterize and address water quality impacts from existing onsite wastewater systems in management plans.
4.1.4. Domesticated Animal Discharges 4.1.4.a, Farm Animals/Livestock Discharges
Staff determined that farm animal/livestock discharges were not a source of pathogens in the Soquel Lagoon or Creek, however, they were a likely source in Noble Gulch. Land use analysis indicated that 121 acres of the Soquel Watershed was covered by pastureland or hay (areas of grasses, legumes, or grass-legume mixtures planted for livestock grazing or the production of seed or hay crops). Approximately 92 percent of this total was within the Subwatershed of Bates Creek. Staff did not have evidence that Bates Creek was impaired. Staff observed horses in proximity to the Soquel Creek flood plain during field reconnaissance, however, the horses were located upstream of the unimpaired reaches of Soquel Creek. During the same field visit staff also noted that chickens, roosters, and cattle were present along Soquel San Jose Road which is adjacent to the Soquel flood plain in some stretches, but again this was upstream of the reaches of Soquel Creek considered impaired. According to Steve Peters, Water Quality Specialist, Health Services Agency, County of Santa Cruz, there were horses in pasture on the north side of Highway One, east of Noble Gulch between Silver Birch and Monterey Ave. within the Noble Gulch watershed (personal communication, April 13 and July 5, 2006). Peters also observed horses above Soquel Drive around Victory Lane and Cunnison Lane. Central Coast Water Board staff observed cattle on Cunnison Lane West of Noble Gulch (personal observation, June 26, 2006). Staff found several corrals adjacent to and in proximity of the Gulch on aerial imagery from Google Earth (Google Earth, 2008). The corrals were between approximately Highway One and the north end of Victory Lane/Coyote Canyon. The same imagery also showed pastures along the Gulch or in close range of it. The ribotyping analysis used in this report suggested that approximately one percent of the contribution of fecal coliform originated from horses at one sampling location in both Soquel Creek and Noble Gulch. There was no fecal coliform from cows identified in the sampling. However, there was no wet season sampling conducted at the Noble Gulch sampling station. Also, the wet season information for Soquel Creek at Nob Hill was based on only 22 isolates from only two days of wet season sampling. As stated above, reliable pathogen indicator organism analysis should include 50 – 100 isolates collected from one location over time. Therefore more contribution from horses as well as cattle may have been identified if sampling was more robust and conducted during the wet season. Additionally, there is substantial evidence from other watersheds that when cattle are present in the watershed fecal coliform from cows travels to the respective waterbody.

TMDL for Pathogens in Soquel Lagoon March 20-21, 2008
40
Staff concluded that horses and/or other farm animals likely contributed pathogens to Noble Gulch. Waste from farm animals and/or livestock is controllable and therefore staff is proposing actions in Section 10 Implementation Plan.
4.1.4.b. Pet Waste in Areas Not Draining to an MS4 Staff concluded that pet waste in areas that do not drain to MS4s likely contributed pathogens to surface waters in the Aptos Creek watershed. As discussed above, results from ribotyping analysis suggested that 21 percent of the identified isolates from fecal coliform present in Noble Gulch (at Blue Gum and Riverview) were from dogs. Fecal coliform from cats was also identified in Soquel Creek, to a lesser degree. Ribotyping analysis from other watersheds in the Central Coast Region typically indicated that dog and pet waste was a source of fecal indicator bacteria in surface waters. Additionally, County staff has observed pet waste in riparian areas, some of which likely reached surface waters. Staff concluded that pet waste in areas that do not drain to municipally owned and operated storm sewer systems required to be covered by MS4s, was a source of pathogens that can be controlled.
4.1.5. Homeless Person/Encampment Discharges Not Draining to an MS4
Staff discussed discharge from homeless persons that is flowing to creeks from storm drains in Section 4.1.2.f. Homeless person/encampment discharges also drain directly into surface waters. However, homeless persons that discharged directly to surface waters from riparian areas were not regulated by a SWMP program. Homeless encampments were present in the Soquel River Watershed riparian areas and may have been a significant human pathogen source. In addition to human waste, homeless person/encampments may also generate wastes from other sources such as rodent, pet, and bird. Staff concluded homeless person/encampment discharges must be addressed. Staff based this conclusion upon discussions at technical advisory committee meetings established while the County developed the Proposition 13 Report. The homeless encampment issue often came up in discussions among members. The following information also supports staff’s conclusion. Tamara Doan of the Coastal Watershed Council began sampling the Soquel Watershed in 2000. She indicated there was evidence of encampments in the area directly under the North abutment of the Highway One overpass. Additionally, those working for the Coastal Watershed Council observed “signs” of encampments from May 2000 through August 2005 in the area (including riparian habitat) directly behind the Mid-County Senior Center (near sampling station Soquel Creek at Nob Hill at the upstream end of the Lagoon). The “signs” included barbeques, lawn chairs, sleeping bags, and food stashes (personal

TMDL for Pathogens in Soquel Lagoon March 20-21, 2008
41
communication, April 19, 2006). According to Doan the upper watershed had more signs of temporary human use than actual homeless encampments. She observed human waste at the confluence of Soquel and Moore Creek 4.6 miles upstream of the Lagoon. Staff concluded that homeless persons were not as likely in Noble Gulch as it was visible to homeowners due to the proximity of houses and backyards to the Gulch. However, one stretch of the Gulch just south of Highway One provided better cover as it was not as visible to homeowners (personal communication, Steve Peters, Water Quality Specialist, Health Services Agency, County of Santa Cruz, April 21, 2006)). Homeless encampment locations are dynamic due to the general mobility of this population. Locations change depending upon dispersal performed by law enforcement officials. For these reasons, staff did not prepare maps showing homeless encampment locations. Because homeless encampments were observed in riparian areas and because there were no sanitary disposal facilities available for these sites, Central Coast Water Board staff determined it was highly likely that human waste reached surface waters. Additionally, as discussed in Section 3.4.1, humans were a source of the fecal coliform in the water samples collected in Soquel Creek. Central Coast Water Board staff concluded homeless encampments are a pathogenic indicator organism source and is proposing additional actions in the Implementation Plan in Section Ten.
4.1.6. Natural Sources Ribotyping data indicate that birds and other wildlife contribute to fecal coliform loading in the Soquel Lagoon. Birds made up between 36 percent and 64 percent, wildlife contributed between seven percent and 31 percent, and rodents contributed between seven percent and 14 percent of the isolates identified by ribotyping. A direct one-to-one transfer from the percent of identified isolates to the percent of total contribution cannot be made with the ribotyping data. However, the ribotyping results do suggest that wildlife contributions could be significant. Staff distinguished natural sources from “controllable” wildlife sources. Controllable sources were those caused or influenced by human activity, such as littering or leaving trash receptacles accessible to wildlife. Another controllable source was the entrance of wildlife fecal matter into storm drains through wash water. Staff discussed controllable wildlife sources in the preceding sections and included measures to minimize their contribution to pathogen loading in the Implementation Plan of this report.

TMDL for Pathogens in Soquel Lagoon March 20-21, 2008
42
4.2. Source Analysis Conclusions Staff determined the relative order of controllable sources that contributed pathogen indicator organisms to the Soquel Lagoon. They are listed here in relative order beginning with the largest source first:
1) Storm Drain Discharges to Municipally owned and operated storm sewer systems (MS4s), including but not limited to discharges from domestic animals, humans, and controllable wildlife.
2) Sanitary Sewer Collection System Spills and Leaks (including discharges from private laterals connected to municipal sanitary sewer collection systems).
3) Domesticated animals not draining to MS4s, including farm animals, livestock and pets.
4) Human Waste Discharges from homeless persons/encampments not draining to MS4s.
Evidence regarding natural sources lead staff to conclude that the contribution may have been significant. Staff estimated most of the natural sources were not controllable. The order was based on the information in Sections 3 and 4 of this report. As stated previously, staff used water quality data, discharger data and reports, flow estimates, land use data, ribotyping results, field reconnaissance work, and conversations with County staff to complete the source analysis conclusions. Storm drain discharges likely contributed the most pathogen indicator organisms to the Soquel Lagoon. Land from which storm water runoff was generated was larger than the total land containing any of the other sources named below. Many contributors to stormwater pathogen indicator organisms, including the four likely greatest contributors based on ribotyping analysis (birds, wildlife, rodents, and dogs), lived within urban land which was the second largest land use in the watershed and the largest land use surrounding the Lagoon. Storm drains from this urban land emptied into the reaches of Soquel Creek in which impairment occurred. Sanitary Sewer Collection System spills and leaks were likely the second greatest contributor of pathogen indicator organisms in the Lagoon. Based on video analysis performed by the SCCSD, the sewer collection system was determined to leak in proximity of the Lagoon. Furthermore, old pipes exist throughout the City of Capitola. Stormwater and subsurface flow was suspected of carrying this sewage to the Lagoon. Staff concluded that because it was known that the system was leaking and the majority of the known leaking sections were in the proximity of the Lagoon, this was a greater source of pathogen indicator organisms to the Lagoon than the remaining two sources of livestock and homeless. Furthermore, system spills reached the Lagoon in 2002, 2003, and 2004 and human DNA was identified in the Lagoon downstream of areas of the watershed containing the sewer collection system. Staff concluded that domestic animals, including farm animals /livestock and pets, and

TMDL for Pathogens in Soquel Lagoon March 20-21, 2008
43
homeless persons/encampments were not as great a source of pathogen indicator organisms to the Lagoon as the above sources. The lower ranking of this source category was partly based on ribotyping analysis through which livestock contribution of pathogen indicator organisms was identified as one percent in both Soquel Creek and Noble Gulch. Additionally, the proportion of the area known to contain livestock in the watershed is not great. This source category was ranked slightly higher than homeless because staff identified more specific areas known to contain livestock than areas containing homeless persons. Furthermore, domestic animals are typically more permanent in their locations relative to homeless persons who are of a transient nature. Staff considered that human DNA found in the Lagoon may have come from homeless persons and not from the other sources described above in this conclusion section. However, staff concluded that although pathogenic indicator organism contribution of homeless living in riparian areas was more direct to the waterbody when it occurred, because the number of homeless was uncertain, and their encampments may have been temporary, homeless persons contributed less to the lagoon than the above sources.
4.3. Comparison with Sources in Other Pathogen Impaired Waters The purpose of this section is to describe how sources from the Soquel Watershed compared with sources identified in other TMDL Project Reports. Staff compared sources with similar sources identified in the San Lorenzo River Watershed TMDL project reports. Sanitary Sewer Collection System Spills and Leaks: The San Lorenzo River Watershed TMDL identified the municipal collection systems as a source in the San Lorenzo River Watershed. This TMDL includes similar results. Storm Drain Discharges: The San Lorenzo River Watershed Pathogen TMDL Project Report also indicated stormwater contributed pathogens to surface waters. Homeless Persons/Encampments Discharges: The San Lorenzo River Watershed Pathogen TMDL Project Report also indicated homeless encampment discharges contributed pathogens to surface waters. Farm Animals and Livestock: The San Lorenzo River Watershed Pathogen TMDL Project Report also indicated farm animals and livestock discharges contributed pathogens to surface waters.

TMDL for Pathogens in Soquel Lagoon March 20-21, 2008
44
5. CRITICAL CONDITIONS AND SEASONAL VARIATION This section discusses factors affecting impairment, critical conditions, and seasonal fecal coliform variations.
5.1. Critical Conditions and Uncertainties The critical conditions of impairment occur when fecal coliform levels rise above 200 MPN/100mL. This level is used because it is the water quality objective that gauges the protection of the water contact recreation beneficial use. Exceedance of this water quality objective/criteria is considered critical (for this analysis) when:
1. A prolonged exceedance of the objective occurs. 2. When the exceedance is consistent throughout one or more seasons.
Exceedance of the water quality objective is usually measured by calculating the log mean of sample data from a monitoring site. A log mean is used because pathogen indicator organism levels can be highly variable, subject to plumes of fecal contamination resulting in high levels for a short duration. The log mean reduces the sensitivity to outliers or unusually high concentrations. Many factors contributed to the Soquel Lagoon impairment. These factors included the following: 1) discharge of pathogens to waterbodies in the Soquel Watershed; 2) stream flow transmission; and 3) survival and possible instream fecal coliform population growth. Some uncertainties are inherent with pathogen indicator organisms. Stream flows may serve to either increase or dilute fecal coliform concentrations. Stagnant pools may be areas where fecal coliform increases due to evaporation. Staff found no specific evidence that these or other conditions were critical. There is uncertainty with respect to relative loading from controllable and uncontrollable sources of pathogen indicator organisms. The uncertainty lies in the unquantified contribution from uncontrollable sources, and whether these sources alone may be causing impairment during some seasons and areas of the Watershed.
5.2. Seasonal Variations Staff analyzed Soquel Creek and Noble Gulch fecal coliform data on a seasonal basis (Table 5-1). Data from sampling stations without enough data to detect a seasonal trend were not included. Staff considered monthly water quality objective exceedances. The table provides seasonal trend conclusions for three sampling stations in the Soquel Watershed. The three stations were the only stations from which enough data was collected in order to consider seasonal trends.
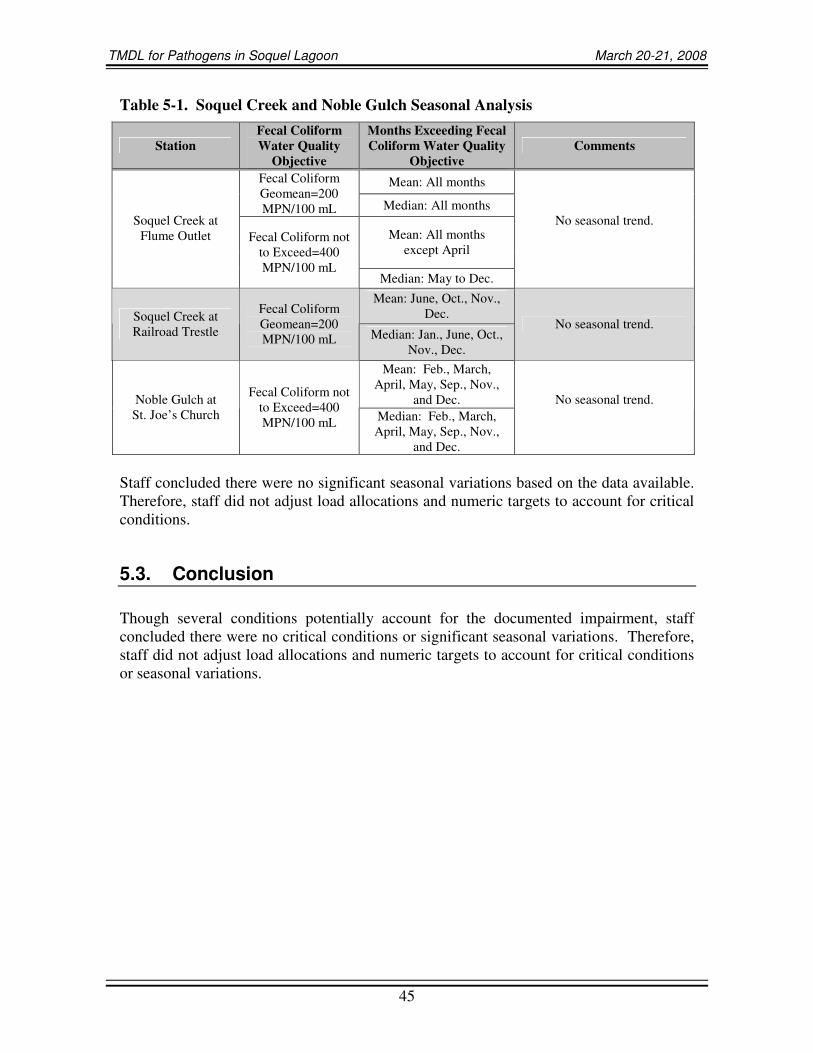
TMDL for Pathogens in Soquel Lagoon March 20-21, 2008
45
Table 5-1. Soquel Creek and Noble Gulch Seasonal Analysis
Staff concluded there were no significant seasonal variations based on the data available. Therefore, staff did not adjust load allocations and numeric targets to account for critical conditions.
5.3. Conclusion Though several conditions potentially account for the documented impairment, staff concluded there were no critical conditions or significant seasonal variations. Therefore, staff did not adjust load allocations and numeric targets to account for critical conditions or seasonal variations.
Station Fecal Coliform Water Quality
Objective
Months Exceeding Fecal Coliform Water Quality
Objective Comments
Mean: All months Fecal Coliform Geomean=200 MPN/100 mL Median: All months
Mean: All months except April
Soquel Creek at Flume Outlet Fecal Coliform not
to Exceed=400 MPN/100 mL
Median: May to Dec.
No seasonal trend.
Mean: June, Oct., Nov., Dec. Soquel Creek at
Railroad Trestle
Fecal Coliform Geomean=200 MPN/100 mL Median: Jan., June, Oct.,
Nov., Dec.
No seasonal trend.
Mean: Feb., March, April, May, Sep., Nov.,
and Dec. Noble Gulch at St. Joe’s Church
Fecal Coliform not to Exceed=400 MPN/100 mL Median: Feb., March,
April, May, Sep., Nov., and Dec.
No seasonal trend.

TMDL for Pathogens in Soquel Lagoon March 20-21, 2008
46
6. NUMERIC TARGETS The Basin Plan contains fecal coliform water quality objectives. These water quality objectives are in place to protect the water contact recreational beneficial use. The numeric target used to develop the TMDL is: Fecal coliform concentration, based on a minimum of not less than five samples for any 30-day period, shall not exceed a log mean of 200 per 100 mL, nor shall more than 10 percent of samples collected during any 30-day period exceed 400 per 100 mL.2
Staff proposes removal of the shellfish beneficial use for the Soquel Lagoon from the Basin Plan. (See the Use Attainability Analysis in Appendix D.) Therefore, staff is not proposing numerical targets related to shellfish harvesting. Natural non-controllable sources are a contributor of fecal indicator bacteria (FIB) in Soquel Watershed. Some doubt exists whether the non-controllable fraction of FIB alone are causing receiving water concentration of FIB to exceed the numeric target. However, there is evidence that non-controllable sources alone may not cause receiving water concentration to exceed the numeric target, i.e., that the numeric target can be achieved by managing controllable sources of FIB. For example, Waddell and Scott’s Creeks are coastal streams with lagoons similar to Soquel. Both Waddell and Scott’s Creeks, as well as their lagoons, carry FIB concentrations that achieve the geometric mean value of the numeric target. Single samples from these water bodies have exceeded the numeric target, but again, the monthly geometric mean achieves the numeric target. Staff, therefore, concludes that the potential exists to achieve the numeric targets by managing the controllable fraction of FIB in Soquel Watershed. Staff acknowledges that Aptos Creek is a waterbody heavily influenced by urban sources of FIB, whereas Waddell and Scott’s Creek are much less developed with less human presence in their watersheds. Therefore, staff offers the above example as more of an indirect comparison, showing concentrations of FIB that more “natural” waterbodies may exhibit in this area, and not to show a direct comparison to other urban waterbodies that are achieving numeric targets. In the event that the numeric target cannot be achieved through management of controllable sources, staff will consider other regulatory options; please see the discussion in the TMDL and Allocations section.
2 Throughout this report, fecal coliform units are expressed as colony forming unit (CFU), organisms, count (#/100ml or CFU/100 ml) and most probable number (MPN). All unit expressions are considered equivalent fecal coliform bacteria concentration measures (Reference: Protocol for Developing Pathogen TMDLs).

TMDL for Pathogens in Soquel Lagoon March 20-21, 2008
47
7. LINKAGE ANALYSIS The goal of the linkage analysis is to establish a link between pollutant loads and water quality. This, in turn, supports that the loading capacity specified in the TMDLs will result in attaining the numeric target. For these TMDLs, this link is established because the numeric target concentrations are the same as the TMDLs, expressed as a concentration. Sources of pathogen indicator organisms have been identified that cause the elevated concentrations of pathogen indicator organisms in the receiving water body. Therefore, reductions in pathogenic indicator organism loading from these sources should cause a reduction in the pathogenic indicator organism concentrations measured. The numeric targets are protective of the recreational beneficial uses; hence the TMDLs define appropriate water quality.
8. TMDL CALCULATIONS AND ALLOCATIONS A TMDL is the pollutant loading capacity that a water body can accept while protecting beneficial uses. TMDLs can be expressed as loads (mass of pollutant calculated from concentration multiplied by the volumetric flow rate), but in the case of pathogens, it is more logical for these TMDLs to be expressed as a concentration. TMDLs can be expressed in terms of either mass per time, toxicity, or other appropriate measure [40 CFR §130.2(I)]. Concentration TMDLs make more sense in this situation because the public health risks associated with recreating in contaminated waters scales with pathogen indicator concentration, and indicator organisms (e.g. fecal coliform) are not readily controlled or measured on a mass basis. Therefore, we are establishing the TMDLs as a concentration of indicator organisms in the Soquel Lagoon, Soquel Creek, and Noble Gulch. TMDLs are established for the following reaches in the following water bodies: Soquel Lagoon: all waters of Soquel Lagoon. Soquel Creek: beginning from the mouth of Soquel Creek, upstream and along Soquel Creek to the bridge at Porter Street. All reaches of Noble Gulch. The TMDLs for Soquel Lagoon, Soquel Creek, and Noble Gulch are: Fecal coliform concentration, based on a minimum of not less than five samples for any 30-day period, shall not exceed a log mean of 200 per 100 mL, nor shall more than 10 percent of samples collected during any 30-day period exceed 400 per 100 mL.

TMDL for Pathogens in Soquel Lagoon March 20-21, 2008
48
8.1. Wasteload and Load Allocations The allocation for each controllable source and corresponding responsible party is equal to the TMDL. The allocation is the same for each responsible party. The wasteload and load allocations are receiving water concentrations. Responsible parties can not cause pathogen indicator organism (e.g. fecal coliform) concentration to exceed the TMDL in the receiving water body. The parties responsible for the allocations to controllable sources are not responsible for the allocation to natural sources. The TMDL is achieved when the numeric target is consistently met in the impaired waters of Soquel Lagoon, Soquel Creek, and Noble Gulch. Table 8-1 shows the allocations and parties responsible for the allocations.
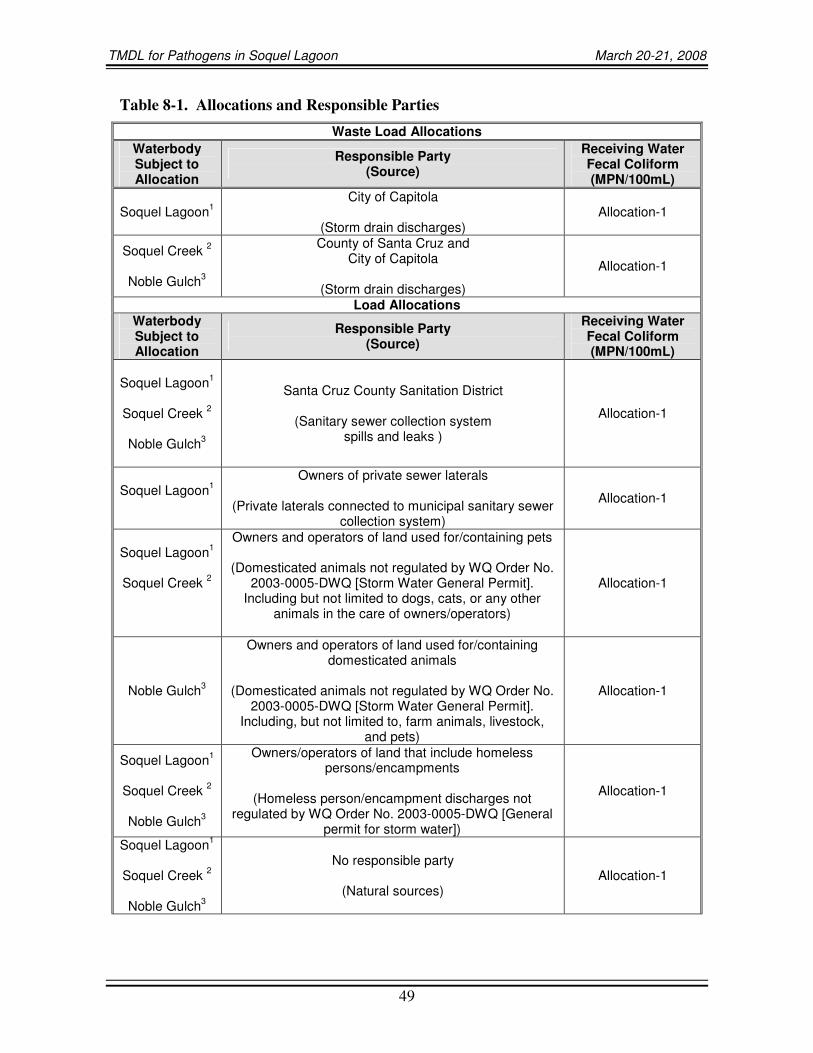
TMDL for Pathogens in Soquel Lagoon March 20-21, 2008
49
Table 8-1. Allocations and Responsible Parties Waste Load Allocations
Waterbody Subject to Allocation
Responsible Party (Source)
Receiving Water Fecal Coliform (MPN/100mL)
Soquel Lagoon1 City of Capitola
(Storm drain discharges)
Allocation-1
Soquel Creek 2
Noble Gulch3
County of Santa Cruz and City of Capitola
(Storm drain discharges)
Allocation-1
Load Allocations Waterbody Subject to Allocation
Responsible Party (Source)
Receiving Water Fecal Coliform (MPN/100mL)
Soquel Lagoon1
Soquel Creek 2
Noble Gulch3
Santa Cruz County Sanitation District
(Sanitary sewer collection system spills and leaks )
Allocation-1
Soquel Lagoon1
Owners of private sewer laterals
(Private laterals connected to municipal sanitary sewer collection system)
Allocation-1
Soquel Lagoon1
Soquel Creek 2
Owners and operators of land used for/containing pets
(Domesticated animals not regulated by WQ Order No. 2003-0005-DWQ [Storm Water General Permit].
Including but not limited to dogs, cats, or any other animals in the care of owners/operators)
Allocation-1
Noble Gulch3
Owners and operators of land used for/containing domesticated animals
(Domesticated animals not regulated by WQ Order No.
2003-0005-DWQ [Storm Water General Permit]. Including, but not limited to, farm animals, livestock,
and pets)
Allocation-1
Soquel Lagoon1
Soquel Creek 2
Noble Gulch3
Owners/operators of land that include homeless persons/encampments
(Homeless person/encampment discharges not
regulated by WQ Order No. 2003-0005-DWQ [General permit for storm water])
Allocation-1
Soquel Lagoon1
Soquel Creek 2
Noble Gulch3
No responsible party
(Natural sources) Allocation-1

TMDL for Pathogens in Soquel Lagoon March 20-21, 2008
50
Table-8-1 Con’t.
1 All waters of the Soquel Lagoon 2 Beginning and including the downstream most reach of Soquel Creek, up to and including Soquel Creek at the bridge crossing at Porter Street. 3 All reaches of Noble Gulch. Allocation-1: Fecal coliform concentration, based on a minimum of not less than five samples for any 30-day period, shall not exceed a log mean of 200 MPN per 100 mL, nor shall more than 10 percent of samples collected during any 30-day period exceed 400 MPN per 100 mL.
Should all control measures be in place and pathogen indicator organism levels remain high, investigations (e.g., genetic studies to isolate sources or other appropriate monitoring) can be used to determine if the high levels of indicator organisms are due to uncontrollable sources. Responsible parties may demonstrate that controllable sources of pathogen indicator organisms are not contributing to exceedance of water quality objectives in receiving waters. If this is the case, staff may consider re-evaluating the numeric targets and allocations. For example, staff may propose a site-specific objective to be approved by the Central Coast Water Board. The site-specific objective would be based on evidence that uncontrollable natural sources alone were the cause of exceedances of the numeric targets. In some situations, a responsible party may demonstrate that their allocation is met by demonstrating that all necessary control measures to achieve the allocation are in place. Staff will review these situations on a case-by-case basis. The parties responsible for the allocations to controllable sources are not responsible for the allocation to natural sources. The TMDL is achieved when the numeric target is consistently met in the impaired waters of Soquel Lagoon, Soquel Creek, and Noble Gulch.
8.2. Margin of Safety Each TMDL requires a margin of safety component that accounts for the uncertainty about the relationship between the pollutant loads and the quality of the receiving water (CWA 303(d)(1)(C)). A margin of safety is incorporated implicitly in the TMDLs through conservative assumptions; a margin of safety has been established implicitly through the use of protective numeric targets equal to existing water quality objectives for the Soquel Lagoon, Soquel Creek, and Noble Gulch. The pathogen TMDLs for the Soquel Lagoon, Soquel Creek and Noble Gulch are the water quality objective for protection of the water contact recreation beneficial use. The Central Coast Region Water Quality Control Plan states that, “controllable water quality

TMDL for Pathogens in Soquel Lagoon March 20-21, 2008
51
shall conform to the water quality objectives. When other conditions cause degradation of water quality beyond the levels or limits established as water quality objectives, controllable conditions shall not cause further degradation of water quality” (Basin Plan, p. III-2). Because the allocation for controllable sources is set at the existing water quality objective, if achieved, these allocations will by definition contribute as much as possible to achieving the water quality objectives in the receiving water. Thus, in these TMDLs there is no uncertainty relative to the load effect from controlled sources on water quality.

TMDL for Pathogens in Soquel Lagoon March 20-21, 2008
52
9. PUBLIC PARTICIPATION Public participation began when the County developed a report required by Proposition 13 Grant Funds. The grant required a Technical Advisory Committee (TAC) to meet periodically. Staff communicated with key personnel from the County of Santa Cruz, County of Santa Cruz Sanitation District, Coastal Watershed Council, and City of Capitola. Central Coast Water Board staff presented project reports for these TMDLs at two meetings. Central Coast Water Board staff solicited comments at both these meetings. One meeting was held during the early phase of the Central Coast Water Board project plan development on November 16, 2005. At the second meeting, on June 26, 2006, Central Coast Water Board staff presented preliminary project report findings. Central Coast Water Board staff incorporated public comments into this document where appropriate. Staff also scoped issues pursuant to the California Environmental Quality Act at this meeting. Staff will prepare environmental documents indicating any potential environmental impacts and considering alternative allocations schemes or implementation strategies prior to soliciting formal public comments on these TMDLs and implementation plan. Central Coast Water Board staff solicited public comments before the Water Board public hearing to consider adoption of the Soquel Lagoon, Soquel Creek, and Noble Gulch TMDLs. Staff received comments from: 1. Teri Caddell, A-1 Septic Service, Inc. in a letter dated December 6, 2007, 2. John Ricker, Water Resources Division Director, Santa Cruz County Environmental
Health Services, in an email dated January 23, 2008. Comments from the abovementioned individual/agency are included as Attachment 7 to the staff report. Some comments resulted in changes to the Project Report and are noted in Attachment 7.
The Central Coast Water Board will also accept public comments at the March 21, 2008 Central Coast Water Board public hearing.

TMDL for Pathogens in Soquel Lagoon March 20-21, 2008
53
10. IMPLEMENTATION PLAN The purpose of the Implementation Plan is to describe the steps necessary to reduce pathogen loads and to achieve these TMDLs. The Implementation Plan identifies the following: 1) actions expected to reduce pathogen loading; 2) parties responsible for taking these actions; 3) regulatory mechanisms by which the Central Coast Water Board will assure these actions are taken; 4) reporting and evaluation requirements that will indicate progress toward completing the actions; 5) and a timeline for completion of implementation actions. The Implementation Plan also addresses economic considerations to achieve compliance. A monitoring plan designed to measure progress toward water quality goals is included in the following section. Recall from Section 1.5 that staff is proposing that the existing prohibition for San Lorenzo River, Aptos-Soquel, and San Antonio Creek Subbasins be modified (modified prohibition) to include specific types of nonpoint sources of pollution. The proposed modified prohibition is being developed concurrently with this TMDL, but is a proposed basin plan amendment made part of the pathogen TMDL for the San Lorenzo River Watershed (also being developed concurrently). Implementing some measures to achieve the TMDL will rely on compliance with the modified prohibition. Staff differentiated existing versus proposed requirements as presented below.
10.1. Implementation Actions Staff discusses the proposed actions necessary for the water bodies to attain pathogen indicator organism water quality objectives in this section. The actions are presented with the sources of pathogen indicator organisms to the Soquel Creek Watershed.
10.1.1. Sanitary Sewer Collection System Spills and Leaks The Santa Cruz County Sanitation District (SCCSD) must continue to implement their Collection System Management Plan, as required by Waste Discharge Requirements (WDRs) (Order No. R3-2005-0043). Staff will continue to assess the effectiveness of the SCCSD Collection System Management Plan. Staff will utilize annual reporting associated with the SCCSD WDR, and other information, to make this assessment. If staff determines that the SCCSD is not satisfactorily implementing their Collection System Management Plan, or the Collection System Management Plan is not likely to result in the SCCSD achieving their allocation, the Executive Officer or the Central Coast Water Board may require modifications to the Collection System Management Plan (e.g. through revisions of WDRs), and/or require actions pursuant to applicable sections of the California Water

TMDL for Pathogens in Soquel Lagoon March 20-21, 2008
54
Code. Within one year following approval of these TMDLs by the California Office of Administrative Law, the Executive Officer or the Central Coast Water Board will amend the Monitoring and Reporting Program of the SCCSDs WDRs to incorporate stream monitoring for fecal coliform and reporting of such stream monitoring activities.
10.1.2. Storm Drain Discharges to Municipally Owned and Operated Storm Sewer Systems Required To Be Covered By an NPDES Permit (MS4s)
Enrollees of the State Water Resources Control Board’s General Permit for the Discharges of Storm Water from Small Municipal Separate Storm Sewer Systems (General Permit for storm water discharges) must control discharges of pathogens to and in storm drains (currently NPDES No. S000004). The County of Santa Cruz and City of Capitola must control discharges of pathogens to and in storm drains when enrolled of the General Permit for stormwater discharges. Within one year following approval by the Office of Administrative Law (OAL) of these TMDLs, or if enrolled in the General Permit for stormwater discharge, then when the next annual report is due, or to meet any other Water Board-issued storm water requirements (e.g. when the State General Permit for stormwater discharges is renewed), the County of Santa Cruz and City of Capitola will be required to:
1. Submit for approval a management program that identifies pathogen-specific best management practices targeting pathogen sources from:
a. Birds, pets, rodents and wildlife, dumpster leachate, and humans. The best management practices should include, but not be limited to: those identified in a Storm Water Management Plan (if existing or being developed), public education, participation and outreach regarding sources of pathogens in surface waters, health risks associated pathogens in surface waters, and specific actions the public can take to reduce pathogen loading into surface waters.
2. Submit for approval a fecal indicator bacteria (e.g. fecal coliform) monitoring and reporting plan. Receiving water and storm water outfall monitoring will be required.
3. Incorporate a description of implementation and monitoring activities in any existing or developing Storm Water Management Plan, and corresponding reporting, associated with a General Permit for storm water discharges.
The Executive Officer or the Central Coast Water Board will require information that demonstrates implementation of the actions described above, pursuant to applicable sections of the California Water Code and/or pursuant to authorities provided in the General Permit for storm water.
TMDL for Pathogens in Soquel Lagoon March 20-21, 2008
55
10.1.3 Private Sewer Laterals Individual owners of private laterals to sanitary sewer collection systems are responsible for maintenance of their private laterals. However, the County of Santa Cruz has the authority to require private lateral upgrades. The County of Santa Cruz may choose to implement a program to detect and require repair of leaks from private laterals. The Central Coast Water Board would consider implementation (by the County of Santa Cruz) of such a program, as proof of compliance by owners with private laterals with the Aptos-Soquel Subbasin prohibition. If the County of Santa Cruz implements such a program, the Central Coast Water Board will request and use reporting from the County of Santa Cruz to evaluate individual private lateral owner compliance with the Aptos-Soquel Subbasin prohibition. Within one year following approval of these TMDLs by the California Office of Administrative Law, if the County of Santa Cruz does not submit an approved program to detect and repair leaks from private laterals, or if the Central Coast Water Board or Executive Officer determines that such an existing or proposed program is insufficient, then landowners with private laterals must demonstrate compliance individually with the Aptos-Soquel Subbasin prohibition. If landowners with private laterals must demonstrate compliance individually with the Aptos-Soquel Subbasin prohibition, then within one year following approval of the TMDLs by the California Office of Administrative Law, the Executive Officer will notify owners and/or operators of land that have private lateral connections to the sanitary sewer system of the County of Santa Cruz, of the Aptos-Soquel Subbasin prohibition and conditions for compliance with the prohibition. Compliance with the Aptos-Soquel Subbasin prohibition is described in Chapter Five, section IV.B. of the Water Quality Control Plan.
10.1.4. Domesticated Animal Discharges Owners and/or operators of land used for/containing domesticated animals (including, but not limited to: horses, cattle, goats, sheep, dogs, cats, or any other animals in the care of owners/operators) in the Noble Gulch and Soquel Creek Subbasins, must comply with the Aptos-Soquel Subbasin prohibition. Within one year following approval of the TMDLs by the California Office of Administrative Law, the Executive Officer will notify owners and/or operators of lands used for/containing domesticated animals of the Aptos-Soquel Subbasin prohibition and conditions for compliance with the prohibition, as described in Chapter Five, section IV.B. of the Water Quality Control Plan. The Policy for Implementation and Enforcement of the Nonpoint Source Pollution Control Program requires the Central Coast Water Board to regulate all nonpoint sources (NPS) of pollution using the administrative permitting authorities provided by the Porter-Cologne Water Quality Control Act. Water Board staff recommends the Central Coast

TMDL for Pathogens in Soquel Lagoon March 20-21, 2008
56
Water Board utilize the Aptos-Soquel Subbasin Prohibition to implement a Nonpoint Source Pollution Control Implementation Program for domesticated animal discharges. NPS dischargers can comply either individually or collectively as participants in third-party coalitions. The “third-party” Programs are restricted to entities that are not actual dischargers under Central Coast Water Board permitting and enforcement jurisdiction. These may include Non-Governmental Organizations, citizen groups, industry groups, watershed coalitions, government agencies, or any mix of the above. All Programs must meet the requirements of the following five key elements described in the NPS Implementation and Enforcement Policy.
Key Element 1: A NPS Control Implementation Program’s ultimate purpose must be explicitly stated and at a minimum address NPS pollution control in a manner that achieves and maintains water quality objectives.
Key Element 2: The Program shall include a description of the management practices (MPs) and other program elements dischargers expect to implement, along with an evaluation program that ensures proper implementation and verification.
Key Element 3: The Program shall include a time schedule and quantifiable milestones, should the Central Coast Water Board require these.
Key Element 4: The Program shall include sufficient feedback mechanisms so that the Central Coast Water Board, dischargers, and the public can determine if the implementation program is achieving its stated purpose(s), or whether additional or different MPs or other actions are required (See Section 10, Monitoring Program).
Key Element 5: Each Central Coast Water Board shall make clear, in advance, the potential consequences for failure to achieve a Program’s objectives, emphasizing that it is the responsibility of individual dischargers to take all necessary implementation actions to meet water quality requirements.
Within one year following approval of the TMDLs by the California Office of Administrative Law, the Executive Officer will notify owners and/or operators of lands used for/containing domesticated animals of the Aptos-Soquel Subbasin prohibition and conditions for compliance with the prohibition, as described in Chapter Five, section IV.B. of the Water Quality Control Plan. The notification will initiate dialogue between the Central Coast Water Board and owners and/or operators in an effort to achieve compliance with the modified prohibition and improved water quality. Compliance with the modified prohibition is described below. More detailed information regarding compliance with the modified prohibition will occur as dialogue between the Central Coast Water Board and owners and/or operators ensues. Compliance with the Aptos-Soquel Subbasin prohibition must be demonstrated by: 1. Submitting documentation demonstrating there are no discharges from fecal sources

TMDL for Pathogens in Soquel Lagoon March 20-21, 2008
57
by domesticated animals into waters of the Soquel Subbasin, or 2. Submitting a nonpoint source pollution control implementation program for approval
by the Executive officer that is consistent with the Policy for Implementation and Enforcement of the Nonpoint Source Pollution Control Program, May 20, 2004, or
3. Complying with Waste Discharge Requirements or an NPDES permit, or a conditional waiver of waste discharge requirements that explicitly addresses compliance with the Total Maximum Daily Loads for Pathogens in Soquel Lagoon, Soquel Creek, and Noble Gulch.
The Executive Officer will review and approve, or request modification of, the nonpoint source pollution control implementation program or documentation submitted in compliance with the Aptos-Soquel Subbasin prohibition within six months of the submittal date.
10.1.5. Homeless Person/Encampment Discharges Not Draining to an MS4
Owners of land underlying homeless persons/encampments in the Soquel Subbasin must comply with the Aptos-Soquel Subbasin prohibition. Within one year following approval of the TMDLs by the California Office of Administrative Law, the Executive Officer will notify owners of lands that includes homeless persons/encampments of the Aptos-Soquel Subbasin prohibition and conditions for compliance with the prohibition. Compliance with the Aptos-Soquel Subbasin prohibition must be demonstrated by: 1. Demonstrating there are no discharges from fecal sources by homeless
persons/encampments into waters of the Soquel Subbasin, or 2. Submit a nonpoint source pollution control implementation program for approval by
the Executive officer that is consistent with the Policy for Implementation and Enforcement of the Nonpoint Source Pollution Control Program, May 20, 2004, or
3. Comply with Waste Discharge Requirements or an NPDES permit, or a conditional waiver of waste discharge requirements that explicitly addresses compliance with the Soquel Lagoon, Soquel Creek, and Noble Gulch Total Maximum Daily Loads for Pathogens.
The Executive Officer will review and approve, or request modification of, the nonpoint source pollution control implementation program or documentation submitted in compliance with the Aptos-Soquel Subbasin prohibition within six months of the submittal date.
10.2. Evaluation of Implementation Progress Central Coast Water Board staff will conduct a review of implementation actions

TMDL for Pathogens in Soquel Lagoon March 20-21, 2008
58
according to the schedule identified in the Implementation Plan. Central Coast Water Board staff will use annual reports, NPS Pollution Control Implementation Programs, as well as other available information, to review water quality data and implementation efforts as well as overall progress toward achieving the allocations and the numeric target. Central Coast Water Board staff may conclude that ongoing implementation efforts are insufficient to ultimately achieve the allocations and numeric targets. If staff makes this determination, staff will recommend that additional reporting, monitoring, or implementation efforts be required either through approval by the Executive Officer (e.g. pursuant to Section 13267 or Section 13383 of the California Water Code) or by the Central Coast Water Board (e.g. through revisions of existing permits and/or a Basin Plan Amendment). Staff may conclude that at the time of review they expect implementation efforts to result in achieving the allocations and numeric targets. In that case, existing and anticipated implementation efforts should continue. Central Coast Water Board staff reviews will continue until the TMDLs are achieved.
10.3. Timeline and Milestones Staff anticipates that the allocations, and therefore the TMDL, will be achieved thirteen years from the date the TMDL becomes effective (which is upon approval by the California Office Administrative Law). This estimation is in part based on the difficulty of identifying responsible parties of nonpoint sources and their inexperience with complying with the Aptos-Soquel prohibition. The estimation is also based on the uncertainty of the time required for in-stream water quality improvements resulting from management practices to be realized. Staff anticipates that the full in-stream positive effect of all the management measures will be realized gradually. Stormwater permits or nonpoint source implementation programs may include additional provisions that the Central Coast Water Board determines are necessary to control pollutants (CWA section 402(p)(3)(B)(iii)). The Central Coast Water Board will consider additional requirements if implementation of management practices do not result in achievement of water quality objectives.
TMDL for Pathogens in Soquel Lagoon March 20-21, 2008
59
10.4. Economic Considerations Overview Porter-Cologne requires that the Central Coast Water Board take “economic considerations”, into account when requiring pollution control requirements (Public Resources Code, Section 21159 (a)(3)(c)). The Central Coast Water Board must analyze what methods are available to achieve compliance and the costs of those methods.” Staff identified a variety of costs associated with implementation of these TMDLs. Costs fall into four broad categories: 1) planning or program development actions (e.g., establishing nonpoint source implementation programs, conducting assessments, etc.); 2) implementation of management practices for permanent to semi-permanent features; and 3) TMDL inspections/monitoring; and 4) reporting costs. Anticipating costs with any accuracy is challenging for several reasons. Many of the actions, such as review and revision of policies and ordinances by a governmental agency, could incur no significant costs beyond the program budgets of those agencies. However, other actions, such as establishing nonpoint source implementation programs and establishing assessment workplans carry discrete costs. Cost estimates are further complicated by the fact that some implementation actions are necessitated by other regulatory requirements (e.g., Phase II Storm water) or are actions anticipated regardless of TMDL adoption. Therefore assigning all of these costs to TMDL implementation would be inaccurate. Cost Estimates Storm Drain Discharges The State Water Resources Control Board adopted an NPDES General Permit for storm water discharge. The General Permit requires smaller State municipal dischargers, such as the County of Santa Cruz and the City of Capitola, to develop and implement a Storm Water Management Program (SWMP). As of the date of writing this report, the City and County have submitted a SWMP for the Central Coast Water Board’s approval. The Central Coast Water Board has not approved Storm Water Management Programs for the above agencies. Staff notes that the County and Cities have a difficult time collecting costs for the SWMP from individual property owner, and could require a proposition 218 vote. This may impose a financial hardship upon the County and Cities. The federal Clean Water Act requires compliance with NPDES permits. The costs associated with compliance with the TMDL are, therefore, no different than the costs required to comply with the NPDES permit.
TMDL for Pathogens in Soquel Lagoon March 20-21, 2008
60
Planning or Program Development Actions: Central Coast Water Board staff estimate no significant costs beyond the local agency program budget. Stormwater Plan Implementation: To implement the requirements of the TMDL, the Central Coast Water Board may ask local agencies to develop additional management measures for pathogen reduction; identify measurable goals and time schedules for implementation; develop a monitoring program; and assign responsibility for each task. The specifics of the storm water program efforts will not be known until Central Coast Water Board adoption of the SWMP occurs. An estimate of the storm water program efforts and their associated costs are provided below. The University of South California conducted a survey of NPDES Phase I Stormwater Costs in 2005 (Center for Sustainable Cities, University of Southern California, 2005). They determined the annual cost per California household ranged from $18.00 to $46.00. However, these costs were just to keep the existing plan running and did not include start-up costs which may increase the total cost per household. According to Central Coast Water Board Stormwater Unit staff, recently approved Phase II SWMPs in Region 3 ranged from $21.00 to $130.00 per household. Stormwater Unit staff reported that the wide range of costs in both cases was based on many factors including the amount of revenue generated by the municipality, the size of the area covered by the SWMP, and because some municipalities did not include the cost of programs such as street sweeping that are already accounted for in other program budgets, while other municipalities did include this cost. It was difficult for staff to estimate the cost of a SWMP for the above reasons. To get a rough idea of how much a SWMP program would cost in the Soquel Watershed, staff calculated an average annual cost from the range of costs for recently approved Phase II SWMPs in Region 3 ($21.00 in Seaside to $130.00 in the City of Monterey). Staff calculated an average annual cost of $77.00 per household. Staff used this cost per household to estimate the cost per year of SWMP implementation in the County of Santa Cruz and the City of Capitola. Soquel River Unincorporated Area: 10,429 (population) (http://www.homegain.com/local_real_estate/CA/soquel.html, June 5, 2007) (÷ 2.71 persons per household3 (http://quickfacts.census.gov/qfd/states/06/06087.html) ( x $77.00 cost per household per year)) = $296,322 per year. City of Capitola: 10,033 (population) http://www.ci.capitola.ca.us/capcity.nsf/vlookup/FINAL%20ELEMENT%20-%20COUNCIL%20ADOPTED%203-25-04_2/$file/FINAL%20ELEMENT%20-%20COUNCIL%20ADOPTED%203-25-04_2.pdf, March 2004) (÷2.11 persons per household (http://www.ci.capitola.ca.us/capcity.nsf/vlookup/FINAL%20ELEMENT%20- 3 Average Santa Cruz County occupancy

TMDL for Pathogens in Soquel Lagoon March 20-21, 2008
61
%20COUNCIL%20ADOPTED%203-25-04_2/$file/FINAL%20ELEMENT%20-%20COUNCIL%20ADOPTED%203-25-04_2.pdf ) ( x $77.00 cost per household per year) = $366,133 per year. The agencies mentioned above are required to develop and implement a storm water program for this Watershed independently of the Basin Plan amendment. Since this is an existing requirement under Phase II of the storm water program, no additional cost is estimated for implementing the existing storm water management program. Some additional implementation measures or management programs may be needed for pathogen reductions. The specific measures are not known at this time. However, the California Regional Water Quality Control Board, San Francisco Bay Region’s Pathogens in the Napa River Watershed Total Maximum Daily Load , June 14, 2006, Marin County estimated additional pathogen-specific measures would result in a 2 to 15 percent increase to their annual program budget. Therefore staff estimates the total cost between the following minimum and maximum ranges: Soquel River Unincorporated Area: $296,322 per year x 1.02 % minimum increase=302,248 minimum increase $296,322 per year x 1.15 % maximum increase=340,770 maximum increase City of Capitola: $366,133 per year x 1.02 % minimum increase=373,456 minimum increase $366,133 per year x 1.15 % maximum increase=$421,053 maximum increase Inspections/Monitoring: Central Coast Water Board staff is proposing the above Agencies monitor storm drains. The purpose of the monitoring is to determine the effectiveness of management measures. (The Central Coast Water Board will not impose targets/allocations as effluent limits on an Agency.) Central Coast Water Board staff estimated monitoring will the County and City approximately $5,000 per year. According to John Ricker County of Santa Cruz Environmental Health Services, the cost of sampling is $40 for sample collection and field analysis plus $20 for each bacterial sample (personal communication, September 18, 2007), for a total of $60 per sample. Staff proposed the County sample each storm drain 10 times per year. Staff also estimated approximately 5 sample sites will be analyzed per year. Therefore, staff estimated the total water sampling cost per year at approximately $3,000 ($60/sample x 10 samples x 5 sites). Water Board staff also assumed County or City staff resources will cost $200 per sampling day. Therefore total sampling costs per year including staff resources would cost approximately $5,000 ($3,000 + ($200/sampling day x 10 sampling days/year)). Reporting: The City of Santa Cruz and Scotts Valley/County of Santa Cruz are required to report independent of the TMDL under Phase II of the municipal storm water program. Therefore, no costs have been estimated for reporting.

TMDL for Pathogens in Soquel Lagoon March 20-21, 2008
62
Private Lateral Upgrades Implementation: According to the Proposition 13 Report, the cost to repair a leaking private lateral is estimated to be $5,000. Inspections/Monitoring: According to the Proposition 13 Report, the cost to test for leaking private laterals is approximately $1,000. Reporting: Responsible parties shall submit a report documenting that their private sewer lateral was inspected and/or repaired or replaced and is effectively minimizing pathogen discharges. Water Board staff estimated this report will require approximately six hours or less of land owner time. Farm Animals and Livestock Planning or Program Development Actions: The cost to develop pathogen control measures at these facilities will vary from site to site depending upon constraints present at each site. Central Coast Water Board staff estimates that approximately eight hours is necessary for planning control actions. Farm Animals/Livestock Plan Implementation: There are a variety of methods owners of farm animals/livestock can use to help control wastes. Some methods include installing livestock exclusion barriers, stables for horses, corrals, and manure bunkers at locations that prevent runoff from entering surface waters. 1. Livestock Exclusion Barriers: According to the U.S. EPA, the cost of permanently excluding livestock from areas where animal waste can impact surface waters ranges from $2,474/mi to $4,015/mi (Guidance Specifying Management Measures for Sources of Nonpoint Pollution in Coastal Waters. 840-B-92-002, United States Environmental Protection Agency, January 1993). 2. Horse Stables: Horses can be boarded at stables. According to the American Miniature Horse Association, miniature horses can be board in a professional stable for $50 to $150 per month per horse and full size horses can be boarded for $200 to $550 per month per horse. The cost depends on the facilities, pasture, and riding opportunities (http://www.amha.com/MarketTools/Profitibility.html). 3. Corral Cost: According to a Progressive Farmer website, a corral (excluding the head gate) can cost less than $7,000. Gates cost the most-between $3,000 and $4,000 (http://www.progressivefarmer.com/farmer/animals/article/0,24672,1113452,00.html). 4. Manure Bunker Costs: Ecology Action has worked with landowners to install manure bunkers. Manure bunkers help prevent storm waters from infiltrating the manure thereby causing runoff of pollutants from the manure. According to Ecology Action, the average cost for constructing a manure bunker on properties in the San Lorenzo watershed was

TMDL for Pathogens in Soquel Lagoon March 20-21, 2008
63
approximately $4000.00. (Each bunker was constructed on an existing cement slab, or a new one was poured and employed some type of cover - either a permanent roof or a tarp.) The cost of bunker construction varies greatly depending on the size and materials choice. When looking at bunkers for the entire program, costs ranged from $3000 to $15,000 (Reference: E-mail dated 5-1-2007 from Jennifer Harrison of Ecology Action). Inspections/Monitoring: The landowner cost for inspections/monitoring will vary depending upon the elements of the Nonpoint Source Implementation Program. The cost could be low if daily property walks occur to assess and repair discharges. Costs are higher if a landowner performs water quality monitoring. Reporting: Central Coast Water Board staff estimated it would take approximately eight hours of land owner time to prepare a report to the Water Board. This report is required every three years. Homeless Person/Encampment Discharges: Planning or Program Development Actions: The approaches used to control homeless encampment waste can range from a land owner: 1) installing barriers to 2) participating with local agencies to develop a comprehensive Watershed-wide solution. Central Coast Water Board staff estimates that the planning cost for an approach such as installing barriers may require approximately eight hours of land owner time. Landowners may devote more time to comprehensive Watershed-wide approaches. Homeless Encampment Waste Plan Implementation: The Central Coast Water Board will identify possible properties with homeless encampments. The methods used to control these wastes will be developed by landowners. However, some possibilities for controlling wastes include hiring security to patrol areas used by homeless, utilizing portable toilets, and fencing. The web site http://www.security-ess.com/DesignDetail.html indicates the cost of security guards range from $25 - $40 per hour. This service provides guards for a six hour minimum per guard per day. Staff contacted a service that provides portable toilets. This service provides a portable toilet for $95 per month (personal communication with Ace Portable Services, Santa Cruz, CA, January 23, 2007). Staff also contacted a service that provides security fences. The cost of a six foot chain link fence with 3 strands of barbed wire on the top is $1,800 per 100 feet or $15,000 per 1000 feet (personal communication with Affordable Fence Company, Santa Cruz, CA, January 23, 2007.) Inspections/Monitoring: Land owners could utilize various approaches to inspect lands for homeless encampments. Again, the approach is dependant upon whether the land owner uses an approach in which the land owner is responsible for inspecting the property or local agencies are able to provide inspection services. The cost for security guards, mentioned above, is one means to estimate this cost.

TMDL for Pathogens in Soquel Lagoon March 20-21, 2008
64
Reporting: The Central Coast Water Board will identify possible properties with homeless encampments. Identified responsible parties are required to submit reports to the Water Board. All land responsible parties shall submit a report documenting that measures are in place and effectively minimizing discharges or demonstrating that no discharge is occurring from homeless encampments. Central Coast Water Board staff estimate this report will require approximately eight hours of the responsible parties time. Cost Summary These costs are reasonable relative to the water quality benefits to be derived.

TMDL for Pathogens in Soquel Lagoon March 20-21, 2008
65
11. MONITORING PLAN
11.1. Introduction The Monitoring Plan outlines the monitoring sites, frequency of monitoring, and parties responsible for monitoring. The monitoring for compliance and evaluation of these TMDLs are the minimum staff concludes is necessary. However, if a change in these requirements is warranted after the TMDLs are approved, the Executive Officer and/or the Central Coast Water Board will require such changes.
11.2. Monitoring Sites, Frequency, and Responsible Parties The following monitoring plan proposes specific monitoring sites, frequency, and indicators to be monitored. Staff will work with parties responsible for monitoring when the implementation and monitoring phase of the project commences, and will make revisions, where appropriate, to the monitoring plan outlined below. Central Coast Water Board staff proposes fecal coliform monitoring in receiving waters at the following stations:
• Soquel Lagoon at Flume Outlet/Inlet • Soquel Creek above Noble Gulch • Soquel Creek at 2525 Main Street • Soquel Creek at Bates Creek • Noble Gulch at Soquel Creek • Noble Gulch at Highway One • Noble Gulch at Victory Lane/Coyote Canyon
In addition to the receiving water locations, staff also proposes fecal coliform monitoring in stormwater at the Monterey Ave. station. This is the same station sampled by the Coastal Watershed Council (CWC) located along Monterey Avenue approximately 0.6 mile east of Soquel Lagoon and approximately 100 feet southwest of Noble Gulch. The City of Capitola and the County of Santa Cruz will identify additional stormwater outfall locations at which stormwater will be sampled and submit for approval by the Executive Office of the Central Coast Water Board. Storm drain samples will not be used to determine if the TMDL is attained. The Central Coast Water Board will use receiving water samples to determine compliance. Monitoring activities will commence as directed by the Executive Officer of the Central Coast Water Board. Each party responsible for monitoring will be required to provide the data to the Central Coast Water Board.
TMDL for Pathogens in Soquel Lagoon March 20-21, 2008
66
Table 11-1 identifies the responsible party, monitoring site, sampling period, number of samples, and constituent. Most stations have more than one responsible party indicated for monitoring. This reflects the fact that multiple parties are known, or, potential sources of pathogens and thus share responsibility for monitoring. The responsible party must provide the data to the Central Coast Water Board.
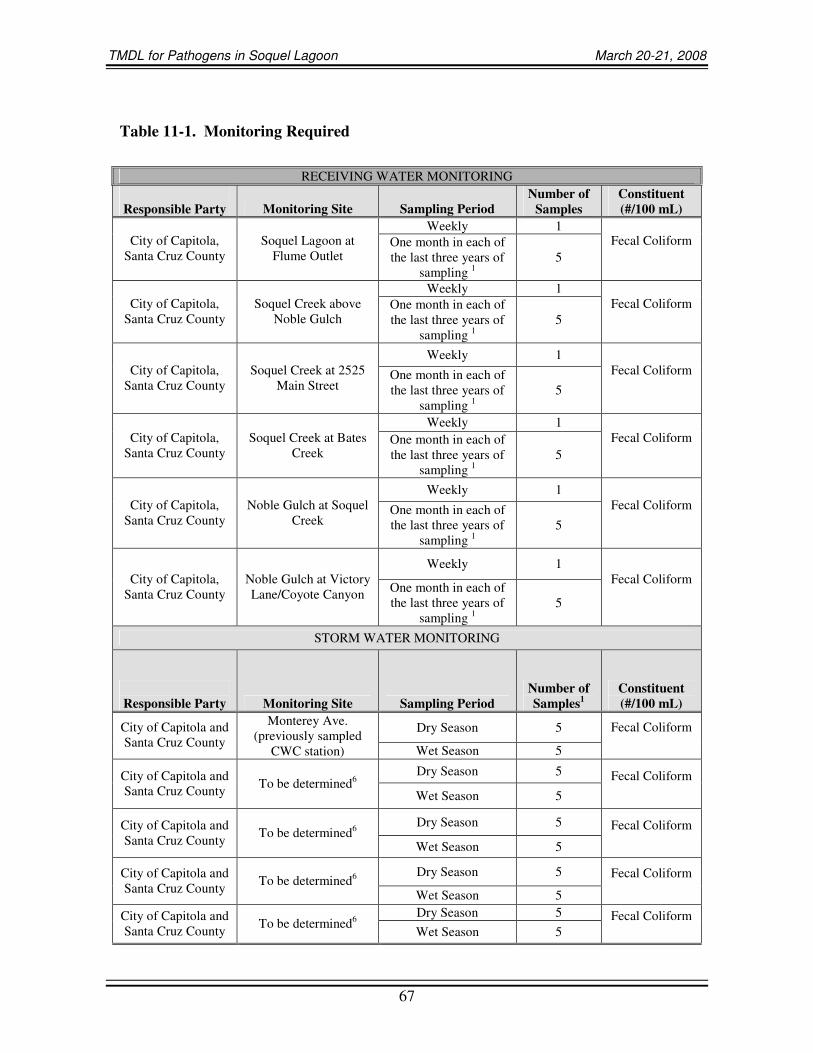
TMDL for Pathogens in Soquel Lagoon March 20-21, 2008
67
Table 11-1. Monitoring Required
RECEIVING WATER MONITORING
Responsible Party Monitoring Site Sampling Period
Number of Samples
Constituent (#/100 mL)
Weekly 1 City of Capitola,
Santa Cruz County Soquel Lagoon at
Flume Outlet One month in each of the last three years of
sampling 1 5
Fecal Coliform
Weekly 1 City of Capitola,
Santa Cruz County Soquel Creek above
Noble Gulch One month in each of the last three years of
sampling 1 5
Fecal Coliform
Weekly 1 City of Capitola,
Santa Cruz County Soquel Creek at 2525
Main Street One month in each of the last three years of
sampling 1 5
Fecal Coliform
Weekly 1 City of Capitola,
Santa Cruz County Soquel Creek at Bates
Creek One month in each of the last three years of
sampling 1 5
Fecal Coliform
Weekly 1 City of Capitola,
Santa Cruz County Noble Gulch at Soquel
Creek One month in each of the last three years of
sampling 1 5
Fecal Coliform
Weekly 1 City of Capitola,
Santa Cruz County Noble Gulch at Victory Lane/Coyote Canyon One month in each of
the last three years of sampling 1
5
Fecal Coliform
STORM WATER MONITORING
Responsible Party Monitoring Site Sampling Period
Number of Samples1
Constituent (#/100 mL)
Dry Season 5 City of Capitola and Santa Cruz County
Monterey Ave. (previously sampled
CWC station) Wet Season 5
Fecal Coliform
Dry Season 5 City of Capitola and Santa Cruz County To be determined6
Wet Season 5 Fecal Coliform
Dry Season 5 City of Capitola and Santa Cruz County To be determined6
Wet Season 5
Fecal Coliform
Dry Season 5 City of Capitola and Santa Cruz County To be determined6
Wet Season 5
Fecal Coliform
Dry Season 5 City of Capitola and Santa Cruz County To be determined6
Wet Season 5 Fecal Coliform
TMDL for Pathogens in Soquel Lagoon March 20-21, 2008
68
1 Responsible Party must determine which month will produce samples with the best representation of water quality conditions, i.e., not at the end of major storm events, not when Creek is dry.

TMDL for Pathogens in Soquel Lagoon March 20-21, 2008
69
waters, landowner monitoring for pathogen indicator organisms may provide evidence of complying with load allocations. Landowners have the option of performing individual monitoring or participating in a cooperative monitoring program. Individual landowner monitoring can comprise either water quality monitoring or other forms of monitoring (such as a report documenting visual site inspections supported by site photos). The Central Coast Water Board staff will review data every three years to determine compliance with these TMDLs. If the executive officer determines additional monitoring is needed, he shall request it pursuant to Section 13267 or other appropriate sections of the California Water Code.
11.3. Reporting The Central Coast Water Board will issue a Water Code Section 13267 letter to the parties responsible for receiving water monitoring and implementation reporting described in Table 10-1. Section 13267 states the Water Board may investigate water quality and the Water Board may require suspected dischargers to furnish monitoring program reports. The parties responsible for implementation and monitoring will incorporate the results of monitoring efforts in reports filed pursuant to the NPDES, WDR, Small MS4 Stormwater Permit, Nonpoint Source Implementation Program, or other correspondence as requested by the Central Coast Water Board pursuant to California Water Code Section 13267 or 13383. If reporting changes become necessary based on staff’s assessment of these TMDLs implementation progress, the Executive Officer or the Central Coast Water Board will require such changes. At a minimum, the Central Coast Water Board will evaluate monitoring reporting data and implementation reporting information every three years.

TMDL for Pathogens in Soquel Lagoon March 20-21, 2008
70
REFERENCES Alley, D.W., et al. Soquel Watershed Assessment and Enhancement Project Plan, November, 2003 California Regional Water Quality Control Board, Central Coast Region Water Quality Control Plan, Central Coast Region, September 8, 1994 (amended April 14, 1995) City of Capitola, Village Drainage Improvement Plan, December 2004 Google Earth. 2008 Europa Technologies and 2008 TeleAtlas Image AMBAG, 2008. Retrieved on February 7, 2008. Griffith, John F., et al. Evaluation of Microbial Source Tracking Methods using Mixed Fecal Sources in Aqueous Test Samples, 2003 American Miniature Horse Association. Retrieved January 24, 2007 from http://www.amha.com/MarketTools/Profitity.html http://www.ci.capitola.ca.us/capcity.nsf/vlookup/FINAL%20ELEMENT%20-%20COUNCIL%20ADOPTED%203-25-04_2/$file/FINAL%20ELEMENT%20-%20COUNCIL%20ADOPTED%203-25-04_2.pdf. March 25, 2004. http://www.homegain.com/local_real_estate/CA/soquel.html. Based on U.S. Census Bureau Data obtained from Copyright © 2007 HomeGain.com, Inc. http://www.progressivefarmer.com/farmer/animals/article/0,24672,1113452,00.html. Retrieved January 24, 20007. http://quickfacts.census.gov/qfd/states/06/06087.html). U.S. Census Bureau Data Retrieved on May 7, 2007. http://www.security-ness.com/DesignDetail.html. Retrieved January 23, 2007 Santa Cruz County, Health Services Agency, Environmental Health Services, Assessment of Sources of Bacterial Contamination At Santa Cruz County Beaches, March 2006 State Water Resources Control Board, 2004a. Policy for Implementation and Enforcement of the Nonpoint Source Pollution Control Program (and Fact Sheet). May 20. (Adopted August 26, 2004) State Water Resources Control Board. Water Quality Control Policy For Developing

TMDL for Pathogens in Soquel Lagoon March 20-21, 2008
71
California’s Clean Water Act Section 303(d) List. Adopted September 2004. Santa Cruz County/City of Capitola, Stormwater Management Program Draft, May 2004 Santa Cruz County Sanitation District Capitola Video Results, March 2006 Santa Cruz County Sanitation District Sewer System Management Plan, February 2006 United States Environmental Protection Agency, Ambient Water Quality Criteria for Bacteria-1986, January 1986 United States Environmental Protection Agency, Protocol for Developing Pathogen TMDLs, January 2001

TMDL for Pathogens in Soquel Lagoon March 20-21, 2008
72
12. APPENDIX-A DATA Please see accompanying appendix to this report.
13. APPENDIX-B DATA ANALYSIS Please see accompanying appendix to this report.
14. APPENDIX-C MICROBIAL SOURCE TRACKING DATA Please see accompanying appendix to this report.
15. APPENDIX-D USE ATTAINABILITY ANALYSIS Please see accompanying appendix to this report.