Total Fund Overview · Total Fund Overview ... fund’s top performing stock was an...
53
New York City Board of Education Retirement System Performance Overview as of June 30, 2011 Total Fund Overview New York City Board of Education Retirement System Performance Overview as of June 30, 2011
Transcript of Total Fund Overview · Total Fund Overview ... fund’s top performing stock was an...

New York City Board of Education Retirement SystemPerformance Overview as of June 30, 2011
Total Fund Overview
New York CityBoard of Education Retirement SystemPerformance Overview as of June 30, 2011

New York City Board of Education Retirement SystemPerformance Overview as of June 30, 2011
Table of Contents:
New York CityBoard of Education Retirement System
Equity Analysis
Fixed Income Analysis
Appendix
2

New York City Board of Education Retirement SystemPerformance Overview as of June 30, 2011
Consultant’s Commentary
3
Through June 30, 2011Market Commentary
The Bureau of Economic Analysis’ initial estimate of 2Q2011 GDP growth was 1.3%. First quarter GDP growthwas revised to 0.4% from an initial 1.9% and the first half of 2011 represents the weakest 2-quarter growth periodsince 2009.
For the quarter, the job market (as defined by non-farm payrolls) gained 260,000 jobs, compared to a gain of497,000 in 1Q2011. Within the quarter, April saw a surprise gain of 217,000, followed by disappointing growthnumbers of 25,000 and 18,000 in May and June, respectively. It is estimated that approximately 100,000 new jobsare required each month to maintain a stable unemployment rate (individual economist estimates will vary).
CPI rose 3.6% for the year with almost three-quarters of the gain coming from food and gas prices. The change inthe index for all items less food and energy edged up to 1.6 percent, its highest level since January 2010. The foodindex has increased 3.7 percent over the last 12 months while the energy index rose 20.1 percent.
After rallying early in the quarter, equities declined for almost two months before a late June rally minimized thedamage. Fears of a European debt crisis, a slowing US economy and US debt issues weighed on the market, asthe S&P 500 index rose 0.1%. Small and mid-cap stocks returned -1.6% and 0.4%, respectively. Growth beatvalue with the biggest gain coming from mid growth (+1.6%). At the sector level, five of ten sectors of the S&P 500were positive. The best returns came defensive sectors, like health care (+7.8%), telecom (+6.1%) and consumerstaples (+5.3%). The weakest performers were financials (-5.9%) and energy (-4.6%).
New York City Board of Education Retirement SystemPerformance Overview as of June 30, 2011
Consultant’s CommentaryThrough June 30, 2011
Market Commentary (continued)International markets followed a similar pattern US. Volatility was driven by concerns over weaker globaleconomic indicators, the end of QE2, tighter ECB monetary policies and problems surrounding the Greek debtcrisis. Progress on the Greek situation in late June spurred a 5% rally that left the MSCI EAFE Index up 1.8% forthe quarter. Half of the sectors in the EAFE Index rose, led by health care (+8.9%) and consumer staples (+7.6%).Energy (-2.8%) was the worst performer. At the regional level, Europe gained 2.9% despite sovereign risk issues.Japan and the Far East finished close to unchanged, as uncertainty over the pace of Japan’s recovery and China’srate tightening discouraged new investment. The MSCI Emerging Markets Index fell -1.0%.
Economic factors weighed on the bond market, especially in May and June. The 10-year Treasury returned 3.6%for the quarter and all Treasury maturities five years and longer rose at least 3%. Corporate bonds rose 2.3%, ledby utilities. Industrials and financials, especially banks and insurance, lagged. In the securitized sectors, CMBS(+1.6%) and ABS (+1.8%) also underperformed. The high yield sector (+1.1%) trailed investment grade bonds, asinvestors looked for less risk during the quarter.
Asset AllocationAs of June 30th, 2011 the Board of Education Retirement System (BERS) Total Portfolio was $2.92 billion versus$2.88 billion on March 31st.
Equity is overweight 1.3% versus fixed income, largely due to an above-policy allocation to emerging markets(5.4% versus 4.0%), which is also near the upper end of its rebalancing range. Within fixed income, structuredfixed income is underweight (16.7% versus policy of 22%), though largely offset by a non-policy allocation to cash(5.5%). Private real estate allocation rose during the quarter, and now account for 1.7% of assets.
Manager IssuesEmerging manager FIS and emerging equity manager SSgA remain on watch for performance issues. Searchesare underway in both categories. Wellington also remains on watch due to organizational issues since early thisyear.
Seix announced in June that their head of high-yield investments, Michael McEachern will be leaving the firm.
4

New York City Board of Education Retirement SystemPerformance Overview as of June 30, 2011
Consultant’s Commentary
Through June 30, 2011
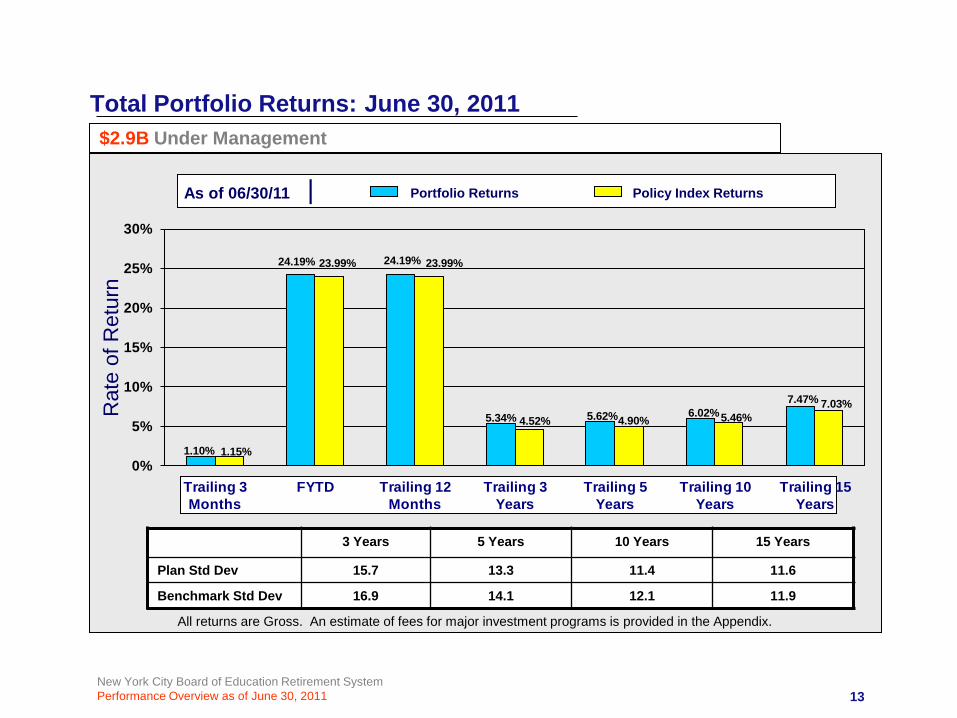
Total Fund PerformanceThe Total Plan returned 1.1% for the quarter, trailing its policy benchmark by 5 basis points. This result placed inthe 72nd percentile of the Public Fund Master Trusts > $1 Billion Universe. For the trailing year, the Planreturned 24.2% compared with 24.0% for the index, ranking in the 10th percentile of the peer group. Three- andfive-year returns remain ahead of the benchmark and within the top third of its peer universe.
For the quarter, allocation effects detracted from performance, including the slight overweight to equity, andwithin fixed income, the overweight to cash. Manager selection was a net positive, mainly due to outperformanceby the developed international equity managers (Baillie Gifford and Sprucegrove). For the trailing year,management effects were again positive, offsetting negative allocation effects. Domestic equity, internationalequity, structured fixed income, and enhanced yield all outperformed.
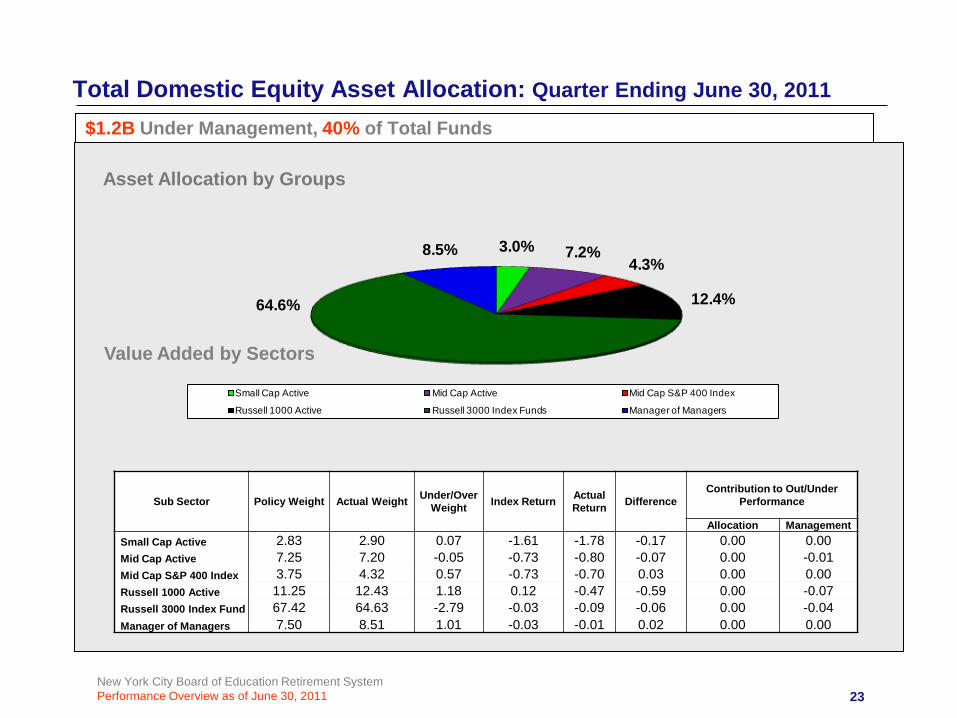
U.S. EquityFor the quarter, Total Domestic Equity returned -0.3% for the quarter, lagging the 0.0% return of the Russell 3000Index. Aronson Large Value and the two emerging manager fund of funds were the only active strategies tooutperform. For the year, Total Domestic Equity returned 33.4% and active managers returned 36.1%. This iscompared to a 32.4% return for the Russell 3000 Index.
Zevenbergen returned -2.5% during the quarter, trailing the Russell 3000 Growth benchmark return of 0.6%.For the trailing year, Zevenbergen returned 41.2%, outperforming the 35.7% returned by its benchmark.Zevenbergen is well ahead of its benchmark over trailing three- and five-year periods. As growing economicconcerns caused risk appetites to diminish, issues with the highest market exposures and growth expectationssuffered. The fund’s underperformance was primarily due to its holdings in technology (onlinereservations/offshore IT) and energy (crude producers) sectors. In technology, market leaders, including Googleand Apple, were laggards. A specific detractor for the fund was OpenTable, Inc., used for free and real-timeonline restaurant reservations. When the company announced the departure of its CEO in May, shares fell over
5

New York City Board of Education Retirement SystemPerformance Overview as of June 30, 2011
Consultant’s Commentary
Through June 30, 2011U.S. Equity (continued)20%. In addition, the firm’s performance figures fell short of investor expectations, despite 100% earnings growthsince its IPO two years ago. The portfolio’s material processing holdings helped relative results, as theyadvanced on concerns over higher inflation. As of June 30, the fund’s largest sector overweights were consumerdiscretionary (8.9% overweight) and technology (5.9% overweight). The largest underweights were producerdurables (-8.8% underweight) and consumer staples (-7.6% underweight).
Aronson returned 0.7% for the quarter, beating the Russell 1000 Value return of -0.5%. For the trailing year,Aronson beat the benchmark 32.7% to 28.9%. Aronson also leads the index over the trailing three- and five-yearperiods. The fund remains sector-neutral (active sector weights are +/-0.7% of benchmark), with selection drivenby its multi-factor valuation model. The main driver of outperformance over the quarter came from themanagement factor, where the quantitative model looks for evidence that a company’s management team has,and will continue, to emphasize earnings power. The factor led to outperformance primarily in the health caresector. Specifically, share repurchases (a positive outlook as it may signal that management views shares asundervalued), was a common factor among top-performing health care firms such as Biogen, ForestLaboratories, UnitedHealth Group, and Aetna. The fund’s value and momentum factors were less successfulover the quarter, particularly in financials, though they did help support picks in consumer discretionary. Thefund’s top performing stock was an out-of-benchmark allocation to Herbalife, which added 0.4% to the totalreturn. In addition, the fund will actively manage market-cap exposure, and over the quarter benefitted from anunderweight to the largest names.
Wellington returned -0.8% during the quarter compared to -0.7% for its S&P 400 Midcap Index benchmark. Theslight underperformance was driven primarily by poor selection in financials. Specifically, insurer GenworthFinancial fell, as investors remained concerned about its US mortgage insurance business. Selection in
6

New York City Board of Education Retirement SystemPerformance Overview as of June 30, 2011
Consultant’s Commentary
Through June 30, 2011
7
U.S. Equity (continued)industrials also hurt relative results, as Lennox International failed to meet expectations, raising concerns aboutUS residential HVAC demand. Selection in energy also detracted, as Alpha Natural Resources’ results fell shortof expectations. These negatives were partially offset by strong selection in information technology, includingsolid performances from Genpact and Polycom. Security selection in health care also boosted relative results.Security selection was a larger driver of results than sector allocation decisions. The largest sector effect camefrom a 3.1% underweight to consumer staples, which cost the fund over 40 bps. The portfolio exhibits a slightstyle bias, and this can be seen in sector positioning, (i.e., overweights in cyclically-sensitive sectors such astechnology, industrials, and consumer discretionary). This is also confirmed by a comparison of various portfoliometrics compared to benchmark. Weighted average forecasted EPS growth is 14.4% versus 12.5% for thebenchmark, and weighted average price/book is 2.8x versus 2.2x for the benchmark. This slight growth tilt isconsistent with the portfolio’s historical positioning.
Daruma returned -1.8% versus -1.6% for the Russell 2000 during the quarter. The portfolio has addedmeaningful value over the past year, beating the index 47.4% to 37.4%. Sector positioning was negative, asdefensive sectors outperformed due to increased investor risk aversion. Utilities (+5.2%), health care (+3.7%)and consumer staples (+3.4%) were the top performers over the period. The fund does not own any utilities, andits consumer staples holdings (Chiquita and United Natural) were both down for the quarter. The fund’s healthcare holdings beat those in the index, although this was offset by an underweight allocation. At the security level,the biggest detractor was private mortgage insurer MGIC Investment Corp (contributing -1.1% to the total return).Daruma anticipated volatility from the stock at the time of purchase, as its short-run performance was sensitive tohousing-, employment-, and legislation-headline risk. Still, Daruma observes tremendous value and earningspower in this stock, they note that investors in the company require “a cast-iron stomach”, at least until economicnews improves.
Progress outperformed its Russell 3000 benchmark during quarter with a 0.5% return versus 0.0%. Themanager has added about 1% of excess return (annualized) over the past five years.
New York City Board of Education Retirement SystemPerformance Overview as of June 30, 2011
Consultant’s Commentary
Through June 30, 2011
8
U.S. Equity (continued)FIS beat its Russell 2000 Index benchmark during the quarter, -1.4% versus -1.6%. Although FIS is ahead overthe year-to-date period, performance lags over the three-year time period by an annualized 3%.
International EquityThe Total Developed Market portfolio outperformed the MSCI EAFE (net dividend) Index during the quarter, 2.5%versus 1.6%, as both managers did well. Total Developed Markets is also ahead over the trailing year (32.5%versus 30.4%), and also over longer periods.
Baillie Gifford returned 2.4% versus 1.6% for the MSCI EAFE (net) Index during the quarter. The return for thetrailing year is 34.5% versus 30.4%. Baillie Gifford leads the MSI EAFE for three years and also is ahead of theEAFE Growth index. The fund added to a number of holdings over the period, as they see opportunity in recentshort-term market moves. These include companies such as Fortescue (Australian miner), Tencent (Chinesesocial media) and Aixtron (LEDs). For the quarter ended June 30, allocations to all regions had a positive effect,except for the 14.5% average allocation to emerging markets, which contributed -0.6% to total return. Anoverweight to consumer discretionary helped results, as did positive selection, adding 1.4% to the total return.Negative selection in energy was a key detractor, costing -0.6%.
Sprucegrove returned 2.6% for the quarter, ahead of the 1.6% for the MSCI EAFE (net) Index. Over the pastyear, Sprucegrove returned 30.2% to 30.4% for the benchmark. Sprucegrove leads both the MSCI EAFE andMSCI EAFE Value Indices over the trailing three and five year periods. Stock selection in energy was a maindetractor for the quarter, although this was partially offset by 1) strong selection in industrials, 2) an overweight inconsumer discretionary, and 3) an underweight to financials. Over the quarter, the fund performed better than theindex in six out of ten sectors, and over the year, it outperformed in only four out of ten sectors. From a country

New York City Board of Education Retirement SystemPerformance Overview as of June 30, 2011
Consultant’s Commentary
Through June 30, 2011
9
International Equity (continued)perspective, stock selection in Japan, Switzerland, and Germany all helped relative performance. The fund’semerging market exposure detracted from relative results. The fund is underweight in Europe (48% versus 67%)and is virtually neutral in the Pacific (33%). Emerging markets were approximately 11% of the fund, and theremainder of the portfolio is divided between Canada and cash.
Emerging MarketsState Street Global Advisors (SSgA) returned -1.1% during the quarter, trailing the -1.0% return of the MSCIEmerging Markets Index. SSgA still remains ahead over the trailing year (29.4% versus 28.2%), but lags overthree years, where relative losses in calendar years 2008 and 2009 have not yet been recouped. Countryallocation was negative for performance as overweights in Russia and Peru hurt performance. Russia fell (-7.8%)in tandem with falling energy prices, while Peru suffered (-16.3%) due to election-related concerns. Positivesinclude an overweight to Korea and an underweight to Brazil. Model factors were modestly positive. Momentumwas the best performing factor, while Sentiment was flat, and Valuation was weak. During the quarter, a newcomponent, Flow, was incorporated into the Sentiment factor. Flow seeks to assess institutional investmentflows, with the hypothesis that rising flows will drive returns for investors higher.
Fixed Income – Structured Manager CompositeThe Total Structured Portfolio underperformed its NYC Core + 5 Index during the quarter with a return of2.4% versus 2.6%, as SSgA was the only manager to outperform. The Portfolio returned 4.8% over the trailingyear, ahead of the 4.2% returned by the benchmark. For the year, SSgA and Prudential slightly lagged theirrespective indices while Taplin and PIMCO added value.

New York City Board of Education Retirement SystemPerformance Overview as of June 30, 2011
Consultant’s Commentary
Through June 30, 2011
10
Fixed Income – Structured Manager Composite (continued)Taplin Canida (credit) returned 2.3% during the quarter, trailing the 2.4% for the customized Citigroup CreditIndex. Over the past 12 months, Taplin beat the benchmark with a return of 7.2% versus 5.9%.Underperformance for the quarter was driven by poor sector and quality selection. The fund’s average creditquality is A- versus A for the benchmark during a period where higher quality issues outperformed. In addition,the fund’s underweight in utilities hurt relative performance, as the sector outperformed on both an absolute anda duration-adjusted basis. Relative performance was helped by the fund’s barbelled portfolio strategy, wherelonger-dated issues performed well in the declining interest rate environment. Long credit outperformedintermediate credit by 82 basis points due to curve shifts, though this benefit was somewhat offset by the fund’sexposure to floating rate notes, which underperformed fixed rate securities. The fund currently holds 2.2% in non-investment grade securities, with a maximum allowable allocation of 10%.
Prudential (credit) returned 2.3% during the quarter, trailing the 2.4% returned by its customized index. For thetrailing year, Prudential trailed the benchmark with a return of 5.7% versus 5.9%. The fund remains overweight inthe middle of the investment-grade quality spectrum (60% AA-A versus 54% for the benchmark). This is fundedby an underweight in both higher and lower quality issues (5% underweight AAA and 3% underweight BBB). Thefund’s average coupon is slightly higher than the benchmark. The portfolio’s average credit rating A, identical tothat of the benchmark. Duration is unchanged and remains identical to benchmark at 5.8 years.
SSgA (governments) returned 3.5% in the quarter, ahead of the benchmark return of 3.4%. For the year, SSgAreturned 2.4%, lagging the benchmark return by 3 basis points. During the quarter, the combination oflengthening duration to a neutral stance compared to benchmark early in the quarter, combined with a non-benchmark allocation to TIPS, contributed to the outperformance.

New York City Board of Education Retirement SystemPerformance Overview as of June 30, 2011
Consultant’s Commentary
Through June 30, 2011
11
Fixed Income – Structured Manager Composite (continued)PIMCO (mortgages) returned 2.0% for the quarter compared to 2.3% for the index. PIMCO is well ahead for thetrailing year with a return of 4.7% compared to 3.7% for the index. Three and five year results are also ahead ofthe benchmark. The portfolio’s underperformance was driven by exposure to non-agency mortgages, asinvestors preferred safer issues during the quarter. Similarly, allocations to CMBS hurt relative results, as thesector also lagged on profit-taking and flight-to-quality. The fund was also underweight duration, as interest ratesfell, serving as another source of underperformance. On the positive end, an underweight to higher couponFNMA issues helped performance as did an underweight to lower-coupon GNMA issues. Relative duration wasbasically unchanged, beginning the quarter neutral to benchmark versus just 0.1 years shorter on June 30, 2011(which was where the portfolio was positioned for most of the quarter).
Fixed Income – TIPSPIMCO returned 3.4% during the quarter, trailing the Barclays Capital US TIPS Index return of 3.7%. PIMCOreturned 7.0% over the trailing year, underperforming the benchmark return of 7.7%. Three and five year resultsare slightly ahead of the index. Underperformance for the quarter is attributable to poor security selection withinthe TIPS universe. In addition, real yield curve positioning hurt the fund, as the portfolio was primarily overweightthe intermediate and long end of the curve while these rates fell less than shorter-dated issues. The fundbenefited from holding Australian linkers as they outperformed US TIPS. In addition, holding short andintermediate dated Italian linkers were positive for the fund. In terms of positioning, TIPS holdings were reduced,as PIMCO moved further underweight real duration versus the benchmark. This occurred primarily in the 5-10year maturities. Australian and Italian linker allocations were increased.

New York City Board of Education Retirement SystemPerformance Overview as of June 30, 2011
Consultant’s Commentary
Through June 30, 2011
12
Enhanced Yield Fixed IncomeTotal Enhanced Yield returned 1.4% during the quarter compared to 1.1% for the Citigroup BB & B Index, wherean outperformance by Loomis offset a slight underperformance by Seix. Enhanced yield remains ahead over thetrailing year, 17.4% versus 14.6%, with both managers leading the benchmark.
Loomis Sayles returned 1.7% for the quarter versus 1.0% for the Merrill Lynch High Yield Master II index. Overthe past 12 months, the portfolio returned 18.4% versus 15.4% for the index. Three and five year results are alsoahead of the benchmark. The fund’s focus on issues with positive fundamentals, low default probability and solidbalance sheets was beneficial over the period, as investors shifted away from higher-risk assets. Relative resultswere also helped by exposure to non-US issues and currencies, such as the Mexican peso, Brazilian real andIndonesian rupiah. At the sector level, holdings in industrials and utilities outperformed. As of June 30, the fund issignificantly overweight duration (7.1 years versus 4.4 years) with a lower average coupon and yield-to-maturitythan benchmark. Out-of-benchmark holdings include non-USD issues, convertibles and US investment grade.
Seix returned 1.0% for the quarter versus 1.1% for the Citigroup BB&B Index. Over the trailing year, Seix isahead 16.4% versus 14.6%. Three and five year results are also ahead of the benchmark. The fund benefitedfrom strong security selection in the telecommunication services sector. Much of the gains were offset however,by underweights in higher quality bonds, as investors became more risk averse during the quarter. SinceJanuary 1, 2011, the fund is ahead of its benchmark by 06%, driven primarily by favorable security selection inutilities, financials and telecommunication services. As of June 30, the fund is slightly overweight duration (4.7versus 4.4), with a higher yield to maturity and lower average credit quality than the benchmark. On an industrylevel, banking/finance is the largest overweight (17.8% versus 10.0%) while the largest underweight is inTechnology/ISP (1.9% versus 4.9%).
New York City Board of Education Retirement SystemPerformance Overview as of June 30, 2011
$2.9B Under Management
Total Portfolio Returns: June 30, 2011
1.10%
24.19% 24.19%
5.34% 5.62% 6.02%7.47%
1.15%
23.99% 23.99%
4.52% 4.90% 5.46%7.03%
0%
5%
10%
15%
20%
25%
30%
Trailing 3 Months
FYTD Trailing 12 Months
Trailing 3 Years
Trailing 5 Years
Trailing 10 Years
Trailing 15 Years
Rat
e of
Ret
urn
Portfolio Returns Policy Index ReturnsAs of 06/30/11 |
3 Years 5 Years 10 Years 15 Years
Plan Std Dev 15.7 13.3 11.4 11.6
Benchmark Std Dev 16.9 14.1 12.1 11.9
All returns are Gross. An estimate of fees for major investment programs is provided in the Appendix.
13

New York City Board of Education Retirement SystemPerformance Overview as of June 30, 2011
$2.9B Under Management
Portfolio Asset Allocation: June 30, 2011
Asset Allocation
Relative Mix to Actual Policy Weights
Domestic Equity Emerging MktsEAFE Markets
Core +5 Enhanced Yield
$0.1 3.4%
5.0%
0.5% 1.4%
-2.2%3.4%
-5.3%
-0.4% -1.6%0.0% 0.0%
-9.0%
-6.0%
-3.0%
0.0%
3.0%
6.0%
9.0%
Note: Brackets represent rebalancing ranges versus Actual Policy.
$1.240.0%$0.5
16.7%
$0.621.5%
TIPS
$0.07 2.6%
Private Equity
$0.2 5.4%
$0.082.8%
ETI Cash
$0.1 5.5%$0.01
0.5%
Private Real Estate
$0.05 1.6%
14

New York City Board of Education Retirement SystemPerformance Overview as of June 30, 2011
Performance Attribution: Total Plan - Quarter Ending June 30, 2011
1.10%
1.32%
1.15%
0.00%
0.50%
1.00%
1.50%
Total Plan Returns Plan Return @ Policy Weights
Policy Index
(Ret
urn
%)
AllocationEffect -0.22
ManagementEffect 0.17
15

New York City Board of Education Retirement SystemPerformance Overview as of June 30, 2011
Performance Attribution: Total Plan – 12 Months Ending June 30, 2011
24.19% 24.70% 23.99%
0.00%
5.00%
10.00%
15.00%
20.00%
25.00%
30.00%
Total Plan Returns Plan Return @ Policy Weights
Policy Index
(Ret
urn
%)
AllocationEffect -0.51
ManagementEffect .71
16

New York City Board of Education Retirement SystemPerformance Overview as of June 30, 2011
Performance Attribution: Total Plan – 3 Years Ending June 30, 2011
5.34%5.62%
4.52%
0.00%
2.00%
4.00%
6.00%
Total Plan Returns Plan Return @ Policy Weights
Policy Index
(Ret
urn
%)
AllocationEffect -0.28
ManagementEffect 1.10
17

New York City Board of Education Retirement SystemPerformance Overview as of June 30, 2011
Total Plan - Quarter Ending June 30, 2011
Management Effect – Asset Class Breakdown
Plan Quarter 12 Months
3 Years Benchmark
Domestic Equity -0.10 0.33 0.17 Russell 3000 Index
EAFE Markets 0.20 0.32 0.87 MSCI EAFE Index
Emerging Markets -0.03 0.11 0.06 MSCI Emerging Markets Index
Private Equity 0.18 -0.32 -0.20 Russell 3000 Index + 500 b.p.
Private Real Estate -0.07 **** **** NCREIF ODCE NET
Domestic Fixed 0.01 0.12 0.18 NYC Core +5 Index
Enhanced Yield 0.00 0.05 -0.13 Citigroup BB&B Index
TIPS -0.01 -0.02 0.00 Barclays Capital US TIPS Index
Note: Detailed effects may not add up to total due to reallocation and trading effects.
18

New York City Board of Education Retirement SystemPerformance Overview as of June 30, 2011 19

New York City Board of Education Retirement SystemPerformance Overview as of June 30, 2011 20

New York City Board of Education Retirement SystemPerformance Overview as of June 30, 2011
New York City
Equity Analysis
Board of Education Retirement System
21

New York City Board of Education Retirement SystemPerformance Overview as of June 30, 2011
56.1%
30.2%
7.5% 3.9% 2.3%
Domestic Equity EAFE Mkts Emerging MktsPrivate Equity Private Real Estate
$2.0B Under Management, 70% of Total Funds
Total Equity Asset Allocation: June 30, 2011
Asset Allocation by Groups
22
New York City Board of Education Retirement SystemPerformance Overview as of June 30, 2011
Total Domestic Equity Asset Allocation: Quarter Ending June 30, 2011
$1.2B Under Management, 40% of Total Funds
Asset Allocation by Groups
Value Added by Sectors
23
3.0% 7.2%4.3%
12.4%64.6%
8.5%
Small Cap Active Mid Cap Active Mid Cap S&P 400 Index
Russell 1000 Active Russell 3000 Index Funds Manager of Managers
Sub Sector Policy Weight Actual Weight Under/Over Weight Index Return Actual
Return DifferenceContribution to Out/Under
Performance
Allocation ManagementSmall Cap Active 2.83 2.90 0.07 -1.61 -1.78 -0.17 0.00 0.00Mid Cap Active 7.25 7.20 -0.05 -0.73 -0.80 -0.07 0.00 -0.01Mid Cap S&P 400 Index 3.75 4.32 0.57 -0.73 -0.70 0.03 0.00 0.00Russell 1000 Active 11.25 12.43 1.18 0.12 -0.47 -0.59 0.00 -0.07Russell 3000 Index Fund 67.42 64.63 -2.79 -0.03 -0.09 -0.06 0.00 -0.04Manager of Managers 7.50 8.51 1.01 -0.03 -0.01 0.02 0.00 0.00

New York City Board of Education Retirement SystemPerformance Overview as of June 30, 2011
$34M Under Management, 1% of Total Funds
Small Cap Returns vs Russell 2000 Index
Small Cap Returns Russell 2000 Index
Rat
e of
Ret
urn
As of 06/30/11 |
-1.78%
47.40% 47.40%
7.03%2.70% 4.37% 4.77%
7.57%
-1.61%
37.41% 37.41%
7.78%
4.08% 5.76% 6.28%9.34%
-10%
0%
10%
20%
30%
40%
50%
Trailing 3 Months
FYTD Trailing 12 Months
Trailing 3 Years
Trailing 5 Years
Trailing 6 Years
Trailing 7 Years
Trailing 8 Years
24
3 Years 5 Years 6 Years 7 Years 8 Years
Plan Std Dev 25.1 21.1 20.0 19.4 18.7
Benchmark Std Dev 26.9 22.6 21.4 20.7 20.0

New York City Board of Education Retirement SystemPerformance Overview as of June 30, 2011
$134M Under Management, 5% of Total Funds
Mid Cap Returns vs Russell MidCap Index
Mid Cap Returns S&P Mid Cap 400 Index
Rat
e of
Ret
urn
As of 06/30/11 |
-0.76%
0.42%
-1%
0%
1%
Trailing 3 Months
25
New York City Board of Education Retirement SystemPerformance Overview as of June 30, 2011
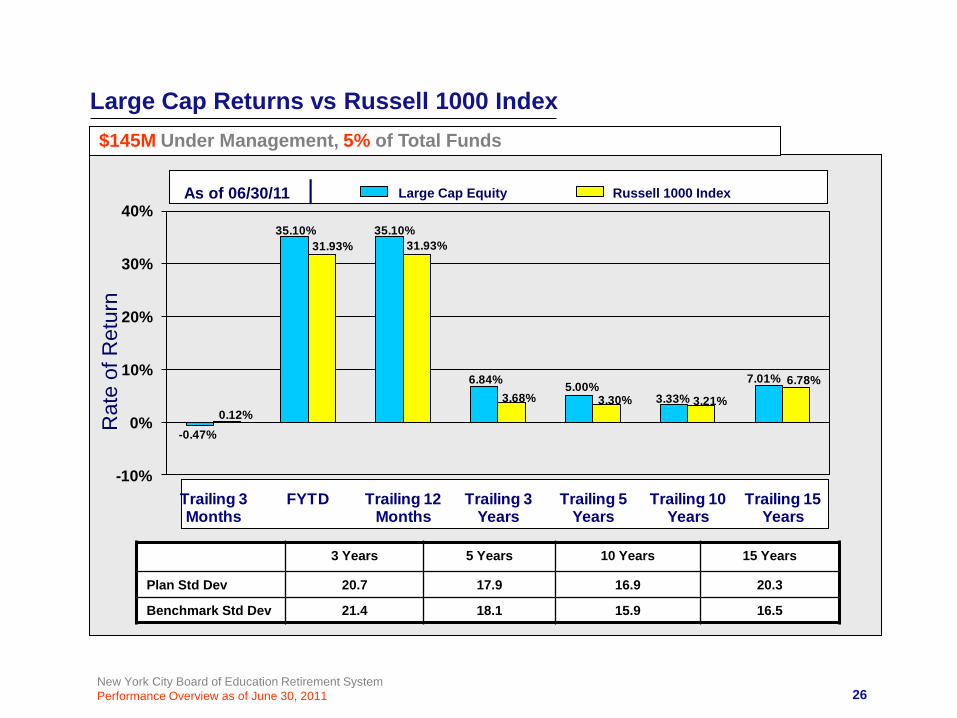
$145M Under Management, 5% of Total Funds
Large Cap Returns vs Russell 1000 Index
Large Cap Equity Russell 1000 Index
Rat
e of
Ret
urn
As of 06/30/11 |
3 Years 5 Years 10 Years 15 Years
Plan Std Dev 20.7 17.9 16.9 20.3
Benchmark Std Dev 21.4 18.1 15.9 16.5
26
-0.47%
35.10% 35.10%
6.84% 5.00%3.33%
7.01%
0.12%
31.93% 31.93%
3.68% 3.30% 3.21%
6.78%
-10%
0%
10%
20%
30%
40%
Trailing 3 Months
FYTD Trailing 12 Months
Trailing 3 Years
Trailing 5 Years
Trailing 10 Years
Trailing 15 Years

New York City Board of Education Retirement SystemPerformance Overview as of June 30, 2011
$754M Under Management, 26% of Total Funds
Russell 3000 Passive Returns vs Russell 3000 Index
Russell 3000 Composite Russell 3000 Index
Rat
e of
Ret
urn
As of 06/30/11 |
-0.09%
32.27% 32.27%
4.06% 3.36% 3.46%6.83%
-0.03%
32.37% 32.37%
4.00% 3.35% 3.44%6.77%
-5%
0%
5%
10%
15%
20%
25%
30%
35%
Trailing 3 Mths
FYTD Trailing 12 Mths
Trailing 3 Yrs Trailing 5 Yrs Trailing 10 Yrs
Trailing 15 Yrs
3 Years 5 Years 10 Years 15 Years
Plan Std Dev 21.6 18.2 16.1 16.6
Benchmark Std Dev 21.7 18.3 16.2 16.6
27

New York City Board of Education Retirement SystemPerformance Overview as of June 30, 2011
Emerging Managers Returns vs Russell 3000 Index$99M Under Management, 3% of Total Funds
Emerging Managers Returns Russell 3000 Index
Rat
e of
Ret
urn
As of 06/30/11 |
-0.01%
35.50% 35.50%
4.22% 4.33% 5.51%
-0.03%
32.37% 32.37%
4.00% 3.35% 4.37%
-10%
0%
10%
20%
30%
40%
Trailing 3 Months
FYTD Trailing 12 Months
Trailing 3 Years
Trailing 5 Years
Trailing 6 Years
28
3 Years 5 Years 6 Years
Plan Std Dev 22.5 19.0 17.7
Benchmark Std Dev 21.7 18.3 17.0

New York City Board of Education Retirement SystemPerformance Overview as of June 30, 2011
$1.2B Under Management, 40% of Total Funds
Total Domestic Equity Returns vs Russell 3000 Index
Domestic Equity Returns Russell 3000 Index
Rat
e of
Ret
urn
As of 06/30/11 |
-0.25%
33.38% 33.38%
4.42% 3.60% 3.72%6.99%
-0.03%
32.37% 32.37%
4.00% 3.35% 3.44%6.77%
-10%
0%
10%
20%
30%
40%
Trailing 3 Mths
FYTD Trailing 12 Mths
Trailing 3 Yrs Trailing 5 Yrs Trailing 10 Years
Trailing 15 Years
3 Years 5 Years 10 Years 15 Years
Plan Std Dev 21.7 18.4 16.2 16.7
Benchmark Std Dev 21.7 18.3 16.2 16.6
29

New York City Board of Education Retirement SystemPerformance Overview as of June 30, 2011
0.1%
$784M Under Management, 27% of Total Funds
International Equity Asset Allocation: June 30, 2011
30
Asset Allocation by Style
35.8%
44.2%
20.0%
Value Growth Emerging Mkts

New York City Board of Education Retirement SystemPerformance Overview as of June 30, 2011
$628M Under Management, 22% of Total Funds
EAFE Markets Returns vs MSCI EAFE Index
MSCI EAFE Index
Rat
e of
Ret
urn
EAFE Mkts Active Equity
2.50%
32.54% 32.54%
2.68%
5.58%7.24% 6.48%
2.50%
32.54% 32.54%
2.68%
5.58% 7.05% 6.83%
1.56%
30.36% 30.36%
-1.77%
1.47%
5.66% 4.73%
-5%
0%
5%
10%
15%
20%
25%
30%
35%
Trailing 3 Mths FYTD Trailing 12 Mths
Trailing 3 Yrs Trailing 5 Yrs Trailing 10 Years
Trailing 15 Years
3 Years 5 Years 10 Years 15 Years
EAFE Plan Std Dev 25.6 21.3 18.5 17.6
Active Plan Std Dev 25.6 21.3 18.6 17.9
Benchmark Std Dev 25.5 21.3 18.2 17.4
31
As of 06/30/11 |

New York City Board of Education Retirement SystemPerformance Overview as of June 30, 2011
Emerging Markets Returns vs MSCI Emerging Markets Index$157M Under Management, 5% of Total Funds
Rat
e of
Ret
urn
Emerging Mkts Returns MSCI Emerging Mkts IndexAs of 06/30/11 |
3 Years 5 Years 10 Years 12 Years
Plan Std Dev 30.8 27.4 23.6 24.0
Benchmark Std Dev 30.7 27.2 24.0 24.4
32
-1.11%
29.38% 29.38%
1.12%
10.23%
17.46%13.39%
-1.04%
28.17% 28.17%
4.54%
11.75%
16.55%
11.64%
-5%
0%
5%
10%
15%
20%
25%
30%
35%
Trailing 3 Months
FYTD Trailing 12 Months
Trailing 3 Years
Trailing 5 Years
Trailing 10 Years
Trailing 12 Years

New York City Board of Education Retirement SystemPerformance Overview as of June 30, 2011
New York City
Fixed Income Analysis
Board of Education Retirement System
33

New York City Board of Education Retirement SystemPerformance Overview as of June 30, 2011
58.2%11.8%
19.1%
1.8%9.1%
Structured Fixed Income Enhanced Yield Short Term Investments ETI Tips Managers
$836M Under Management, 29% of Total Funds
Total Fixed Income Asset Allocation: June 30, 2011
Asset Allocation by Groups
34

New York City Board of Education Retirement SystemPerformance Overview as of June 30, 2011
18.3%
46.5%
35.2%
Treasury/Agency Mortgage Credit
Structured Fixed Income Asset Allocation: Quarter Ending June 30, 2011
Asset Allocation by Groups
Asset Allocation by Sectors
35
*NYC Core +5 Breakdown
$486M Under Management, 17% of Total Funds
Sub Sector Policy Weight
Actual Weight
Under/Over Weight
Index Return
Actual Return Difference
Contribution to Out/Under Performance
Allocation Management
Treasury/Agency 20.74 18.27 -2.47 3.39 3.49 0.10 -0.03 0.02
Mortgage 44.02 46.50 2.48 2.34 2.02 -0.32 -0.01 -0.14
Credit 35.24 35.22 -0.02 2.35 2.25 -0.10 0.00 -0.04

New York City Board of Education Retirement SystemPerformance Overview as of June 30, 2011
$486M Under Management, 17% of Total Funds
Structured Returns vs NYC Core + 5 Index
Structured Returns NYC Core + 5 Index
Rat
e of
Ret
urn
As of 06/30/11 |
2.37%
4.77% 4.77%
7.65%7.18%
6.68%7.14%
2.57%
4.15% 4.15%
7.32% 7.19%
6.27%6.77%
0%
2%
4%
6%
8%
Trailing 3 Months
FYTD Trailing 12 Months
Trailing 3 Years
Trailing 5 Years
Trailing 10 Years
Trailing 15 Years
3 Years 5 Years 10 Years 15 Years
Plan Std Dev 5.0 4.3 4.3 4.1
Benchmark Std Dev 5.1 4.4 4.4 4.2
36

New York City Board of Education Retirement SystemPerformance Overview as of June 30, 2011
$77M Under Management, 3% of Total Funds
TIPS Returns vs Barclays Capital US TIPS Index
TIPS Returns Barclays Capital US TIPS Index
Rat
e of
Ret
urn
As of 06/30/11 |
3.43%
6.98% 6.98%
5.35%
7.00%
5.50%
3.66%
7.74% 7.74%
5.30%
6.92%
5.44%
0%
2%
4%
6%
8%
10%
Trailing 3 Mths FYTD Trailing 12 Mths
Trailing 3 Yrs Trailing 5 Yrs Trailing 6 Yrs
37
3 Years 5 Years 6 Years
Plan Std Dev 8.8 7.6 7.2
Benchmark Std Dev 8.4 7.3 7.0

New York City Board of Education Retirement SystemPerformance Overview as of June 30, 2011
$99M Under Management, 3% of Total Funds
Enhanced Yield Returns vs Citigroup BB & B Index & Citigroup BB & B Capped Index
Enhanced Yield Citigroup BB& B Index
Rat
e of
Ret
urn
As of 06/30/11 |
0%
3%
6%
9%
12%
15%
18%
21%
Trailing 3 Months
FYTD Trailing 12 Months
Trailing 3 Years
Trailing 5 Years
Trailing 10 Years
Trailing 12 Years
38
Citigroup BB& B Capped Index
3 Years 5 Years 10 Years 12 Years
Plan Std Dev 13.3 10.8 9.2 9.1
Citigroup BB&B 14.0 11.4 10.0 9.7
Citigroup BB&B Capped 13.7 11.1 **** ****

New York City Board of Education Retirement SystemPerformance Overview as of June 30, 2011 39
$15M Under Management, 0.45% of Total Funds
ETI Returns
Rat
e of
Ret
urn
As of 06/30/11 |
1.98%
4.03% 4.03%
6.88% 6.96%
2.14%
3.69% 3.69%
6.06%
2.29%
3.90% 3.90%
6.46% 6.52%
0%
2%
4%
6%
8%
Trailing 3 Mths FYTD Trailing 12 Months Trailing 3 Years Trailing 5 Years
Note: Returns (shown net of fees) and Market Value do not include cash
Custom Index
ETI Returns vs Custom Index & Barclays Capital U.S. Aggregate
Barclays Capital U.S. Aggregate
3 Years 5 Years
Plan Std Dev 3.0 3.1
Custom Index Std Dev 3.3 ****
BC US Aggreg Std Dev 4.1 3.6
New York City Board of Education Retirement SystemPerformance Overview as of June 30, 2011
New York CityBoard of Education Retirement System
Appendix
40

New York City Board of Education Retirement SystemPerformance Overview as of June 30, 2011
Consolidated Performance ReportThrough June 30, 2011
3 Mos YTD 1 Yr 3 Yrs 5 Yrs 10 Yrs 15 YrsAssets % Apr-11 Jan-11 Jul-10 Jul-08 Jul-06 Jul-01 Jul-96($MM) Total Jun-11 Jun-11 Jun-11 Jun-11 Jun-11 Jun-11 Jun-11
EQUITY MANAGEMENTSMALL CAP
33.82 1.16 DARUMA -SCC -1.78 10.80 47.40 **** **** **** ****33.82 1.16 TOTAL SMALL CAP CORE -1.78 10.80 47.40 **** **** **** ****
RUSSELL 2000 -1.61 6.21 37.41 **** **** **** ****SMALL CAP CORE MEDIAN -1.44 6.89 36.69 **** **** **** ****
33.82 1.16 TOTAL SMALL CAP -1.78 10.80 47.40 7.03 2.70 **** ****RUSSELL 2000 -1.61 6.21 37.41 7.78 4.08 **** ****
83.98 2.88 WELLINGTON MID CAP -0.80 7.04 **** **** **** **** ****83.98 2.88 TOTAL MID CAP CORE -0.80 7.04 **** **** **** **** ****
S&P MIDCAP 400 -0.73 8.56 **** **** **** **** ****
50.42 1.73 STATE STREET GA S&P 400 -0.70 **** **** **** **** **** ****50.42 1.73 TOTAL MID CAP PASSIVE -0.70 **** **** **** **** **** ****
S&P MIDCAP 400 -0.73 **** **** **** **** **** ****
134.40 4.61 TOTAL MID CAP -0.76 6.89 **** **** **** **** ****RUSSELL MIDCAP 0.42 8.08 **** **** **** **** ****
LARGE CAP52.94 1.81 ZEVENBERGEN -2.45 6.20 41.19 10.75 9.73 5.25 8.77
RUSSELL 3000 GROWTH 0.64 6.98 35.68 5.28 5.36 2.42 5.2852.94 1.81 TOTAL LARGE CAP GROWTH -2.45 7.48 37.01 9.01 7.73 3.71 7.27
LARGE CAP GROWTH MEDIAN 0.56 6.80 34.72 4.27 4.89 3.48 7.56
92.06 3.15 ARONSON JOHNSON 0.70 8.62 32.74 4.54 2.33 **** ****RUSSELL 1000 VALUE -0.50 5.92 28.94 2.28 1.15 **** ****
92.06 3.15 TOTAL LARGE CAP VALUE 0.70 8.62 32.74 4.54 2.33 **** ****LARGE CAP VALUE MEDIAN -0.39 6.37 29.86 3.61 2.30 **** ****
145.01 4.97 TOTAL LARGE CAP -0.47 8.12 35.10 6.84 5.00 3.33 7.01RUSSELL 1000 0.12 6.37 31.93 3.68 3.30 3.21 6.78
41

New York City Board of Education Retirement SystemPerformance Overview as of June 30, 2011
Consolidated Performance Report
Through June 30, 20113 Mos YTD 1 Yr 3 Yrs 5 Yrs 10 Yrs 15 Yrs
Assets % Apr-11 Jan-11 Jul-10 Jul-08 Jul-06 Jul-01 Jul-96($MM) Total Jun-11 Jun-11 Jun-11 Jun-11 Jun-11 Jun-11 Jun-11
PROGRESS MANAGERS2.34 0.08 FAN ASSET MGMT -LCG 0.07 7.67 36.65 4.29 5.62 2.47 ****0.00 0.00 FORTALEZA -SCG 0.25 12.78 51.87 6.41 3.69 **** ****0.00 0.00 GW CAPITAL -SCV -2.93 9.89 36.76 8.19 **** **** ****
12.19 0.42 JOHN HSU -LCC -1.78 4.55 35.66 3.02 5.92 6.20 ****18.73 0.64 HERNDON CAPITAL MGMT-LCV 3.15 11.05 40.06 8.76 8.51 **** ****3.43 0.12 HIGH POINTE LLC -LCG 1.01 7.24 32.01 **** **** **** ****4.49 0.15 LOMBARDIA CAPITAL -SCV -2.33 6.05 32.24 12.81 **** **** ****0.01 0.00 PALISADES -LCV 5.15 13.69 38.97 4.20 2.12 **** ****0.01 0.00 PROFIT INVESTMENT MGMT -LCG 1.04 5.84 27.58 4.67 **** **** ****0.01 0.00 SEIZERT CAPITAL PTNRS -LCV -1.18 6.44 30.69 2.54 **** **** ****
72.21 2.47 TOTAL PROGRESS 0.52 7.97 34.88 4.01 4.34 4.17 ****RUSSELL 3000 -0.03 6.35 32.37 4.00 3.35 3.44 ****
F.I.S. MANAGEMENT0.00 0.00 BRC INV MGMT -SCV -4.34 3.32 34.77 **** **** **** ****0.00 0.00 CAMERON CAPITAL -SCC -4.29 2.21 26.16 **** **** **** ****2.42 0.08 CUPPS CAPITAL SCG 2.12 21.24 59.24 **** **** **** ****0.00 0.00 DAVID ROSS -SCV -4.00 -4.90 6.77 **** **** **** ****3.62 0.12 ELESSAR INVESTMENT MGMT -SCV 0.40 7.67 37.06 11.76 **** **** ****1.94 0.07 EUDAIMONIA -Micro CG -4.69 1.90 41.93 **** **** **** ****4.63 0.16 LOMBARDIA CAPITAL PTNRS -SCV -2.26 6.12 32.33 12.57 **** **** ****4.13 0.14 NICHOLS ASSET MGMT -SCG 0.54 10.70 45.04 **** **** **** ****3.08 0.11 OAKBROOK -SCC -0.99 7.02 35.98 **** **** **** ****2.78 0.10 PROFIT -SCC -2.56 9.22 41.06 13.60 **** **** ****
27.11 0.93 TOTAL F.I.S FUND MGMT -1.42 7.40 37.20 4.78 **** **** ****RUSSELL 2000 -1.61 6.21 37.41 7.78 **** **** ****
99.31 3.40 TOTAL EMERGING MANAGERS -0.01 7.81 35.50 4.22 4.33 **** ****RUSSELL 3000 -0.03 6.35 32.37 4.00 3.35 **** ****
42

New York City Board of Education Retirement SystemPerformance Overview as of June 30, 2011
Consolidated Performance Report
Through June 30, 20113 Mos YTD 1 Yr 3 Yrs 5 Yrs 10 Yrs 15 Yrs
Assets % Apr-11 Jan-11 Jul-10 Jul-08 Jul-06 Jul-01 Jul-96($MM) Total Jun-11 Jun-11 Jun-11 Jun-11 Jun-11 Jun-11 Jun-11
RUSSELL 3000753.96 25.84 BLACKROCK R3000 -0.09 6.27 32.27 4.06 3.36 3.46 ****753.96 25.84 TOTAL RUSSELL 3000 -0.09 6.27 32.27 4.06 3.36 3.46 6.83
RUSSELL 3000 -0.03 6.35 32.37 4.00 3.35 3.44 6.77
362.12 12.41 TOTAL ACTIVE -0.55 8.05 36.05 5.33 4.20 3.58 5.96804.38 27.56 TOTAL PASSIVE -0.12 6.32 32.34 4.08 3.37 3.64 7.18
1166.50 39.97 TOTAL DOMESTIC EQUITY -0.25 6.79 33.38 4.42 3.60 3.72 6.99
INTERNATIONAL EQUITIYDEVELOPED MARKETS
346.24 11.87 BAILLIE 2.43 5.39 34.48 2.45 **** **** ****MSCI EAFE GROWTH 2.31 4.66 31.65 -1.49 **** **** ****
0.08 0.00 BANK OF IRELAND **** **** **** **** **** **** ****0.08 0.00 G.E. INVESTMENT **** **** **** **** **** **** ****
281.23 9.64 SPRUCEGROVE 2.59 3.90 30.24 2.85 3.92 **** ****MSCI EAFE VALUE 1.34 6.04 30.10 -1.15 0.95 **** ****
627.63 21.51 TOTAL ACTIVE DEVELOPED MARKETS 2.50 4.72 32.54 2.68 5.58 7.05 6.83627.63 21.51 TOTAL DEVELOPED MARKETS 2.50 4.72 32.54 2.68 5.58 7.24 6.48
MSCI EAFE (NET DIVIDEND) 1.56 4.98 30.36 -1.77 1.47 5.66 4.73INTERNATIONAL EQUITY MEDIAN 1.83 5.32 32.32 0.72 3.83 7.78 7.74
EMERGING MARKETS125.96 4.32 STATE STREET EMG MKTS -1.10 1.09 29.43 1.12 **** **** ****
30.70 1.05 BLACKROCK EM -1.16 **** **** **** **** **** ****156.79 5.37 TOTAL EMERGING MARKETS -1.11 1.08 29.38 1.12 10.23 17.46 ****
MSCI EMERGING MARKET FREE -1.04 1.03 28.17 4.54 11.75 16.55 ****EMERGING MARKET MEDIAN -0.63 0.31 27.46 5.75 12.92 16.83 ****
784.42 26.88 TOTAL INTERNATIONAL EQUITY 1.76 4.08 31.98 2.28 6.42 8.92 7.04
43

New York City Board of Education Retirement SystemPerformance Overview as of June 30, 2011
Consolidated Performance Report
Through June 30, 20113 Mos YTD 1 Yr 3 Yrs 5 Yrs 10 Yrs 15 Yrs
Assets % Apr-11 Jan-11 Jul-10 Jul-08 Jul-06 Jul-01 Jul-96($MM) Total Jun-11 Jun-11 Jun-11 Jun-11 Jun-11 Jun-11 Jun-11
PRIVATE EQUITY INVESTMENTS12.07 0.41 FAIRVIEW PRIVATE EQUITY FD **** **** **** **** **** **** ****51.30 1.76 MESIROW PTNRS FD III **** **** **** **** **** **** ****12.50 0.43 MESIROW PTNRS FD IV **** **** **** **** **** **** ****6.06 0.21 MESIROW PTNRS FD V **** **** **** **** **** **** ****
81.94 2.81 TOTAL PRIVATE EQUITY 7.23 14.11 20.08 2.39 -2.62 **** ****
PRIVATE REAL ESTATE0.89 0.03 FRANKIN TEMPLETON FD **** **** **** **** **** **** ****6.23 0.21 LASALLE US PROPERTY FD **** **** **** **** **** **** ****
41.40 1.42 UBS TRUMBULL PROPERTY FD **** **** **** **** **** **** ****48.52 1.66 TOTAL PRIVATE REAL ESTATE 0.11 5.08 **** **** **** **** ****
2081.38 71.32 TOTAL EQUITY - PUBLIC & PRIVATE 0.77 6.10 32.56 3.70 4.54 5.23 7.38
FIXED INCOME MANAGEMENTGOVERNMENT
88.80 3.04 STATE STREET 3.49 3.18 2.41 6.95 7.77 6.99 7.4288.80 3.04 ALL TREASURY / AGENCY 3.49 3.18 2.41 6.95 7.77 6.81 7.27
NYC - TREASURY AGENCY PLUS 5 3.39 3.02 2.44 6.70 7.62 6.83 7.30
MORTGAGE225.97 7.74 PIMCO 2.02 2.95 4.66 7.67 7.42 6.45 7.05
CITIGROUP MORTGAGE INDEX 2.34 2.97 3.74 6.96 7.02 5.87 6.44
CREDIT100.71 3.45 PRUDENTIAL CREDIT 2.25 2.86 5.71 **** **** **** ****
70.42 2.41 TAPLIN, CANIDA 2.25 3.90 7.24 8.20 6.23 6.89 7.13171.13 5.86 ALL INVESTMENT GRADE CREDIT 2.25 3.28 6.34 7.91 6.06 6.80 7.04
NYC - INVESTMENT GRADE CREDIT 2.35 3.18 5.94 7.84 6.73 6.21 6.61
44

New York City Board of Education Retirement SystemPerformance Overview as of June 30, 2011
Consolidated Performance Report
Through June 30, 20113 Mos YTD 1 Yr 3 Yrs 5 Yrs 10 Yrs 15 Yrs
Assets % Apr-11 Jan-11 Jul-10 Jul-08 Jul-06 Jul-01 Jul-96($MM) Total Jun-11 Jun-11 Jun-11 Jun-11 Jun-11 Jun-11 Jun-11
485.91 16.65 TOTAL STRUCTURED 2.37 3.11 4.77 7.65 7.18 6.68 7.14NYC - CORE PLUS FIVE 2.57 3.05 4.15 7.32 7.19 6.27 6.77
ACTIVE TIPS MANAGERS76.51 2.62 PIMCO-TIPS-MTA 3.43 5.20 6.98 5.35 7.00 **** ****76.51 2.62 TOTAL ACTIVE TIPS MANAGERS 3.43 5.20 6.98 5.35 7.00 **** ****
BARCLAYS CAPITAL US TIPS INDEX 3.66 5.81 7.74 5.30 6.92 **** ****
ENHANCED YIELD50.86 1.74 LOOMIS SAYLES & CO 1.67 7.55 18.38 13.98 10.15 9.73 ****
BofA(ML-MST II 7-03/BB&B PRIOR) 0.99 4.93 15.40 12.40 9.20 8.83 ****
48.22 1.65 SEIX HIGH YIELD 1.02 5.49 16.43 10.67 8.38 **** ****99.08 3.40 ALL ENHANCED YIELD 1.35 6.55 17.43 12.34 9.28 8.58 ****
CITIGROUP BB & B 1.05 4.88 14.60 8.14 6.73 7.36 ****CITIGROUP BB & B CAPPED 0.98 4.79 14.15 8.71 7.30 **** ****ENHANCED YIELD MEDIAN 0.90 4.74 14.99 10.73 8.73 9.51 ****
ETI2.57 0.09 ACCESS/RBC 2.43 2.65 3.56 8.26 **** **** ****
10.77 0.37 AFL-CIO HOUSING INV TRUST 2.08 2.89 4.25 6.58 **** **** ****0.10 0.00 CFSB-PPAR 0.90 1.98 9.32 9.31 **** **** ****0.13 0.00 CCD-PPAR 1.33 2.91 8.53 10.37 **** **** ****0.10 0.00 LIIF-PPAR 1.15 2.26 0.62 **** **** **** ****0.02 0.00 NCBCI-PPAR 1.30 3.53 2.93 **** **** **** ****1.28 0.04 CPC REVOLVING 0.49 1.01 2.09 2.51 **** **** ****
14.98 0.51 TOTAL ETI (WITH CASH) 1.97 2.66 3.97 6.63 6.81 4.74 5.23BERS CUSTOM ETI INDEX (NO CASH) 2.14 2.57 3.69 6.06 **** **** ****BARCLAYS CAPITAL AGGREGATE 2.29 2.72 3.90 6.46 6.52 5.75 6.32
836.00 28.65 TOTAL FIXED 2.03 3.56 6.69 7.62 7.17 6.63 6.85
45

New York City Board of Education Retirement SystemPerformance Overview as of June 30, 2011
Consolidated Performance Report
Through June 30, 2011
3 Mos YTD 1 Yr 3 Yrs 5 Yrs 10 Yrs 15 YrsAssets % Apr-11 Jan-11 Jul-10 Jul-08 Jul-06 Jul-01 Jul-96($MM) Total Jun-11 Jun-11 Jun-11 Jun-11 Jun-11 Jun-11 Jun-11
0.80 0.03 SECURITIES LENDING **** **** **** **** **** **** ****
159.52 5.47 SHORT TERM INVESTMENTS 0.23 0.34 0.43 1.34 2.78 2.67 3.840.00 0.00 BNY - CD **** **** **** **** **** **** ****
2918.17 100.00 TOTAL BOARD OF EDUCATION 1.10 5.41 24.19 5.34 5.62 6.02 7.47BOARD OF ED POLICY BENCHMARK 1.15 5.25 23.99 4.52 4.90 5.46 7.03
46

New York City Board of Education Retirement SystemPerformance Overview as of June 30, 2011
Actual And Estimated Fees
47
Actual Estimated2009 2010
INVESTMENT STYLE (EQUITIES) BASIS POINTS BASIS POINTS
Small Cap 26.65 41.94 Small Cap Core - -
Small Cap Value 17.31 Small Cap Growth 34.15 41.94
Small Cap Fundamental - -
Small/Mid Cap Growth 18.67 -
Mid Cap 10.94 - Mid Cap Core - -
Mid Cap Value 11.94 -
Large Cap 21.53 27.64 Large Cap Growth 26.18 28.51
Large Cap Value 16.99 26.68 Large Cap Core - - Large Cap Fundamental - -
Emerging Managers (U.S. Equities) 57.68 59.57 Emerging Managers (Fixed) - -
Passive Equities 0.12 0.14
76.65 Opportunistic 52.26
Activist - - Environmental - - Fixed Income - -
Int’l Active Equities (EAFE) 19.27 29.00 Int’l Passive Equities (EAFE) - Emerging Markets 43.94 54.93
NEW YORK CITY BOARD OF EDUCATION RETIREMENT SYSTEM
ACTUAL FEES FOR FISCAL YEAR ENDING JUNE 30, 2009 AND ESTIMATED FEES FOR FY 2010 UPDATED THROUGH DECEMBER 2009

New York City Board of Education Retirement SystemPerformance Overview as of June 30, 2011
Actual And Estimated Fees
48
Actual Estimated2009 2010
INVESTMENT STYLE (Fixed Income) BASIS POINTS BASIS POINTS
Core +5 Fixed Income 6.10 - Government Sector 2.04 - Mortgage Sector 6.82 - Corporate Sector 8.94 -
Yankee Sector 6.06 -
Investment Grade – Fixed Income - 7.97 Government Sector - 5.00 Mortgage Sector - 8.85
Credit Sector - 8.23
TIPS 7.58 10.00 Active TIPS 7.58 10.00
Passive TIPS - -
Enhanced Yield 27.01 28.24
Convertible Bonds - -
Global Fixed Income - -
ETI - AFL-CIO 40.00 40.00 ETI- Access RBC 38.25 39.01
In-House Short Term - -
Total Overall* 13.35 17.12
*Only Public Markets fees are calculated in the overall total
NEW YORK CITY BOARD OF EDUCATION RETIREMENT SYSTEM
ACTUAL FEES FOR FISCAL YEAR ENDING JUNE 30, 2009 AND ESTIMATED FEES FOR FY 2010 UPDATED THROUGH DECEMBER 2009

New York City Board of Education Retirement SystemPerformance Overview as of June 30, 2011
Securities Lending IncomeThrough June 30, 2011
U.S. U.S. INTERNATIONALFIXED INCOME EQUITY EQUITY
1989* $70,000 -- --1990 79,000 -- --1991 111,000 -- --1992 122,000 $11,000 --1993 79,000 32,000 $15,0001994 93,000 77,000 20,0001995 112,000 93,000 12,0001996 99,000 76,000 27,0001997 101,000 126,000 40,0001998 111,000 170,000 60,0001999 159,000 263,000 100,0002000 193,000 310,000 97,0002001 295,000 208,000 159,0002002 209,000 143,000 152,0002003 153,000 158,000 195,0002004 226,000 255,000 174,0002005 384,000 479,000 217,0002006 303,000 734,000 246,0002007 593.000 1,208,000 272,0002008 2,514,000 2,266,000 451,000 2009 698,000 1,416,000 367,0002010 246,000 729,000 326,0002011 (6 Months) 156,000 461,000 374,000Since Inception $7,106,000 $9,215,000 $3,304,000
Note: Inception 4/89
49

New York City Board of Education Retirement SystemPerformance Overview as of June 30, 2011
Footnotes
Through June 30, 2011
50
• The Barclays Capital Aggregate (then known as the Lehman Brothers Aggregate) was used prior to 1/1/89. Effective 1/1/89, in the Government Sector, maturities of less than 5 years were dropped from the Salomon and Lehman indices. From that date until7/1/99 the benchmark was the NYC Core + 5, from Lehman.
• Effective 7/1/94, the NYC Core + 5 Index includes BBB rated securities.
• Effective 7/1/99, the basis of the NYC Index was changed from Lehman Brothers to Salomon. Also effective 7/1/99, only Salomon indices have been used to compare all fixed income managers.
• Effective 4/1/03, the name of the benchmark provider was changed from Salomon to Citigroup.
• Effective 7/1/03, the “NYC-Loomis” benchmark index for the Loomis Sayles Enhanced Yield portfolio reflects a change from the Citigroup BB&B Index to the more appropriate BofA Merrill Lynch High Yield Master II Index.
• Effective 7/1/09, the Core+5 program was restructured. • The U.S. Gov’t sector benchmark Index was changed from the Citigroup Core+5 Treasury/Gov’t Sponsored Index to the
Citigroup Core+5 Treasury/Agency Index. • The Corporate and Yankee sectors were combined to form the new Investment Grade Credit sector. The benchmark for
the new combined sector is the customized Citigroup Credit Index. For historical performance purposes, the old Corporate sector Index is linked to the new Credit sector Index.
• There were no changes to the Mortgage sector Index. • The total Core+5 results and benchmark returns combine the three sectors. Historical total Core+5 returns continue to
include the old Corporate and Yankee sector returns.

New York City Board of Education Retirement SystemPerformance Overview as of June 30, 2011
Glossary of Terms
Through June 30, 2011General Notes
• All Returns are Gross of investment advisory fees unless otherwise indicated.
Page Specific
Page 14 - Portfolio Asset Allocation
• Rebalancing Ranges: the minimum and maximum weights that actual Asset Allocation may reach before rebalancing between Asset Classes is necessary.
51

New York City Board of Education Retirement SystemPerformance Overview as of June 30, 2011
Glossary of Terms
Through June 30, 2011Page 15 - Performance Attribution: Total Plan
• Plan Return At Policy Weights: the return of the Total Plan assuming actual Asset Class results were maintained at target (Adjusted Policy) weights. Figure = (Return of Asset Class 1* Target Weight) plus (Return Of Asset Class 2* Target Weight) plus (……)
• Allocation Effect = Total Plan Return minus Plan Return At Adjusted Policy Weights.
• Management Effect = Equal to the Custom Benchmark (Adjusted Policy Index) Return minus Plan Return at Adjusted Policy Weights. This illustrates how the Managers have added or removed value based on their Security Selection decisions.
• Policy Index = Custom BenchmarkThe “policy index” is a custom benchmark representing the weighted average return of the weighted benchmark indexes for each major investment program. Weights may reflect an adjustment of actual policy for outstanding commitments for new or revised programs, such as for private market programs, which are invested gradually, of for any new or updated program requiring the completion of RFPs and contracts. The policy index/custom benchmark is calculated monthly based on adjusted policy weights at the beginning of each month. The indexes and most recent policy weights are as follows: U.S. Equity: Russell 3000 * 40.81%International Developed (EAFE) Markets: MSCI EAFE * 21%International Emerging Markets: MSCI Emerging Markets * 4%Private Equity: Russell 3000 + 500 b.p. per annum * 2.58%Private Real Estate: NFI - ODCE Net * 1.61%Domestic Fixed Income: NYC Core +5 * 22%TIPS: Barclays Capital U.S. TIPS * 3%Enhanced Yield: Citigroup BB&B * 5%
52

New York City Board of Education Retirement SystemPerformance Overview as of June 30, 2011
Glossary of Terms
Through June 30, 2011Page 18 - Management Effect - Asset Class Breakdown• This chart aims to break down the Management Effect shown on the Performance Attribution pages. The aim of the Page is to
show the asset classes where Managers are either out performing or under performing their benchmark and to show the basis point effect that this is having on Plan performance.
Page 23 - Domestic Equity Asset Allocation• Value Added By Sectors: This disaggregates out-performance or under-performance by Asset Allocation and Management
Effect.• Implied Policy = Retirement's System Asset Allocation.• Implied Return = Benchmark Return• Allocation = the Contribution to Performance resulting from an overweight or underweight to an asset class. E.g. an underweight
to an Asset Class that under-performs rests in a positive Allocation Effect and vice versa.• Management = Contribution to Performance from security selection versus the Benchmark, e.g., If the managers Actual Returns
are higher than the Implied Return there will be a positive Management Effect.
Page 35 – Structured Fixed Income Asset Allocation• See Domestic Equity Asset Allocation for explanation
Page 39 – ETI Returns vs Custom Index and Barclays Capital U.S. Aggregate• ETI has implemented a Custom Benchmark to better track the performance of the individual ETI programs relative to their
respective benchmarks. The Custom Benchmark represents the weighted average return of the individual benchmark indexes for each program, updated monthly. The indexes are as follows:
• AFL-CIO Housing Inv Trust: Barclays Capital U.S. Aggregate Bond Index• CPC Revolving: 30 Day Libor + 180 bps per annum• PPAR: Citigroup GNMA + 65 bps per annum• Access/RBC: 60% BofA Merrill Lynch 30 yr Mortgage Index plus 40% BofA Merrill Lynch US Treasury 1-10yr Index
53