
Total Cost of Travel: More Trips, or Better Trips?
39
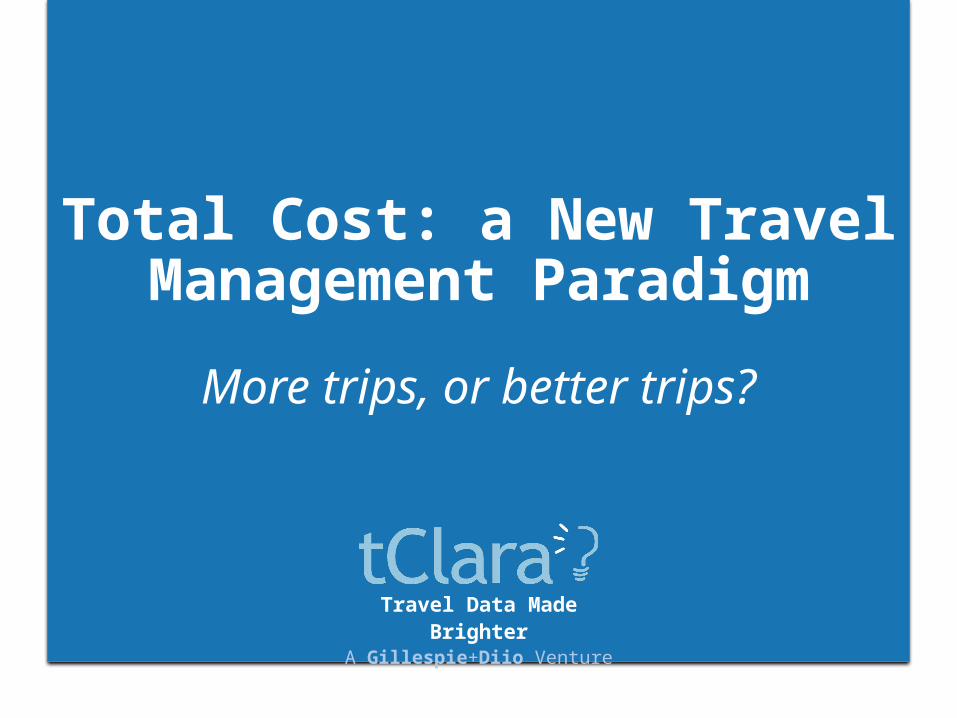
Travel Data Made Brighter A Gillespie+Diio Venture Total Cost: a New Travel Management Paradigm More trips, or better trips?
-
Upload
scott-gillespie -
Category
Business
-
view
60 -
download
0
Transcript of Total Cost of Travel: More Trips, or Better Trips?
Travel Data Made BrighterA Gillespie+Diio Venture
Total Cost: a New Travel Management Paradigm
More trips, or better trips?
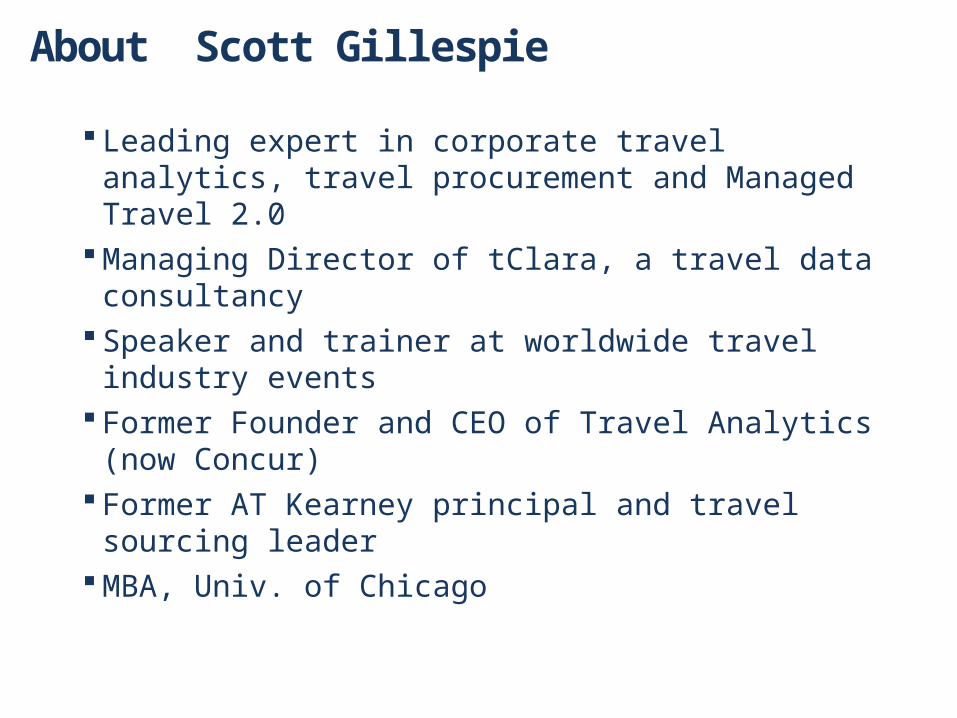
About Scott Gillespie
Leading expert in corporate travel analytics, travel procurement and Managed Travel 2.0
Managing Director of tClara, a travel data consultancy
Speaker and trainer at worldwide travel industry events
Former Founder and CEO of Travel Analytics (now Concur)
Former AT Kearney principal and travel sourcing leader
MBA, Univ. of Chicago
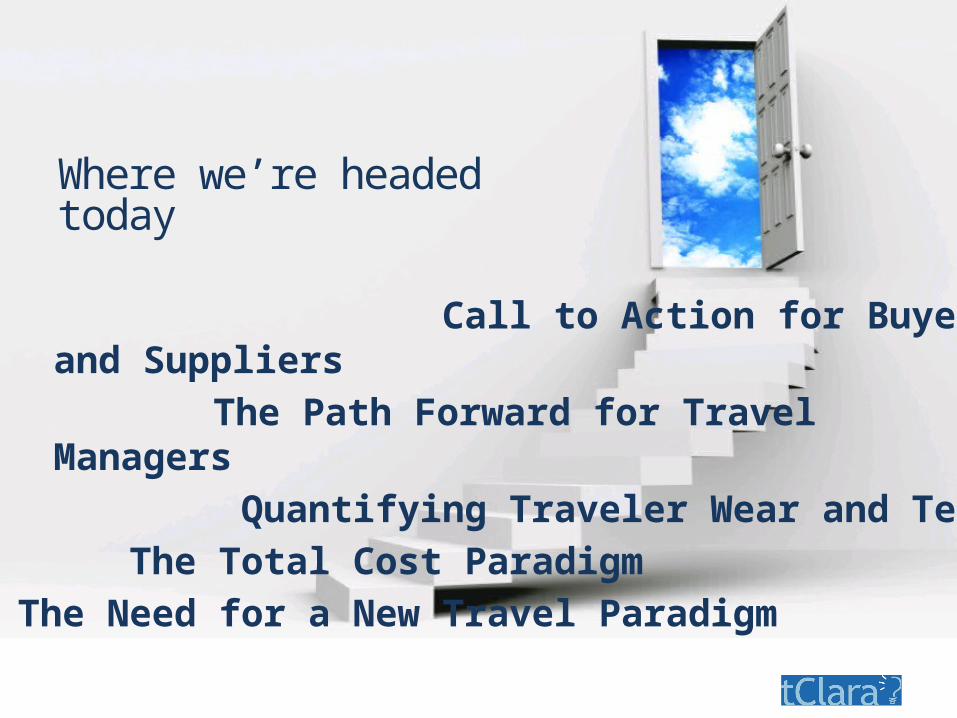
Where we’re headed today
Call to Action for Buyers and Suppliers
The Path Forward for Travel Managers
Quantifying Traveler Wear and Tear
The Total Cost Paradigm
The Need for a New Travel Paradigm
4
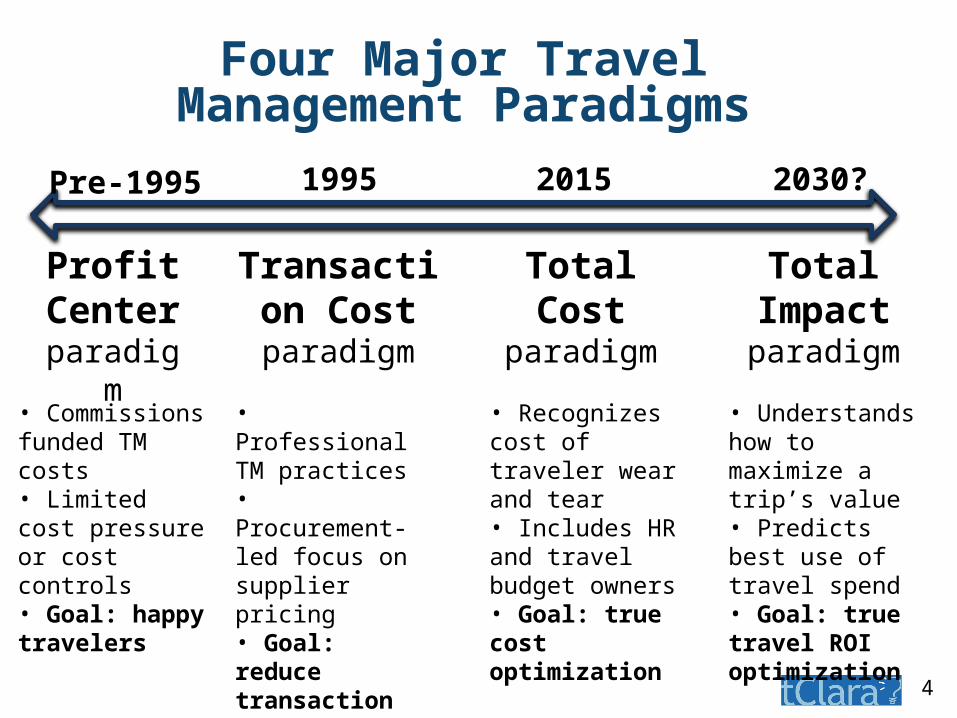
Four Major Travel Management Paradigms
Profit Center paradigm
• Commissions funded TM costs• Limited cost pressure or cost controls• Goal: happy travelers
Transaction Cost
paradigm
• Professional TM practices• Procurement-led focus on supplier pricing• Goal: reduce transaction costs
Total Cost
paradigm
• Recognizes cost of traveler wear and tear• Includes HR and travel budget owners• Goal: true cost optimization
Total Impact paradigm
• Understands how to maximize a trip’s value• Predicts best use of travel spend• Goal: true travel ROI optimization
1995 2015 2030?Pre-1995
5
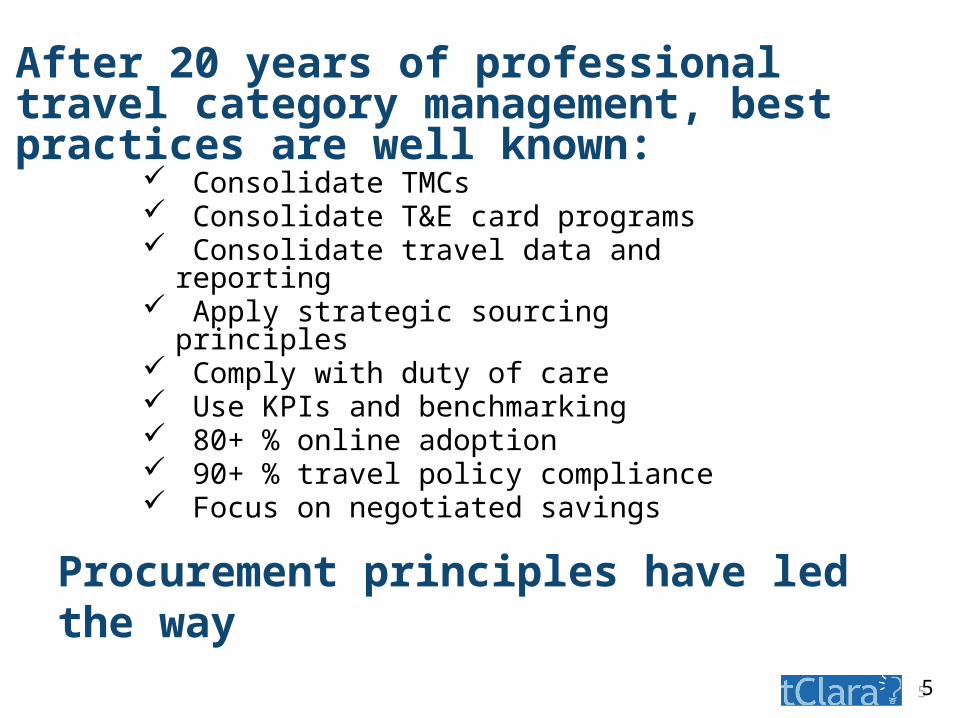
After 20 years of professional travel category management, best practices are well known:
5
Consolidate TMCs Consolidate T&E card programs Consolidate travel data and reporting Apply strategic sourcing principles Comply with duty of care Use KPIs and benchmarking 80+ % online adoption 90+ % travel policy compliance Focus on negotiated savings
Procurement principles have led the way
6
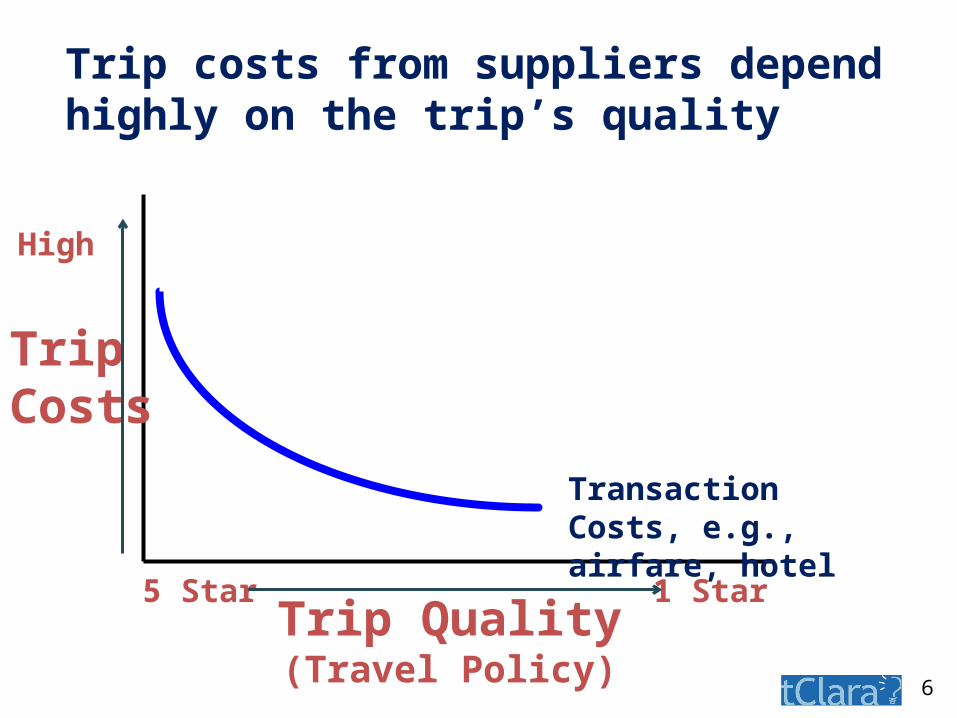
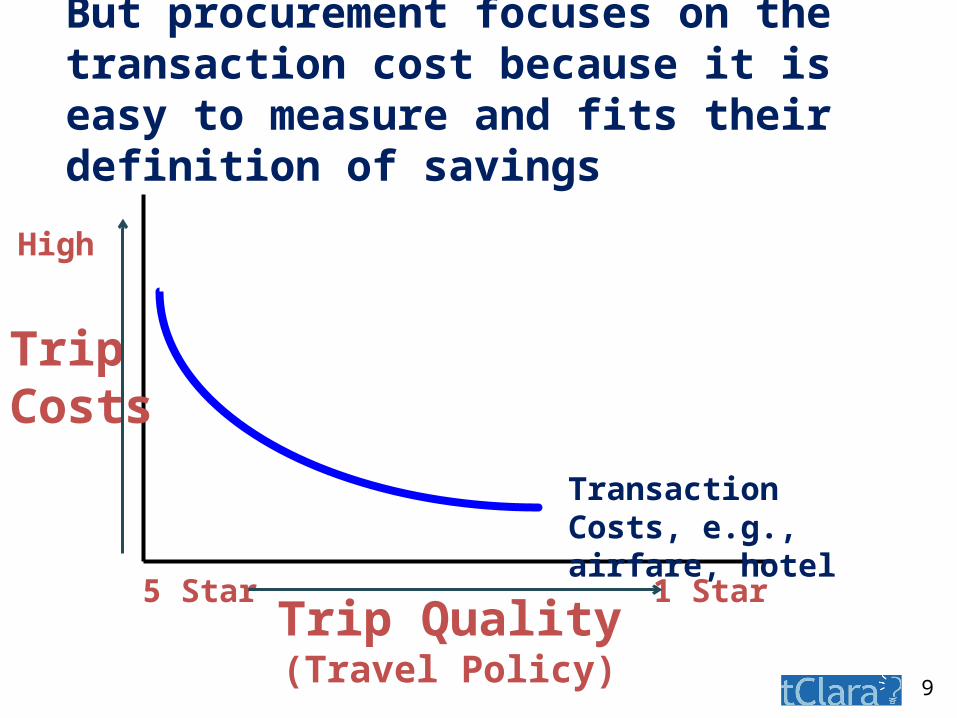
Transaction Costs, e.g., airfare, hotel
Trip Quality(Travel Policy)
5 Star 1 Star
High
Trip Costs
Trip costs from suppliers depend highly on the trip’s quality
7
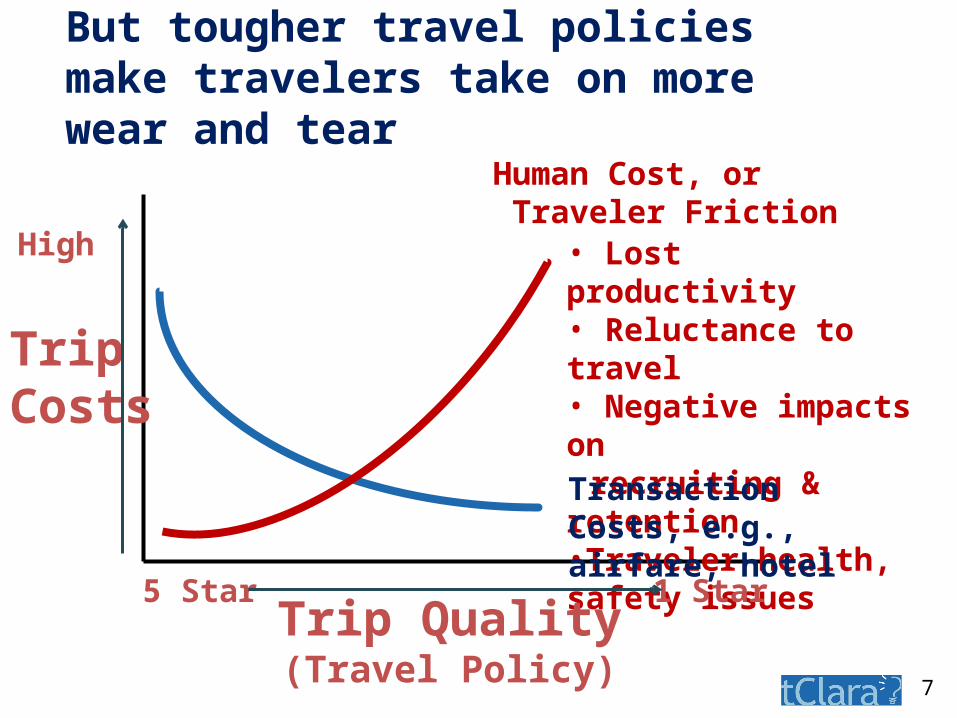
High
Trip Costs
Human Cost, or Traveler Friction• Lost productivity• Reluctance to travel• Negative impacts on
recruiting & retention•Traveler health, safety issues
But tougher travel policies make travelers take on more wear and tear
Transaction Costs, e.g., airfare, hotel
5 Star 1 StarTrip Quality(Travel Policy)
8
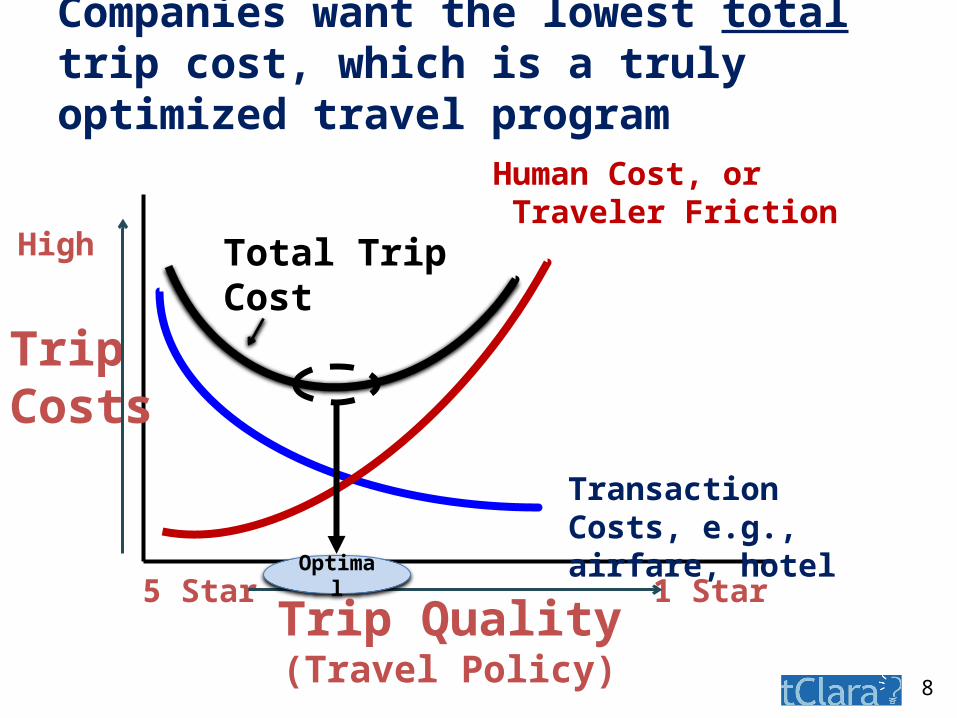
Companies want the lowest total trip cost, which is a truly optimized travel program
Total Trip Cost
5 Star 1 StarOptimal
High
Trip Costs
Human Cost, or Traveler Friction
Transaction Costs, e.g., airfare, hotel
Trip Quality(Travel Policy)
9
Transaction Costs, e.g., airfare, hotel
5 Star 1 Star
High
Trip Costs
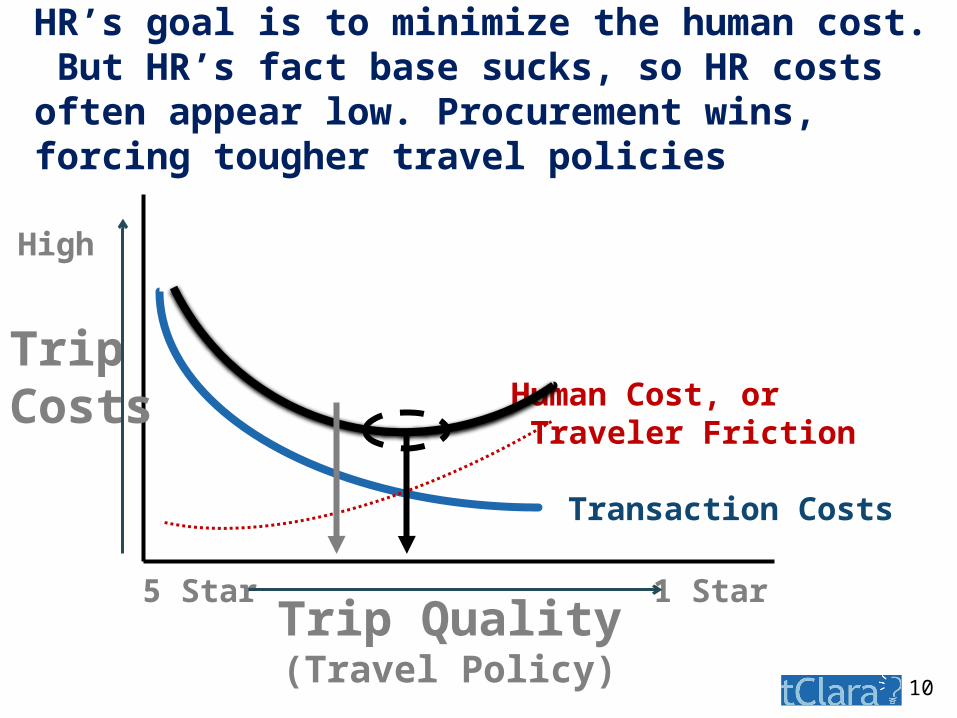
But procurement focuses on the transaction cost because it is easy to measure and fits their definition of savings
Trip Quality(Travel Policy)
10
High
Trip Costs
Transaction Costs
5 Star 1 Star
Human Cost, or Traveler Friction
HR’s goal is to minimize the human cost. But HR’s fact base sucks, so HR costs often appear low. Procurement wins, forcing tougher travel policies
Trip Quality(Travel Policy)
11
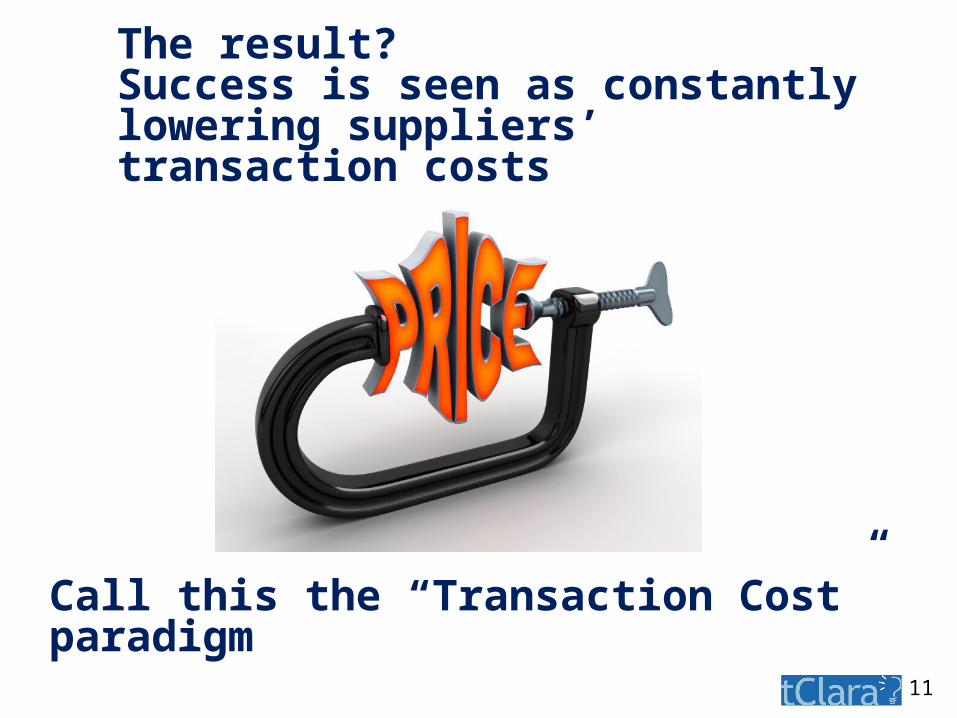
The result? Success is seen as constantly lowering suppliers’ transaction costs
Call this the “Transaction Cost” paradigm
12
The transaction cost paradigm has served the industry well, but now…
• Returns on travel management are small and diminishing – and not sustainable
• Suppliers chafe at heavy focus on price rather than value
• Transaction cost management offers no strategic value, and
• It offers travel managers a limited career path
12
The transaction cost paradigm locks travel management in a low-value future
13
The Total Cost Paradigm
14
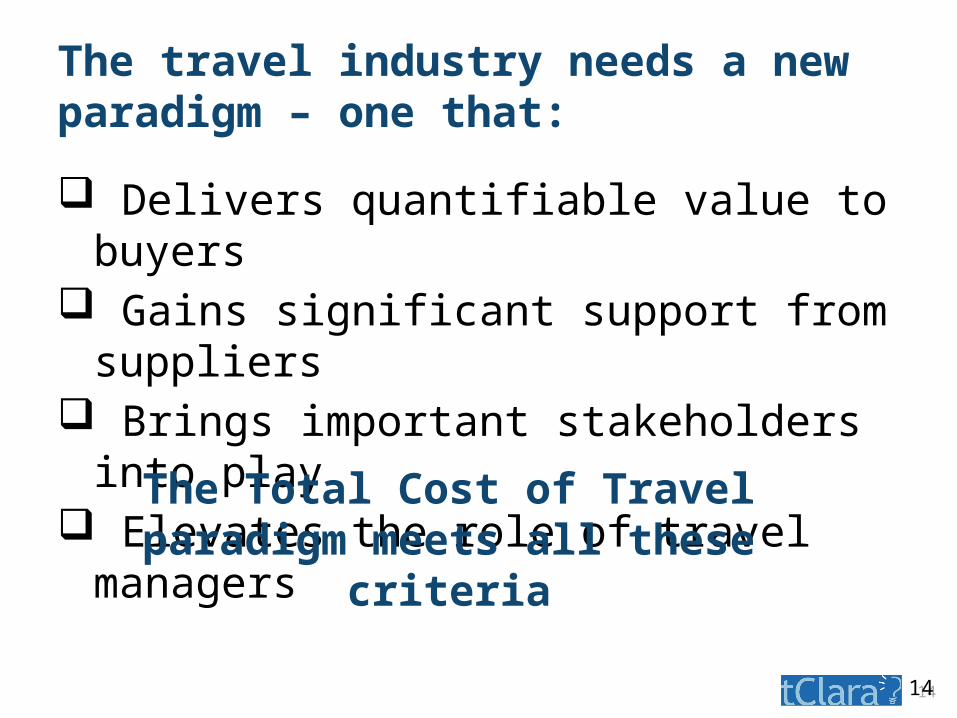
The travel industry needs a new paradigm – one that:
Delivers quantifiable value to buyers Gains significant support from suppliers Brings important stakeholders into play Elevates the role of travel managers
14
The Total Cost of Travel paradigm meets all these criteria
15
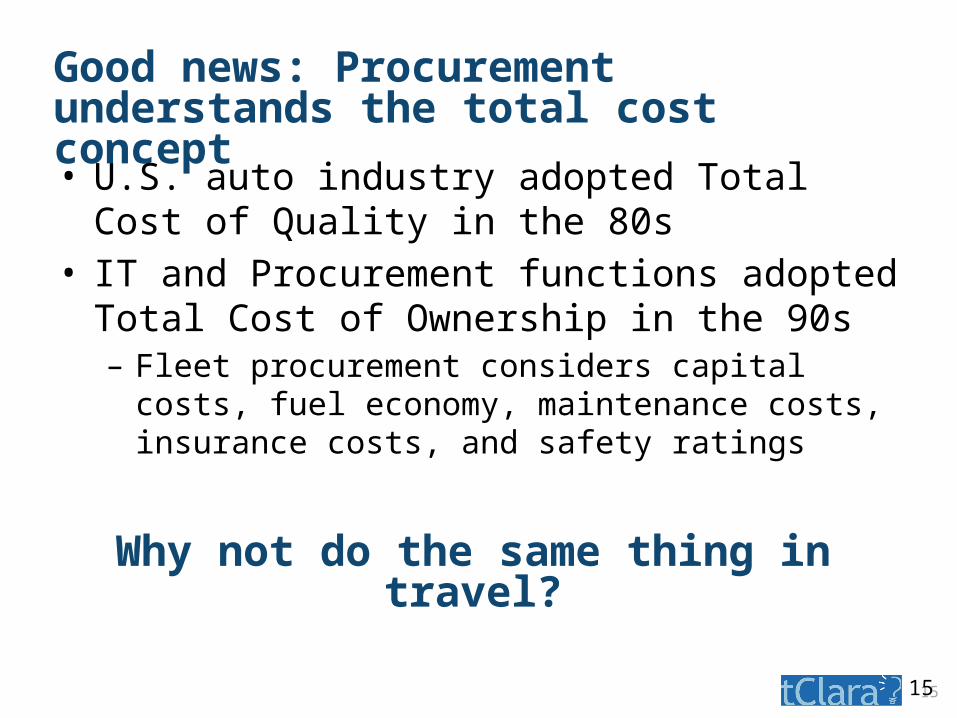
Good news: Procurement understands the total cost concept
• U.S. auto industry adopted Total Cost of Quality in the 80s
• IT and Procurement functions adopted Total Cost of Ownership in the 90s– Fleet procurement considers capital costs, fuel
economy, maintenance costs, insurance costs, and safety ratings
15
Why not do the same thing in travel?
16
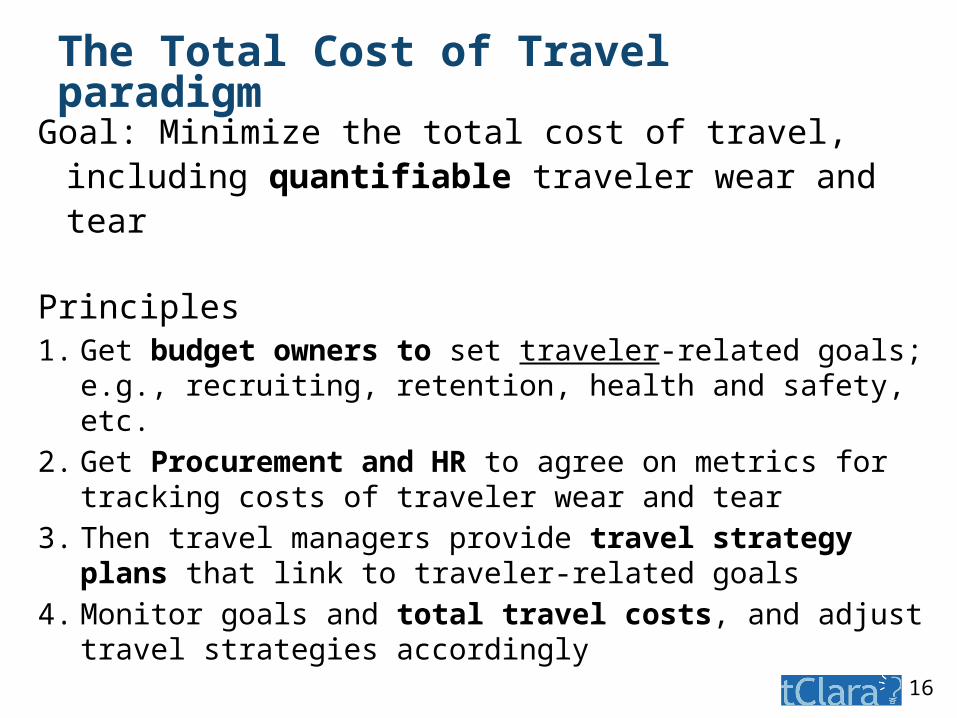
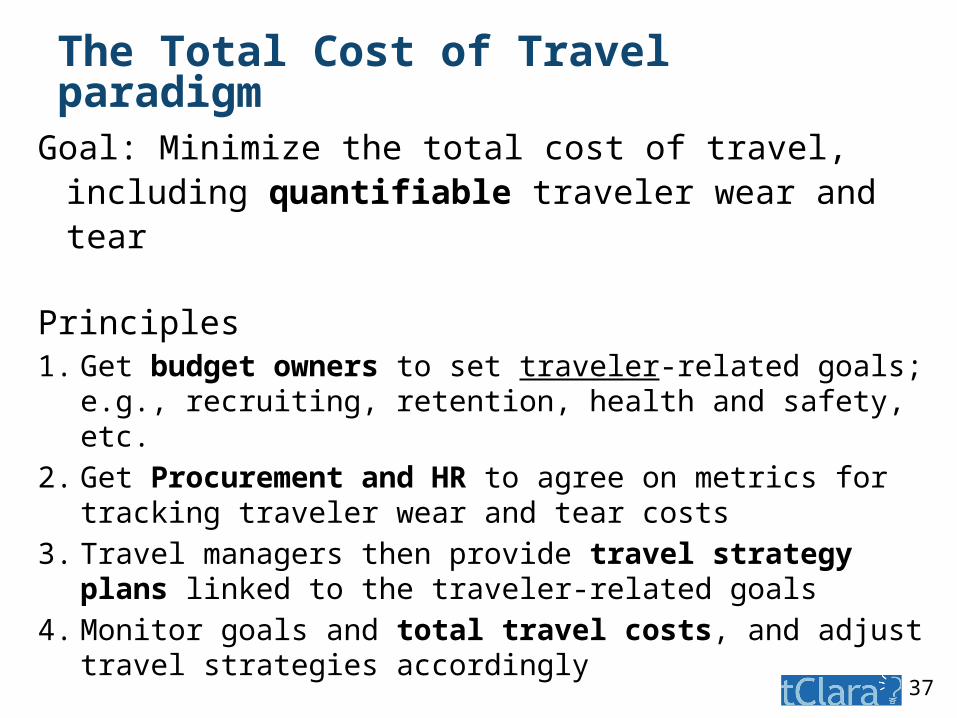
The Total Cost of Travel paradigm
Goal: Minimize the total cost of travel, including quantifiable traveler wear and tear
Principles1. Get budget owners to set traveler-related goals;
e.g., recruiting, retention, health and safety, etc.
2. Get Procurement and HR to agree on metrics for tracking costs of traveler wear and tear
3. Then travel managers provide travel strategy plans that link to traveler-related goals
4. Monitor goals and total travel costs, and adjust travel strategies accordingly
17
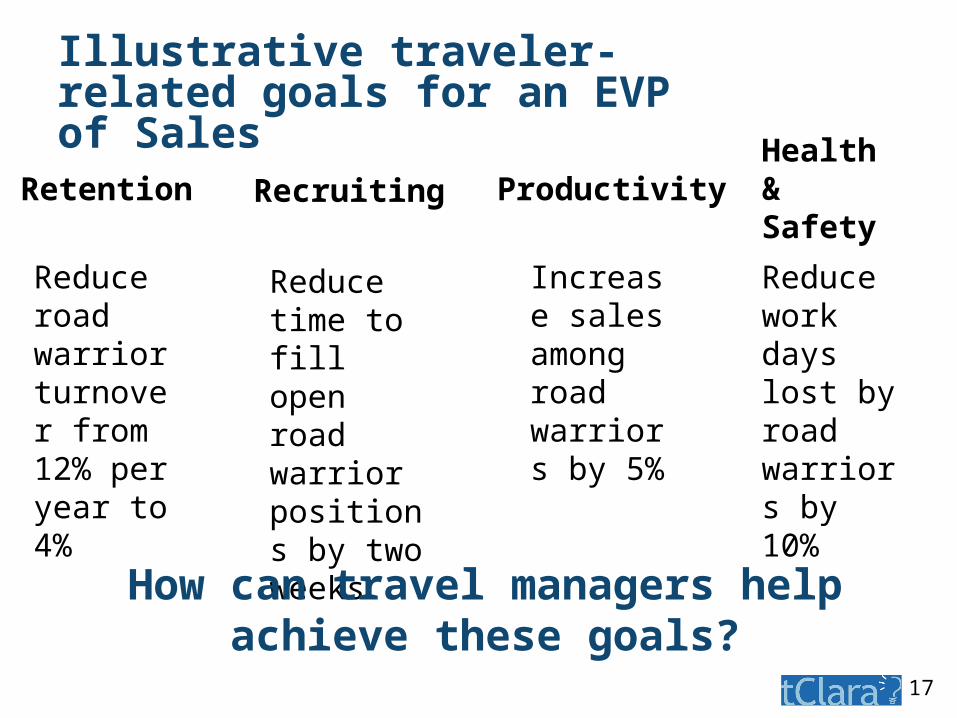
Illustrative traveler-related goals for an EVP of Sales
ProductivityHealth & SafetyRecruiting
Reduce time to fill open road warrior positions by two weeks
Retention
Reduce road warrior turnover from 12% per year to 4%
Increase sales among road warriors by 5%
Reduce work days lost by road warriors by 10%
How can travel managers help achieve these goals?
18
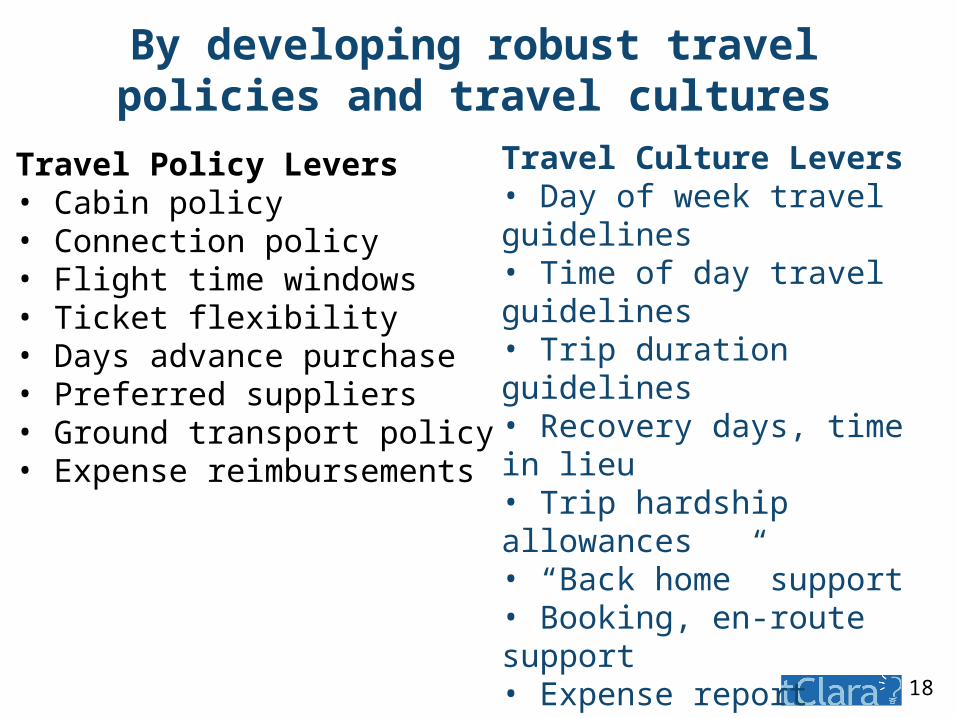
By developing robust travel policies and travel cultures
Travel Policy Levers• Cabin policy• Connection policy• Flight time windows• Ticket flexibility• Days advance purchase• Preferred suppliers• Ground transport policy• Expense reimbursements
Travel Culture Levers• Day of week travel guidelines• Time of day travel guidelines• Trip duration guidelines• Recovery days, time in lieu• Trip hardship allowances• “Back home” support• Booking, en-route support• Expense report support• Mobile app support• Traveler recognition• Job modification, relocation
19
Early Results of Quantifying Traveler
Wear and Tear
2020
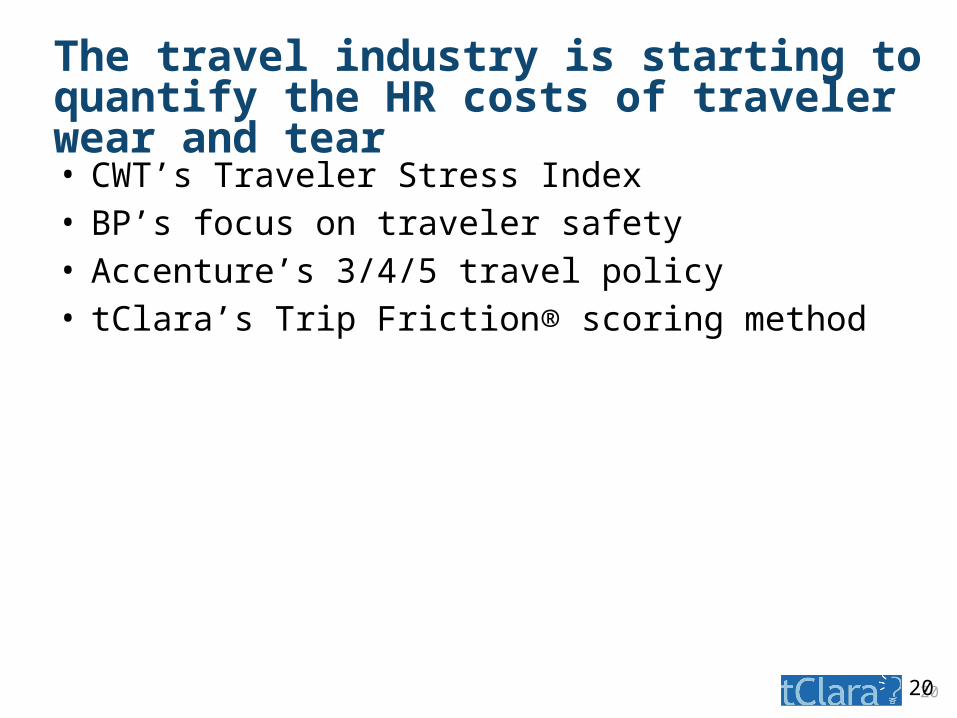
The travel industry is starting to quantify the HR costs of traveler wear and tear
• CWT’s Traveler Stress Index• BP’s focus on traveler safety• Accenture’s 3/4/5 travel policy• tClara’s Trip Friction® scoring method
21
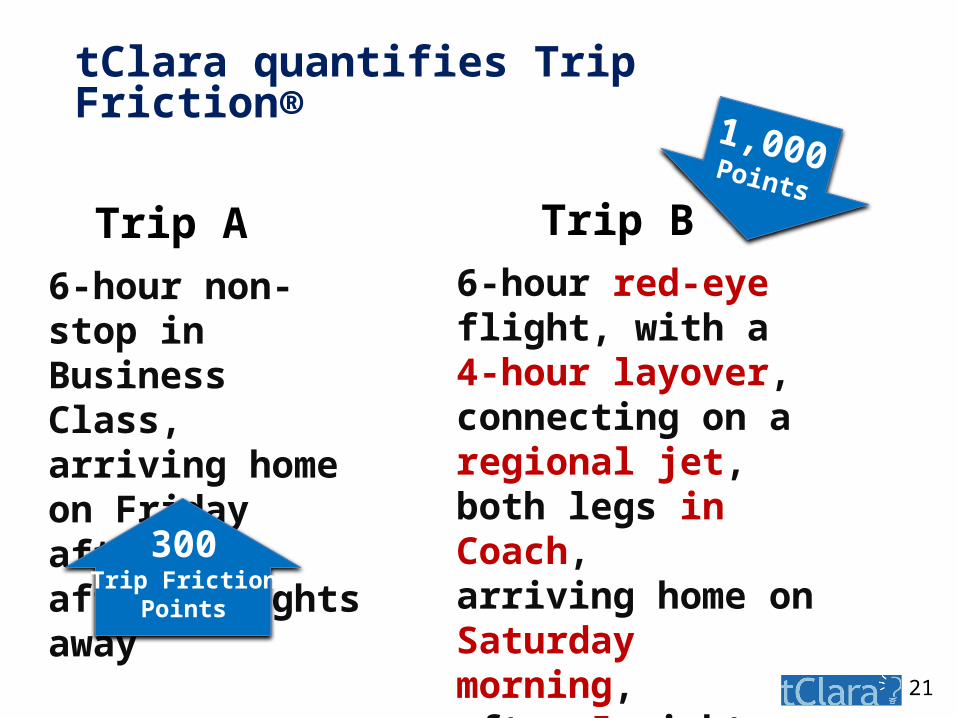
tClara quantifies Trip Friction®
6-hour red-eye flight, with a 4-hour layover, connecting on a regional jet,both legs in Coach,arriving home on Saturday morning,after 5 nights away
Trip B
6-hour non-stop in Business Class,arriving home on Friday afternoon, after 2 nights away
Trip A
300Trip Friction
Points
1,000Points
22
Traveler wear and tear is highly concentrated among the top 5% of all travelers
22
23
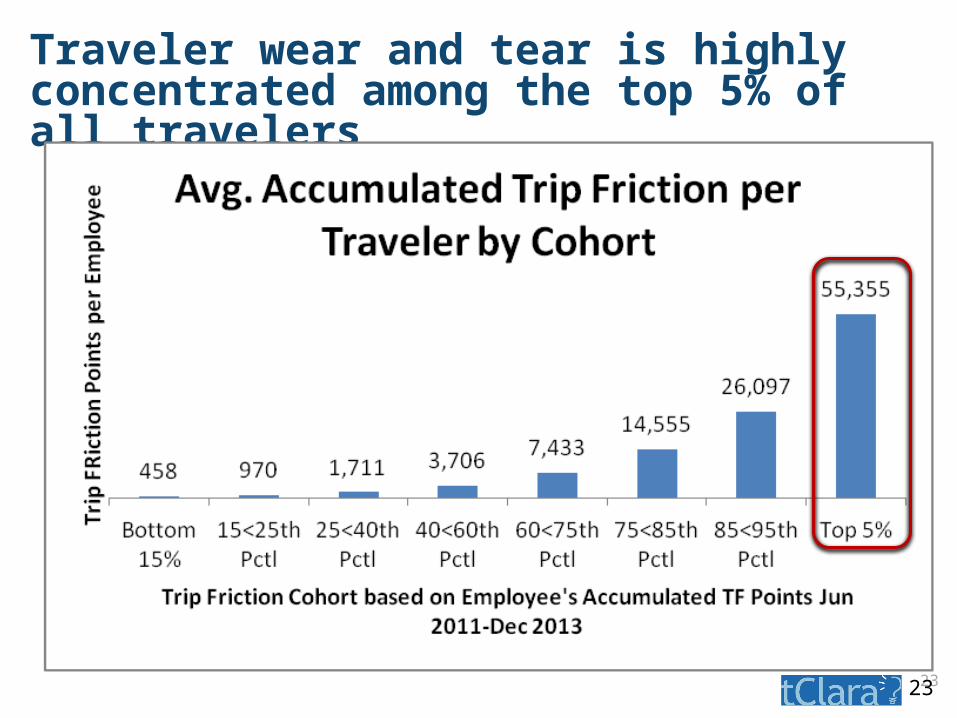
Traveler wear and tear is highly concentrated among the top 5% of all travelers
23
24
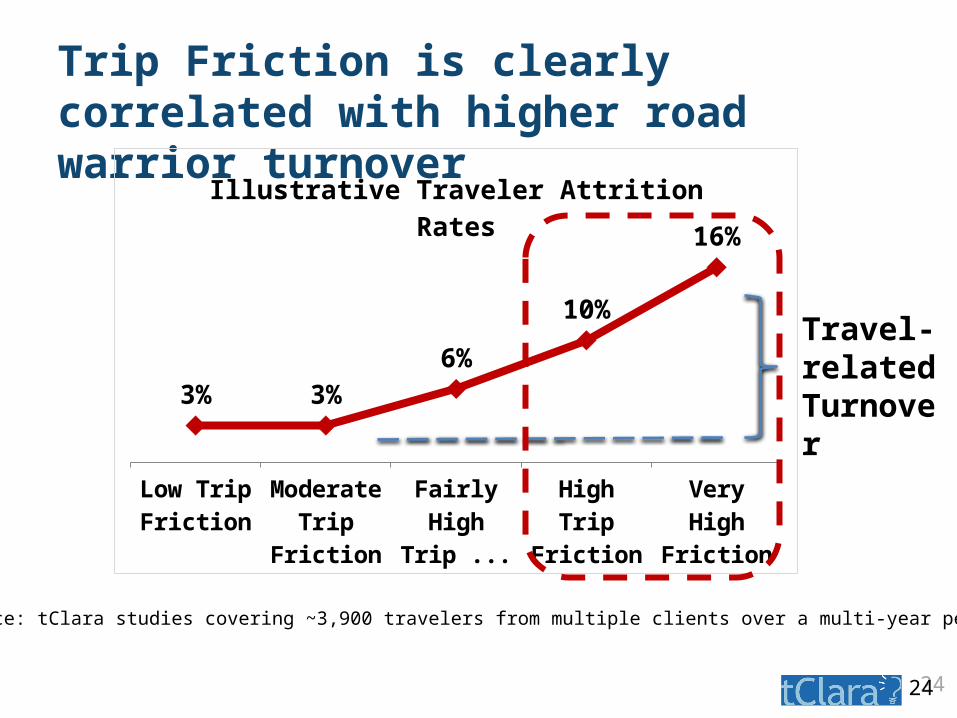
Trip Friction is clearly correlated with higher road warrior turnover
24
3% 3%6%
10%
16%
Illustrative Traveler Attrition Rates
Source: tClara studies covering ~3,900 travelers from multiple clients over a multi-year period
Travel-related Turnover
25
The Path Forward for Travel Managers
26
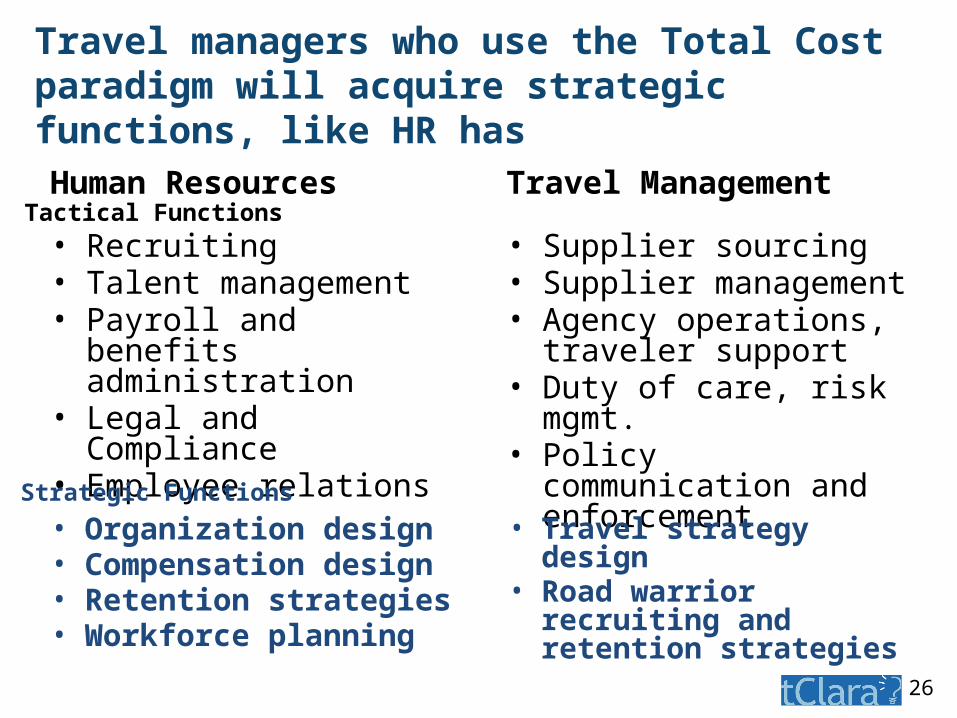
Travel managers who use the Total Cost paradigm will acquire strategic functions, like HR has
Travel Management
• Supplier sourcing• Supplier management• Agency operations,
traveler support• Duty of care, risk mgmt.• Policy communication
and enforcement
Human Resources
• Recruiting• Talent management• Payroll and benefits
administration• Legal and Compliance• Employee relations
• Organization design• Compensation design• Retention strategies• Workforce planning
• Travel strategy design• Road warrior recruiting
and retention strategies
Strategic Functions
Tactical Functions
27
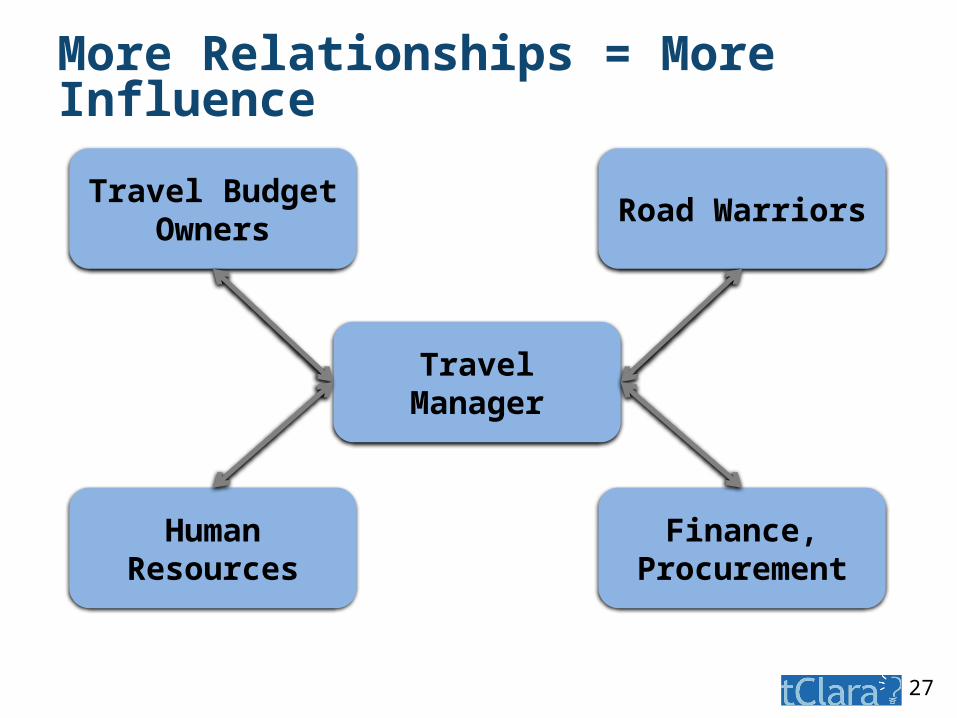
More Relationships = More Influence
Travel Manager
Road Warriors
Finance, Procurement
Travel Budget Owners
Human Resources
28
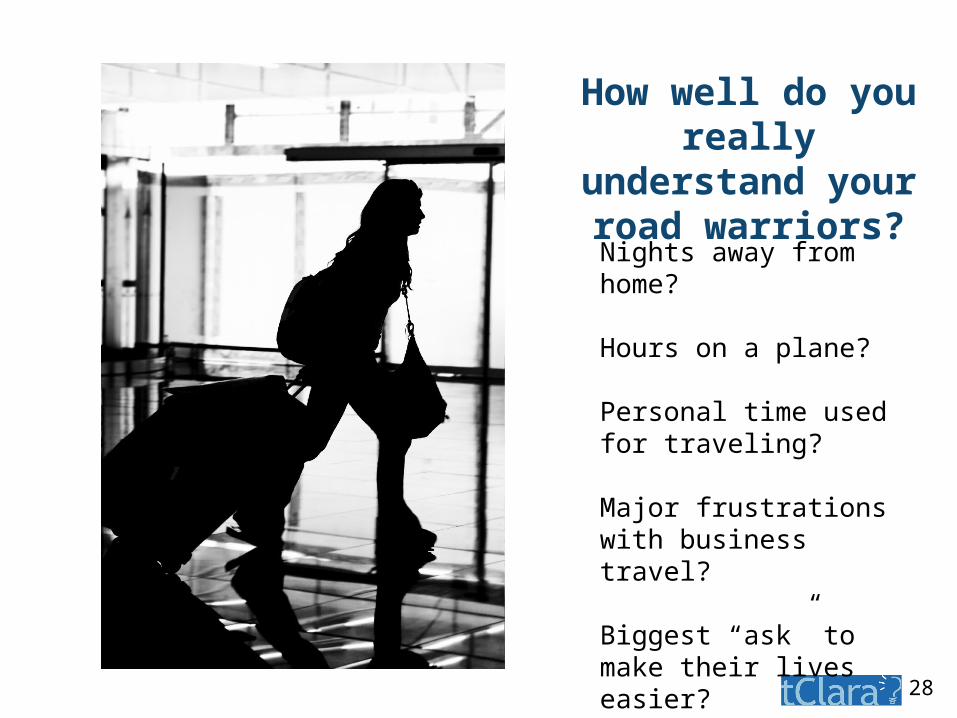
How well do you really understand
your road warriors?
Nights away from home?
Hours on a plane?
Personal time used for traveling?
Major frustrations with business travel?
Biggest “ask” to make their lives easier?
29
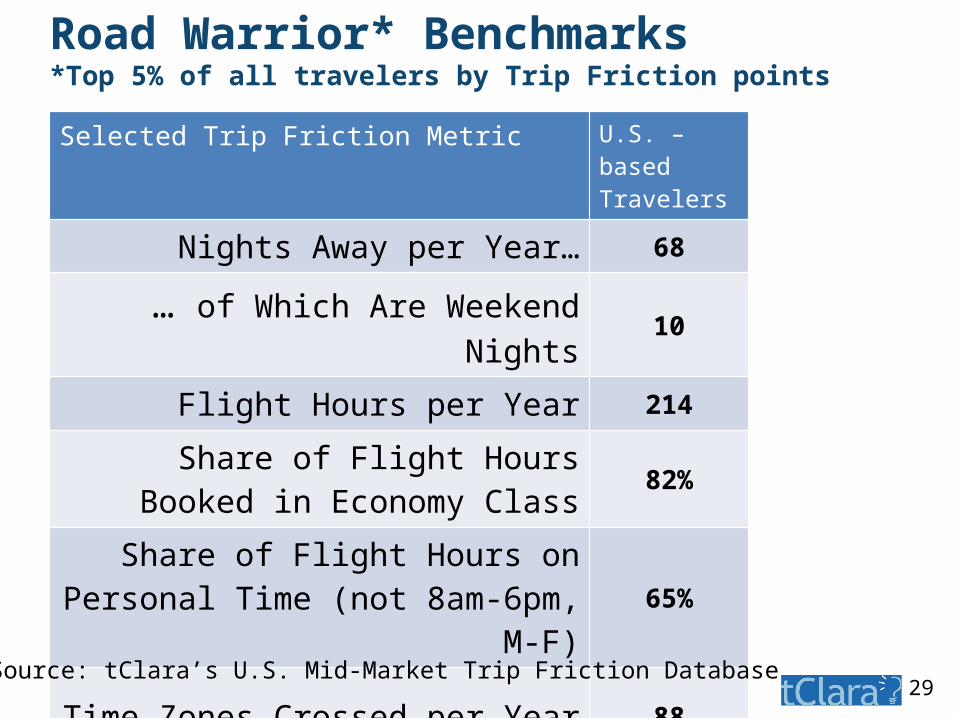
Road Warrior* Benchmarks*Top 5% of all travelers by Trip Friction points
Selected Trip Friction Metric U.S. –based Travelers
Nights Away per Year… 68
… of Which Are Weekend Nights 10
Flight Hours per Year 214
Share of Flight Hours Booked in Economy Class 82%
Share of Flight Hours on Personal Time (not 8am-6pm, M-F) 65%
Time Zones Crossed per Year 88
Source: tClara’s U.S. Mid-Market Trip Friction Database
30
Developing a Travel Strategy
Plan
31
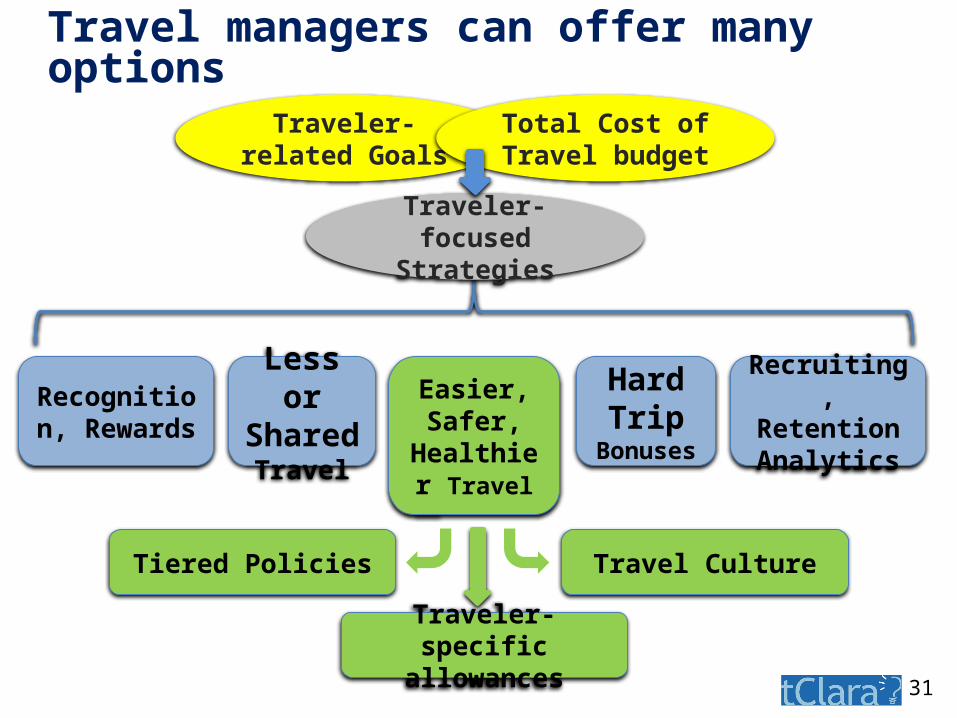
Less or Shared
Travel
Easier, Safer,
Healthier Travel
Hard Trip
Bonuses
Recognition, Rewards
Recruiting, Retention Analytics
Tiered Policies Travel Culture
Travel managers can offer many options
Traveler-specific allowances
Traveler-related Goals
Total Cost of Travel budget
Traveler-focused Strategies
32
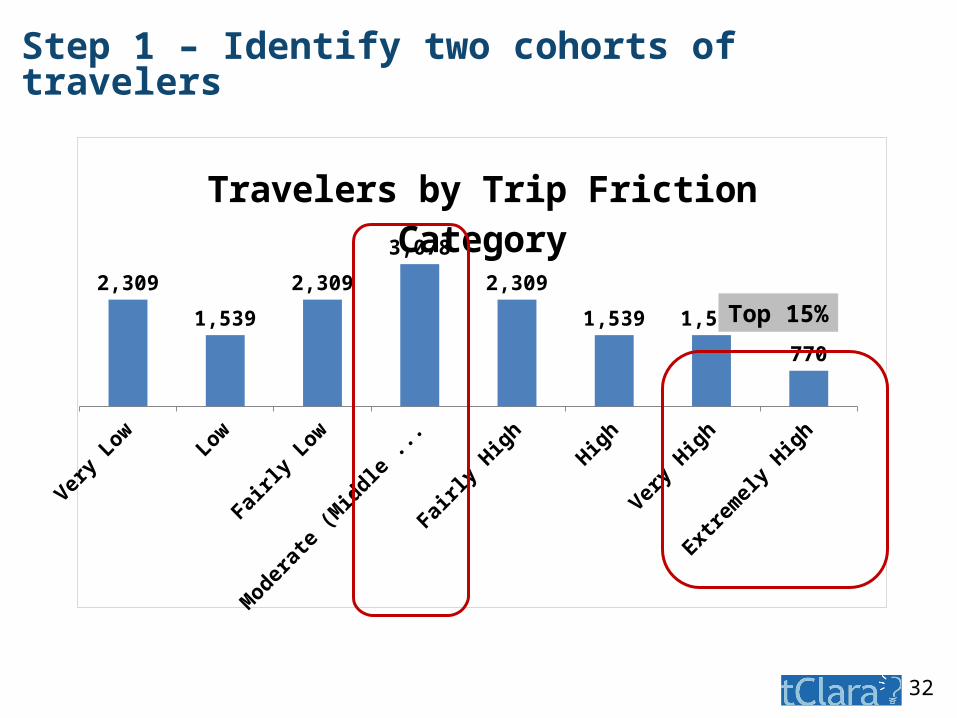
Step 1 – Identify two cohorts of travelers
2,309
1,539
2,309
3,078
2,309
1,539 1,539
770
Travelers by Trip Friction Category
Top 15%
33
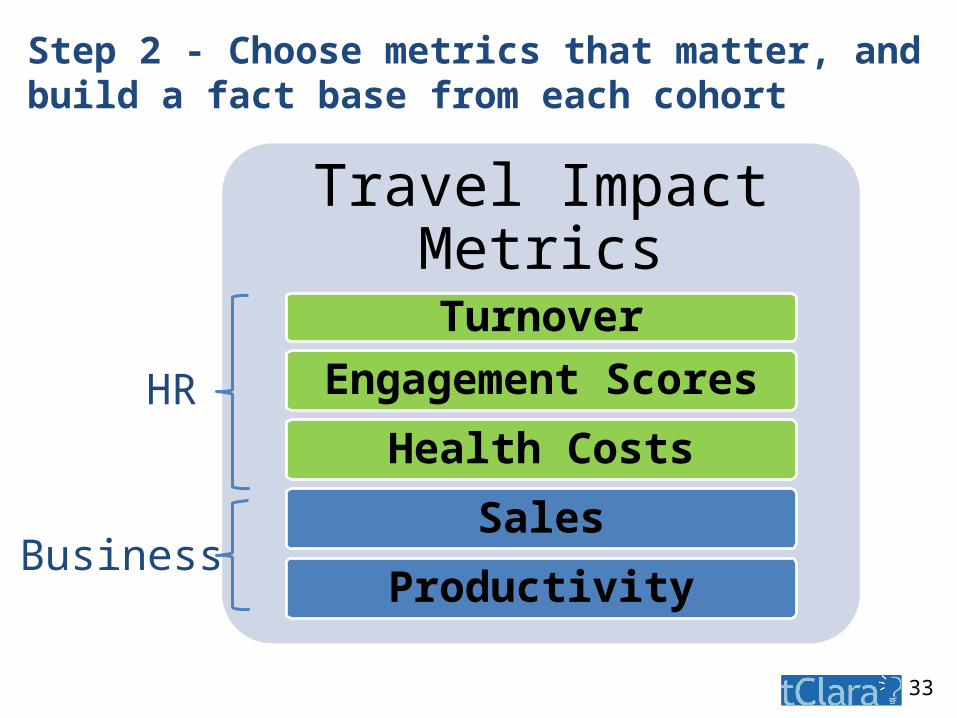
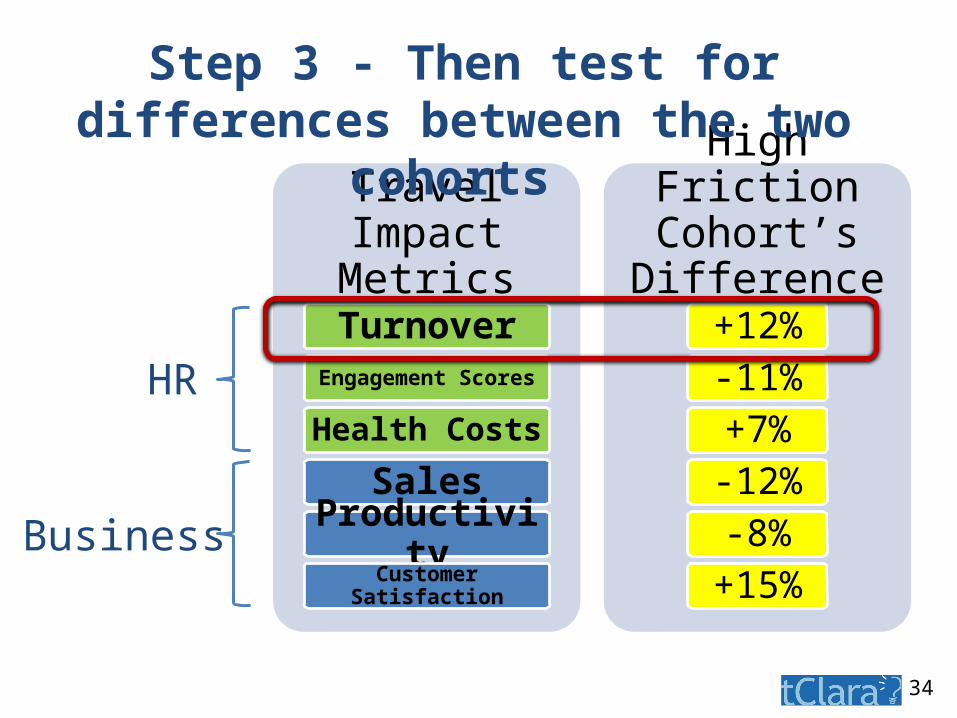
Travel Impact Metrics
Turnover
Engagement Scores
Health Costs
Sales
Productivity
HR
Business
Step 2 - Choose metrics that matter, and build a fact base from each cohort
34
Travel Impact Metrics
TurnoverEngagement Scores
Health Costs
SalesProductivityCustomer Satisfaction
High Friction Cohort’s
Differences+12%-11%+7%-12%-8%
+15%
Step 3 - Then test for differences between the two cohorts
HR
Business
35
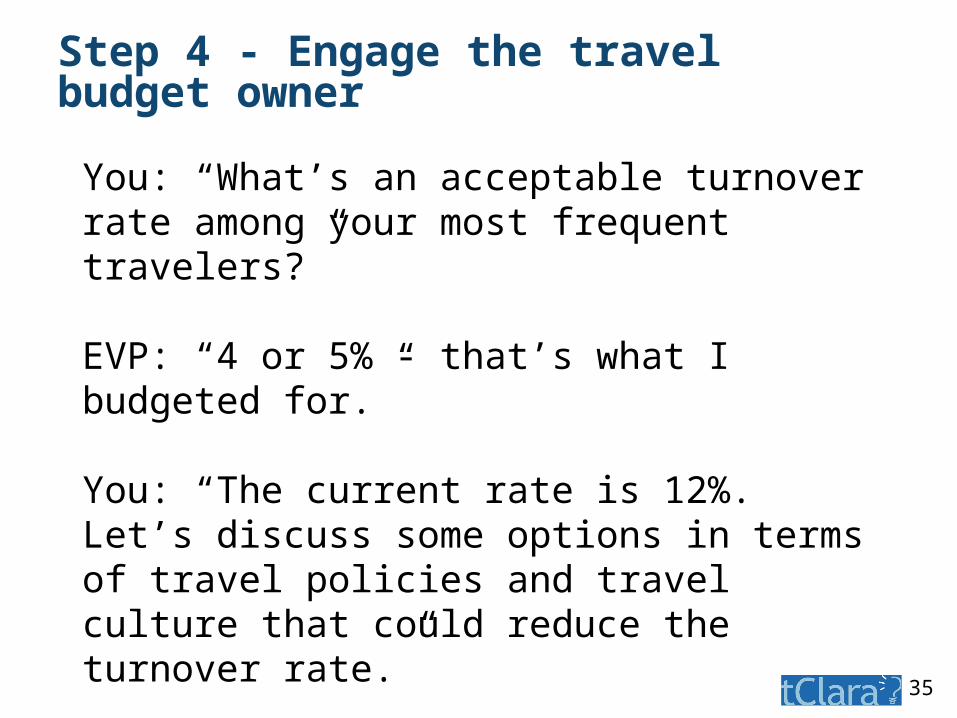
Step 4 - Engage the travel budget owner
You: “What’s an acceptable turnover rate among your most frequent travelers?”
EVP: “4 or 5% - that’s what I budgeted for.”
You: “The current rate is 12%. Let’s discuss some options in terms of travel policies and travel culture that could reduce the turnover rate.”
36
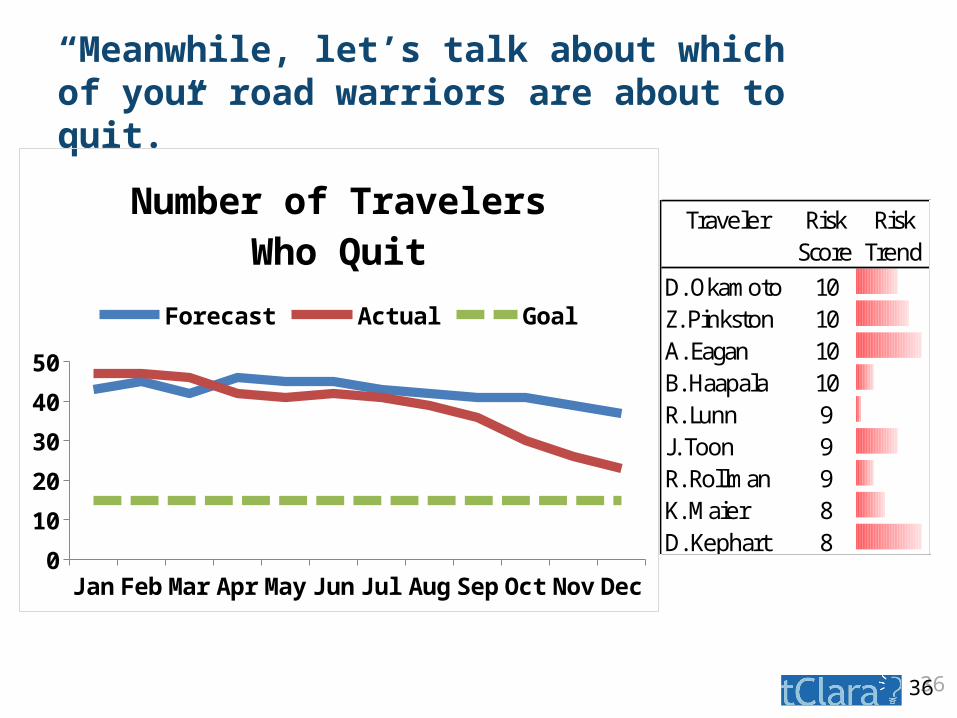
“Meanwhile, let’s talk about which of your road warriors are about to quit.”
36
Jan Feb Mar Apr May Jun Jul AugSep Oct Nov Dec0
10
20
30
40
50
Number of Travelers Who Quit
Forecast Actual Goal
Traveler Risk Score
Risk Trend
D. Okamoto 10Z. Pinkston 10A. Eagan 10B. Haapala 10R. Lunn 9J. Toon 9R. Rollman 9K. Maier 8D. Kephart 8
37
The Total Cost of Travel paradigm
Goal: Minimize the total cost of travel, including quantifiable traveler wear and tear
Principles1. Get budget owners to set traveler-related goals;
e.g., recruiting, retention, health and safety, etc.
2. Get Procurement and HR to agree on metrics for tracking traveler wear and tear costs
3. Travel managers then provide travel strategy plans linked to the traveler-related goals
4. Monitor goals and total travel costs, and adjust travel strategies accordingly
38
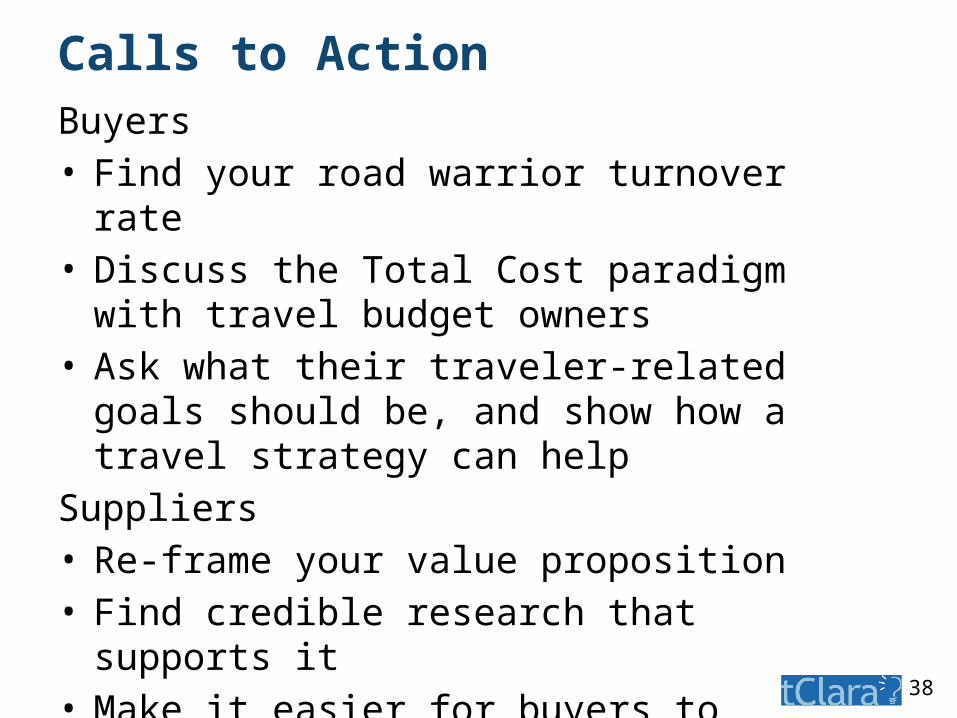
Calls to ActionBuyers• Find your road warrior turnover rate• Discuss the Total Cost paradigm with travel
budget owners• Ask what their traveler-related goals should
be, and show how a travel strategy can help
Suppliers• Re-frame your value proposition• Find credible research that supports it• Make it easier for buyers to quantify your
true value

Contact:[email protected]+1 440.248.4111
Glad to connect on LinkedIn
Travel Data Made BrighterA Gillespie+Diio Venture
Thank you!