Topological Sound Propagation with Reverberation Graphs · Topological Sound Propagation with...
11
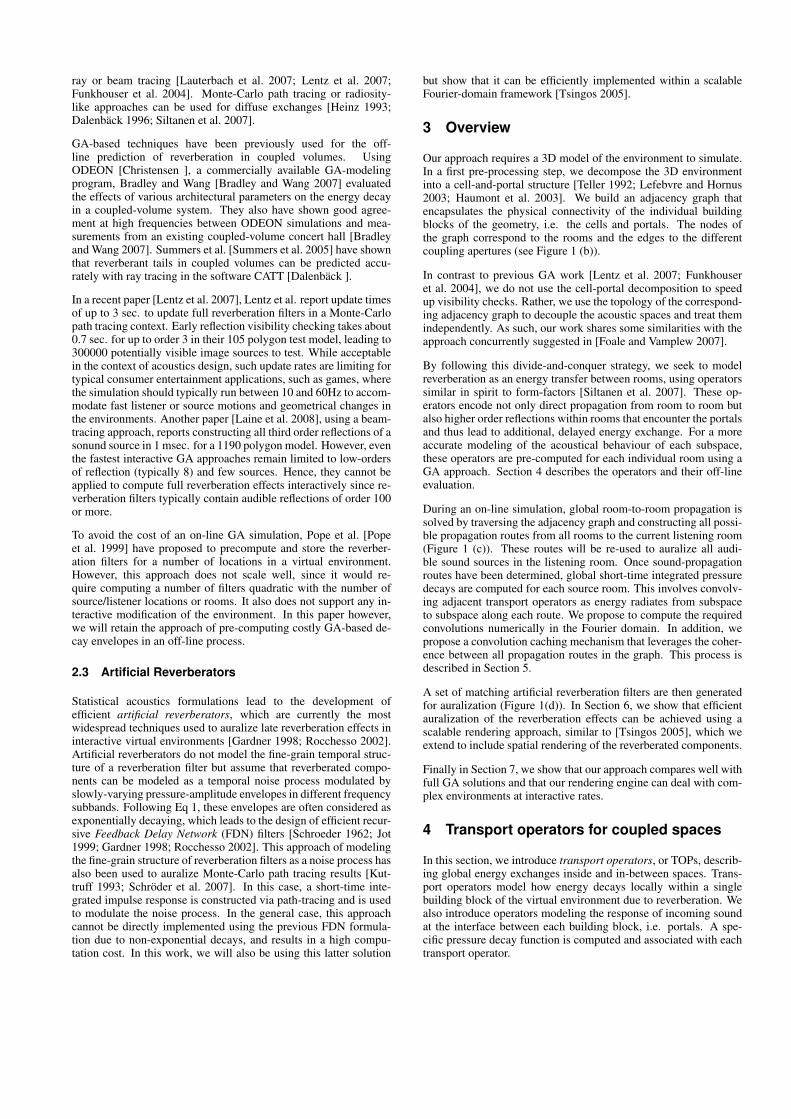
Topological Sound Propagation with Reverberation Graphs Efstathios Stavrakis * REVES-INRIA Nicolas Tsingos † REVES-INRIA Paul Calamia ‡ Rensselaer Polytechnic Institute 1 2 3 4 5 6 7 8 9 10 11 12 13 14 listener source cell portal 0 0.0002 0.0004 0.0006 0.0008 0.001 0.0012 0.0014 0.0016 0 0.5 1 1.5 2 * * * * * (a) (b) (d) (c) time (s.) Sound pressure decay time (s.) frequency (Hz) 0 5 100 1000 10000 Figure 1: (a) Our approach uses a 3D scene, decomposed into cells and portals, to compute reverberation effects interactively. (b) We estimate global pressure decays along possible sound propagation routes in the cell adjacency graph describing the 3D geometry. (c) The pressure decay for a route (highlighted in red in (b)) is obtained by convolving room-to-room transport operators computed off-line. (d) Our graph-based reverberation engine has been integrated into a 3D game with scalable reverberation processing and supports up to 30 sources interactively. Inset shows the spectrogram of a reconstructed reverberation filter. Abstract Reverberation graphs is a novel approach to estimate global sound- pressure decay and auralize corresponding reverberation effects in interactive virtual environments. We use a 3D model to repre- sent the geometry of the environment explicitly, and we subdivide it into a series of coupled spaces connected by portals. Off-line geometrical-acoustics techniques are used to precompute transport operators, which encode pressure decay characteristics within each space and between coupling interfaces. At run-time, during an interactive simulation, we traverse the adja- cency graph corresponding to the spatial subdivision of the environ- ment. We combine transport operators along different sound propa- gation routes to estimate the pressure decay envelopes from sources to the listener. Our approach compares well with off-line geomet- rical techniques, but computes reverberation decay envelopes at in- teractive rates, ranging from 12 to 100 Hz. We propose a scalable artificial reverberator that uses these decay envelopes to auralize reverberation effects, including room cou- pling. Our complete system can render as many as 30 simultaneous sources in large dynamic virtual environments. Keywords: Spatial audio rendering, reverberation, geometrical acoustics, statistical acoustics * [email protected] † [email protected] ‡ Also with the Department of Computer Science, Princeton University. [email protected] 1 Introduction Modeling of sound propagation is very important for virtual acous- tics and virtual reality applications. In particular, indoor reverber- ation effects due to sound scattering off wall surfaces carry major cues related to the size of the environment and distance to sound sources [Begault 1994]. Therefore, reverberation helps users to es- tablish a better sense of presence in virtual environments and thus is arguably one of the most important audio effects to simulate. A number of geometrical approaches have been presented to model early specular reflections (and possibly edge diffraction) interac- tively [Lauterbach et al. 2007; Lentz et al. 2007; Funkhouser et al. 2004]. Such approaches can handle complex geometry but are too computationally intensive to be applicable to interactive reverbera- tion effects. Traditionally, interactive reverberation effects in single rooms are implemented by estimating energy decay rates and deriv- ing artificial reverberation filters [Jot 1999]. Parameters of the de- cay envelope can be directly manipulated by the sound designer to achieve the desired effect without requiring any geometrical mod- eling. Alternatively, the energy decay rates can also be determined from few geometrical parameters using well-known statistical mod- els, such as the Sabine and Eyring formulas [Kuttruff 1973]. Such approaches are widely used in current audio production environ- ments and consumer audio hardware [EAX 2004], but they cannot model the global propagation of sound throughout a complex multi- room environment. Consider the typical example of a game-like environment contain- ing several connected rooms such as in Figure 1 (a). The late en- ergy decay in the listener’s room will be governed by the trans-
Transcript of Topological Sound Propagation with Reverberation Graphs · Topological Sound Propagation with...

Topological Sound Propagation with Reverberation Graphs
Efstathios Stavrakis∗
REVES-INRIA
Nicolas Tsingos†
REVES-INRIA
Paul Calamia‡
Rensselaer Polytechnic Institute
1
23
45
6
7 8
910
11
12
13 14
listener
sourcecell
portal
0
0.0002
0.0004
0.0006
0.0008
0.001
0.0012
0.0014
0.0016
0 0.5 1 1.5 2
* * * * *
(a) (b) (d)(c)time (s.)
Sound pressure decay
time (s.)
frequency (H
z)0 5
100
1000
10000
Figure 1: (a) Our approach uses a 3D scene, decomposed into cells and portals, to compute reverberation effects interactively. (b) Weestimate global pressure decays along possible sound propagation routes in the cell adjacency graph describing the 3D geometry. (c) Thepressure decay for a route (highlighted in red in (b)) is obtained by convolving room-to-room transport operators computed off-line. (d) Ourgraph-based reverberation engine has been integrated into a 3D game with scalable reverberation processing and supports up to 30 sourcesinteractively. Inset shows the spectrogram of a reconstructed reverberation filter.
Abstract
Reverberation graphs is a novel approach to estimate global sound-pressure decay and auralize corresponding reverberation effects ininteractive virtual environments. We use a 3D model to repre-sent the geometry of the environment explicitly, and we subdivideit into a series of coupled spaces connected by portals. Off-linegeometrical-acoustics techniques are used to precompute transportoperators, which encode pressure decay characteristics within eachspace and between coupling interfaces.
At run-time, during an interactive simulation, we traverse the adja-cency graph corresponding to the spatial subdivision of the environ-ment. We combine transport operators along different sound propa-gation routes to estimate the pressure decay envelopes from sourcesto the listener. Our approach compares well with off-line geomet-rical techniques, but computes reverberation decay envelopes at in-teractive rates, ranging from 12 to 100 Hz.
We propose a scalable artificial reverberator that uses these decayenvelopes to auralize reverberation effects, including room cou-pling. Our complete system can render as many as 30 simultaneoussources in large dynamic virtual environments.
Keywords: Spatial audio rendering, reverberation, geometricalacoustics, statistical acoustics
∗[email protected]†[email protected]‡Also with the Department of Computer Science, Princeton University.
1 Introduction
Modeling of sound propagation is very important for virtual acous-tics and virtual reality applications. In particular, indoor reverber-ation effects due to sound scattering off wall surfaces carry majorcues related to the size of the environment and distance to soundsources [Begault 1994]. Therefore, reverberation helps users to es-tablish a better sense of presence in virtual environments and thusis arguably one of the most important audio effects to simulate.
A number of geometrical approaches have been presented to modelearly specular reflections (and possibly edge diffraction) interac-tively [Lauterbach et al. 2007; Lentz et al. 2007; Funkhouser et al.2004]. Such approaches can handle complex geometry but are toocomputationally intensive to be applicable to interactive reverbera-tion effects. Traditionally, interactive reverberation effects in singlerooms are implemented by estimating energy decay rates and deriv-ing artificial reverberation filters [Jot 1999]. Parameters of the de-cay envelope can be directly manipulated by the sound designer toachieve the desired effect without requiring any geometrical mod-eling. Alternatively, the energy decay rates can also be determinedfrom few geometrical parameters using well-known statistical mod-els, such as the Sabine and Eyring formulas [Kuttruff 1973]. Suchapproaches are widely used in current audio production environ-ments and consumer audio hardware [EAX 2004], but they cannotmodel the global propagation of sound throughout a complex multi-room environment.
Consider the typical example of a game-like environment contain-ing several connected rooms such as in Figure 1 (a). The late en-ergy decay in the listener’s room will be governed by the trans-

mission of energy from the neighboring rooms through the opendoors. The corresponding indirect energy contributions will alsohave strong directional components that need to be rendered cor-rectly from the location of the coupling apertures. In the contextof architectural acoustics, coupled-room configurations have beenincreasingly studied for the design of modern concert halls. Whilea preference for so-called “double-sloped” decays has not been es-tablished [Bradley and Wang 2005; Ermann 2007], they have beenshown to be clearly audible under a variety of experimental condi-tions [Picard 2003; Knight 2003; Ermann 2007] and thus are nec-essary to replicate for perceptually accurate reverberation effects.
In this paper, we concentrate on interactive, yet physically-based,modeling of reverberation effects in indoor architectural environ-ments containing arbitrarily coupled rooms. Our approach com-bines characteristics of geometrical and statistical acoustics toachieve realistic results at interactive rates.
Starting with a 3D input model, an adjacency graph that describesthe spatial coupling of acoustic spaces is constructed. Using a di-vide and conquer strategy, energy decay envelopes are then deter-mined off-line for each space using path tracing simulations. Thisdecouples complex geometrical calculations from global propaga-tion, which is performed on-line by exploring all energy propaga-tion routes along the spatial adjacency graph.
Similar to statistical acoustics, we assume that energy is scatteredfrom space to space through the coupling apertures, which act asdiffuse emitters [Summers et al. 2004]. We also assume that thefine-grain temporal structure of reverberation filters can be modeledas statistical noise. From the global propagation routes physically-based artificial reverberation filters can be efficiently constructedand used for real-time spatial audio rendering.
Our contributions are:
• The definition of transport operators for general acousticallycoupled rooms.
• An efficient global energy propagation algorithm based on thetopology of the room adjacency graph.
• An efficient filter construction algorithm leveraging the coher-ence of sound propagation routes in the graph.
• A scalable interactive system for auralizing physically-basedlate reverberation effects for environments with many sources.
• An initial validation against alternative geometrical acousticssolutions.
Our complete pipeline allows for rendering up to 30 sources in com-plex dynamic environments.
2 Related Work
A large body of work has been devoted to simulating sound propa-gation effects in virtual environments. In the following section wereview the techniques most directly related to our work.
2.1 Statistical acoustics
Statistical acoustics (SA) are widely used to determine energy de-cay rates in rooms and lead to efficient approaches to model re-verberation effects. For instance, the Eyring model describes theenergy decay in an enclosure as a decaying exponential:
E(t) = EoecS4V
t log(1−α), (1)
where c is the speed of sound (≈ 340m.s−1), V is the volume ofthe space, S the total surface area of the walls and α the surface-averaged absorption coefficient.
While such approaches can give good results in the case of sin-gle rooms, they fail to capture the multi-slope decays created whenrooms are connected. In Figure 2, decays of two independent roomsare compared with a decay obtained by coupling the two spaces.Decays were computed using a ray-tracing approach to constructimage sources [Vorlander 1989]. One million rays were used tocompute a “reference” solution up to 200 reflection orders. Notethat the slope of the decay is not linear in dB scale and is a combi-nation of the decay slopes of the individual rooms.
-60
-50
-40
-30
-20
-10
0
0 0.5 1 1.5 2 2.5 3 3.5 4
computed decay coupled roomscomputed decay room 1computed decay room 2
Eyring predicted room 1 (RT60=1.63 s.)Eyring predicted room 2 (RT60=3.47 s.)E
ne
rgy (
dB
)
Time (s.)
listener
source
Figure 2: Integrated energy decays for two uncoupled and coupled
rooms. The volume of room #1 is 29 m3 while room #2 is muchlarger at 578 m3. Energy absorption is uniform on all wall surfacesand was set to 5%.The double decay slope due to coupling is clearlyvisible on the blue curve.
SA methods specifically designed to predict reverberation time incoupled volumes also exist. The earliest results for two coupledrooms are due to Davis [Davis 1925] and Eyring [Eyring 1931].Further details for the two-room case are given by Lyle [Lyle 1981a;Lyle 1981b] and Cremer and Muller [Cremer and Muller 1982], andKuttruff extended the technique to an arbitrary number of coupledvolumes [Kuttruff 1973]. All of these assume that the reverberantdecays for each room in the coupled system are exponentially de-caying and can be predicted independently. They also assume thatmodifications to the single-room decays occur due to diffuse energyexchange through portals between spaces. Summers et al. [Sum-mers et al. 2004] provide an improved SA model for coupled vol-umes which uses corrections based on geometrical acoustics to in-crease the accuracy of single-room decay predictions as well asroom-to-room energy exchanges.
Our approach can be seen as a generalization of previous SA ap-proaches but also aims at providing a finer-grain estimation of theshort-time integrated impulse response so that it can be directly au-ralized. A solution to more accurate modeling is to use methodsbased on geometrical acoustics.
2.2 Geometrical acoustics
Geometrical acoustics (GA) is probably the most popular approachfor physically-based acoustic modeling. GA is a high-frequency ap-proximation that models sound propagation along ray-paths. Spec-ular reflection paths can be constructed using techniques such as
ray or beam tracing [Lauterbach et al. 2007; Lentz et al. 2007;Funkhouser et al. 2004]. Monte-Carlo path tracing or radiosity-like approaches can be used for diffuse exchanges [Heinz 1993;Dalenback 1996; Siltanen et al. 2007].
GA-based techniques have been previously used for the off-line prediction of reverberation in coupled volumes. UsingODEON [Christensen ], a commercially available GA-modelingprogram, Bradley and Wang [Bradley and Wang 2007] evaluatedthe effects of various architectural parameters on the energy decayin a coupled-volume system. They also have shown good agree-ment at high frequencies between ODEON simulations and mea-surements from an existing coupled-volume concert hall [Bradleyand Wang 2007]. Summers et al. [Summers et al. 2005] have shownthat reverberant tails in coupled volumes can be predicted accu-rately with ray tracing in the software CATT [Dalenback ].
In a recent paper [Lentz et al. 2007], Lentz et al. report update timesof up to 3 sec. to update full reverberation filters in a Monte-Carlopath tracing context. Early reflection visibility checking takes about0.7 sec. for up to order 3 in their 105 polygon test model, leading to300000 potentially visible image sources to test. While acceptablein the context of acoustics design, such update rates are limiting fortypical consumer entertainment applications, such as games, wherethe simulation should typically run between 10 and 60Hz to accom-modate fast listener or source motions and geometrical changes inthe environments. Another paper [Laine et al. 2008], using a beam-tracing approach, reports constructing all third order reflections of asonund source in 1 msec. for a 1190 polygon model. However, eventhe fastest interactive GA approaches remain limited to low-ordersof reflection (typically 8) and few sources. Hence, they cannot beapplied to compute full reverberation effects interactively since re-verberation filters typically contain audible reflections of order 100or more.
To avoid the cost of an on-line GA simulation, Pope et al. [Popeet al. 1999] have proposed to precompute and store the reverber-ation filters for a number of locations in a virtual environment.However, this approach does not scale well, since it would re-quire computing a number of filters quadratic with the number ofsource/listener locations or rooms. It also does not support any in-teractive modification of the environment. In this paper however,we will retain the approach of pre-computing costly GA-based de-cay envelopes in an off-line process.
2.3 Artificial Reverberators
Statistical acoustics formulations lead to the development ofefficient artificial reverberators, which are currently the mostwidespread techniques used to auralize late reverberation effects ininteractive virtual environments [Gardner 1998; Rocchesso 2002].Artificial reverberators do not model the fine-grain temporal struc-ture of a reverberation filter but assume that reverberated compo-nents can be modeled as a temporal noise process modulated byslowly-varying pressure-amplitude envelopes in different frequencysubbands. Following Eq 1, these envelopes are often considered asexponentially decaying, which leads to the design of efficient recur-sive Feedback Delay Network (FDN) filters [Schroeder 1962; Jot1999; Gardner 1998; Rocchesso 2002]. This approach of modelingthe fine-grain structure of reverberation filters as a noise process hasalso been used to auralize Monte-Carlo path tracing results [Kut-truff 1993; Schroder et al. 2007]. In this case, a short-time inte-grated impulse response is constructed via path-tracing and is usedto modulate the noise process. In the general case, this approachcannot be directly implemented using the previous FDN formula-tion due to non-exponential decays, and results in a high compu-tation cost. In this work, we will also be using this latter solution
but show that it can be efficiently implemented within a scalableFourier-domain framework [Tsingos 2005].
3 Overview
Our approach requires a 3D model of the environment to simulate.In a first pre-processing step, we decompose the 3D environmentinto a cell-and-portal structure [Teller 1992; Lefebvre and Hornus2003; Haumont et al. 2003]. We build an adjacency graph thatencapsulates the physical connectivity of the individual buildingblocks of the geometry, i.e. the cells and portals. The nodes ofthe graph correspond to the rooms and the edges to the differentcoupling apertures (see Figure 1 (b)).
In contrast to previous GA work [Lentz et al. 2007; Funkhouseret al. 2004], we do not use the cell-portal decomposition to speedup visibility checks. Rather, we use the topology of the correspond-ing adjacency graph to decouple the acoustic spaces and treat themindependently. As such, our work shares some similarities with theapproach concurrently suggested in [Foale and Vamplew 2007].
By following this divide-and-conquer strategy, we seek to modelreverberation as an energy transfer between rooms, using operatorssimilar in spirit to form-factors [Siltanen et al. 2007]. These op-erators encode not only direct propagation from room to room butalso higher order reflections within rooms that encounter the portalsand thus lead to additional, delayed energy exchange. For a moreaccurate modeling of the acoustical behaviour of each subspace,these operators are pre-computed for each individual room using aGA approach. Section 4 describes the operators and their off-lineevaluation.
During an on-line simulation, global room-to-room propagation issolved by traversing the adjacency graph and constructing all possi-ble propagation routes from all rooms to the current listening room(Figure 1 (c)). These routes will be re-used to auralize all audi-ble sound sources in the listening room. Once sound-propagationroutes have been determined, global short-time integrated pressuredecays are computed for each source room. This involves convolv-ing adjacent transport operators as energy radiates from subspaceto subspace along each route. We propose to compute the requiredconvolutions numerically in the Fourier domain. In addition, wepropose a convolution caching mechanism that leverages the coher-ence between all propagation routes in the graph. This process isdescribed in Section 5.
A set of matching artificial reverberation filters are then generatedfor auralization (Figure 1(d)). In Section 6, we show that efficientauralization of the reverberation effects can be achieved using ascalable rendering approach, similar to [Tsingos 2005], which weextend to include spatial rendering of the reverberated components.
Finally in Section 7, we show that our approach compares well withfull GA solutions and that our rendering engine can deal with com-plex environments at interactive rates.
4 Transport operators for coupled spaces
In this section, we introduce transport operators, or TOPs, describ-ing global energy exchanges inside and in-between spaces. Trans-port operators model how energy decays locally within a singlebuilding block of the virtual environment due to reverberation. Wealso introduce operators modeling the response of incoming soundat the interface between each building block, i.e. portals. A spe-cific pressure decay function is computed and associated with eachtransport operator.

4.1 Definitions
We define several transport operators for any given room in the en-vironment. To handle general environments, we pre-compute trans-port operators using Monte-Carlo path tracing, see Figure 3 for anexample.
emitted energy
received energy
S
L
SRLPRP
r
Figure 3: Illustration of the path tracing process used to computea PRP and SRL transport operator.
The Source-Room-Listener (SRL) operator is the point-to-pointresponse of a source in a room for a listener in the same room(Figure 3 right). It is used for sources that directly share the samespace as the listener. This operator typically can be obtained bysumming up the contributions of image-sources identified by thepath tracer [Vorlander 1989]. In our current implementation, SRLoperators do not include the direct contributions to the listener,which we maintain separately for faster update rates (see Section 6).
The Source-Room-Portal (SRP) operator is the response of a pointsource in a room, integrated on a given portal in the same room. Inour current implementation, we use a uniform solid angle samplingfrom the point source and compute the energy response of the SRPoperator as:
SRP(t) =4π
nbrays
nbrays
∑i=1
testi ∏k
(1−αk)δ (t − r/c),
where nbrays is the total number of rays fired and testi = 1 if theray interects portal P and testi = 0 otherwise. c is the speed ofsound, r the length of the path, δ the Dirac function. The αk’s arethe surfaces’ energy absorption coefficients along the path, with kbeing the reflection order. For better integration, russian roulettecould alternatively be used to handle reflection coefficients.
The Portal-Room-Portal (PRP) operator is the response of a portalacting as a diffuse emitter integrated for all points on a portal ofthe same room (Figure 3 left). Note that the same portal can actas both a source and a receiver in a PRP operator, in which caseonly the indirect paths are sampled. To compute a PRP operator,we sample simultaneously the surface of the source portal Pi andthe hemisphere of shooting directions and obtain the energy at thedestination portal Pj as:
PiRPj(t) =2π
nbrays
Ai
A j
nbrays
∑i=1
testi ∏k
(1−αk)δ (t − r/c),
where Ai and A j are the respective areas of the source and destina-tion portals.
The Portal-Room-Listener (PRL) operator is the response of aportal acting as a diffuse emitter for a point receiver in the sameroom. In our current implementation PRL operators are computedin the same way as SRP operators.
Portals can be fully absorbent (e.g., open door), fully reflective(e.g., closed thick door) or a mixture of both (e.g., a thin wall be-tween rooms). If the portals are fully absorbent, a ray hitting theportal is propagated no further.
We also assume that operators do not depend on the position ofthe source and listener within a given space and estimate them fora representative source and listener located at the centroid of eachroom. However, this is not a hard limitation since multiple opera-tors could be precomputed for several source or receiver locationswithin each space at the expense of more processing and a largermemory footprint.
As a result, for a room with NP portals, N2P +2NP +1 operators must
be determined, corresponding to N2P PRPs, NP PRLs, NP SRPs and
one SRL. Note that this number is a function of the local num-ber of portals in each room and is independent of the total num-ber of rooms, portals or the complexity of the underlying geometrypresent in each room. Example operators are shown in Figure 4.
Figure 4: Example transport operators pre-computed for the high-lighted room.
4.2 Pre-computing and storing transport operators
Our current implementation supports specular reflections, which wecompute for up to 200 orders, but could be extended to include dif-fuse scattering as well for improved modeling [Vorlander 1995]. Aregular grid was used to optimize ray-triangle intersections. Anyalternative GA prediction approach supporting point and area re-ceivers could be used. Each operator is computed for a numberof frequencies to account for absorption and propagation effects. Inour current implementation we used four chosen as 200, 1000, 8000and 16000 Hz.
In the case of PRP and SRP operators, energy of all paths hitting theportal is integrated over short time-frames consistent with humanhearing resolution (typically ∆T ≈ 10 ms).
For PRL and SRL operators, we use the rays to construct image-sources that we render at the listener’s location [Vorlander 1989].We also integrate the energy of the corresponding image-sourcesusing the same ∆T. To limit aliasing we use a 25cm-radius detectionsphere which is roughly consistent with the size of the listener’shead. Aliasing-free approaches, such as pyramidal beam tracing,could alternatively be used.
From the obtained energy responses, we take the square-root to ob-tain a short-time averaged pressure response. Table 1 shows pre-computation time for all operators in environments of varying com-plexity. As can be seen, the timings remain reasonable even forour highly conservative settings and pre-computation time largelydepends on the topological complexity of the scene.
Operators are stored as short-time integrated pressure histograms(fixed size and ∆T), sampled at less than 200 Hz. We use a sizeof 1024 samples and ∆T ≈ 10 ms., which can encode decays up

to 10 sec., and requires a storage of 4Kb per histogram assuming32-bit floating point values. To account for frequency-dependentabsorption effects, we store 4 echograms corresponding to differentfrequency subbands. Table 1 shows memory requirements to storethe operators for environments of various complexities. As it can beseen, memory requirements remain reasonably low even for sceneswith high polygon counts since transport operators only depend onthe topological complexity of the scene.
In comparison to the brute force solution of storing all frequencyresponses for possible couples of source and listening rooms, thisapproach is more efficient, since we do not have to propagatethrough portals and thus can trace fewer rays. In addition, storingshort time-integrated pressure decay envelopes, instead of full au-dio sampling-rate data (e.g., 44.1 KHz) reduces storage and mem-ory footprint.
Environment Time Memory
3D Model #cells(tris) #portals #TOPs (mins) (Kb)
3(39) 2 17 6 272
2(12729) 1 8 22 128
14(195) 15 140 42 2240
29(1614) 33 339 151 5424
Table 1: Precomputing transport operators. Statistics collected onan Intel Xeon 2.33GHz by tracing 300000 rays/operator, with 200the maximum number of reflections per ray. Memory statistics areprovided for operators with 4 frequency bands with a length of 1024samples. We show color-coded cells, and portals are highlighted inyellow.
4.3 Combining operators
When sound propagates from room to room, we successively applythe transfer function of each operator along a desired sound prop-agation route. For example, Figure 1 (c) shows a decay envelopeobtained by convolving all operators along a possible route. Com-bining operators is achieved by convolving their decay envelopes.An analytical solution for convolution of two exponential decay en-velopes has been proposed in [Svensson 1998]. To handle morethan one convolution and support non-exponential decays, we com-pute the convolution numerically. Individual transport operators arepre-stored in the frequency domain so that fast convolutions can beachieved using only complex multiplies.
We further assume that all decay envelopes start at t = 0 and accountfor possible initial time-delay gaps separately. The time-delays ofall operators convolved along a route can be factored out and addedtogether leading to the total time-delay for the route. This delay canbe subsequently applied to the result of the convolution. This limits
aliasing problems, especially for small time-delay gaps.
We also need an estimation of energy contributed by a given propa-gation route. This energy is used as an oracle to direct graph traver-sal during the simulation of the global propagation and can also beused to prioritize rendering of propagation routes.
There is no general formula to estimate the energy of a convolution.However, an upper bound is given by:
|| f ∗g||2 ≤ min(|| f ||2 ||g||1, || f ||1 ||g||2), (2)
|| f ∗g||1 ≤ || f ||1 ||g||1, (3)
where || f ||2 =√
∑i f 2(i) and || f ||1 = ∑i | f (i)|.
Given the starting energy of an SRP operator, we can successivelyapply Eq. 2 for successive PRP operators to estimate the energycarried along the route. Note that Eq. 3 is required to successivelyestimate the || f ||1 term in Eq. 2.
5 On-line topological sound propagation
Considering the initial cell-portal connectivity graph is already es-tablished and the transport operators for each room are computed,we describe in this section how global coupling is solved on-lineby propagating energy through the graph and combining successiveoperators along all possible propagation routes. The pseudo-codeof the complete algorithm can be seen in Algorithm 1.
5.1 Graph traversal
To model sound reverberation in the environment, we emit energyfrom the listener’s room and, according to the connectivity graph,we select and apply the energy decays of respective transport op-erators to the propagated energy. In this way we approximate theexchanges that take place between the rooms of the environment.
The tree formed by selecting the listening room as the root nodeenables a fast, depth-limited, traversal algorithm to be applied. Thecriterion driving our traversal algorithm is that the propagated en-ergy remains above a conservative energy threshold (see Eq. 2). Inour simulations, we used a 10−10 threshold (i.e., a 100 dB dynamicrange).
The traversal algorithm takes advantage of the connectivity graphbetween the rooms and portals of the environment. Each time weenter a new room, we identify and recursively follow all possibleadjacent nodes. At each step we update the propagating energyby applying the energy decay of the respective transport operator(Eq. 2). Followed routes are typically coded as transport operatorsequences, e.g. PnRvPn−1 ∗ . . . ∗ [Pi−1Rm−1Pi] ∗PiRmL. Note thatsince operators already include all reflections within rooms, edgesin the reverberation graph model coupling between adjacent spacesand always connect different nodes. As a result, two successiveoperators in a sequence always correspond to different rooms.
This traversal only extracts the longest possible routes that energycan follow from room to room until it decays below our minimalthreshold, and is independent of the actual location of the actualsound sources that need to be auralized. To account for the poten-tial presence of sound sources in any room along these routes, wesimply consider that a unique virtual source is present in each room.The initial extracted routes are further subdivided to construct allpossible routes pairing these virtual sources with the listener, e.g.routes of the form SRvPn−1 ∗ . . . ∗PiRmL.
Since the transport operators of a route will later be convolved toconstruct decay filters, the computational requirement of creating

a filter along a route, made up of NTOPS number of TOPs, will beequal to performing NTOPS − 1 convolutions. One way to furthercontrol the performance in an interactive system is to set a globalbudget and prune all routes that have a higher computational pay-load based on the estimated energy they carry.
5.2 Convolution caching
Once the significant propagation routes have been determined, wemust calculate how energy is spread through time along each route.This involves combining the transport operators along a route,which corresponds to a set of convolutions as described in Sec. 4.3.
To estimate the global decay shape for all source rooms to the lis-tening room, we cluster these routes first by source room, then byincoming portal in the listening room. The sum of all decay en-velopes (SRvP ∗ . . . ∗PiRL) must be computed for each portal Pi inthe listener’s room and a source room Rv.
Convolutions are computed in the Fourier domain. Operators’ FFTdata is pre-cached so that only the complex multiplies required forconvolution are performed on-line. Since the number of samplesused to encode the operators is small, this is efficient. Typically, 850convolutions can be performed at 60 Hz on a Intel Xeon 2.33GHzprocessor using an unoptimized implementation. However, as theenvironments become more complex, convolving the operators canbecome the bottleneck of the approach.
A key aspect of formulating the energy propagation as a sequenceof operators that can be convolved together is that we can take ad-vantage of the associative and commutative properties of convo-lution to significantly reduce the number of convolutions actuallyperformed. Recall that energy will sequentially propagate betweenthe rooms of the environment in an iterative manner, thus in manyroutes the same operators may occur multiple times. The commuta-tivity of convolution enables us to arbitrarily re-order transport op-erators, by using a pre-assigned unique numeric value that acts asan identification number of each transport operator. Furthermore,the associative property of convolution allows us to apply a sim-ple dictionary-based compression scheme in which transport oper-ators are convolved pair-wise and new transport operators, denotingthis convolution, are stored in a cache. Therefore, when filters arecreated for each route, this convolution cache is queried for pre-computed convolutions of operators. The high correlation of trans-port operators in the different sound propagation routes, emanatingfrom the listener’s room, provides a significant decrease in the num-ber of required convolutions, as can be seen in Table 2. We obtainedcompression ratios of more than 10 to 1 in some of our test cases.
5.3 Handling changes in portal state
Our approach allows for modifying the topology of the graph in-teractively, for instance to model opening or closing doors in theenvironment. However, closing a door in a room will also affecttransport operators which must then be recomputed. Our currentsolution to smoothly blend between portal states is to pre-computeeach operator for all possible portal state (i.e., open/closed) in theroom. We smoothly interpolate between states by linear combina-tion of the transport operators. If a portal becomes fully opaque, wecan remove the edge from the graph to speed up propagation.
6 Real-time auralization
Once our pressure-response envelopes have been computed, theycan be used to auralize sound sources with consistent reverberation
Algorithm 1 Graph-based topological sound propagation
// * denotes a convolution.routes ⇐ traverse(graph)routes → split()routes → unique()for Route ∈ routes do
Route → reorder(sort)TOPRoute ⇐ new Routefor pair < TOPi,TOPi+1 > ∈ Route do
TOPtmp → setID(generateID(TOPi ∗TOPi+1))if TOPtmp /∈ ConvolutionCache then
TOPtmp ⇐ TOPi ∗ TOPi+1
ConvolutionCache → add(TOPtmp)end ifTOPRoute ⇐ TOPR ∗ ConvolutionCache → get(TOPtmp)
end forend for
effects. For auralization, the decay envelopes are transformed backto time-domain and used as the envelope of a noise process, simi-lar to artifical reverberators. To optimize the reverberation process,we use a progressive Fourier-domain approach, similar to [Tsingos2005], to perform block-based convolution of the input audio sig-nals with the reverberation filters.
The next sections detail our spatial audio rendering model and ourimplementation of a global pipeline, shown in Figure 5, where en-ergy propagation and spatial audio processing are performed asyn-chronously. A key feature of this pipeline is to decouple the prop-agation performed from room to room from the actual sources thatneed to be processed, which can be much larger.
6.1 Spatial audio rendering model
Consider a sound source in room RS that is audible in the listener’sroom RL. We auralize three components: 1) the direct sound tothe listener, 2) the directional incoming contributions through eachportal in the listener’s room, and 3) the reverberated contributionsincluding the reverberation effect of the listening room. Our currentimplementation uses binaural rendering.
The direct sound to the listener is rendered using positionalaudio processing. Our current framework uses Head Re-lated Transfer Functions (HRTF) from the LISTEN database(http://www.ircam.fr/listen). If the sound source is not in the lis-tener’s room, we use the shortest route from the graph propagationto derive an approximate diffracted component, which we renderfrom the centroid of the portal, using a simplified Geometrical The-ory of Diffraction formalism [Tsingos et al. 2001].
For each portal Pi in the listening room RL, we render an additionaldirectional source located at the centroid of Pi. The source signal,in this case, is first convolved by a monophonic reverberation fil-ter and then positioned using the corresponding HRTF. The decayenvelope of the reverberation filter corresponds to the sum of allSRSP ∗PRP ∗ . . . ∗PRPi routes ending at this portal. The obtaineddecay envelope is then converted back to time-domain to be usedby our scalable artificial reverberation engine. This involves NP in-verse Fourier transforms for the NP portals in the current listener’sroom.
Finally, we render spatially diffuse reverberated components forboth the direct sound and the portal contributions. We convolvethe signal of the source with a 2-channel random noise process,whose decay envelope includes the reverberation effect of the lis-tener’s room RL. For sources located in RL, this is directly a pre-

Traversal Time (msecs) 0.2 0.07 7.25 1.71Route Construction Time (msecs) 0.36 0.05 12.93 9.32
#Routes 23 9 256 59
Convolution Cache off on off on off on off on
#Convolutions 123 22 43 10 1819 420 852 62Convolutions Time (msecs) 2.82 1.79 1.19 0.83 40.23 37.65 15.69 6.73
Compression ratio – 5.6:1 – 4.3:1 – 4.3:1 – 13.7:1Cache size (Kb) – 432 – 208 – 7200 – 1152
Total Time (msecs) 3.38 2.35 1.31 0.95 60.41 57.83 26.72 17.76
Table 2: Topological sound propagation statistics, averaged over 600 runs on an Intel Xeon 2.33Ghz.
computed SRL envelope. For portal contributions, we generate thecorresponding decay envelope as the sum of all SRSP ∗PRP ∗ . . .∗PRPi ∗PiRLL routes. This only involves a single additional convo-lution of the previously computed directional source contributionwith the final PiRL operator. The obtained envelope is also con-verted back to time-domain before being transfered to the artificialreverberation engine.
For multiple sources in the same room the same decay envelopesare used, thus making our approach scalable. Another advantage ofseparating portal and diffuse contributions is that the relative levelof the various components (portal, diffuse, room) can be individu-ally adjusted by a sound designer which gives more control on thedesired effect in the context of entertainment applications.
6.2 Implementation of the rendering pipeline
We implemented our real-time audio processing pipeline using twoseparate processes running asynchronously (see Figure 5).
The first process handles the energy propagation and constructionof reverberation decay envelopes. If the listener changes room orthe portal state is modified, we re-propagate energy in the environ-ment from the room containing the listener (see Section 5).
In the second process, the artificial reverberation engine retrievestime-domain decay envelopes for each source and applies block-based FIR convolution to the input sound signals. FIR convolutionis done directly in the Fourier domain following the approach in-troduced in [Tsingos 2005]. This approach performs lossy block-based convolution, accounting for masking between reverberationblocks of all sources. Additionally, the engine dynamically allo-cates processing to blocks contributing more energy to the final mixaccording to a user-specified computational budget. Figure 7 illus-trates how masking and budget allocation allows for controlling thecomputational load.
We process 1024 sample blocks at 44.1 KHz sampling-rate and use50% overlap-add blending to avoid artefacts in the reconstruction.Hence, our audio processing thread runs at 86Hz outputing framesof 512 reconstructed samples.
To optimize processing, all our input signals are pre-stored in theFourier frequency domain so that only a single inverse FFT is re-quired to reconstruct an audio frame. To synthesize the reverbera-tion filters, we use a circular array of successive white-noise blocks,which we also pre-transform into the Fourier domain. To renderspatially diffuse reverberation components, we generate uncorre-
Graph traversalRoute building
Operator convolutions(frequency domain)
Route clustering
10 -100 Hz
Propagation engine
listener/sources updatesaudio event requests
60 Hz
Main application(e.g., game engine)
retrieve time-domain decays
Audio rendering engine
86 Hz
MaskingBudget allocation
Block FIR convolutions(frequency domain)
insert source
updateparameters
pre-computedfrequency-domain operators(sampling rate = 86 Hz)
frequency-domainsounds samples(sampling rate = 44KHz)
Figure 5: Overview of the rendering pipeline. Each box runs as anasynchronous process.
lated noise sequences by picking a random starting block in thearray for each output channel. Each block of noise is equalized inthe Fourier domain using the values stored in the time-domain de-cay envelopes obtained after propagation. Hence, the synthesizedimpulse response corresponds to a noise sequence multiplied bya frequency-dependent staircase envelope with a staircase-lengthequal to our frame size (11 msec. in this case). To avoid audi-ble artefacts, we use a 15-band equalization by interpolating the 4frequency-dependent values stored in the envelopes at each time-frame (see Section 4.2). The 15 obtained gains are directly used tomultiply the complex Fourier coefficients of the noise data withineach band prior to the complex multiplication with the source sig-nal. Figure 6 illustrates our reverberation process. Although we donot use zero-padding on the source signal (thus performing circu-lar convolution), we found that the use of a Hann window limitsaudible aliasing. Overlap-add reconstruction also introduces time-domain smoothing and eliminates possible artefacts due to our dis-continuous staircase envelope.
7 Results
We integrated our approach in the Penta G game engine(http://www.gebauz.com/index.php?page=penta-g) devel-oped in the context of the EU IST Gametools project(http://www.gametools.org/). A snapshot of the gameis shown in Figure 1 (d). Please visit http://www-sop.inria.fr/reves/projects/revGraphs/ for additional material

...
...
...
4-band decay profile
15-band decay profile
inte
rpola
te
1 audioframe
1 audioframe
1 audioframe
Pre-computed noise table
STFT
STFT
frequency
time
time
am
plit
ude
frequency
am
plitu
de
frequency
am
plit
ude
Input audio signal
...
outputframe
+
+
Fourier domain reverberation
am
plit
ude
time
...
x *
*
*
x
x
de
ca
yp
rofile
no
ise
au
dio
sig
na
l
Figure 6: Illustration of our block-based, Fourier-domain, artifi-cial reverberator. A noise sequence is first weighted by the real-valued reverberation decay profile before its complex multiplica-tion with the input source signal. Several past blocks of the inputaudio signal undergo this process and add-up to construct a frameof reverberated audio signal.
including demo sounds and videos.
7.1 Performance
As can be seen in Table 2, our topological sound propagation ap-proach can compute global reverberation filters at interactive ratesfor environments exhibiting complex coupling structure. Using ourapproach, we were able to compute the contributions of 256 prop-agation routes, resulting in 1800 convolutions at 17 Hz. Althoughthe compression ratio of our current caching algorithm is very good,performance does not increase sub-linearly due to the overhead ofour current algorithm. However, we believe this could be signifi-cantly improved . Clustering of the obtained decay filters accordingto source room and destination portal and final time-domain recon-struction were achieved at 30 Hz in this environment. Inverse FastFourier Transforms (FFT) are only performed on-demand for roomsthat contain the sources to auralize. One inverse FFT is required peractive room and per portal in the current listener’s room.
Our scalable reverberation engine runs at 86 Hz and is able to ren-der about a 100 individual reverberation filters at each time-frame.Figure 8 shows timings for each component of our scalable rever-beration approach: masking, budget allocation and processing.
On a dual core Intel Xeon 2.33GHz workstation, our completepipeline allows for rendering in real-time all reverberated compo-nents obtained from our propagation algorithm for 30 individualsources.
7.2 Comparison to path-tracing solutions
We compared our interactive propagation algorithm to an off-lineimage-source simulation implemented using a ray-casting processin different test environments. To generate these solutions 3 millionrays were fired from the source and traced up to 200 orders of reflec-tion. Valid image-sources were collected at the listening point usinga 25 cm-radius detection sphere. Figures 9 and 10 show compar-isons of pressure decay envelopes obtained using the image-source
0
100
200
300
400
500
600
700
0 200 400 600 800 1000 12000
100
200
300
400
500
600
700
0 200 400 600 1000 1200
# sources# frames
# audible frames# FFT coeffs * 100
# allocated coeffs * 100budget (30000)
frames
Figure 7: Statistics for our scalable reverberation engine on a se-quence of 1200 audio processing frames where up to 20 sourcesare active. The plot displays the number of sources, number offrames of input audio data mixed for block-based convolution, andcorresponding number of FFT coefficients before and after budgetallocation (we set a global budget of 30000 coefficients in this ex-ample).
0
0.002
0.004
0.006
0.008
0.01
0.012
0 200 400 600 800 1000 1200
audio frame lengthupdate
maskingalloc
processingreconstruct
total
frames
seconds
Figure 8: Breakout times for the various components of our scal-able reverberation engine for the same sequence as Figure 7. Notethat the masking and budget allocation introduce very little over-head.

-60
-50
-40
-30
-20
-10
0
0 0.5 1 1.5 2 2.5 4
topological propagationreference GA solution
SR1L operatorSR1P PR2P PR1L route
SR1P PR2P PR1P PR2P PR1L route
time (s.)
So
un
d p
ressu
re le
ve
l (d
B)
S
L
R2P
R1
3 3.5
Figure 9: Comparison of our approach to an image-source sim-ulation in a simple two-room environment.We show the result ofour topological sound propagation and most representative indirectroutes.
simulation and our approach. As can be seen, both approaches leadto similar decay envelopes, although our results slightly overesti-mates the slope of the late decay.
8 Discussion and limitations
The fundamental limitation of our approach is that portals act asdiffuse emitters. As a result, our approach does not accuratelymodel early reflections. However, it would be possible to pre-compute a room-to-room matrix of possible early reflection pathsor image-sources [Lentz et al. 2007], and utilize our approach torender higher order reflections. Our current implementation onlyincludes specular reflection and does not model diffuse reflectionon surfaces, nor scattering/diffraction at portals which have beenshown to significantly improve acoustical modeling [Vorlander1995; Funkhouser et al. 2004]. Our pre-computing step could beextended to include these effects. Another expected benefit of in-troducing diffuse reflection would be to reduce the error introducedby our “diffuse-portal” assumption by generating more diffuse ex-changes between spaces. We also currently pre-computed operatorsfor a single representative source and listener position in each space.If the geometry of the space is complex, for instance if a room anda corridor have been merged into the same space, this might leadto unrealistic results. A solution is to define cell and portals so thatthe geometry of the space boundaries is convex which will limit thisproblem.
The performance of our approach and quality of the results is alsodirectly influenced by the temporal sampling resolution of the decayenvelopes. Sampling resolution is related to the modulation spec-trum of the modeled transfer functions [Schroeder 1981]. In partic-ular, properly taking into account early reflections would require afiner resolution or preferably a separate modeling. Our choice of a10 msec. integration window is also directly related to the process-ing frame size for our auralization engine (currently running at 83Hz). For improved efficiency, we currently use the same DT (11.6msec.) for both the length of an output audio frame and the sam-pling rate of the decay envelopes. Hence, we can directly obtain thedecay value at each audio frame without re-sampling the envelopes.
Currently we render our reverberation effects as decorrelated noisesignals that do not capture the fine-grain spatial structure of thereverberation within each room. We believe an approach simi-
-70
-60
-50
-40
-30
-20
-10
0 0.5 1 1.5 2 2.5 3
'titi1' using 1:($5-25)
'titi2' using 1:($5-15)
'titi3' using 1:($5-25)
time (s.)
so
un
d p
ressu
re le
ve
l (d
B)
Figure 10: Comparison of our approach to an image-source simu-lation for different configurations of sources and listeners. Starsand spheres indicate source and listener positions, respectively.Graph colors correspond to <source,listener> pairs for which thesimulations were computed. Darker colors correspond to the refer-ence path tracing simulation while light colors are the result of ourtopological graph-based approach.
lar to the Spatial Impulse Response Rendering [Merimaa and Pul-lki 2004] could be used to introduce finer grain modeling of thespatial aspects of the reverberation effect by pre-computing time-dependent average incidence directions with SRL and PRL opera-tors.
Our current work focuses on indoor architectural environments butwe believe possible application to more general situations, such asoutdoor scenes (cities, etc.). These raises several issues, for in-stance how to define cells/portals and their connectivity graph inthis context. Our assumption of diffuse energy exchanges mightalso not be valid in this particular case.
9 Conclusion
We presented a novel graph-based topological sound propagationalgorithm that can compute interactive reverberation effects in com-plex coupled environments. In our auralization system we use au-ditory masking and scalable Fourier domain processing to render alarge number of reverberated components.
Our approach supports multiple moving sources and listener. Italso allows on-line topology changes and some geometrical modi-fications and would be suitable for procedurally-generated environ-ment, e.g. using pre-defined building blocks as in [Merrell 2007].
Results obtained using our interactive approach compare well tooff-line geometrical acoustics solutions. In the future, the resultsof our technique could be improved by incorporating diffuse scat-tering, instead of pure specular reflections. While further numer-ical and perceptual validation is necessary, we believe the pro-posed method opens interesting perspectives for real-time aural-ization that could find applications both for acoustical design andvirtual environments.
Acknowledgments
The authors would like to thank Fanouris Moraitis for modeling thetest 3D environments, Michael Wimmer and Chris Chiu for mak-ing the Penta-G game engine available to us and providing sup-port, David Alloza for initial discussions on graph-based reverber-
ation and Xavier Granier. We also would like to thank the anony-mous reviewers for their helpful suggestions. This research wasfunded by the EU FET Open project IST-014891-2 CROSSMOD(http://www.crossmod.org).
References
BEGAULT, D. R. 1994. 3D Sound for Virtual Reality and Multime-dia. Academic Press Professional.
BRADLEY, D. T., AND WANG, L. M. 2005. The effects of simplecoupled volume geometry on the objective and subjective resultsfrom nonexponential decay. J. Acoustical Soc. Am. 118, 3, 1480–1490.
BRADLEY, D., AND WANG, L. 2007. Comparison of measuredand computer-modeled objective parameters for an existing cou-pled volume concert hall. Building Acoustics 14, 2, 79 – 90.
CHRISTENSEN, C. L. Odeon Room Acoustics Software.http://www.odeon.dk/.
CREMER, L., AND MULLER, H. 1982. Principles and Applica-tions of Room Acoustics. Applied Science.
DALENBACK, B.-I. CATT Acoustic. http://www.catt.se/.
DALENBACK, B.-I. L. 1996. Room acoustic prediction based on aunified treatment of diffuse and specular reflection. J. AcousticalSoc. Am. 100, 2 (Aug.), 899–909.
DAVIS, A. H. 1925. Reverberation equations for two adjacentrooms connected by an incompletely sound-proof partition. Phi-los. Mag. 50, 75 – 80.
EAX, 2004. Environmental audio extensions 4.0, Creative c©.http://www.soundblaster.com/eaudio.
ERMANN, M. 2007. Double sloped decay: Subjective listening testto determine perceptibility and preference. Building Acoustics14, 2, 91 – 107.
EYRING, C. F. 1931. Reverberation time measurements in coupledrooms. J. Acoustical Soc. Am. 3, 2, 181 – 206.
FOALE, C., AND VAMPLEW, P. 2007. Portal-based sound propa-gation for first-person computer games. In The Proceedings ofthe 4th Australasian Conf. on Interactive Intertainment, ACM.
FUNKHOUSER, T., TSINGOS, N., CARLBOM, I., ELKO, G.,SONDHI, M., WEST, J. E., PINGALI, G., MIN, P., AND NGAN,A. 2004. A beam tracing method for interactive architecturalacoustics. J. Acoustical Soc. Am. 115, 2, 739–756.
GARDNER, W. 1998. Reverberation Algorithms, Applications ofDigital Signal Processing to Audio and Acoustics, Chapter 6.Mark Kahrs and Karlheinz Brandenburg Ed., Kluwer AcademicPublishers.
HAUMONT, D., DEBEIR, O., AND SILLION, F. 2003. Volumetriccell-and-portal generation. In Computer Graphics Forum, Black-well Publishers, vol. 3-22 of EUROGRAPHICS Conference Pro-ceedings.
HEINZ, R. 1993. Binaural room simulation based on an imagesource model with addition of statistical methods to include thediffuse sound scattering of walls and to predict the reverberanttail. Applied Acoustics 38, 145–159.
JOT, J.-M. 1999. Real-time spatial processing of sounds for music,multimedia and interactive human-computer interfaces. Multi-media Systems 7, 1, 55–69.
KNIGHT, D. 2003. Audibility of non-exponential energy decay inrunning reverberation. Master’s thesis, Rensselaer PolytechnicInstitute.
KUTTRUFF, H. 1973. Room Acoustics (1st edition). Elsevier Ap-plied Science.
KUTTRUFF, K. 1993. Auralization of impulse responses modeledon the basis of ray-tracing results. J. Audio Eng. Soc. 41, 11(Nov.), 876–880.
LAINE, S., SILTANEN, S., LOKKI, T., AND SAVIOJA,L. 2008. Accelerated beam tracing algorithm. Ap-plied Acoustics (to appear). Available online athttp://dx.doi.org/10.1016/j.apacoust.2007.11.011.
LAUTERBACH, C., CHANDAK, A., AND MANOCHA, D. 2007. In-teractive sound rendering in complex and dynamic scenes usingfrustum tracing. Transactions on Visualization and ComputerGraphics 13, 6 (Nov.-Dec.), 1672–1679.
LEFEBVRE, S., AND HORNUS, S. 2003. Automatic cell-and-portaldecomposition. Tech. Rep. 4898, INRIA, July.
LENTZ, T., SCHRODER, D., VORLANDER, M., AND ASSEN-MACHER, I. 2007. Virtual reality system with integrated soundfield simulation and reproduction. EURASIP Journal on Ad-vances in Signal Processing 2007, Article ID 70540, 19 pages.doi:10.1155/2007/70540.
LYLE, C. D. 1981. The prediction of steady state sound levels innaturally coupled enclosures. Acoust. Lett. 5, 16 – 21.
LYLE, C. D. 1981. Recommendation for estimating reverberationtime in coupled spaces. Acoust. Lett. 5, 35 – 38.
MERIMAA, J., AND PULLKI, V. 2004. Spatial impulse responserendering. Proc. of the 7th Intl. Conf. on Digital Audio Effects(DAFX’04), Naples, Italy (Oct.).
MERRELL, P. 2007. Example-based model synthesis. In I3D ’07:Proceedings of the 2007 symposium on Interactive 3D graphicsand games, ACM, New York, NY, USA, 105–112.
PICARD, D. 2003. Audibility of non-exponential reverberation
decays. Rapport de Stage D’Option Scientifique, Ecole Poly-technique, Paris, France.
POPE, J., CREASEY, D., AND CHALMERS, A. 1999. Realtimeroom acoustics using ambisonics. In The Proceedings of the AES16th Intl. Conf. on Spatial Sound Reproduction, Audio Engineer-ing Society, 427–435.
ROCCHESSO, D. 2002. Spatial Effects, DAFX - Digital AudioEffects, Chapter 6. Udo Zolzer Ed., Wiley.
SCHRODER, D., DROSS, P., AND VORLANDER, M. 2007. A fastreverberation estimator for virtual environments. In Proceedingsof the AES 30th Intl. Conf., Saariselka, Finland.
SCHROEDER, M. 1962. Natural sounding artificial reverberation.J. Audio Eng. Soc. 10, 3, 219–223.
SCHROEDER, M. 1981. Modulation transfer function: Definitionand measurement. Acustica 49, 179–182.
SILTANEN, S., LOKKI, T., KIMINKI, S., AND SAVIOJA, L. 2007.The room acoustic rendering equation. J. Acoustical Soc. Am.122, 3 (Sept.), 1624–1635.
SUMMERS, J., TORRES, R., AND SHIMIZU, Y. 2004. Statistical-acoustics models of energy decay in systems of coupled roomsand their relation to geometrical acoustics. J. Acoustical Soc.Am. 116, 2, 958 – 969.
SUMMERS, J., TORRES, R., SHIMIZU, Y., AND DALENBACK,B.-I. 2005. Adapting a randomized beam-axis-tracing algo-rithm to modeling of coupled rooms via late-part ray tracing. J.Acoustical Soc. Am. 118, 3, 1491 – 1502.
SVENSSON, U. P. 1998. Energy-time relations in a room withan electroacoustic system. J. Acoustical Soc. Am. 104 (Sept.),1483–1490.
TELLER, S. 1992. Visibility Computations in Densely OccudedPolyhedral Environments. PhD thesis, Computer Science Div.,University of California, Berkeley.

TSINGOS, N., FUNKHOUSER, T., NGAN, A., AND CARLBOM,I. 2001. Modeling acoustics in virtual environments using theuniform theory of diffraction. ACM Computer Graphics, SIG-GRAPH’01 Proceedings (Aug.), 545–552.
TSINGOS, N. 2005. Scalable perceptual mixing and filtering of au-dio signals using an augmented spectral representation. In Pro-ceedings of the Intl. Conf. on Digital Audio Effects. Madrid,Spain.
VORLANDER, M. 1989. Simulation of the transient and steady-state sound propagation in rooms using a new combined ray-tracing/image-source algorithm. J. Acoustical Soc. Am. 86, 1,172–178.
VORLANDER, M. 1995. International round robin on room acous-tical computer simulations. In Proc. of the Internat. Congress onAcoustics (ICA’95), Trondheim, Norway, 689–692.