
Topological Design and Dimensioning of Agile All Photonic...
29
Topological Design and Dimensioning of Agile All Photonic Networks Lorne Mason * , Anton Vinokurov, Ning Zhao, David Plant McGill University, Montreal, Quebec, Canada Abstract: We present the design and analysis of an Agile All-Photonic Network (AAPN); in the context of our study, the agility is derived from sub-microsecond photonic switching and global network synchronization. We have articulated a set of circuit design alternatives in terms of switch configurations referred to as symmetric and asymmetric designs, and 2-layer and 3-layer designs and discuss the implications of these alternatives in terms of transmitter and receiver design and synchronization requirements. In order to evaluate performance and cost of this range of design alternatives, we developed a set of software tools and methodologies for designing and dimensioning our vision of an AAPN. The topological design problem consists of determining the optimal number, size and placement of edge nodes, selector/multiplexers and core switches as well as the placement of the DWDM links so as to minimize network costs while satisfying performance requirements of the supported traffic. A new mixed integer linear programming formulation is presented for core node placement and link connectivity, A methodology has been developed for two-layer and three-layer network topology design and implemented in software. These tools were exercised under a wide variety of equipment cost assumptions for both a metropolitan network and a long-haul network assuming a gravity model for traffic distribution and a flat community of interest factor. Key findings include the determination of near cost optimal designs for both metropolitan (two-layer design) and a Canadian Wide Area Network (WAN, three layer design). We also show the cost and topology sensitivity to the selector switch size and the preferred size in terms of port count and number of switches. Keywords: Topological design, optical networks, optimization * Corresponding author: E-mail: [email protected] Tel: +1-(514)-398-3159 Fax: +1-(514)-398-3127 McGill University, Department of Electrical and Computer Engineering, McConnell Engineering Building, 3480 University Street, Montreal, Quebec, H3A 2A7 CANADA 1
Transcript of Topological Design and Dimensioning of Agile All Photonic...
Topological Design and Dimensioning of Agile All Photonic Networks
Lorne Mason*, Anton Vinokurov, Ning Zhao, David Plant McGill University, Montreal, Quebec, Canada
Abstract: We present the design and analysis of an Agile All-Photonic Network (AAPN); in the context of our study, the agility is derived from sub-microsecond photonic switching and global network synchronization. We have articulated a set of circuit design alternatives in terms of switch configurations referred to as symmetric and asymmetric designs, and 2-layer and 3-layer designs and discuss the implications of these alternatives in terms of transmitter and receiver design and synchronization requirements. In order to evaluate performance and cost of this range of design alternatives, we developed a set of software tools and methodologies for designing and dimensioning our vision of an AAPN. The topological design problem consists of determining the optimal number, size and placement of edge nodes, selector/multiplexers and core switches as well as the placement of the DWDM links so as to minimize network costs while satisfying performance requirements of the supported traffic. A new mixed integer linear programming formulation is presented for core node placement and link connectivity, A methodology has been developed for two-layer and three-layer network topology design and implemented in software. These tools were exercised under a wide variety of equipment cost assumptions for both a metropolitan network and a long-haul network assuming a gravity model for traffic distribution and a flat community of interest factor. Key findings include the determination of near cost optimal designs for both metropolitan (two-layer design) and a Canadian Wide Area Network (WAN, three layer design). We also show the cost and topology sensitivity to the selector switch size and the preferred size in terms of port count and number of switches. Keywords: Topological design, optical networks, optimization * Corresponding author: E-mail: [email protected] Tel: +1-(514)-398-3159 Fax: +1-(514)-398-3127 McGill University, Department of Electrical and Computer Engineering, McConnell Engineering Building, 3480 University Street, Montreal, Quebec, H3A 2A7 CANADA
1
1. Introduction Recently there has been much attention paid to the study and development of agile transparent optical transport networks, where the electronic cross connect and add/drop multiplexing switching systems are replaced with photonic counterparts. This enables the provision of light paths linking network ingress and egress nodes where the signal is transmitted entirely in the optical domain, thus eliminating the expensive OEO conversions associated with the SONET/SDH cross connect systems. Apart from significant cost reductions, these all optical light paths are protocol and rate independent, thereby facilitating network evolution and reach. A significant body of literature exists addressing the so called routing and wavelength assignment (RWA) problem. Integer and linear programming models have been formulated and solved to determine the appropriate wave length and path assignment for light paths through the physical transmission networks to maximize throughput for a given network topology and link capacity. A variety of models have been reported which address variants and extensions of this problem including static and dynamic light path demands, network survivability, and traffic robustness [1, 2, 3, 4, and references therein]. Due to the service architecture of the Internet that enables users to implement services at the application layer, new services will be designed and deployed without centralized authorization. In this context agility is a required network capability because it provides a degree of service quality robustness in the face of traffic forecasting errors and facility failures. Traffic forecasting necessary for capacity planning is becoming increasingly difficult as new services with unknown traffic characteristics, volume, and distribution are rapidly emerging. Agility enables operators to reconfigure the network topology on short notice in order to match observed traffic demands and in doing so keep service quality levels as high as possible given the installed capacity. In addition, network agility is essential to network survivability in the face of unpredicted failures. While the MEMs based optical cross connects and add/drop multiplexers currently being introduced in transport networks are a valuable asset in enabling light path on demand provisioning and restoration, their 1 millisecond switching speeds are too slow to perform statistical multiplexing at the frame or packet level. In an all-photonic network architecture that is limited to millisecond reconfiguration times and space-switching, an entire wavelength must be allocated for an extended period of time to each data flow traversing a network edge-to-edge path. As a result, the architecture is only economically feasible if each data flow is of enormous volume, demanding that the edge switches of the all-photonic network core are accumulation points of large metropolitan areas. In order to extend the photonic core closer to the edge of the network and penetrate into smaller population centers, the capacity of a wavelength must be sub-divided by incorporating time domain multiplexing on sub-microsecond time scales in the network structure. In this way, multiple, much smaller data flows can share the capacity of the same wavelength. To efficiently transport bursty traffic such as found in the Internet, fast optical switching is required to time share light paths.
2
Recently considerable attention has been directed to time division multiplexing of light paths using asynchronous optical burst switching OBS, optical packet switching (OPS) architectures, and synchronous optical time division multiplexing (OTDM) techniques as a means of increasing network agility and reach. Introducing time-domain multiplexing is very challenging because switching requests come from multiple sources and the optical space-switches must be configured correctly before the arrival of the data to be switched. Techniques including just-in-time signalling architectures for WDM burst-switched networks – JumpStart [5], optical burst switching [6, 7], slot-by-slot routing [8], and concepts introduced in this paper are emerging as candidate approaches. We argue that a variant of OTDM called synchronous slot by slot (SlxSl) switching is a viable alternative to optical burst switching (OBS) for the supporting bursty traffic in next generation all photonic transport networks. Synchronous slot switching in photonic networks by necessity requires global synchronization due to the lack of cost effective optical memory. This global synchronization requirement places restrictions on the class of network topologies that can easily support synchronous OTDM to composite star or more generally composite tree networks. Accordingly in order to evaluate and compare synchronous OTDM with other alternatives such as OBS one needs to design networks which are suitable for supporting OTDM. In this paper we address the problem of topological design and dimensioning of an AAPN. We describe the methods, models and a design tool that computes and displays near optimal designs of composite star network topologies given device costs, capacity models, and traffic demand. Apart from the design simplicity and insensitivity to traffic distribution forecast errors, optical star networks are readily amenable to the synchronization required for OTDM. The topology design tool we have developed enables a planner to examine the impact of device and architectural design decisions and device costs on the resulting network designs, equipment quantities and costs by category for different traffic demand scenarios. To this end, the paper is organized as follows. Section 2 – Building blocks and Network Architectures describes switching element configurations and circuit designs including symmetric and asymmetric circuits and 2-layer and 3-layer designs. Also included is the composite star architecture and a discussion of its properties in terms of traffic robustness and synchronization issues. Section 3 – Network Modeling and Display includes a high level description of the software tools employed to compute and display near cost optimal network designs for the various circuit design alternatives described in Section 2. Section 4 – Network Topological Design provides a description of the methods and mathematical programming formulations employed to compute near cost optimal designs. Section 5 – Traffic Demand Models describes the models employed for generating the work load traffic matrix as well as the queuing model used to dimension network links in the over provisioning case. This section is followed by Section 6 – Network Designs in which we highlight a metro and core network design result and compare their relative merits. The paper concludes with Section 7 – where the results are discussed and conclusions are drawn. 2. Building Blocks and Network Architectures
3
The building blocks of AAPNs are shown in Figure 1. Edge nodes provide the interface to legacy networks of various kinds. Traffic inbound from these existing networks is sorted by destination edge node and placed in a corresponding virtual output queue (VOQ) in order of arrival after passing through an adaptation layer that performs the necessary segmentation and framing functions. Blocks of data, in the form of slots of 10 microseconds duration are then read out from these electronic VOQ buffers, under electronic control, at the appropriate time which is governed by the scheduling algorithm and converted to an appropriate wave length in the optical domain. These optical data slots are launched into the photonic core where they are space switched at their time of arrival towards the destination edge node corresponding to the VOQ from which the data slots originated. These photonic data slots remain on the same wavelength channel throughout their journey until reaching the destination node where broadband receivers convert the received optical signal back to the electronic domain where slot reassembly is performed to reconstruct the data back to the form it had prior to entering the AAPN. The electronic data in its native form is then routed to its appropriate destination legacy network. We note that there is no end to end light path in the traditional sense as data passes through a photonic time division multiplexed core switch en route. In the following Section 2A, we present optical circuit designs and discuss their relative merits. This is followed by Section 2B which provides a discussion of the composite star topologies studied in this work. 2A. Transmitter, Receiver and Switching Options and Synchronization Requirements As shown in Figure 1, several alternative optical circuit designs and switching architectures are feasible which are distinguished according to the transmitter type employed: (fixed or tunable lasers); the receiver type: (broadband or narrowband receivers) and; switch building blocks: (symmetric or asymmetric). In the following description, we refer to the upstream direction as the path taken from transmitter (E/O) to core switch, and the downstream direction as the path taken from core switch to receiver (O/E). In the symmetric design (constructed from Figures 1a, 1b, and 1d) the elements in the circuit path in both upstream and downstream directions are symmetrical with respect to the core switch. In the contrasting asymmetric circuit design (constructed from Figures 1a, 1c, and 1d) the upstream transmission path is not the inverse of the downstream transmission path, i.e. not symmetrical with respect to the core switch. For the asymmetric case, a circuit in the upstream direction shown in more detail in Figure 2 comprises an: E/O, fixed laser; Fiber; Lambda multiplexer; Fiber; Lambda demultiplexer, Core layered space switch. For the downstream direction one has: Core switch, Lambda multiplexer; Fiber; Lambda demultiplexer, Layered selector, Lambda multiplexer; Fiber; Broadband O/E converter at edge node. Several advantages of such a design follow:
• There is no need to synchronize time slots in distinct layers (colors) in the core switches or selectors (potentially less complex and costly).
4
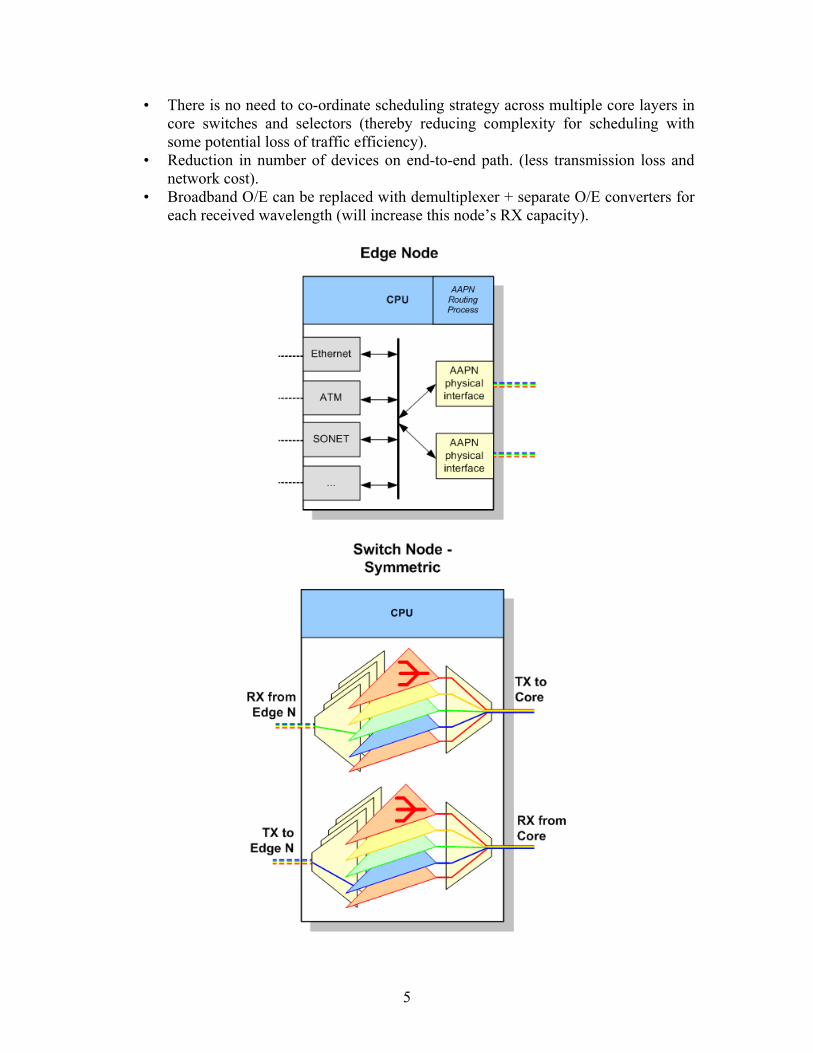
• There is no need to co-ordinate scheduling strategy across multiple core layers in core switches and selectors (thereby reducing complexity for scheduling with some potential loss of traffic efficiency).
• Reduction in number of devices on end-to-end path. (less transmission loss and network cost).
• Broadband O/E can be replaced with demultiplexer + separate O/E converters for each received wavelength (will increase this node’s RX capacity).
5
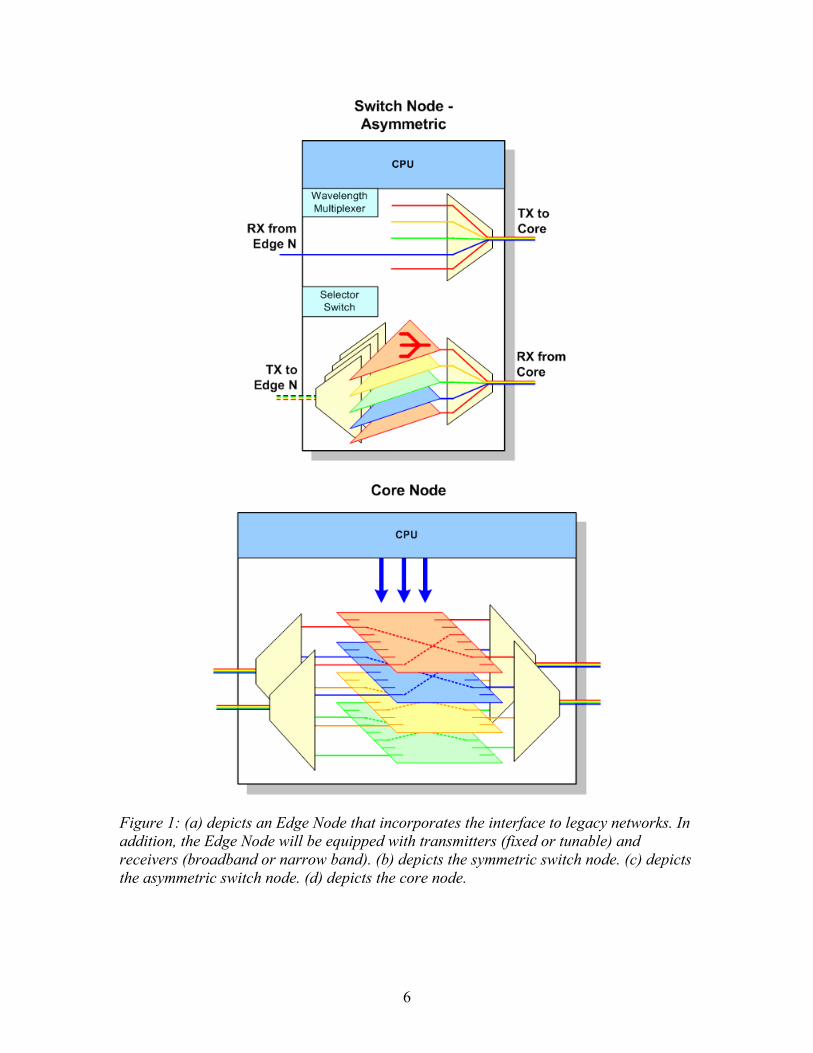
Figure 1: (a) depicts an Edge Node that incorporates the interface to legacy networks. In addition, the Edge Node will be equipped with transmitters (fixed or tunable) and receivers (broadband or narrow band). (b) depicts the symmetric switch node. (c) depicts the asymmetric switch node. (d) depicts the core node.
6
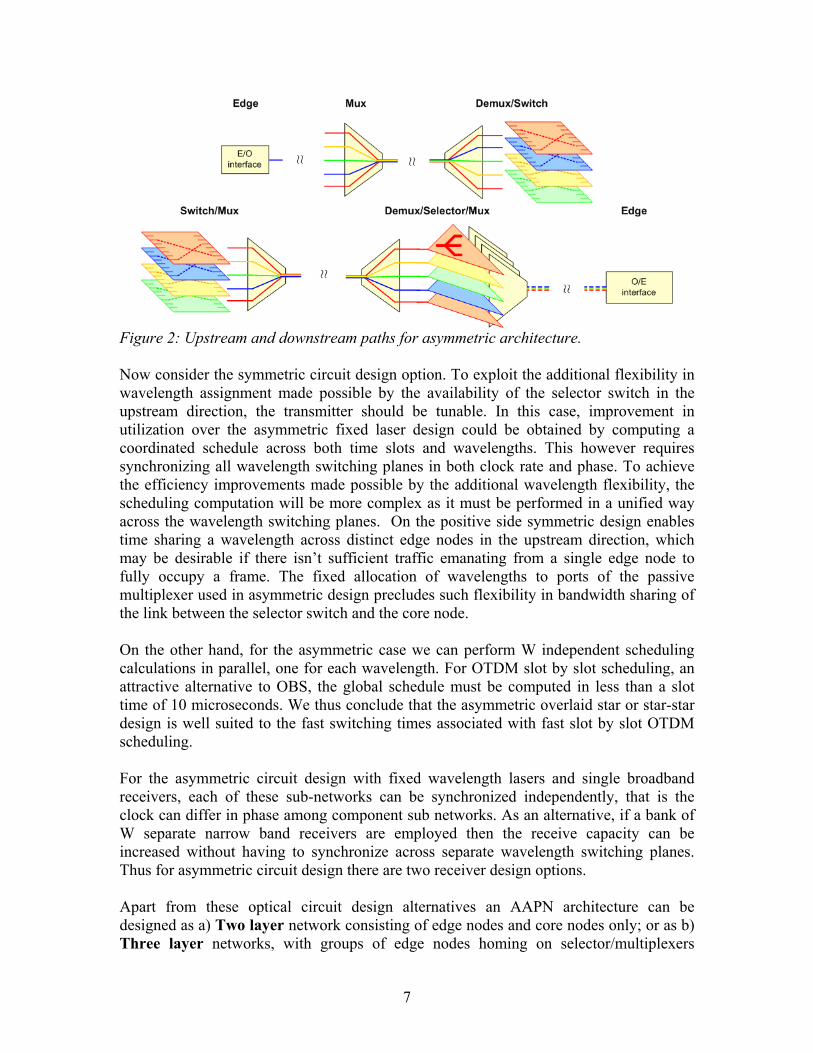
Figure 2: Upstream and downstream paths for asymmetric architecture. Now consider the symmetric circuit design option. To exploit the additional flexibility in wavelength assignment made possible by the availability of the selector switch in the upstream direction, the transmitter should be tunable. In this case, improvement in utilization over the asymmetric fixed laser design could be obtained by computing a coordinated schedule across both time slots and wavelengths. This however requires synchronizing all wavelength switching planes in both clock rate and phase. To achieve the efficiency improvements made possible by the additional wavelength flexibility, the scheduling computation will be more complex as it must be performed in a unified way across the wavelength switching planes. On the positive side symmetric design enables time sharing a wavelength across distinct edge nodes in the upstream direction, which may be desirable if there isn’t sufficient traffic emanating from a single edge node to fully occupy a frame. The fixed allocation of wavelengths to ports of the passive multiplexer used in asymmetric design precludes such flexibility in bandwidth sharing of the link between the selector switch and the core node. On the other hand, for the asymmetric case we can perform W independent scheduling calculations in parallel, one for each wavelength. For OTDM slot by slot scheduling, an attractive alternative to OBS, the global schedule must be computed in less than a slot time of 10 microseconds. We thus conclude that the asymmetric overlaid star or star-star design is well suited to the fast switching times associated with fast slot by slot OTDM scheduling. For the asymmetric circuit design with fixed wavelength lasers and single broadband receivers, each of these sub-networks can be synchronized independently, that is the clock can differ in phase among component sub networks. As an alternative, if a bank of W separate narrow band receivers are employed then the receive capacity can be increased without having to synchronize across separate wavelength switching planes. Thus for asymmetric circuit design there are two receiver design options. Apart from these optical circuit design alternatives an AAPN architecture can be designed as a) Two layer network consisting of edge nodes and core nodes only; or as b) Three layer networks, with groups of edge nodes homing on selector/multiplexers
7
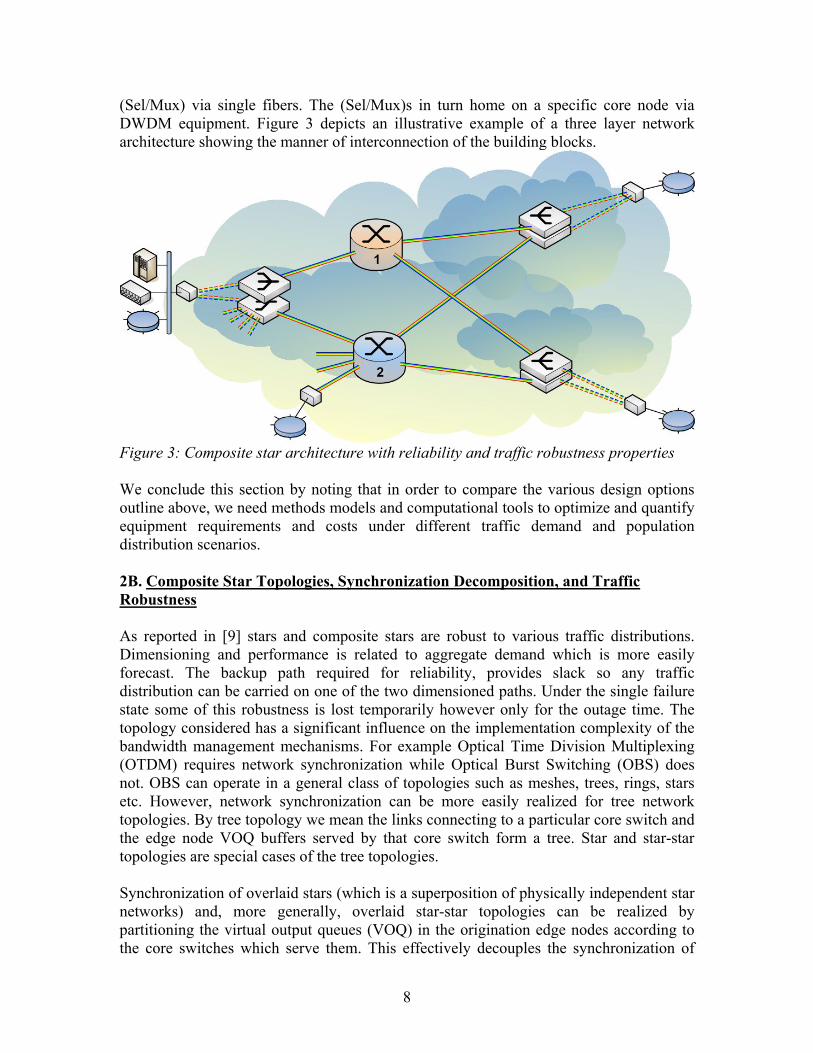
(Sel/Mux) via single fibers. The (Sel/Mux)s in turn home on a specific core node via DWDM equipment. Figure 3 depicts an illustrative example of a three layer network architecture showing the manner of interconnection of the building blocks.
Figure 3: Composite star architecture with reliability and traffic robustness properties We conclude this section by noting that in order to compare the various design options outline above, we need methods models and computational tools to optimize and quantify equipment requirements and costs under different traffic demand and population distribution scenarios. 2B. Composite Star Topologies, Synchronization Decomposition, and Traffic Robustness As reported in [9] stars and composite stars are robust to various traffic distributions. Dimensioning and performance is related to aggregate demand which is more easily forecast. The backup path required for reliability, provides slack so any traffic distribution can be carried on one of the two dimensioned paths. Under the single failure state some of this robustness is lost temporarily however only for the outage time. The topology considered has a significant influence on the implementation complexity of the bandwidth management mechanisms. For example Optical Time Division Multiplexing (OTDM) requires network synchronization while Optical Burst Switching (OBS) does not. OBS can operate in a general class of topologies such as meshes, trees, rings, stars etc. However, network synchronization can be more easily realized for tree network topologies. By tree topology we mean the links connecting to a particular core switch and the edge node VOQ buffers served by that core switch form a tree. Star and star-star topologies are special cases of the tree topologies. Synchronization of overlaid stars (which is a superposition of physically independent star networks) and, more generally, overlaid star-star topologies can be realized by partitioning the virtual output queues (VOQ) in the origination edge nodes according to the core switches which serve them. This effectively decouples the synchronization of
8
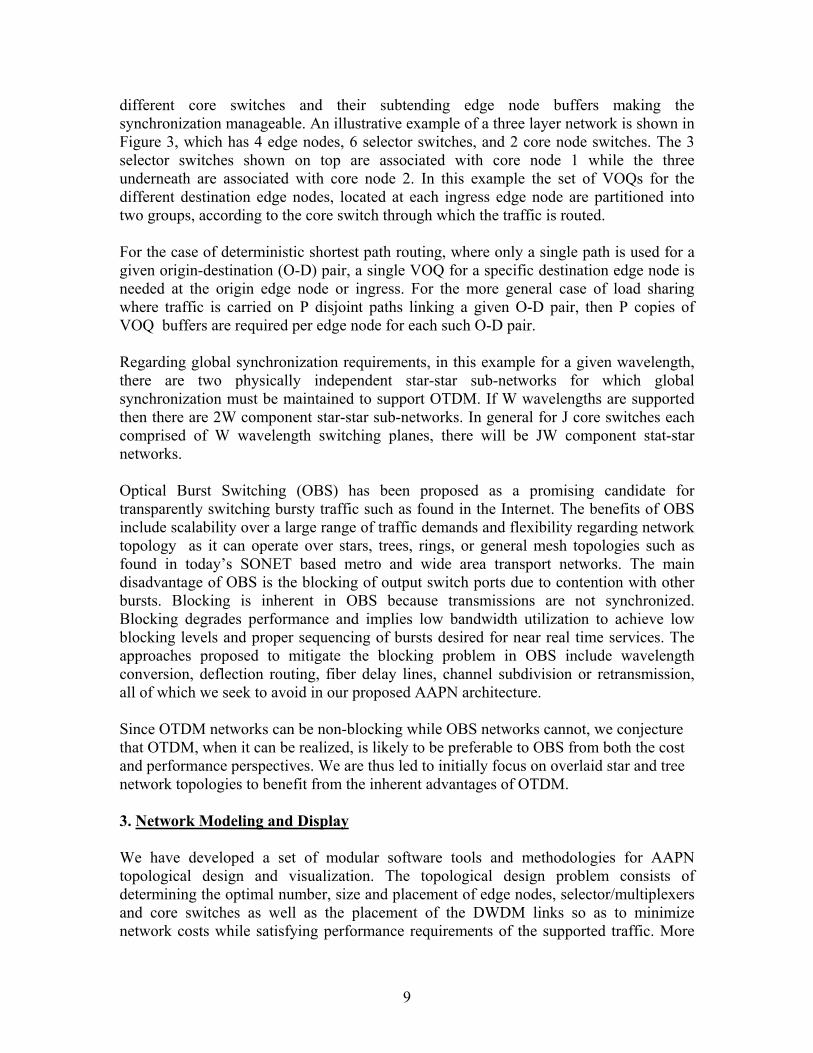
different core switches and their subtending edge node buffers making the synchronization manageable. An illustrative example of a three layer network is shown in Figure 3, which has 4 edge nodes, 6 selector switches, and 2 core node switches. The 3 selector switches shown on top are associated with core node 1 while the three underneath are associated with core node 2. In this example the set of VOQs for the different destination edge nodes, located at each ingress edge node are partitioned into two groups, according to the core switch through which the traffic is routed. For the case of deterministic shortest path routing, where only a single path is used for a given origin-destination (O-D) pair, a single VOQ for a specific destination edge node is needed at the origin edge node or ingress. For the more general case of load sharing where traffic is carried on P disjoint paths linking a given O-D pair, then P copies of VOQ buffers are required per edge node for each such O-D pair. Regarding global synchronization requirements, in this example for a given wavelength, there are two physically independent star-star sub-networks for which global synchronization must be maintained to support OTDM. If W wavelengths are supported then there are 2W component star-star sub-networks. In general for J core switches each comprised of W wavelength switching planes, there will be JW component stat-star networks. Optical Burst Switching (OBS) has been proposed as a promising candidate for transparently switching bursty traffic such as found in the Internet. The benefits of OBS include scalability over a large range of traffic demands and flexibility regarding network topology as it can operate over stars, trees, rings, or general mesh topologies such as found in today’s SONET based metro and wide area transport networks. The main disadvantage of OBS is the blocking of output switch ports due to contention with other bursts. Blocking is inherent in OBS because transmissions are not synchronized. Blocking degrades performance and implies low bandwidth utilization to achieve low blocking levels and proper sequencing of bursts desired for near real time services. The approaches proposed to mitigate the blocking problem in OBS include wavelength conversion, deflection routing, fiber delay lines, channel subdivision or retransmission, all of which we seek to avoid in our proposed AAPN architecture. Since OTDM networks can be non-blocking while OBS networks cannot, we conjecture that OTDM, when it can be realized, is likely to be preferable to OBS from both the cost and performance perspectives. We are thus led to initially focus on overlaid star and tree network topologies to benefit from the inherent advantages of OTDM. 3. Network Modeling and Display We have developed a set of modular software tools and methodologies for AAPN topological design and visualization. The topological design problem consists of determining the optimal number, size and placement of edge nodes, selector/multiplexers and core switches as well as the placement of the DWDM links so as to minimize network costs while satisfying performance requirements of the supported traffic. More
9
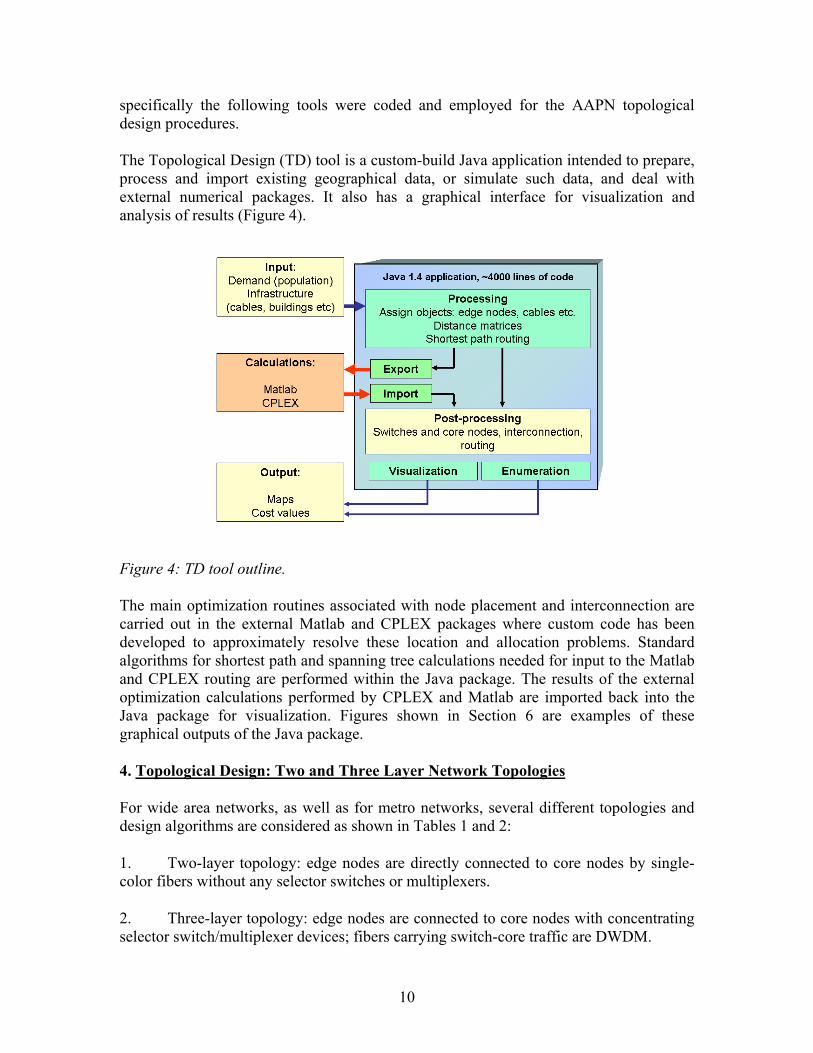
specifically the following tools were coded and employed for the AAPN topological design procedures. The Topological Design (TD) tool is a custom-build Java application intended to prepare, process and import existing geographical data, or simulate such data, and deal with external numerical packages. It also has a graphical interface for visualization and analysis of results (Figure 4).
Figure 4: TD tool outline. The main optimization routines associated with node placement and interconnection are carried out in the external Matlab and CPLEX packages where custom code has been developed to approximately resolve these location and allocation problems. Standard algorithms for shortest path and spanning tree calculations needed for input to the Matlab and CPLEX routing are performed within the Java package. The results of the external optimization calculations performed by CPLEX and Matlab are imported back into the Java package for visualization. Figures shown in Section 6 are examples of these graphical outputs of the Java package. 4. Topological Design: Two and Three Layer Network Topologies
For wide area networks, as well as for metro networks, several different topologies and design algorithms are considered as shown in Tables 1 and 2:
1. Two-layer topology: edge nodes are directly connected to core nodes by single-color fibers without any selector switches or multiplexers.
2. Three-layer topology: edge nodes are connected to core nodes with concentrating selector switch/multiplexer devices; fibers carrying switch-core traffic are DWDM.
10

Common part Edge node allocation based on population information Cabling infrastructure simulation based on modified spanning tree
2-layer network problem Connect edges to core nodes
MAN: 300 edges to 1..6 cores:
L.R., Enumeration
3-layer network problem Connect edges to switches
WAN: 1024 edges to 64 (or more) switches: 128 edges to 8 switches
MAN: 300 edges to 10,19,38 switches 96 edges to 6 switches Connect switches to core nodes
WAN: 64 (or more) switches to 1…6 core nodes MAN: 19 switches to 1…6 core nodes
S.A., L.R., CPLEX S.A., L.R., CPLEX * L.R.+CPLEX L.R.+CPLEX, S.A., CPLEX* L.R., Enumeration L.R., Enumeration
Table 1. Solution methodology Algorithm Cost Calc. time Edge connectivity WAN 1024x64 WAN 1024x67 WAN 128x8 MAN 300x19 MAN 96x6
S.A. CPLEX L.R. +CPLEX S.A. CPLEX L.R. L.R. +CPLEX S.A. CPLEX
41681 34548 22172 to 20245 20083 20020 167300 71100 to 68500 68300 68300
12 hours 1.5 hours 5 min. 7 min. 25 min. 2 min. 5 min 12 min. 3 min.
Core connectivity MAN 19x1…6 WAN 67x1…6
L.R. Enumeration L.R.
1673138 1673138 1.51*109
1 min. 30 sec. 6 hours
Table 2. Computation complexity and cost values
11

Given the initial location of edge nodes as well as possible fiber path/conduit infrastructure, topology, the design process consists of determining the optimum number, placement and interconnection pattern for core nodes and selector/multiplexer switches (3-layer and hybrid case only) to minimize overall cost subject to a set of given constraints. Such problems are well-known in the Operation Research literature and are referred as plant location problems.
In particular, the placement and interconnection of fixed port count, fixed number of selector switch nodes is referred as a Single Source Capacitated Plant Location Problem (SS-CPLP) [10]. It was solved by the Mixed Integer Linear Programming (MILP) method (CPLEX), Lagrangean Relaxation (L.R.) and simulated annealing (S.A.) (Matlab). For the MILP case, there is an artificial limit on problem size due to computational complexity of direct algorithm. The accuracy of our programming implementation of heuristic methods was verified with MILP on smaller subsets. We found that in most cases LR and SA were able to obtain an exact solution for a given problem. L.R. + CPLEX mean initial solution computed by Lagrangean Relaxation with improvement phase uses Hamburger location-allocation heuristic using CPLEX. For WAN networks it was also possible to reduce the complexity of the problem by explicitly positioning most of the required switch nodes at cities where the number of installed edge nodes is large.
A Lagrangean relaxation method was also used to solve the PLP in the uncapacitated case; here we allow spare ports at the selector switch and as a result possibly more devices. Some effort was made to try different numbers of ports per switch or to allow several types of switches (e.g. 8-, 16- and 32-port devices within the same network).
For given selector/multiplexer switch locations, the core node location and interconnection problem arises. Again, the LR method and the enumeration method (for small number of core nodes) were used. Compared with the previous plant location problem, this has a different formulation as follows:
( ) ( )_1 1 1 1 1 1
minJ J N N N J
jj ij coreIF MUX ij ij jk ik ik
j j i i k jz Ccore c d C y d d wλ α
= = = = = =
⎛ ⎞⋅ + ⋅ + ⋅ + +⎜ ⎟
⎝ ⎠∑ ∑∑ ∑∑∑
subject to the capacity constraint and traffic demand matrix for shortest path routing in
both inbound and outbound directions given below:
JjNkiJ
j
jik ...1,...1,1
1===∑
=
α (1)
JjNkiyNN
k
jikij ...1,...1, ==≥⋅ ∑
=
α1
(2)
12

JjNkizNN
k
jik
N
ij ...1,...1,
11
2 ==≥⋅ ∑∑==
α (3)
{ } { } { }2J variables N*J variables N *J variables
0,1 , 0,1 , 0,1 , 1... , 1...jj ij ikz y i k N jα∈ ∈ ∈ = =
1424314243 14243J
This formulation can be used directly in the 2-layered design where the edge node locations are given. In the three layer design problem we employ a decomposition of the three layer problem into sequential two-layer problem. First we locate selector switches given edge node locations using the capacitated plant location problem. Then given these selector switch locations we locate core switches and the interconnection pattern using our formulation given above for the two-layer design problem. In the following description, we will use the 3-layer case to explain the method in detail.
For stage two of the three layer design the formulation starts with the aggregated traffic sources (SEL/MUXes) i, where i=1…N is the SEL/MUX index in the set of N SEL/MUXs. The amount of traffic generated per source SEL/MUX is known from the allocation of edge nodes to SEL/MUXin stage 1. We use to denote traffic demands between SEL/MUX i and SEL/MUX k, is denoted by λik. For the designs presented in this paper we have assumed that the traffic is symmetric, i.e. inbound and outbound bit rates of SEL/MUX i are equal. In general asymmetric traffic demand is modeled in our formulation.
The core node existence is denoted by a vector of binary variables zj, j=1…J, where in general J<=N. J is set equal to N in our current design. The start-up cost for each core node is denoted by Ccore and the interface cost to connect the SEL/MUX is denoted by CcoreIF_MUX. This cost model could be useful in a customized design of the core switches for a particular application. In another case, we can also suppose that the core switch has already been designed and has a fixed cost for the fully equipped device. In this second situation, CcoreIF_MUX would be 0 and Ccore would be larger.
The distance between SEL/MUX i, and core node j is given by dij. In practice, actual length of cable routes linking SEL/MUXs and core nodes would be used instead, where a cable routes already exist. Variables yij denote the connections between SEL/MUXes and cores. yij=1 if there is a connection between core node j and SEL/MUX i and 0 otherwise. Variable [ ]0,1j
ikα ∈ represents the proportion of traffic from SEL/MUX i to SEL/MUX k routed through core node j. For shortest path routing, traffic between a given SEL/MUX pair (i,k) follows the shortest path. Hence 1j
ikα = if traffic from SEL/MUX i to SEL/MUX k is routed through core node j and 0 otherwise. In general for load shared routing . 10 ≤≤ j
ikα
Lagrangean relaxation.
13

For large network design problems a direct solution to the above MLIP by CPLEX is not feasible. Accordingly we have formulated a Lagrangean relaxation to approximate the optimal solution in the following paragraphs.
By relaxing constraints (2) and (3), the Lagrangean function is as follows:
( )
( ) ( )_1 1 1 1 1 1
2
1 1 1 1 1 1
, , , ,jj ij ik ij j
J J N N N Jj
j ij coreIF MUX ij ij jk ik ikj j i i k j
N J N J N Nj j
ij ik ij j ik ji j k j i k
L z y
z Ccore c d C y d d w
N y N z
α µ σ
λ α
µ α σ α
= = = = = =
= = = = = =
⎡ ⎤⎛ ⎞+ ⋅ + ⋅ + +⎢ ⎥⎜ ⎟
⎝ ⎠⎢ ⎥= ⎢ ⎥⎛ ⎞ ⎛ ⎞⎢ ⎥+ ⋅ − ⋅ + ⋅ − ⋅⎜ ⎟ ⎜ ⎟⎢ ⎥⎝ ⎠ ⎝ ⎠⎣ ⎦
∑ ∑∑ ∑∑∑
∑∑ ∑ ∑ ∑∑
Subject to: 1
1J
jik
jα
=
=∑
{ } { } { }2var * var var
0,1 , 0,1 , 0,1 , 1... , 1...jj ij ik
J iables N J iables N J iables
z y i k N jα∗
∈ ∈ ∈ = =1424314243 14243
J
ik
ij⋅
Rearranging the above Lagrangean leads to the minimization problem of the dual function:
( )
( ) ( )
( )
2_
1 1 1
1 1 1
,
minmin
min
ijj
j
ij j
J J N
j j ij coreIF MUX ijyz j j i
N N Jj
ij jk ik ij j iki k j
W
Ccore N z c d C N y
d d wα
µ σ
σ µ
λ µ σ α
= = =
= = =
= − ⋅ ⋅ + ⋅ + − ⋅
⎧ ⎫⎡ ⎤+ + ⋅ + + ⋅⎨ ⎬⎣ ⎦⎩ ⎭
∑ ∑∑
∑∑∑
Subject to . 1
1J
jik
jα
=
=∑
First considering the variables zj, j=1…J, let zj•(n) denote the optimum value of zj in
iteration (n).
Then, ( )2*( ) 1 0
0jn
j
Ccore Nz
otherwise
σ⎧ − ⋅ <⎪= ⎨⎪⎩
There are J separate minimizations to do for each value of zj.
14

Similarly, ( )_*( ) 1 0
0ij coreIF MUX ijn
ij
c d C Ny
otherwise
µ⎧ ⋅ + − ⋅ <⎪= ⎨⎪⎩
Notice that the last term is a much simpler optimization problem.
( )1 1 1
minj
ik
N N Jj
ij jk ik ij j iki k j
d d wα
λ µ σ α= = =
⎡ ⎤+ ⋅ + + ⋅⎣ ⎦∑∑∑
Subject to: . 1
1J
jik
jα
=
=∑
We can solve it by the following simple method:
For a specific multiplexer pair (i,k), we should minimize
( )1
Jj
ij jk ik ij j ikj
d d wλ µ σ α=
⎡ + ⋅ + + ⋅⎣∑ ⎤⎦ with respect to jikα , subject to: . Since
11
Jj
ikjα
=
=∑ jikα
can only be 0 or 1, we calculate ( ) , 1...ij jk ik ij jd d w jλ µ σ⎡ + ⋅ + + =⎣ J⎤⎦ and find the
minimal for each j. Then the corresponding *jikα =1, and all the others =0.
In this manner, one obtains . *( )j nikα
Inserting these values into the Lagrangean function gives the dual
function value at the current iteration. Its value gives a current lower bound.
( *( ) *( ) *( ), ,n n j nj ij ikz y α ))( ( ) ( ),n n
ij jW µ σ
Notice that there is no longer a dependency between jikα and , in the constraints. In
this case, we decoupled the problem into three independent optimization problems, corresponding to the three terms in the dual function.
,j iz y j
Iterations for the optimization problem:
In the current iteration, we know the correct values of the multipliers ,ij jµ σ . Using these multipliers, we then perform the minimizations one by one for each multiplier.
Taking partial derivatives with respect to the dual variables jσ and ijµ gives a sub-gradient:
( )2 *( ) *( )
1 11...
n N Nn j n
j iki kj
W N z j Jασ = =
∂= − ⋅ + =
∂ ∑∑ (J equations altogether)
15
( )*( ) *( )
11... 1...
n Nn j n
ij ikkij
W N y i N j Jαµ =
∂= − ⋅ + = =
∂ ∑ (N*J equations altogether)
Let π denote a vector of all dual variables, i.e. . In this simplified
notation we state the update rule as
{ },ij j i jπ µ σ∆
= ,∀
( 1) ( )( )( )max ,0n n
n nWt ππ ππ
+ ∂⎧ ⎫= +⎨ ⎬∂⎩ ⎭, where (n+1)
denotes (n+1)st. iteration, is the step size, which is a constant for all variables at iteration n. The step size is computed from the equation:
nt
nt
( )( )( )
2( )
( )
( )
n
n n
n
W Wt
W
ρ π
ππ
−=
∂∂
Here W is the best upper bound which we calculated before (i.e. ), while is the current lower bound. ρ is the coefficient defined to adjust step size. If there is no progress for a threshold number or iterations reduce the step size and continue until a stopping criterion is met.
bestF ( )( )nW π
Two topological design approaches have been investigated which we refer to as follows: (1) Integrated Network Design, (IND); and (2) Tiered Network Design, (TND). In the IND approach, the entire network topology, including metropolitan and wide area is determined in an integrated fashion, given the population distribution and traffic model. In this approach we employ a weighted objective function criterion consisting of network cost and network performance components. The appropriate value of the relative weights applied to the cost and performance terms in the scalar objective function is determined by a multi-criterion optimization methodology. This approach treats all traffic sources in a homogeneous manner attempting to minimize overall network cost while minimizing average point-to-point propagation delay, the principle source of performance impairment. In the TND approach, we apply a tiered design methodology, whereby we design the local (metro) areas first, then regional networks and finally the national network. While this approach can result in somewhat larger network costs than the IND approach, it will tend to provide a more uniform point-to-point propagation delay within the component networks. For example metro networks will have low propagation delay among all edge nodes within the metro area. This design approach would then facilitate the support of services requiring low propagation delay within a metro region, which could not be achieved in a national network due to the distances involved. The IND approach requires determining a weighting factor; w, which accounts for the relative importance of the two criteria, cost and delay when selecting the optimal network topology. Viewing this as a multi criterion problem we plot below the Pareto Boundary [11] by varying w over a wide range of values which will impact the number of core switches in the optimized design.
16
The principle source of performance impairment which is dependent upon the network topology is the propagation delay which is given by
( )75.02 ⋅⋅
+⋅=∑∑∑
cN
dddelay i j k
jkijj
ikα
The portion of network cost which is topology dependent is given by the following core node and fiber cost expressions.
Core node cost: including start up equipment cost + interface cost
_1 1 1
J J N
j coreIFj j i
z Ccore C y= = =
⋅ + ⋅∑ ∑∑ MUX ij
Fiber cost: For the assumed traffic and the affine fiber cost model used it turns out that
when w=3000 is used, the expression is the
estimated fiber cost.
( )1 1 1 1 1
J N N N Jj
ij ij ij jk ik ikj i i k j
c d y d d wλ α= = = = =
⋅ ⋅ + +∑∑ ∑∑∑
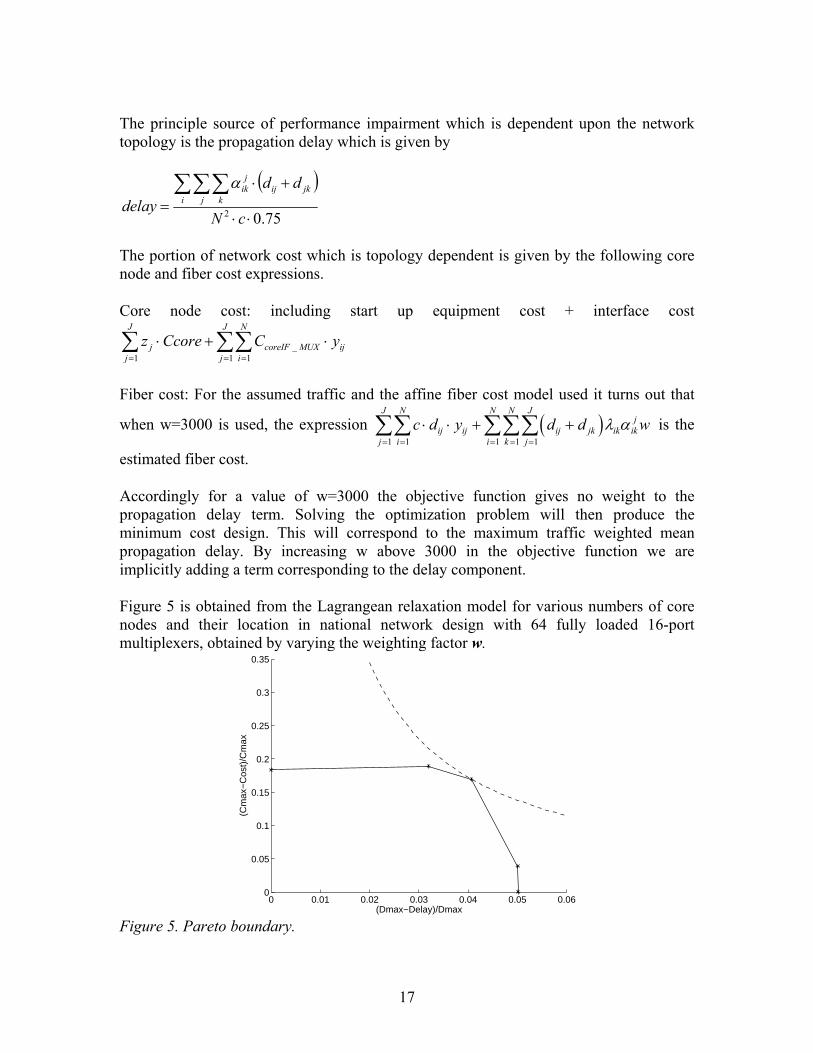
Accordingly for a value of w=3000 the objective function gives no weight to the propagation delay term. Solving the optimization problem will then produce the minimum cost design. This will correspond to the maximum traffic weighted mean propagation delay. By increasing w above 3000 in the objective function we are implicitly adding a term corresponding to the delay component. Figure 5 is obtained from the Lagrangean relaxation model for various numbers of core nodes and their location in national network design with 64 fully loaded 16-port multiplexers, obtained by varying the weighting factor w.
0 0.01 0.02 0.03 0.04 0.05 0.060
0.05
0.1
0.15
0.2
0.25
0.3
0.35
(Dmax−Delay)/Dmax
(Cm
ax−
Cos
t)/C
max
Figure 5. Pareto boundary.
17

The non monotonic behaviour of the Pareto boundary is due to the fact that a heuristic near optimal solution as opposed to the true optimum design was used in drawing the figure for practical reasons. A Nash Arbitration Strategy (NAS) for this two criterion problem would then correspond to the point where the red curve, the product on the two design criteria is maximized. For multi criterion problems with weighted costs such a point represents a reasonable compromise between the two antithetic criteria, minimum cost and minimum delay design. We observe however that in the case of this particular wide area network, the extra cost incurred to achieve the NAS seems excessive for the reduction in average delay achieved. This suggests an alternative approach is preferred, where a constraint is explicitly or implicitly placed on the maximum delay. The tiered design approach represents an example where an implicit constraint is placed on maximum delay, by virtue of only including edge nodes in the design of a given tier level that span a prescribed geographical area. 5. Traffic Demand Models A gravity model for traffic distribution and a flat community of interest factor was assumed in the study. We justify this simple traffic model on the following basis. Published reports on the two most significant sources of traffic found in current networks, namely the telephone network (α→2) [12] and the Internet (α→0) [13] conform to the gravity model. The flat gravity based traffic model was selected initially to exercise our topological design tools in the absence of more accurate and service specific traffic models likely to be present in the “network of the future”. As better traffic models become available for these “services of the future”, such as various peer to peer services, multi-media streaming, content distribution, grid computing, etc. they can be easily incorporated in our AAPN topological design tools and procedures because of the modular structure we employed in the network and traffic modeling and the software implementation. The traffic demand matrix is given by the gravity model as follows.
( ) ⎥⎥⎦
⎤
⎢⎢⎣
⎡ ⋅= 0
,, λλ α
ji
jiji d
II, where:
λi,j – demand between nodes i and j, Ii and Ij – “importance factor” assigned to nodes i or j, for example, population, λ 0 – normalized demand unit, di,j – distance between nodes i and j, α – power parameter
The traffic demand matrix is governed by the size of the originating area served by the edge node and the size of the terminating area served by the receiving edge node. By design we choose these catchments so that the traffic demand matrix is flat. Alternatively if they correspond to existing building locations and areas served by then (wire centers), then one can place a certain number on edge switches at each location so that the amount served by each one is approximately equal. By doing this we simplify the design considerably as all parts have equal demand requirements, simplifying design as well.
18

To dimension the AAPN, we need to compute the link capacity which meets the Quality of Service (QoS) requirements of the supported services given the traffic demand matrix and routing algorithm. For deterministic shortest path routing and the traffic matrix computed above we can compute link traffic demands. Next we need a queuing model to relate traffic demand, link capacity and QoS. For this purpose we have employed the following model, as we are initially designing for a single high quality service class that can potentially handle all traffic types in a single unified manner by suitably over provisioning. Traffic demand is modeled as a set of stochastic processes (active flows at time t): ( )tAφ . The mean rate of the process is given by ( ( ))tF E Atφ= . The line speed is C, and is the largest component flow. Farago [14] has deduced a bound which is tight in the sense that worst case traffic processes are assumed to be offered.
maxB
If C>Ft, the following bound holds for the probability of the demand exceeding capacity:
( ( ) ) t
CC Ft
tFP A C eC
φ −⎛ ⎞≥ ≤ ⎜ ⎟⎝ ⎠
where C and Ft are expressed in units of Bmax. Farago’s bound was derived for a pure blocking system. We can anticipate that adding “small” buffers should only reduce the blocking rate, so Fargo’s bound will hold with strict inequality. As we are assuming single best effort traffic class we provision to get the loss probability sufficiently low. The OPNET Modeler discrete-event simulator was employed to investigate the performance characteristics of a simple version of Optical Burst Switching (OBS) and two variations of Optical Time Division Multiplexing (OTDM) scheduling schemes, referred to as statistical Slot by Slot scheduling and deterministic Round Robin scheduling. These three classes of resource sharing methods differ in the manner and degree of co-ordination of resource allocation between the edge nodes and the core switches. We have evaluated the various resource sharing schemes for the case where a single high quality best effort service class supports all offered traffic types. Small buffers are employed at the edge nodes to provide acceptable delay performance for an appropriately small designed level of buffer overflow. Our simulation results show that the OTDM schemes compare favourably with OBS in terms of packet loss and bandwidth utilization while keeping packet delay sufficiently low to meet real time QoS requirements.
The Slot by Slot scheduling approach has been shown to be robust to variations in traffic distribution and can achieve high bandwidth efficiency with acceptably low buffer overflow probability. Accordingly it may be suitable for Metropolitan Area Network applications. The fixed Round Robin scheduling method is less robust to variations in traffic demand distribution as one would expect, however it avoids the need for signalling and reservation at the time slot level and as a result will yield better delay performance than is possible with the slot by slot scheme. The traffic robustness of the round robin
19
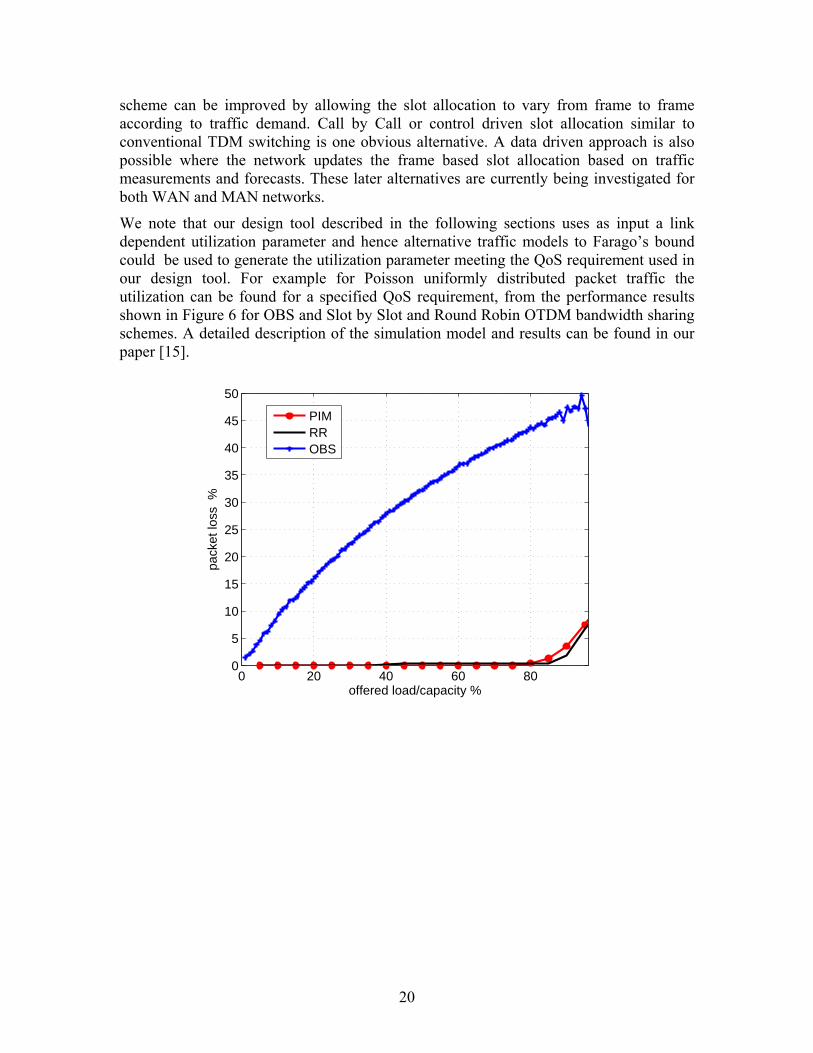
scheme can be improved by allowing the slot allocation to vary from frame to frame according to traffic demand. Call by Call or control driven slot allocation similar to conventional TDM switching is one obvious alternative. A data driven approach is also possible where the network updates the frame based slot allocation based on traffic measurements and forecasts. These later alternatives are currently being investigated for both WAN and MAN networks.
We note that our design tool described in the following sections uses as input a link dependent utilization parameter and hence alternative traffic models to Farago’s bound could be used to generate the utilization parameter meeting the QoS requirement used in our design tool. For example for Poisson uniformly distributed packet traffic the utilization can be found for a specified QoS requirement, from the performance results shown in Figure 6 for OBS and Slot by Slot and Round Robin OTDM bandwidth sharing schemes. A detailed description of the simulation model and results can be found in our paper [15].
0 20 40 60 800
5
10
15
20
25
30
35
40
45
50
offered load/capacity %
pack
et lo
ss %
PIMRROBS
20
0 20 40 60 801
2
3
4
5
6
7
8
9
10x 10
−4
offered load/capacity %
end
to e
nd d
elay
s
ec
PIMRROBS
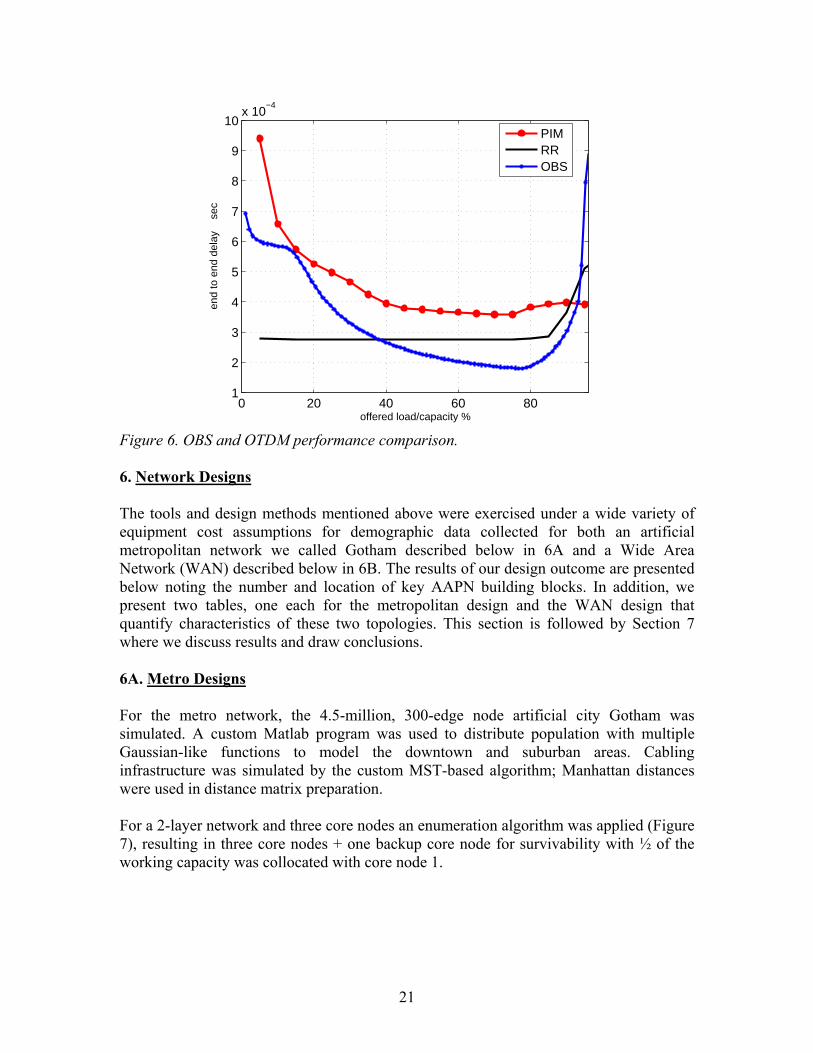
Figure 6. OBS and OTDM performance comparison. 6. Network Designs The tools and design methods mentioned above were exercised under a wide variety of equipment cost assumptions for demographic data collected for both an artificial metropolitan network we called Gotham described below in 6A and a Wide Area Network (WAN) described below in 6B. The results of our design outcome are presented below noting the number and location of key AAPN building blocks. In addition, we present two tables, one each for the metropolitan design and the WAN design that quantify characteristics of these two topologies. This section is followed by Section 7 where we discuss results and draw conclusions. 6A. Metro Designs For the metro network, the 4.5-million, 300-edge node artificial city Gotham was simulated. A custom Matlab program was used to distribute population with multiple Gaussian-like functions to model the downtown and suburban areas. Cabling infrastructure was simulated by the custom MST-based algorithm; Manhattan distances were used in distance matrix preparation. For a 2-layer network and three core nodes an enumeration algorithm was applied (Figure 7), resulting in three core nodes + one backup core node for survivability with ½ of the working capacity was collocated with core node 1.
21
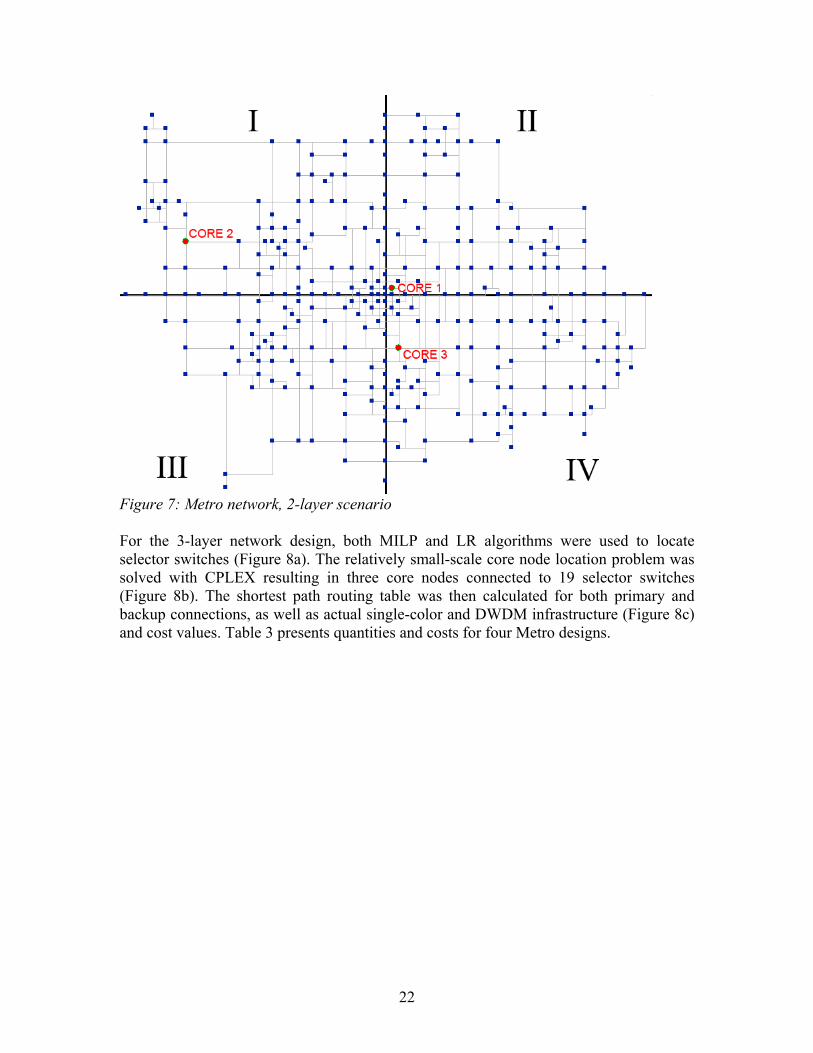
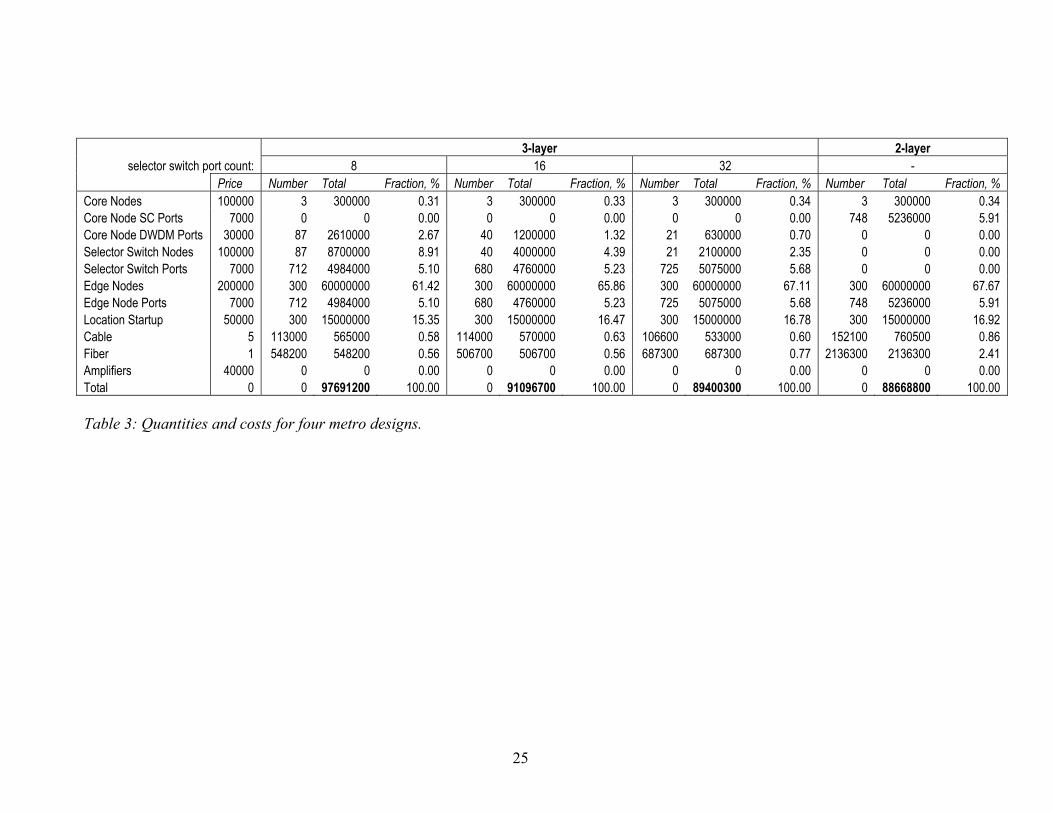
Figure 7: Metro network, 2-layer scenario For the 3-layer network design, both MILP and LR algorithms were used to locate selector switches (Figure 8a). The relatively small-scale core node location problem was solved with CPLEX resulting in three core nodes connected to 19 selector switches (Figure 8b). The shortest path routing table was then calculated for both primary and backup connections, as well as actual single-color and DWDM infrastructure (Figure 8c) and cost values. Table 3 presents quantities and costs for four Metro designs.
22
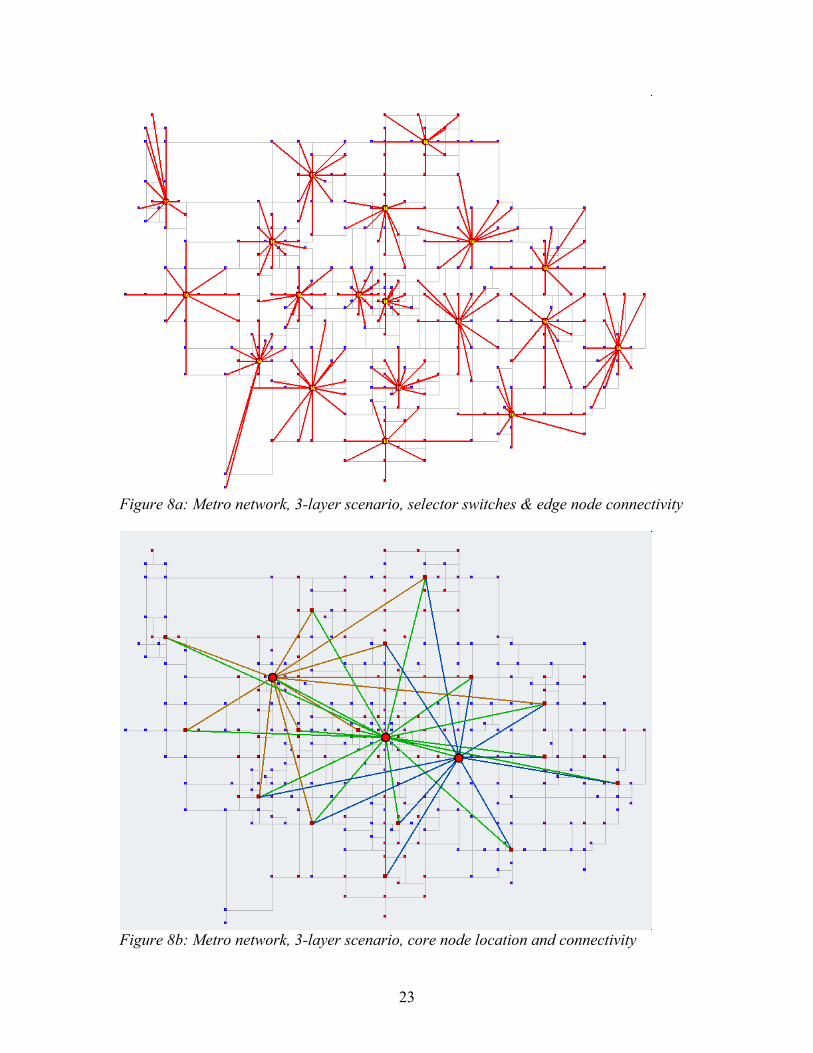
Figure 8a: Metro network, 3-layer scenario, selector switches & edge node connectivity
Figure 8b: Metro network, 3-layer scenario, core node location and connectivity
23
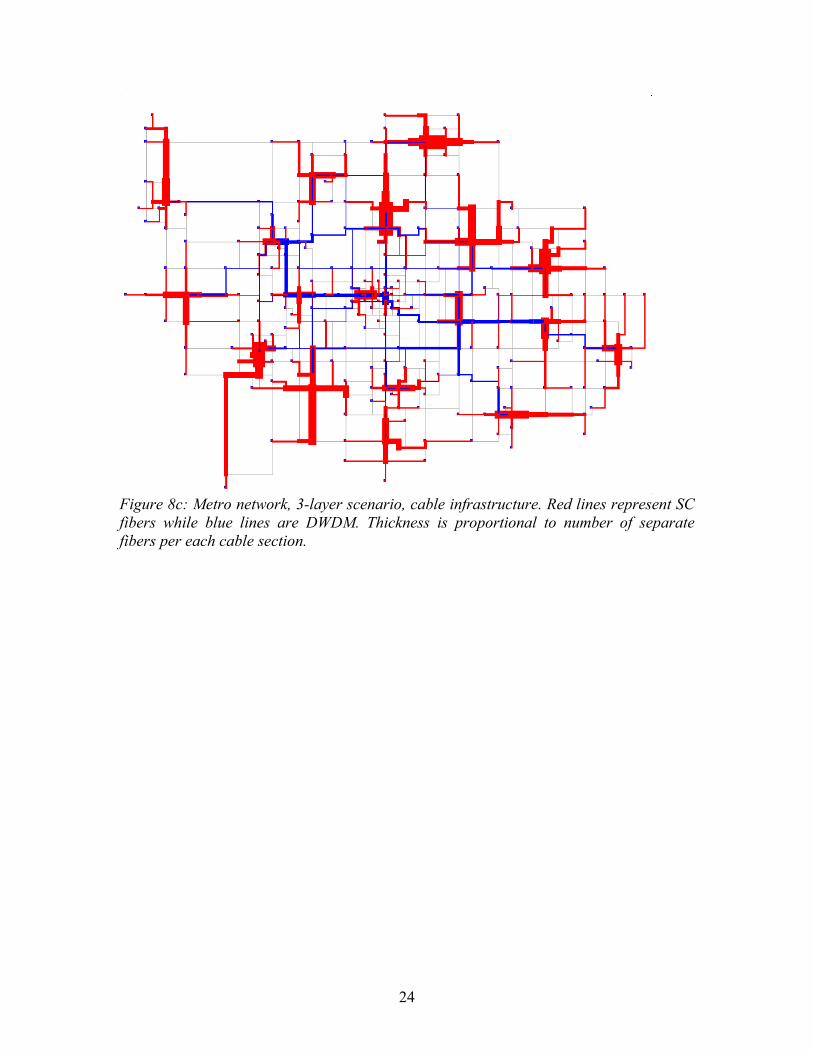
Figure 8c: Metro network, 3-layer scenario, cable infrastructure. Red lines represent SC fibers while blue lines are DWDM. Thickness is proportional to number of separate fibers per each cable section.
24
25
3-layer 2-layerselector switch port count: 8 16 32 -
Price Number Total Fraction, % Number Total Fraction, % Number Total Fraction, % Number Total Fraction, % Core Nodes 100000 3 300000 0.31 3 300000 0.33 3 300000 0.34 3 300000 0.34Core Node SC Ports 7000 0 0 0.00 0 0 0.00 0 0 0.00 748 5236000 5.91 Core Node DWDM Ports 30000 87 2610000 2.67 40 1200000 1.32 21 630000 0.70 0 0 0.00Selector Switch Nodes 100000 87 8700000 8.91 40 4000000 4.39 21 2100000 2.35 0 0 0.00Selector Switch Ports 7000 712 4984000 5.10 680 4760000 5.23 725 5075000 5.68 0 0 0.00Edge Nodes 200000 300 60000000 61.42 300 60000000 65.86 300 60000000 67.11 300 60000000 67.67Edge Node Ports 7000 712 4984000 5.10 680 4760000 5.23 725 5075000 5.68 748 5236000 5.91Location Startup 50000 300 15000000 15.35 300 15000000 16.47 300 15000000 16.78 300 15000000 16.92Cable 5 113000 565000 0.58 114000 570000 0.63 106600 533000 0.60 152100 760500 0.86Fiber 1 548200 548200 0.56 506700 506700 0.56 687300 687300 0.77 2136300 2136300 2.41Amplifiers 40000 0 0 0.00 0 0 0.00 0 0 0.00 0 0 0.00Total 0 97691200 0 100.00 0 91096700 100.00 0 89400300 100.00 0 88668800 100.00 Table 3: Quantities and costs for four metro designs.

6B: Wide Area Network (WAN) Design Actual population information as well as geographical coordinates for 140 Canadian cites were obtained from a census database. In absence of existing cabling infrastructure data we generated a representative infrastructure layout with a help of our TD Tool using a modified Minimum Spanning Tree algorithm. The Floyd-Warshall algorithm was used to compute all pairs of city-to-city distances needed for the minimization calculations. The resulting wide-area network then consists of 1024 edge nodes distributed over 140 locations using the flat traffic demand model; each edge serves around 30000 customers where each in turn is generating a 10Mbits/s data stream in both directions. Further LR calculations for solving the core node location problem resulting in the final topology were carried out. Quantities of network equipment and cost breakdown for the WAN models are summarized in for two selector switch sizes. Table 4 presents quantities and costs for two WAN designs. 16-port switches, 5 core nodes 32-port switches, 3 core nodesName Number Fraction, % Number Fraction, % Core Nodes 5 0.029 3 0.016 Core Node DWDM Ports 179 0.316 83 0.132 Selector Switch Nodes 179 1.055 83 0.439 Selector Switch Ports 2740 1.131 2487 0.922 Edge Nodes 1024 12.07 1024 10.84 Edge Node Ports 2740 1.131 2487 0.922 Location Start-up 140 0.413 140 0.371 Fiber and amplifiers 474209 83.85 543827 86.36 Total 100 100
Table 4: Quantities and costs for two WAN designs. 7. Discussion of Results and Conclusions Before analysing the results, we hasten to point out that equipment costs used in the calculations are extrapolated estimates based on similar devices currently available, and the costs will likely decrease significantly with time as larger equipment volumes are deployed. Nevertheless we believe the results can provide some guidance and insight into what equipment items will dominate network capital cost. These cost figures reported are for the working network design. The port and fiber costs will increase by an estimated 50% for networks protected against single link fiber failures. From the results shown in Table 3 for the metropolitan area network (MAN) we see that the installed capital cost of $88.6 million, for 2-layer design is about 1% less than for the least cost 3-layer design, $89.4 million. This total cost for transparent optical transport was based on a population of 4.5 million people each generating 10Mb/s in each direction while active, with an activity factor of 10%, and a traffic utilization efficiency of 80%. Single wavelength fiber was the best transmission option. The least costly 3-layer design was for the 32 port selector case. The 16 and 8 port selector MAN designs exceed that of
26
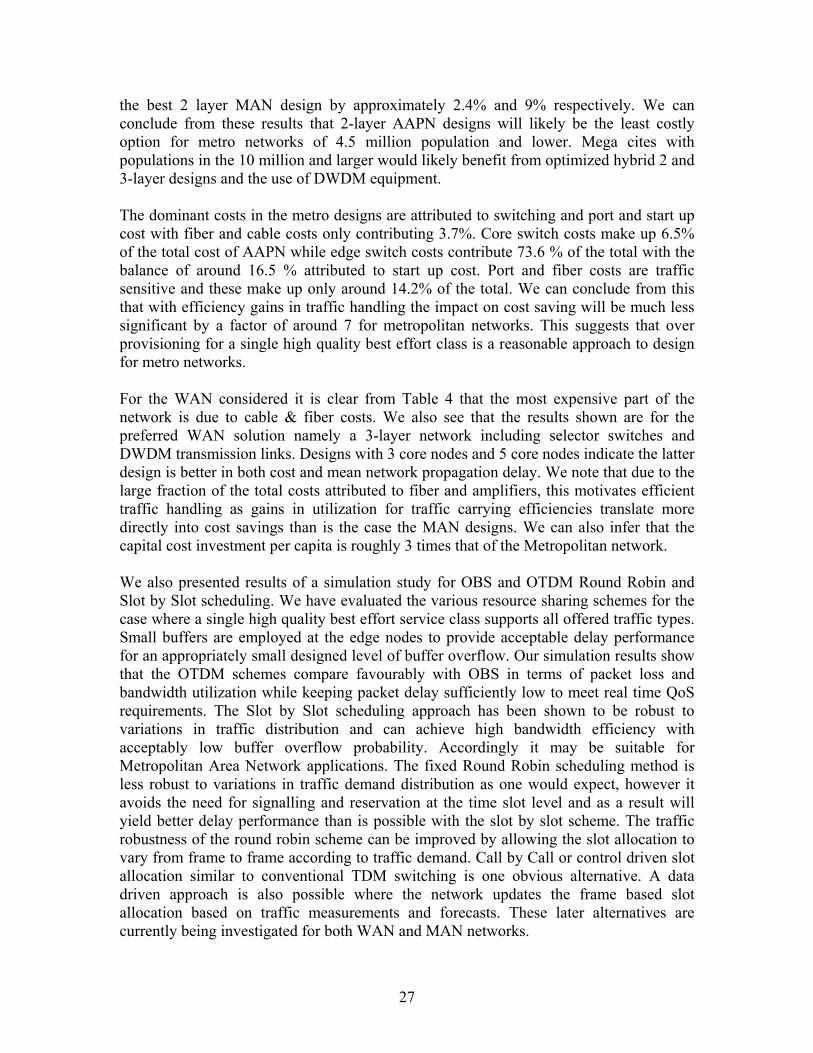
the best 2 layer MAN design by approximately 2.4% and 9% respectively. We can conclude from these results that 2-layer AAPN designs will likely be the least costly option for metro networks of 4.5 million population and lower. Mega cites with populations in the 10 million and larger would likely benefit from optimized hybrid 2 and 3-layer designs and the use of DWDM equipment. The dominant costs in the metro designs are attributed to switching and port and start up cost with fiber and cable costs only contributing 3.7%. Core switch costs make up 6.5% of the total cost of AAPN while edge switch costs contribute 73.6 % of the total with the balance of around 16.5 % attributed to start up cost. Port and fiber costs are traffic sensitive and these make up only around 14.2% of the total. We can conclude from this that with efficiency gains in traffic handling the impact on cost saving will be much less significant by a factor of around 7 for metropolitan networks. This suggests that over provisioning for a single high quality best effort class is a reasonable approach to design for metro networks. For the WAN considered it is clear from Table 4 that the most expensive part of the network is due to cable & fiber costs. We also see that the results shown are for the preferred WAN solution namely a 3-layer network including selector switches and DWDM transmission links. Designs with 3 core nodes and 5 core nodes indicate the latter design is better in both cost and mean network propagation delay. We note that due to the large fraction of the total costs attributed to fiber and amplifiers, this motivates efficient traffic handling as gains in utilization for traffic carrying efficiencies translate more directly into cost savings than is the case the MAN designs. We can also infer that the capital cost investment per capita is roughly 3 times that of the Metropolitan network. We also presented results of a simulation study for OBS and OTDM Round Robin and Slot by Slot scheduling. We have evaluated the various resource sharing schemes for the case where a single high quality best effort service class supports all offered traffic types. Small buffers are employed at the edge nodes to provide acceptable delay performance for an appropriately small designed level of buffer overflow. Our simulation results show that the OTDM schemes compare favourably with OBS in terms of packet loss and bandwidth utilization while keeping packet delay sufficiently low to meet real time QoS requirements. The Slot by Slot scheduling approach has been shown to be robust to variations in traffic distribution and can achieve high bandwidth efficiency with acceptably low buffer overflow probability. Accordingly it may be suitable for Metropolitan Area Network applications. The fixed Round Robin scheduling method is less robust to variations in traffic demand distribution as one would expect, however it avoids the need for signalling and reservation at the time slot level and as a result will yield better delay performance than is possible with the slot by slot scheme. The traffic robustness of the round robin scheme can be improved by allowing the slot allocation to vary from frame to frame according to traffic demand. Call by Call or control driven slot allocation similar to conventional TDM switching is one obvious alternative. A data driven approach is also possible where the network updates the frame based slot allocation based on traffic measurements and forecasts. These later alternatives are currently being investigated for both WAN and MAN networks.
27
In conclusion, a new mathematical programming model, a design methodology and a set of integrated planning tools were developed which enables network planners to design near optimal network topologies given facility and equipment cost capacity information and traffic demand. Comparisons were included giving the accuracy and time complexity of heuristic as well as optimization algorithms for a range of AAPN network design problems. A graphical display allows the planner to view the resulting network designs. This optical network planning tool should be useful to both equipment vendors and network operators as it provides an effective means of evaluating the network cost and performance impact of various equipment design options (capacities and costs) as well as alternative network architectures under different hypothesized traffic demand scenarios. Ongoing research on topological design and dimensioning is addressing the issue of network survivability, as well as network migration strategy. Acknowledgement. This work was supported by the Natural Sciences and Engineering Research Council (NSERC) and industrial and government partners, through the Agile All-Photonic Networks (AAPN) Research Network. In addition the authors wish to acknowledge the many useful discussions with colleagues and industrial partners involved in the AAPN Research Network project. 8. References
[1] O. Gerstel and H. Raza, "On the synergy between electrical and photonic switching," IEEE Communications Magazine, vol. 41, no. 4, pp. 98-104, Apr.2003.
[2] R. Izmailov, S. Ganguly, T. Wang, Y. Suemura, Y. Maeno, and S. Araki, "Hybrid hierarchical optical networks," IEEE Communications Magazine, vol. 40, no. 11, pp. 88-94, Nov.2002.
[3] H. Zang, J. P. Jue, and J. Mukherjee, "A review of routing and wavelength assignment approaches for wavelength-routed optical WDM networks," Optical Networks Magazine, Jan 2000, pp. 47-60.
[4] C. H. Ou, K. Y. Zhu, H. Zang, L. H. Sahasrabuddhe, and B. Mukherjee, "Traffic grooming for survivable WDM networks - Shared protection," IEEE Journal on Selected Areas in Communications, vol. 21, no. 9, pp. 1367-1383, Nov.2003.
[5] I. Baldine, G. N. Rouskas, H. G. Perros, and D. Stevenson, "JumpStart: A just-in-time signaling architecture for WDM burst-switched networks," IEEE Communications Magazine, vol. 40, no. 2, pp. 82-89, Feb.2002.
[6] C. M. Qiao and M. S. Yoo, "Optical burst switching (OBS) - a new paradigm for an optical Internet," Journal of High Speed Networks, vol. 8, no. 1, pp. 69-84, 1999.
[7] Maach A. and Bochmann G.V, "Segmented Burst Switching: Enhancement of Optical Burst Switching to decrease loss rate and support quality of service,"
28
Proc.Sixth IFIP Working Conf. Optical Network Design and Modelling, Torino, Italy, Feb. 2002.
[8] Zang H., Jue J.P., and Mukherjee J., "Photonic Slot Routing in All-Optical WDM Mesh Networks," Proc.IEEE Globecom '99, Rio de Janeiro, Brazil, Dec. 1999.
[9] M. Beshai and R. Vickers, "Petaweb Architecture," Proc.Networks2000 Toward Natural Networks 9th Int.Telecommunication NetworkPlanning Symp., Toronto, ON, Canada, 2000.
[10] K. S. Hindi and K. Pienkosz, "Efficient solution of large scale, single-source, capacitated plant location problems," Journal of the Operational Research Society, vol. 50, no. 3, pp. 268-274, Mar.1999.
[11] Z. Dziong, L.G. Mason,L.G, "Fair-efficient call admission control policies for broadband networks - A game theoretic framework", Ieee-Acm Transactions on Networking, vol 4, no. 1, pp. 123-136, February 1996.
[12] L. G. Mason, C. A. Constantinescu, and M. G. Brown, "A Uniform Network
Model," Conference Record, Fifth Annual Pittsburgh Conference on Modeling and Simulation, Pittsburgh, Penn., April 1974.
[13] A. Feldmann, A. Greenberg, C. Lund, N. Reingold, J. Rexford, and F. True, "Deriving traffic demands for operational IP networks: Methodology and experience," IEEE-ACM Transactions on Networking, vol. 9, no. 3, pp. 265-279, June 2001.
[14] A. Farago, "Blocking Probability Estimation for General Traffic Under Incomplete Information," IEEE International Conference on Communications, 2000.
[15] X. Liu, A. Vinokurov, L.G. Mason, "Performance Comparison of OTDM and OBS Scheduling for Agile All-Photonic Network", IFIP 2005 Conference on Metropolitan Area Networks, April 11-13, 2005, Viet Nam
29