Topography, the geoid, and compensation mechanisms …eps et al... · Topography, the geoid, and...
18
Article Volume 12, Number 4 1 April 2011 Q04002, doi:10.1029/2010GC003459 ISSN: 1525‐2027 Topography, the geoid, and compensation mechanisms for the southern Rocky Mountains D. Coblentz Geodynamics Group, Los Alamos National Laboratory, MS D443, Los Alamos, New Mexico 87545, USA ([email protected]) C. G. Chase Department of Geosciences, University of Arizona, Tucson, Arizona 85721, USA K. E. Karlstrom Department of Earth and Planetary Sciences, University of New Mexico, Albuquerque, New Mexico 87131, USA J. van Wijk Department of Earth and Atmospheric Sciences, University of Houston, Houston, Texas 77204‐5007, USA [1] The southern Rockies of Colorado are anomalously high (elevations greater than 2800 m), topographi- cally rough (implying active uplift), and underlain by significant low‐velocity anomalies in the upper mantle that suggest an intimate relationship between mantle geodynamic processes and the surface topography. The region is in isostatic equilibrium (i.e., near‐zero free‐air gravity anomaly); however, the poor correlation between the high topography and crustal thickness makes the application of simple compensation models (e.g., pure Heiskanen or Pratt‐Hayford) problematic. Knowledge of how the current topography of the Rockies is isostatically compensated could provide constraints on the relative role of sublithospheric buoy- ancy versus lithospheric support. Here we evaluate the geoid and its relationship to the topography (using the geoid‐to‐elevation ratio (GTR) in the spatial domain and the admittance in the frequency domain) to constrain the mechanism of compensation. We separate the upper mantle geoid anomalies from those with deeper sources through the use of spherical harmonic filtering of the EGM2008 geoid. We exploit the fact that at wavelengths greater than the flexural wavelength where features are isostatically compensated, the geoid/ topography ratio can be used to estimate the depth of compensation and the elastic thickness of the litho- sphere. The results presented below indicate that the main tectonic provinces of the western United States have moderate geoid/topography ratios between 3.5 and 5.5 m/km (∼3.9 for the southern Rockies, ∼4.25 for the Colorado Plateau, and ∼5.2 for the Northern Basin and Range) suggesting shallow levels of isostatic compensation. In terms of the elastic thickness of the lithosphere, our results indicate an elastic thickness of less than 20 km. These value support the notion that a major portion of the buoyancy that has driven uplift resides at depths less than 100 km and that upper mantle processes such as small‐scale convection may play a significant role in the buoyant uplift of the southern Rockies (as well as other actively uplifting areas of the western United States). Further support for this hypothesis is provided by high coherence for the geoid‐ topography relationship for nearly all wavelengths between 50 and 1000 km. Components: 9800 words, 8 figures. Keywords: topography; geoid; Rocky Mountains. Copyright 2011 by the American Geophysical Union 1 of 18
Transcript of Topography, the geoid, and compensation mechanisms …eps et al... · Topography, the geoid, and...
Article
Volume 12, Number 4
1 April 2011
Q04002, doi:10.1029/2010GC003459
ISSN: 1525‐2027
Topography, the geoid, and compensation mechanismsfor the southern Rocky Mountains
D. CoblentzGeodynamics Group, Los Alamos National Laboratory, MS D443, Los Alamos, New Mexico 87545,USA ([email protected])
C. G. ChaseDepartment of Geosciences, University of Arizona, Tucson, Arizona 85721, USA
K. E. KarlstromDepartment of Earth and Planetary Sciences, University of New Mexico, Albuquerque, New Mexico87131, USA
J. van WijkDepartment of Earth and Atmospheric Sciences, University of Houston, Houston, Texas 77204‐5007,USA
[1] The southern Rockies of Colorado are anomalously high (elevations greater than 2800 m), topographi-cally rough (implying active uplift), and underlain by significant low‐velocity anomalies in the upper mantlethat suggest an intimate relationship between mantle geodynamic processes and the surface topography. Theregion is in isostatic equilibrium (i.e., near‐zero free‐air gravity anomaly); however, the poor correlationbetween the high topography and crustal thickness makes the application of simple compensation models(e.g., pure Heiskanen or Pratt‐Hayford) problematic. Knowledge of how the current topography of theRockies is isostatically compensated could provide constraints on the relative role of sublithospheric buoy-ancy versus lithospheric support. Here we evaluate the geoid and its relationship to the topography (using thegeoid‐to‐elevation ratio (GTR) in the spatial domain and the admittance in the frequency domain) to constrainthe mechanism of compensation. We separate the upper mantle geoid anomalies from those with deepersources through the use of spherical harmonic filtering of the EGM2008 geoid. We exploit the fact that atwavelengths greater than the flexural wavelength where features are isostatically compensated, the geoid/topography ratio can be used to estimate the depth of compensation and the elastic thickness of the litho-sphere. The results presented below indicate that the main tectonic provinces of the western United Stateshave moderate geoid/topography ratios between 3.5 and 5.5 m/km (∼3.9 for the southern Rockies, ∼4.25for the Colorado Plateau, and ∼5.2 for the Northern Basin and Range) suggesting shallow levels of isostaticcompensation. In terms of the elastic thickness of the lithosphere, our results indicate an elastic thickness ofless than 20 km. These value support the notion that a major portion of the buoyancy that has driven upliftresides at depths less than 100 km and that upper mantle processes such as small‐scale convection may playa significant role in the buoyant uplift of the southern Rockies (as well as other actively uplifting areas ofthe western United States). Further support for this hypothesis is provided by high coherence for the geoid‐topography relationship for nearly all wavelengths between 50 and 1000 km.
Components: 9800 words, 8 figures.
Keywords: topography; geoid; Rocky Mountains.
Copyright 2011 by the American Geophysical Union 1 of 18
Index Terms: 8120 Tectonophysics: Dynamics of lithosphere and mantle: general (1213); 8175 Tectonophysics: Tectonicsand landscape evolution; 8122 Tectonophysics: Dynamics: gravity and tectonics.
Received 2 December 2010; Revised 17 February 2011; Accepted 22 February 2011; Published 1 April 2011.
Coblentz, D., C. G. Chase, K. E. Karlstrom, and J. van Wijk (2011), Topography, the geoid, and compensation mechanismsfor the southern Rocky Mountains, Geochem. Geophys. Geosyst., 12, Q04002, doi:10.1029/2010GC003459.
1. Introduction
[2] Our understanding of how the high topographyof mountain ranges is compensated at depth isincomplete except for the most simplistic cases (e.g.,balanced one‐dimensional columns and cartoonillustrations of the lithosphere). Reality is a muchmore complicatedmix of the principal compensationmechanisms such as thickening a constant densitycrust (Airy), lateral changes in density of crust (Pratt)and the support of topographic loads by elasticstresses within the lithospheric plate overlying aweak, fluid asthenosphere (flexural support). Thedominance of the Airy‐type compensation in earlierstudies stems in large part from early crustal struc-ture studies that indicated that most high mountainranges have a thick root/crust. In such a situation thefree‐air gravity anomaly is small and approacheszero for the longest wavelengths. In contrast, theBouguer gravity anomaly is nonzero, reflecting thecrustal root, and strongly correlated with topographyat long wavelengths. To a first order these observa-tion hold true for a majority of the Earth’s mountainranges. It is only with the arrival of recent, moredetailed, seismic studies (e.g., the EarthScope proj-ect in the western United States) and evaluations ofthe intraplate stress field [Zoback and Mooney,2003] that sufficient information has become avail-able to raise serious question about the applicabilityof the Airy model of compensation. Thus, while it isgenerally accepted that mountain belts are underlainby “roots” that are less dense than the surroundingmantle, it is becoming more and more apparent thatthe roots are not large enough to appeal to a purelyAiry mechanism of compensation. Indeed, one ofthe principal conclusions of Zoback and Mooney[2003] was that for most continental areas thereexists no clear relationship between elevation andcrustal thickness and pure Airy‐type correlationbetween elevation and crustal thickness is limited tocontinental regions with either very thick (>55 km)or very thin (<20 km) crust. The implication is thatmantle buoyancy may be a significant contributorto surface elevation, a suggestion made more than40 years ago [Thompson and Talwani, 1964].
[3] This is particularly the case for the activelydeforming western U.S. Cordillera. The westernUnited States is characterized by regionally highelevation typically exceeding 1.5 km and recentdeformation and uplift which invites evaluationof the relationship between topography and theunderlying geodynamics driving continental uplift.The southern Rocky Mountains in Colorado (SRM)and the Colorado Plateau (CP) regions are particu-larly intriguing, given the debate surrounding theuplift dynamics of the CP and the anomalously highand actively deforming SRM. Both of these pro-vinces are characterized by a present‐day litho-sphere that is a composite of structures that formedduring lithospheric assembly and during latermodification, including active tectonism. Recentmodeling results suggest that while the CP and theSRM are quite distinct in geology and physiogra-phy, they share recent uplift which is hypothesizedto be driven by small‐scale and relatively shallowmantle flow and buoyancy [van Wijk et al., 2010].This influence from the upper mantle is consistentwith the observation that the Tertiary epeirogenies inthe western United States are coincident with maficigneous activity and suggests that continental swellssuch as the southern Rockies are associated withsublithospheric processes (possibly akin to a varia-tion on mantle hot spots) in the same manner asoceanic swells [Crough, 1979; Eaton, 1986, 2008;Suppe et al., 1975].
[4] Much of the high elevation of the SRMcoincideswith thin or attenuated continental crust, whichsuggests that anomalous buoyancy of the mantleplays an important role in the topographic support.An emerging hypothesis from the recently com-pleted CREST (Colorado Rocky Mountain Experi-ment and Seismic Transect) experiment [Aster et al.,2009] is that 100 km‐scale mantle velocity domainscorrelate with regions undergoing differential upliftin the SRM and CP and, more generally, that surfacetopography is being shaped by mantle flow andbuoyancy at various scales. Significant upper mantlelow‐velocity features beneath the Aspen region andSan Juan Mountains appear to coincide with Prote-rozoic lithospheric structures within the Colorado
GeochemistryGeophysicsGeosystems G3G3 COBLENTZ ET AL.: SOUTHERN ROCKY MOUNTAINS COMPENSATION 10.1029/2010GC003459
2 of 18
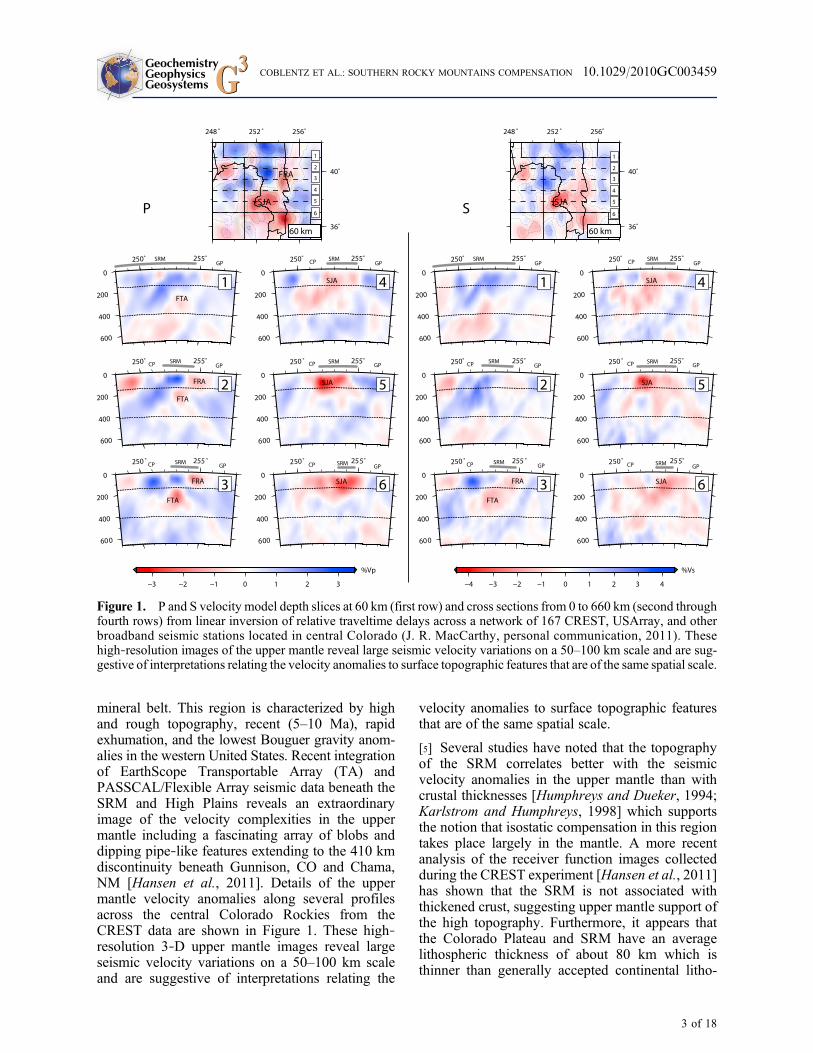
mineral belt. This region is characterized by highand rough topography, recent (5–10 Ma), rapidexhumation, and the lowest Bouguer gravity anom-alies in the western United States. Recent integrationof EarthScope Transportable Array (TA) andPASSCAL/Flexible Array seismic data beneath theSRM and High Plains reveals an extraordinaryimage of the velocity complexities in the uppermantle including a fascinating array of blobs anddipping pipe‐like features extending to the 410 kmdiscontinuity beneath Gunnison, CO and Chama,NM [Hansen et al., 2011]. Details of the uppermantle velocity anomalies along several profilesacross the central Colorado Rockies from theCREST data are shown in Figure 1. These high‐resolution 3‐D upper mantle images reveal largeseismic velocity variations on a 50–100 km scaleand are suggestive of interpretations relating the
velocity anomalies to surface topographic featuresthat are of the same spatial scale.
[5] Several studies have noted that the topographyof the SRM correlates better with the seismicvelocity anomalies in the upper mantle than withcrustal thicknesses [Humphreys and Dueker, 1994;Karlstrom and Humphreys, 1998] which supportsthe notion that isostatic compensation in this regiontakes place largely in the mantle. A more recentanalysis of the receiver function images collectedduring the CREST experiment [Hansen et al., 2011]has shown that the SRM is not associated withthickened crust, suggesting upper mantle support ofthe high topography. Furthermore, it appears thatthe Colorado Plateau and SRM have an averagelithospheric thickness of about 80 km which isthinner than generally accepted continental litho-
Figure 1. P and S velocity model depth slices at 60 km (first row) and cross sections from 0 to 660 km (second throughfourth rows) from linear inversion of relative traveltime delays across a network of 167 CREST, USArray, and otherbroadband seismic stations located in central Colorado (J. R. MacCarthy, personal communication, 2011). Thesehigh‐resolution images of the upper mantle reveal large seismic velocity variations on a 50–100 km scale and are sug-gestive of interpretations relating the velocity anomalies to surface topographic features that are of the same spatial scale.
GeochemistryGeophysicsGeosystems G3G3 COBLENTZ ET AL.: SOUTHERN ROCKY MOUNTAINS COMPENSATION 10.1029/2010GC003459
3 of 18

spheric average of 100 kmwhich is observed furtherto the east under the Great Plains [Abt et al., 2010;Yuan and Romanowicz, 2010]. The relationshipbetween the surface topography, crustal thicknessand upper mantle processes in central Coloradoremains poorly understood and constraints on thecompensation mechanism provided by an analysisof the geoid is germane for resolving the contentiousissues surrounding the lithospheric structure. Otherstudies, in particular the analysis of Rayleigh wavetomography [Li et al., 2002], have concluded therelationship between the elevated topography withmantle velocities is not as strong as the correlationwith crustal anomalies.
[6] In this study we build on the previous inves-tigations into the coupling between elevation andthermal field in the context of isostasy and its rolein continental deformation in convergent orogens[Sandiford and Powell, 1990; Zhou and Sandiford,1992] and the lithospheric density moment as asource of intraplate stress and associated defor-mation at both global and tectonic plate scales[Coblentz et al., 1994]. We present the results of anevaluation of the upper mantle geoid and its rela-tionship to the topography of the SRM in an effort tohelp resolve the controversy of how the topographyis compensated and constrain the various geo-dynamic models being postulated to explain theobserved upper mantle velocity anomalies beneaththe SRM. We evaluate the geoid‐to‐topographyratio (GTR) for various compensation models usingone dimensional isostatically balanced lithosphericdensity models to place constraints on the plausiblelithospheric structure. This is followed by an inter-pretation of the coherence and admittance of therelationship between the topography and the gravity/geoid fields in an attempt to distinguish betweentopography that is compensated by lithosphericvariations and those that are supported by flexure ofthe lithospheric plate [Dorman and Lewis, 1970;Forsyth, 1985]. Our estimates for the mechanismand depth of compensation beneath SRM placesstrong constraints on the depth at which the buoy-ancy resides and help resolve the attendant issuessurrounding uplift mechanisms in the westernUnited States.
2. Topography, Gravity, and the Geoid
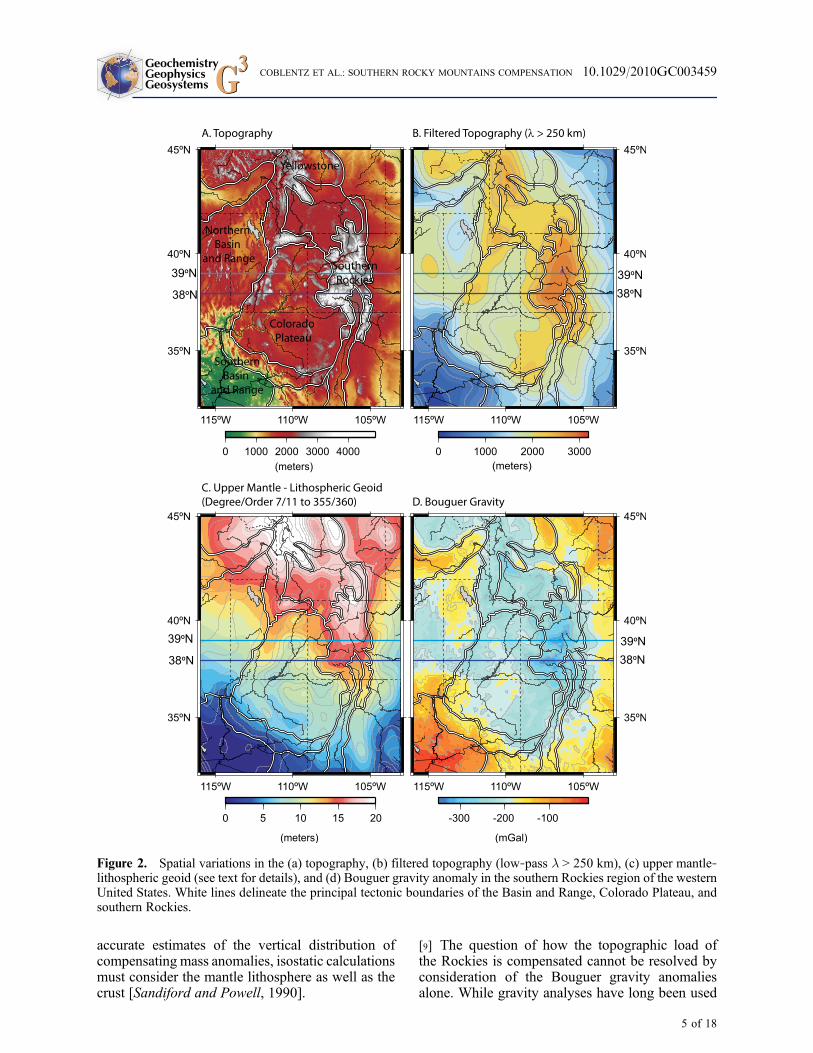
[7] The high topography of the SRM is a dominantfeature of the western United States (Figure 2a) andis part of a larger north‐south striking, long‐wavelength topographic swell (topography with
l > 250 km is shown in Figure 2b) that extendsfor more than 1000 km from central New Mexicointo Wyoming. This long‐wavelength “swell” cutsacross major structural features in the crust includ-ing the northeast trending paleosubduction suturesinherited from the assembly of the North Americanplate, the northwest striking trends of the AncestralRocky Mountains, and the northeast trendingColorado Mineral Belt (see discussions by Eaton[1986, 2008]). From a geophysical point of viewthe lithosphere in the SRM region has been moreintensely studied than any other orogenic system(with the possible exception of the Alps and partsof the Andes) and provides the data necessary toevaluate and understand how the topographic loadof the southern Rockies is compensated.
[8] As is well established by the principle ofisostasy, topographic loads at the Earth’s surface arecompensated by mass deficits and excesses withinthe Earth’s interior; Watts [2001] provides a com-prehensive review of the development of the conceptof isostasy. The small free‐air gravity anomalythroughout the western United States indicatesthat most of the tectonic provinces, including theColorado Plateau and the Rockies are in a state ofisostatic equilibrium. Thus, given the very longwavelength topographic features of the CP and theSRM, simple isostatic models can be employed toconstrain the first‐order compensation mechanisms.The principle of parsimony suggests beginning withconsideration of the Airy‐Heiskanen compensa-tion (with purely crustal thickness variations) as thedominant compensation mechanism. For the sim-plest crustal model, a surface elevation of 2800 mwill correspond with a crustal thickness of more than48 km (assuming a crustal density of 2800 kg/m3
and mantle lithospheric density of 3300 kg/m3).However, the analysis of recent seismic imaging[Hansen et al., 2011] indicates that the crustalthickness under the high topography in the Aspenregion of central Colorado is about 42 km or morethan 5 km thinner than predicted by Airy‐Heiskanencompensation. This crustal thickness, combinedwith the lack of correlation between the highesttopography and the largest Bouguer gravity anom-alies, is evidence that the compensation mechanismbeneath central Colorado is more complex. Thesituation calls for either a combination of bothAiry‐Heiskanen and Pratt‐Hayford isostasy (seediscussions by Martinec [1994a, 1994b]) orinvolvement of the whole lithosphere in the isostaticcompensation (that is, a depth of compensation inthe range of 100–150 km as suggested by Martinec[1994b]). As a result, in order to achieve more
GeochemistryGeophysicsGeosystems G3G3 COBLENTZ ET AL.: SOUTHERN ROCKY MOUNTAINS COMPENSATION 10.1029/2010GC003459
4 of 18
accurate estimates of the vertical distribution ofcompensating mass anomalies, isostatic calculationsmust consider the mantle lithosphere as well as thecrust [Sandiford and Powell, 1990].
[9] The question of how the topographic load ofthe Rockies is compensated cannot be resolved byconsideration of the Bouguer gravity anomaliesalone. While gravity analyses have long been used
Figure 2. Spatial variations in the (a) topography, (b) filtered topography (low‐pass l > 250 km), (c) upper mantle‐lithospheric geoid (see text for details), and (d) Bouguer gravity anomaly in the southern Rockies region of the westernUnited States. White lines delineate the principal tectonic boundaries of the Basin and Range, Colorado Plateau, andsouthern Rockies.
GeochemistryGeophysicsGeosystems G3G3 COBLENTZ ET AL.: SOUTHERN ROCKY MOUNTAINS COMPENSATION 10.1029/2010GC003459
5 of 18

to constrain crustal structure in the western UnitedStates [Li et al., 2002; Thompson and Zoback,1979], use of geoid anomalies (which are varia-tions in the gravitational potential) are much bettersuited to the purpose of detecting where the com-pensating masses are located in the subsurface.Geoid anomalies caused by long‐wavelength iso-statically compensated continental topography areproportional to the elevation multiplied by the meandepth of compensation (that is, they are proportionalto the local dipole moment of the density‐depthdistribution [Haxby and Turcotte, 1978]) and can beused to evaluate and constrain the subsurface dis-tribution of mass associated with various topo-graphic loads and features. Because the geoidreflects the gravitational dipole moment it is moresensitive to deeper sources than the gravity field,reflecting the fact that the geoid anomaly observed atthe surface caused by a point mass buried at depth ddecreases in amplitude as 1/d, whereas the gravityanomaly of the same point mass decays as 1/d2. Thismakes the study of geoid anomalies more useful fordiscerning depths of isostatic compensation. Incontinental settings, the geoid has primarily beenused to deduce regional tectonic stresses from thevariations of gravitational potential energy [Joneset al., 1996, 1998; Sonder and Jones, 1999].Recently, geoid anomalies have been used to con-strain deep continental structure as well [Doin et al.,1996; Ebbing et al., 2001].
[10] There is a trade‐off, however, to the advantagesof the depth sensitivity of geoid anomalies. Mantleheterogeneities produce long‐wavelength, high‐amplitude anomalies that dominate the geoid andconsequently the observed geoid anomaly is thecombination of mass anomalies in both the litho-sphere and deeper mantle. Thus it is imperative toseparate the upper mantle geoid anomalies fromthose with deeper sources, especially those that arisein the lower mantle before using the geoid forunderstanding the distribution of masses in thelithosphere. We accomplish this by removing allspherical harmonic terms of degree less than 7 andapplying a one‐sided cosine taper to harmonic termsfrom degree 7 to 11 (see Chase et al. [2002] fordetails). This filter allows removal of all anomalieswith spatial wavelengths greater than 3000 km andlimits the sources of the anomaly to depths less thanabout 600 km. This geoid field (which we refer to asthe “upper mantle‐lithospheric geoid”) is shown inFigure 2c and appears to be appropriate for thesouthwestern North America, in that the averagegeoid value with crust near sea level is zero both onthe west coast and the Gulf of Mexico (see Chase
et al. [2002, Figure 4] for a more regional view ofthis geoid). It is important to note that this geoid isalso consistent with the natural choice for a refer-ence lithospheric column that has a near‐zero geoidassociated with zero elevation; a feature that isexploited below in the discussion of partitioningdeformational strain between the crust and mantlelithosphere.
[11] Haxby and Turcotte [1978] showed that inthe limit of long‐wavelength and complete isostaticcompensation, the geoid anomaly caused by densityvariations above the depth of compensation is pro-portional to the vertical dipole moment of the massdistribution above the depth of compensation:
DN ¼ 2�G
g
ZD
S
zD� zð Þdz
where DN is the geoid anomaly; G, Newton’sgravitational constant; g, the value of gravitationalacceleration on the reference ellipsoid; D, the depthof compensation (the depth below geoid at whichpressure becomes equal beneath columns in isostaticbalance, or here, where lateral density differencescease); S, the surface elevation; z, the depth; andDr(z) the lateral difference in density from a refer-ence lithosphere, including crust. There are twoimportant implications of this formulation that aregermane to this study: (1) the geoid anomaly overcontinents should increase both with increasingelevation and increasing average depth of compen-sation [Turcotte and Mcadoo, 1979; Turcotte andSchubert, 2002] and (2) for a particular elevation,the greater the depth extent of the isostatic “root” (orthe deeper the source of buoyancy) the larger theresulting geoid anomaly. The linear relationshipbetween gravity and topography can be used in avariety of ways for geodynamic applications. Twoapplication of interest are of interest here. First, for aregion where both the topography and gravity aremeasured over an area that is several times greaterthan the flexural wavelength (i.e., >∼100 km), thegravity‐topography transfer function relationship(also referred to as the admittance or “isostaticresponse function”) can be evaluated to extractinformation about the isostatic state of the litho-sphere. This approach has also been used to evaluatethe flexural rigidity of the lithosphere [McNutt andMenard, 1982] and to estimate the elastic thick-ness of the lithosphere [Banks et al., 1977; Dormanand Lewis, 1972; McKenzie and Bowin, 1976;McNutt and Menard, 1979; Watts, 1978]. A secondapplication is for wavelengths greater than theflexural wavelength and where features are iso-
GeochemistryGeophysicsGeosystems G3G3 COBLENTZ ET AL.: SOUTHERN ROCKY MOUNTAINS COMPENSATION 10.1029/2010GC003459
6 of 18
statically compensated, in which case the geoid/topography ratio (GTR) can be used to estimate thedepth of compensation in the spatial domain [Haxbyand Turcotte, 1978]. A low GTR value (in the rangeof 2–4 m/km) indicates the topography is shallowlysupported by thickened crust (dominantly Airycompensation), and intermediate GTR (in the rangeof 5–7 m/km) suggests deeper compensation that isrelated to lithospheric thinning [Crough, 1978] and ahigh GTR value (greater than ∼7 m/km) is reflectiveof dynamic support from sublithospheric sourcessuch as mantle convection. As will be discussedbelow, however, these general values for GTR andcorresponding depths of compensation (withoutreference to the surface elevation) are applicableonly to Pratt‐Hayford isostasy; for other mechan-isms of compensation including Airy‐Heiskanenand pure lithospheric thinning there is a linear cor-relation between the GTR and surface elevation.
3. Compensation Mechanismsin the Western United States
[12] The near‐zero free‐air gravity anomalythroughout the western United States is indicative oflong‐wavelength isostatic equilibrium and allowsthe use of isostatically balanced lithospheric col-umns for understanding the relative geometriesof the crust and mantle lithosphere that result inplausible models for compensating the topography.It is clear that compensation is a process that in-corporates the whole lithosphere; see, for example,the discussion about the case of the Colorado Plateauin [Coblentz et al., 2007]. As a result, in order toachieve more accurate estimates of the vertical dis-tribution of compensating mass anomalies, isostaticcalculations must consider the mantle lithosphere aswell as the crust.
[13] The fc‐fl diagram [Coblentz and Stüwe, 2002;Sandiford and Powell, 1990] provides a convenientway to evaluate how vertical strains in the litho-sphere may be decoupled between crustal andmantle components. Following Sandiford andPowell [1990] we defined the fc as the ratio ofdeformed to referenced crustal thickness and fl asthe ratio of the deformed to reference total litho-spheric thickness. This approach using 1‐D verticalcolumns to represent the lithosphere so “deformed”in this case is the vertical strain of the lithosphericcolumn. For example, fc = 2.0 implies a doubling ofthe crustal thickness from the reference thickness tothe “deformed” thickness. The origin of the fc‐flplane (where fc = fl = 1.0) corresponds to an unde-
formed “equilibrium” lithosphere where there isno vertical strain. This is also the state that the crustand lithosphere will tend toward in the absence ofdeformational forces [Sandiford and Powell, 1990].Completely undeformed lithosphere lies at the cen-ter of the of the fc‐fl plane with larger and smallervalues of fc and fl corresponding to thicker andthinner crustal or lithospheric thicknesses, respec-tively. Here we assume a reference lithosphericcolumn as 30 km of 2800 kg/m3 crust overlyingmantle lithosphere with a density of 3300 kg/m3
extending to a depth of 100 km.
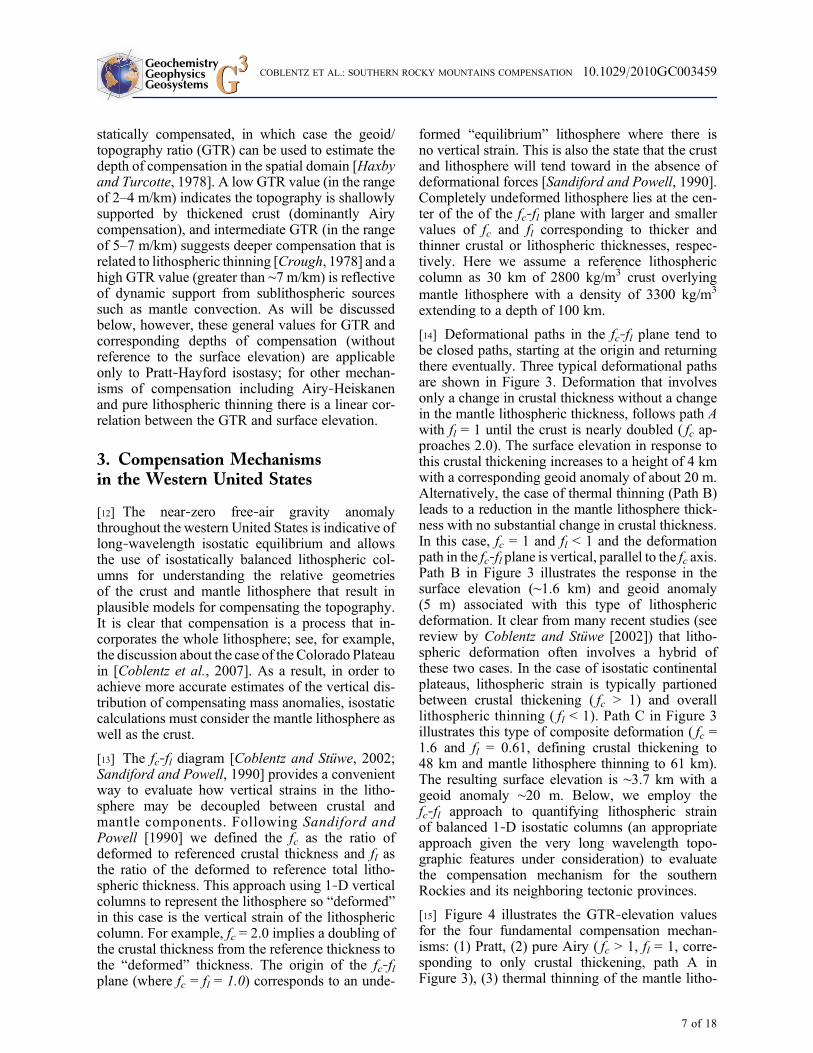
[14] Deformational paths in the fc‐fl plane tend tobe closed paths, starting at the origin and returningthere eventually. Three typical deformational pathsare shown in Figure 3. Deformation that involvesonly a change in crustal thickness without a changein the mantle lithospheric thickness, follows path Awith fl = 1 until the crust is nearly doubled ( fc ap-proaches 2.0). The surface elevation in response tothis crustal thickening increases to a height of 4 kmwith a corresponding geoid anomaly of about 20 m.Alternatively, the case of thermal thinning (Path B)leads to a reduction in the mantle lithosphere thick-ness with no substantial change in crustal thickness.In this case, fc = 1 and fl < 1 and the deformationpath in the fc‐fl plane is vertical, parallel to the fc axis.Path B in Figure 3 illustrates the response in thesurface elevation (∼1.6 km) and geoid anomaly(5 m) associated with this type of lithosphericdeformation. It clear from many recent studies (seereview by Coblentz and Stüwe [2002]) that litho-spheric deformation often involves a hybrid ofthese two cases. In the case of isostatic continentalplateaus, lithospheric strain is typically partionedbetween crustal thickening ( fc > 1) and overalllithospheric thinning ( fl < 1). Path C in Figure 3illustrates this type of composite deformation ( fc =1.6 and fl = 0.61, defining crustal thickening to48 km and mantle lithosphere thinning to 61 km).The resulting surface elevation is ∼3.7 km with ageoid anomaly ∼20 m. Below, we employ thefc‐fl approach to quantifying lithospheric strainof balanced 1‐D isostatic columns (an appropriateapproach given the very long wavelength topo-graphic features under consideration) to evaluatethe compensation mechanism for the southernRockies and its neighboring tectonic provinces.
[15] Figure 4 illustrates the GTR‐elevation valuesfor the four fundamental compensation mechan-isms: (1) Pratt, (2) pure Airy ( fc > 1, fl = 1, corre-sponding to only crustal thickening, path A inFigure 3), (3) thermal thinning of the mantle litho-
GeochemistryGeophysicsGeosystems G3G3 COBLENTZ ET AL.: SOUTHERN ROCKY MOUNTAINS COMPENSATION 10.1029/2010GC003459
7 of 18
spheric ( fc = 1, fl < 1, path B in Figure 3), and (4) acombined strain path ( fc > 1, fl < 1, correspondingto combined crustal thickening and mantle litho-spheric thinning, path C in Figure 3). Also plottedin Figure 4 are the relative GTR‐elevation valuesfor the Colorado Plateau (CP), southern RockyMountains (SRM), Northern Basin and Range (NBR),and Yellowstone (YS) to facilitate the evaluation ofplausible compensation mechanisms.
[16] Pratt‐type compensation (Figure 4a) yields aconstant GTR value independent of surface eleva-tion and for the mantle density contrast assumed
here (r = 3300 km) a low GTR value (∼3 m/km)indicates shallow compensation supported by thick-ened crust (depth of compensation = 50 km), anintermediate GTR of ∼4–5 m/km corresponds todeeper compensation (∼75 km), and a GTR value∼6 m/km corresponds to deep support (depth ofcompensation = 100 km). In the context of Prattcompensation, the topography of Yellowstonerequires a very deep compensation depth of greaterthan about 120 km while the Colorado Plateau andsouthern Rockies can be supported with near crustalcompensation depths of 55 km and 68 km, respec-
Figure 3. (a) The fc‐fl space [Sandiford and Powell, 1990; Coblentz and Stüwe, 2002] contoured for surface elevation,geoid, and geoid‐elevation ratio based on deformation of the reference column shown in Figure 3b. Three deformationpaths are illustrated: path A is pure crustal thickening ( fc > 1 and fl = 1), path B is pure mantle lithospheric thinning ( fc =1 and fl < 1), and path C is a distributed strain case with both crustal thickening ( fc > 1) and mantle lithospheric thinning( fl < 1). (b) The lithospheric crust and mantle geometries resulting from these three cases. See text for discussion.
GeochemistryGeophysicsGeosystems G3G3 COBLENTZ ET AL.: SOUTHERN ROCKY MOUNTAINS COMPENSATION 10.1029/2010GC003459
8 of 18

tively. We note that the Northern Basin and Rangehas a significantly deeper Pratt depth of compen-sation of about 87 km.
[17] In contrast to Pratt compensation, the otherthree compensation mechanisms considered havea linear relationship between the GTR values andthe surface elevation (z). The GTR for Airy com-pensation is proportional to h2 and therefore the AiryGTR is a function of h with a relatively small slope(Figure 4b). The Airy GTR is also dependent on theLo (the reference lithospheric thickness) with a GTRvariation of about 1.25 m/km as Lo ranges from60 km to 120 km. We note that given the crustal and
mantle lithospheric density variations used here (rc =2750 kg/m3 and rc = 3300 kg/m3), only the NBRprovince has GTR and surface elevation values thatfall with the plausible ranges of Airy GTR. That is,the geoid for SRM is too low relative to the surfaceelevation for Airy compensation to be a viablecompensation mechanism for the Rockies.
[18] The GTR for thermal thinning (Figure 4c;mantle lithospheric thinning, fl < 1; and constantcrustal thickness, fc = 1) differs significantly fromthe Airy GTR and is characterized by a steep, neg-ative slope with respect to z. This results from thefact that the thermal density contrast resulting from
Figure 4. The predicted GTR‐elevation values for the four fundamental compensation mechanisms: (a) Pratt, (b) pureAiry ( fc > 1, fl = 1, corresponding to only crustal thickening (path A in Figure 3)), (c) thinning of the mantle lithosphere(thermal thinning) with fc = 1, fl < 1 (path B in Figure 3), and (d) a combined strain path ( fc > 1, fl < 1, corresponding tocombined crustal thickening and mantle lithospheric thinning (path C in Figure 3)). Also plotted are the relative GTR‐elevation values for the Colorado Plateau (CP), southern Rocky Mountains (SRM), Northern Basin and Range (NBR),and Yellowstone (YS).
GeochemistryGeophysicsGeosystems G3G3 COBLENTZ ET AL.: SOUTHERN ROCKY MOUNTAINS COMPENSATION 10.1029/2010GC003459
9 of 18
fl < 1 is much smaller than the crustal density con-trast. This compensation mechanism has an upperelevation limit (designated by the termination ofthe curves in Figure 4c) that corresponds to the flvalue that produces a mantle lithospheric thicknessequal to the reference crustal thickness (30 km), i.e.,where the mantle lithosphere disappears entirely. Inthe case of a reference lithospheric with a thicknessof 100 km fl is limited to 0.30 and the maximumsurface elevation is about 1.6 km. As illustratedin Figure 4c, the GTR‐elevation values of the NBR,CP and YS fall within the plausible ranges of thethermal thinning model. For example, the 2.4 kmaverage surface elevation and ∼7 m/km GTR ofYellowstone can be produced by pure mantle lith-ospheric thinning of a 175 km reference lithospherewith a thinning factor of fl = 0.44 (producing a finallithospheric thickness, Ld, of 77 km with an unde-formed crust of 30 km). While the same deforma-tional mechanism operating on a thinner referencelithosphere (Lo = 120 km) results in GTR‐elevationvalues for the NBR and the CP that are consistentwith observed geoid and elevation values, the
required crustal (30 km) and mantle lithosphericgeometries (NBR Ld = 54 km, CP Ld = 36 km) areinconsistent with known crustal and mantle litho-spheric thicknesses for these provinces (i.e., zcrust =35 km in the NBR and ∼43 km in the CP andzlithosphere = ∼65 km and ∼98 km in the NBR and CP,respectively [Coblentz et al., 2007]). In the case ofthe southern Rockies, the observed surface elevationcannot be achieved through thinning of the mantlelithosphere alone, eliminating the plausibility ofthis compensation mechanism for supporting thetopography of the Rockies.
[19] As discussed in the Introduction, and high-lighted by the results of the GTR‐elevation valuesfor the pure mantle thinning case, the most likelylithospheric deformation scenarios in the westernUnited States involve both crustal and mantle lith-ospheric strain. Relative to the reference lithosphericcolumn, the tectonic provinces in the western UnitedStates are characterized by a combination of crustalthickening ( fc > 1) and lithospheric thinning ( fl < 1),and follow a deformation along path C in Figure 3.The GTR values are dependent on both the initialreference lithospheric thickness and the fc‐fl defor-mation path. The GTR‐elevation values for the pathwith fc varying from 1.0 to 1.5 as fl varies from 1.0to 0.4 (roughly path C in Figure 3) are shown inFigure 4d. The lithospheric thinning results in anegative slope of the GTR as a function of elevationbut the slope is less pronounced than for the purethermal thinning case. For this particular defor-mation path, the GTR‐elevation values of the fourprovinces can be reproduced by varying the initiallithospheric thickness (Lo).
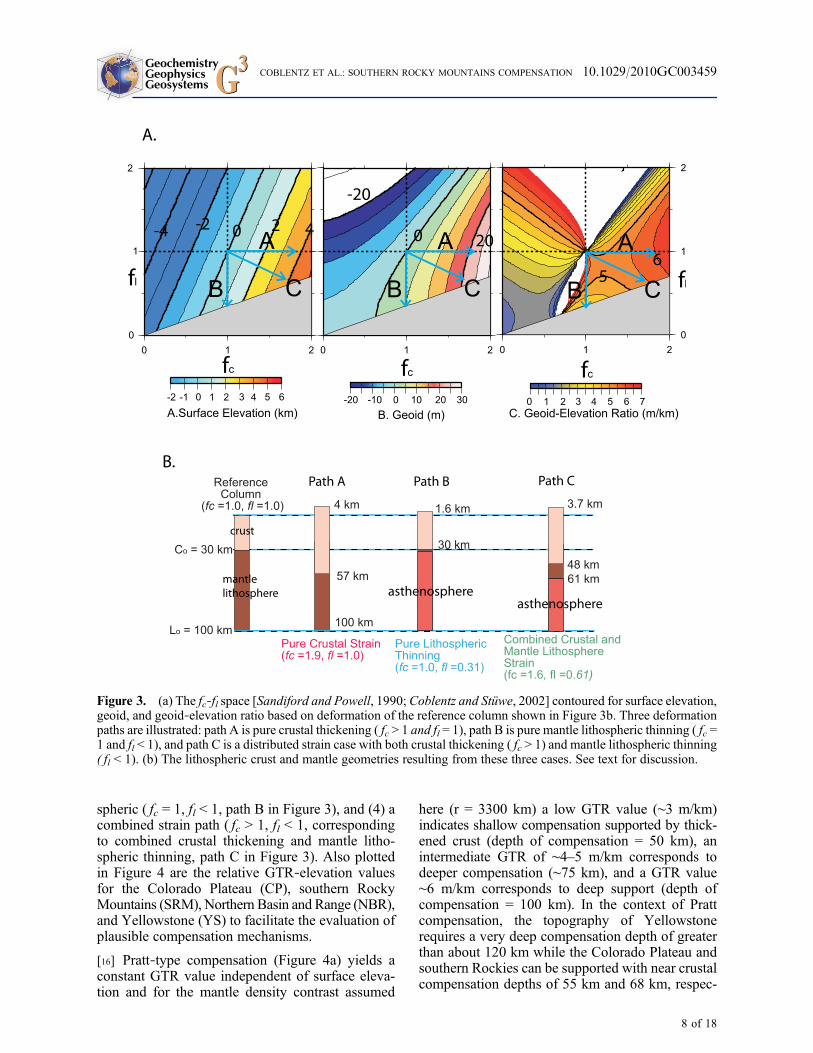
[20] Plausible crustal and mantle lithosphere strains(as indicated by locations in fc‐fl space) that corre-spond with the observed GTR‐elevation values forthe Colorado Plateau, Northern Basin and Range,Yellowstone, and the southern Rocky Mountainsis shown in Figure 5. Here we have explored thesolution space by evaluating a suite of initial litho-spheric values (Lo) in the range of 60 to 140 km andcalculating the fc‐fl ranges that generate the observedGTR‐elevation values for the four tectonic pro-vinces. Lithospheric thickness values (Lo) vary frommore than 140 km for Yellowstone to more inter-mediate values for the NBR (Lo = 110–120 km) andthe CP (Lo = 90–100 km) and relatively thin valuesfor the SRM (Lo = 80 km). While the range ofplausible fc‐fl values for the provinces are generallytightly clustered, the exception is the Northern Basinand Range where a large number of fc‐fl combina-tions satisfies the observed GTR values. We notethat crustal thickness in the range of 32 to 37 km and
Figure 5. The location in fc‐fl space of plausible litho-spheric geometries (indicated by the diamonds for theNBR, circles for the CP, triangles for YS, and squaresfor the SRM) for the four principal tectonic provincesof the western United States at consistent observedGTR‐elevation values. The initial total lithospheric thick-ness (Lo) for the initial reference column is indicted.While plausible geometries for most of the tectonicprovinces are tightly clustered, the NBR is poorly con-strained in terms of plausible mantle lithospheric thick-nesses. Furthermore, we note that in contrast to theneighboring provinces, the southern Rockies provincerequires a thin initial lithospheric thickness of about80 km.
GeochemistryGeophysicsGeosystems G3G3 COBLENTZ ET AL.: SOUTHERN ROCKY MOUNTAINS COMPENSATION 10.1029/2010GC003459
10 of 18
overall lithospheric thickness values of about 52 to90 km are indicated. Because the generally acceptedlithospheric thickness in the Northern Basin andRange is about 65 km, the range of fc‐fl valuesdelineated by the green‐filled circles (correspondingto a lithospheric than thinned from 120 km to a rangeof 60 to 72 km with) are the most plausible. Thecrustal thicknesses of the other three provincesconsidered fall in the range of 40 to 44 km which isconsistent with the minimum end of the generallyaccepted values. This analysis indicates that with theexception of the Colorado Plateau, the major tec-tonic provinces of the western United States have allundergone more than 40 km of lithospheric thinningduring their tectonic evolution.
4. Coherence and Admittance Analysis
[21] Because compensation mechanisms eventuallyproduce responses at different wavelengths it is notan easy task to separate the relative role of short‐(isostatic) versus long‐wavelength (flexure) com-pensation of topography using the 1‐D analysis insection 3. To help estimate the relative roles of thesetwo mechanisms, we turn next to an evaluation ofthe admittance and coherence functions (or thespectral measure of the gravity/geoid to topographyrelationship in the frequency domain).
[22] The spectral relationship between topographyand gravity has been used in many studies to eval-uate the form of isostatic compensation in conti-nental regions [Banks et al., 1977; Bechtel et al.,1990, 1999; Dorman and Lewis, 1970; Forsyth,1985; Londe, 1990; McKenzie and Bowin, 1976;Pilkington, 1990] in particular to help constrainestimates of the elastic thickness of the lithosphere.A similar analysis using the geoid has been com-monly used to investigate the depth and mechanismof isostatic compensation in ocean plateaus and swells[Cserepes et al., 2000;Grevemeyer, 1999; Sandwelland Renkin, 1988; Sandwell and MacKenzie, 1989;Wessel, 1993].
[23] Other works have been focused on the viscousmantle flow associated with thermal convection andinduced dynamic topography [Panasyuk andHager,2000]. Here we evaluate the coherence and admit-tance between the gravity (free air and Bouguer) andgeoid fields and the topography along four profilesthrough the southern Rockies (38°N, 38.5°N, 39°N,and 39.5°N) extending from 117°W to 100°W. Acomposite image of the profiles (Figure 6a) illus-trates the strong (qualitative) correlation between the
Bouguer gravity, the geoid, the upper mantle velocityanomaly at 110 km [Schmandt and Humphreys,2010], and topography across the southern Rockies(that is, the highest topography corresponds to thelowest Bouguer gravity anomaly, a pronouncednegative Vp velocity anomaly, and the highest geoidanomaly). As noted previously, the free‐air gravityanomaly is near zero across most of this region(indicative of isostatic equilibrium). In order toinclude as much short‐wavelength geoid informationas possible, we have used the harmonic expan-sion from EGM2008 [Pavils et al., 2008] whichcontains spectral information out to degree/order2190 (corresponding to a spatial wavelength ofabout 18 km). Because this geoid is sensitive tosources in the upper mantle (harmonic depth cutoffof about 700 km), we have renamed this geoid the“Upper Mantle‐Lithospheric Geoid.” The spectralpower of the Bouguer gravity, free‐air gravity, geoidand topography along the 38.5°N is shown inFigure 6b. All four share a characteristic red spectra(i.e., greater power at longer wavelengths) with thegravity fields (on the order of tens to hundreds ofmGal) having significantly more spectral powerthan the topography (in the range of 0 to 4 km) andgeoid (in the range of 0 to 10 m). We note that thespectral power of both the gravity and the topogra-phy‐geoid fields converge at wavelengths on theorder of the lithospheric thickness; at ∼110 km forthe Bouguer and free‐air gravity fields and ∼90 kmfor the geoid‐topography fields.
[24] Any load on the lithosphere can, in general, beexpressed as a Fourier series of different wavelengthloads [Dorman and Lewis, 1970]. In the Fourierdomain, the admittance, Z(k), is the ratio between thegravity anomaly,G(k), caused by a topographic loadon an elastic plate and the magnitude of the topog-raphy, H(k), where G(k) and H(k) are the Fouriertransforms of the Bouguer anomaly and the topog-raphy, respectively, and k is the wave number(k = 2p/l):
G kð Þ ¼ Z kð ÞH kð Þ
Thus the admittance represents a ratio of theamplitudes between gravity anomaly and topogra-phy. The coherence, on the other hand, is a measureof the correlation between the gravity anomaly andthe topography; or more formally, the square of thecorrelation coefficient in the frequency domainbetween the two signals. The coherence and admit-tance and between the gravity/geoid fields andthe topography for the four profiles are shown inFigure 7.
GeochemistryGeophysicsGeosystems G3G3 COBLENTZ ET AL.: SOUTHERN ROCKY MOUNTAINS COMPENSATION 10.1029/2010GC003459
11 of 18

[25] The coherence between the Bouguer gravityand topography is particularly useful for evaluatingthe elastic thickness of the lithosphere (Te). Theo-retical curves for various values of the elasticthickness (assuming a uniform load on the surface ofthe lithosphere and a crustal thickness of 30 km) areshown as the light blue lines in Figure 7a for a rangeof Te values (20 to 50 km). Large topographic loadswill flex even very strong plates (i.e., Te = 50 km);isostatic compensation produces a large Bougueranomaly and a coherence that approaches unity(for very long wavelengths). Shorter‐wavelength
features, in contrast, will be adequately supported bythe plate’s mechanical strength, generating little orno associated Bouguer anomaly. Thus the coher-ence approaches zero for short wavelengths. Thewavelength corresponding to the transition betweencoherent and incoherent gravity and topographyprovides a direct indication of the flexural rigidity(see discussion by Forsyth [1985], particularly onthe subject of surface versus internal loading of thelithosphere). The wavelength corresponding to acoherence of about 0.5 provides an estimate of thelength scale at which isostatic compensation begins
Figure 6. (a) Variations in the free‐air and Bouguer gravity anomalies, topography, upper mantle velocity anomaly at110 km [Schmandt and Humphreys, 2010], and the upper mantle‐lithospheric geoid (see text for explanation) along fourprofiles centered on 38.5°N, 38.5°N, 39°N, and 39.5°N. The composite profiles illustrate the strong correlation betweenthe high topography, upper mantle velocity anomaly, geoid, and Bouguer gravity across the southern Rockies. (b) Thespectral power for the Bouguer gravity, free‐air gravity, geoid, and topography along the 38.5°N profile illustrating thecharacteristic red spectra of these fields.
GeochemistryGeophysicsGeosystems G3G3 COBLENTZ ET AL.: SOUTHERN ROCKY MOUNTAINS COMPENSATION 10.1029/2010GC003459
12 of 18

to prevail over mechanical support (as load sizeincreases). As indicated by the theoretical curves inFigure 7, the transition wavelength for strong/thickplate can be as large as 600 km (for Te = 50 km) andwill be considerable less for weak/thin plates (e.g.,about 275 km for Te = 20 km). In the case of theprofiles considered here, loads with l ∼ 225 kmdelineate the transition from mechanical to isostatic
compensation. Referencing the theoretical curves inFigure 7, this is suggestive of an elastic thickness ofless than 20 km.
[26] The admittance also depends on the elasticthickness and can be viewed as a filter which pre-dicts the gravity anomaly given the topography[McKenzie and Bowin, 1976]. As discussed byForsyth [1985] the isostatic response function for
Figure 7. The (left) coherence and (right) admittance between the potential fields and topography: (a) Bouguer gravity,(b) free‐air gravity, and (c) geoid along the four profiles shown in Figure 6. Light blue lines in the Bouguer gravity‐topography coherence plot are theoretical curves for various values of the elastic thickness (assuming a uniform load onthe surface of the lithosphere and Moho thickness of 30 km). Theoretical admittance curves are shown in the Bouguergravity‐topography admittance plot for values of ro = 2700 kg/m3, dr = 670 kg/m3, and zc = 35 km. The dark bluecurve is the admittance curve for the pure Airy compensation case which corresponds to a flexural rigidity of zero.(d) Coherence between the Bouguer and free‐air gravity anomaly (blue) and Bouguer gravity anomaly and the geoid(red) illustrating the sharp dropoff in the coherence at wavelengths greater than 100 km.
GeochemistryGeophysicsGeosystems G3G3 COBLENTZ ET AL.: SOUTHERN ROCKY MOUNTAINS COMPENSATION 10.1029/2010GC003459
13 of 18

a model of a thin elastic plate loaded on top bytopography of density ro is:
Q kð Þ ¼ �2� �o G exp �k zcð Þ=�
where
� ¼ 1þ D k4=�� g
where G is defined as the gravitational constant;D, the flexural rigidity of the plate; g, the gravi-tational acceleration; dr, the density contrast atthe compensation interface (e.g., the crust‐mantledensity contrast), and zc the depth to the densitycontrast (e.g., the crustal thickness). Theoreticaladmittance curves for values of ro = 2700 kg/m3,dr = 670 kg/m3, and zc = 35 km, are shown as lightblue curves in the admittance plot in Figure 7.The dark blue curve is the admittance curve for thepure Airy compensation case which corresponds toa flexural rigidity of zero. The gravity anomalyproduced by topography with l < ∼200 km isless than about 10 mGal/km and is consistent witha Te < 20 km.
[27] For wholly uncompensated topography thefree‐air anomaly rather than the Bouguer gravitywill correlate with topography [Lambeck et al.,1988; McKenzie and Fairhead, 1997]. We note,however, that the coherence between the free‐airgravity and the topography (Figure 7b) is similar toBouguer gravity coherence (particularly at wave-lengths less than 200 km). For wavelengths greaterthan 300 km, however, the coherence of the freeair and topography is significantly less than theBouguer gravity‐topography coherence. Consistentwith the general observation that the free‐air gravityanomaly is near zero for most of the region[Thompson and Zoback, 1979] the free‐air admit-tance is near zero for all wavelengths.
[28] In contrast to the gravity fields, the coherencebetween the geoid and topography is high (greaterthan 0.75 for most wavelengths along the four pro-files) substantiating the notion that there is a strongcorrelation between the geoid and topography.Figure 7 illustrates that this is the case for nearly allwavelengths of topography (we do note, however,there is considerable scatter in the coherence for themost northern of the profiles considered (39.5°N).The admittance between the geoid and topographyis low (<2 m/km) for wavelengths less than about200 km, and increases significantly to the range of3–4 m/km at longer wavelengths. This is sugges-tive of significant, deep sources for the topography‐
geoid relationship most likely located in the uppermantle.
5. Discussion
[29] Using the fact that at long wavelengths the GTRcan be used to constrain the depth and mode ofcompensation [Sandwell and Renkin, 1988] we haveevaluated various mechanisms by which the hightopography of the southern Rocky Mountains canbe isostatically compensated. Within the frame-work of the neighboring tectonic provinces there areseveral commonalities that have important tectonicimplications.
[30] We first considered the geoid‐elevation ratiosbased on first‐order 1‐D isostatically balancedlithospheric columns. Using this approach, severalgeneralities can be applied. In general, features witha GTR greater than ∼6 m/km are sublithosphericallycompensated and are dynamically supported byconvective stresses [McKenzie et al., 1980]; thatis, supported by dynamic topography generated byconvection. The relatively high GTR value com-puted for Yellowstone (∼7 m/km) is consistent withthis scenario. Low GTR values (<2 m/km) areassociated with shallowly (<50 km) Airy or Pratt‐type compensated plateaus [Angevine and Turcotte,1983]. We note that none of the western U.S. tec-tonic provinces considered here fit this category.Finally, intermediate GTR values in the range of2–6 m/km reflect average compensation depths of50–80 km and suggests reheating of the lower lith-osphere [Crough, 1978]. Given that we find suchGTR values for the western United States (∼3.9 forthe southern Rockies, ∼4.25 for the Colorado Pla-teau, and ∼5.2 for the Northern Basin and Range),some kind of mantle lithospheric thinning in con-junction with crustal thickening is the most plausiblecompensation mechanism in the western UnitedStates. The notion that lithospheric strain is par-tioned between the crust and mantle lithosphereis supported by previous investigations [Sandifordand Powell, 1990].
[31] While isostatic elevation changes can be theresult of either crustal or mantle lithosphere mech-anisms, our analysis of the geoid‐topography rela-tionship indicates that variations in the thickness ofboth the crust and mantle lithosphere are required toproduce the modern elevation of the western UnitedStates in general and the southern Rockies in par-ticular. In the case of the central Rockies, a com-bination of a thick crust (∼45 km) in conjunctionwith significant thinning of the mantle lithosphere
GeochemistryGeophysicsGeosystems G3G3 COBLENTZ ET AL.: SOUTHERN ROCKY MOUNTAINS COMPENSATION 10.1029/2010GC003459
14 of 18
since the Oligocene (30 Ma) (presumably related todelamination of a denser upper mantle or thermalerosion) can explain the recent and pronounceduplift. In terms of the neighboring provinces, we find
that the Colorado Plateau topography can be sup-ported by a combination of relatively undisturbedmantle lithosphere with significant crustal thicken-ing (Figure 5); in the Northern Basin and Range,
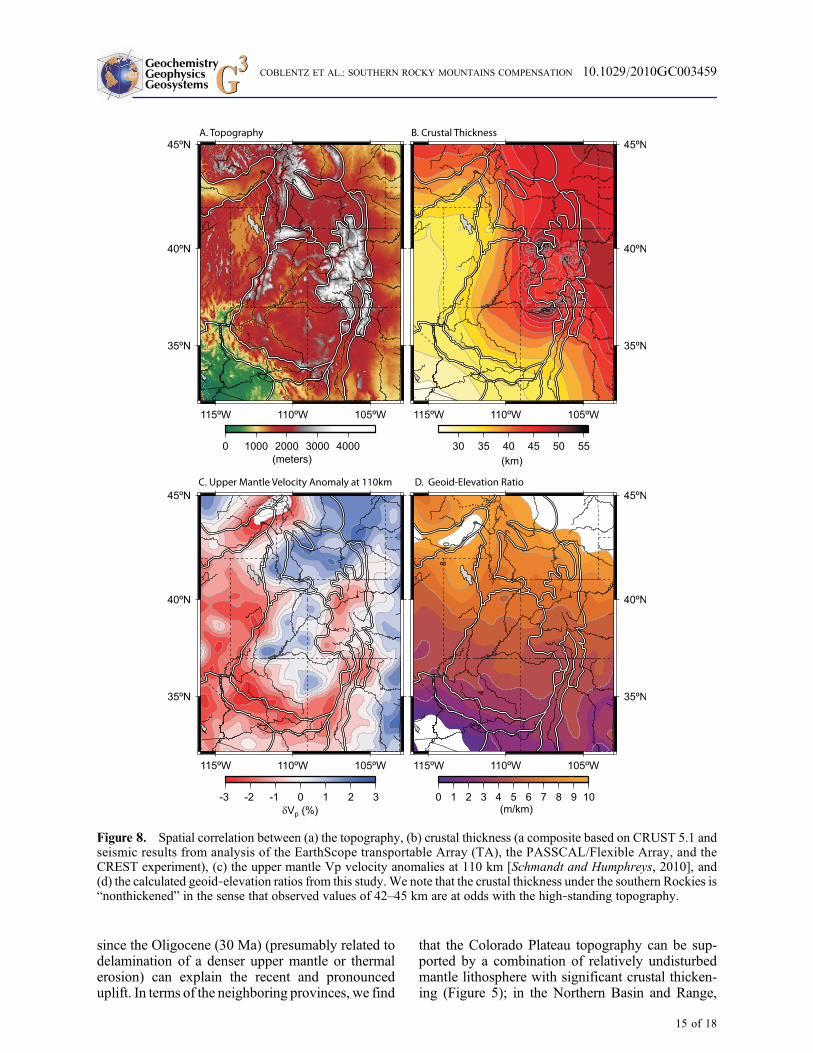
Figure 8. Spatial correlation between (a) the topography, (b) crustal thickness (a composite based on CRUST 5.1 andseismic results from analysis of the EarthScope transportable Array (TA), the PASSCAL/Flexible Array, and theCREST experiment), (c) the upper mantle Vp velocity anomalies at 110 km [Schmandt and Humphreys, 2010], and(d) the calculated geoid‐elevation ratios from this study.We note that the crustal thickness under the southern Rockies is“nonthickened” in the sense that observed values of 42–45 km are at odds with the high‐standing topography.
GeochemistryGeophysicsGeosystems G3G3 COBLENTZ ET AL.: SOUTHERN ROCKY MOUNTAINS COMPENSATION 10.1029/2010GC003459
15 of 18
in contrast, a wide range of mantle lithosphericstrains in combination with moderate crustal thick-ening satisfies the observed GTR information. Asexpected, mantle thinning plays a large role forYellowstone (with more than 50 km of thinningof initial very thick lithosphere. In general we findthat with the exception of the Colorado Plateau,the major tectonic provinces of the western UnitedStates have all undergone more than 40 km of lith-ospheric thinning during their tectonic evolution.
[32] Recent studies that evaluated the role of thecrustal portion of lithospheric buoyancy and con-cluded that pure Airy‐type correlation betweenelevation and crustal thickness (i.e., thicker crustassociated with higher elevation), exists only wherethe crust is very thick (>55 km) or very thin, less than20 km [Zoback and Mooney, 2003]. The importanttectonic implication is that non‐Airy lithosphericcompensation is more common than traditionallythought. This is indeed the case for the southernRockies where the emerging picture of a tectonicsetting where the observed crustal thicknesses(Figure 8b) are not big enough to compensated thehigh topography (Figure 8a) by purely Airy com-pensation. The lack of “sufficient” crustal rootsbeneath the central Rockies in conjunction with theexistence of profound upper mantle velocity varia-tions (Figure 8c) and high coherence betweenthe geoid and the topography (Figure 7) supportsthe notion that the anomalous upper mantle in thewestern United States (and the associated mantlebuoyancy) is a significant contributor to surfaceelevation (a notion dating back many years toThompson and Talwani [1964]).
[33] Our conclusion that upper mantle dynamicprocesses play an important role in the support ofthe topography of the central Rocky Mountainsraises the question of supporting, but plausible,geodynamic scenarios for the region. An assump-tion that observed upper mantle velocity variations(Figure 8c) are purely thermal, anelastic velocity‐temperature mapping of velocity anomalies con-strains the anomalies to be 200–300°C warmer thana 1300°C mantle adiabat for a pyrolitic mantlecomposition [Cammarano et al., 2003; Mouchaet al., 2009; van Wijk et al., 2010]. Such thermalheterogeneity at short scales requires advectivetransport of warmer than normal mantle rising froma deep thermal boundary layer. At larger scales,inversion of a global seismic traveltime and geo-dynamic surface observables for a mantle thermal/composition model [Simmons et al., 2009] findthe southwestern United States to be a region ofupwelling warm mantle from the base of the mantle
[Moucha et al., 2009]. A plausible hypothesis then,is that complex small‐scale upper mantle convectionand resulting buoyancy variations are driving ofdynamic uplift (on the order of 400–800m [vanWijket al., 2010]) in many parts of the western UnitedStates and is actively reshaping the physiographiccharacteristics of western U.S. tectonic provinces.This observation is consistent with recent Apatitefission track thermochronology that shows rapidexhumation in the Rockies starting 10–6 Ma atmodern elevations ranging from 1.5 to 3 km,requiring Neogene tectonic uplift [Karlstrom et al.,2008, 2010].
6. Conclusions
[34] Within the framework of the assumptions madefor this study, we draw two principal conclusions:(1) a major portion of the buoyancy that has drivenuplift in the southern Rockies resides at depths lessthan 100 km and that upper mantle processes suchas small‐scale convection may play a significantrole in the buoyant uplift of the southern Rockies (aswell as other actively uplifting areas of the westernUnited States) and (2) the high coherence for thegeoid‐topography relationship for nearly all wave-lengths between 50 and 1000 km suggests an inti-mate relationship between upper mantle dynamicprocesses and the surface topographic character.
Acknowledgments
[35] Thiswork has benefited from productive conversationswitha number of investigators. In particular, we acknowledge theinsightful comments and suggestions provided by the CRESTworking group (including but not limited to Ken Dueker, RickAster, Jonathan MacCarthy, Andres Aslan, and Sheri Kelley).RandyKeller and an anonymous reviewer are thanked for insight-ful comments. Jonathan MacCarthy is thanked for pro-viding Figure 1. This manuscript is released under Los AlamosNational Laboratory LAUR‐10‐08105.
References
Abt, D. L., K. M. Fischer, S. W. French, H. A. Ford, H. Y.Yuan, and B. Romanowicz (2010), North American litho-spheric discontinuity structure imaged by Ps and Sp receiverfunctions, J. Geophys. Res., 115, B09301, doi:10.1029/2009JB006914.
Angevine, C. L., and D. L. Turcotte (1983), Correlation ofgeoid and depth anomalies over the Agulhas Plateau, Tecto-nophysics, 100(1–3), 43–52, doi:10.1016/0040-1951(83)90177-4.
Aster, R., J. MacCarthy, M. T. Heizler, S. A. Kelley,K. Karlstrom, L. Crossey, and K. Dueker (2009), Experiment
GeochemistryGeophysicsGeosystems G3G3 COBLENTZ ET AL.: SOUTHERN ROCKY MOUNTAINS COMPENSATION 10.1029/2010GC003459
16 of 18
probes the roots and geologic history of the ColoradoRockies, Outcrop, 58, 6–23.
Banks, R. J., R. L. Parker, and S. P. Huestis (1977), Isostaticcompensation on a continental scale—Local versus regionalmechanisms, Geophys. J. R. Astron. Soc., 51(2), 431–452.
Bechtel, T. D., D. W. Forsyth, V. L. Sharpton, and R. A. F.Grieve (1990), Variations in effective elastic thickness ofthe North American lithosphere, Nature, 343(6259), 636–638,doi:10.1038/343636a0.
Bechtel, T. D., D. W. Forsyth, and C. Swain (1999), Mechan-isms of isostatic compensation in the vicinity of the EastAfrican Rift, Kenya, Kyklos, 52, 445–465.
Cammarano, F., S. Goes, P. Vacher, and D. Giardini (2003),Inferring upper‐mantle temperatures from seismic velocities,Phys. Earth Planet. Inter., 138(3–4), 197–222, doi:10.1016/S0031-9201(03)00156-0.
Chase, C. G., J. A. Libarkin, and A. J. Sussman (2002), Color-ado Plateau: Geoid and means of isostatic support, Int. Geol.Rev., 44(7), 575–587, doi:10.2747/0020-6814.44.7.575.
Coblentz, D., and K. Stüwe (2002), A review of using the fc‐fldiagram to evaluate continental deformation, in Plate Bound-ary Processes, Geodyn. Ser., vol. 30, edited by S. Stein andJ. T. Freymueller, pp. 283–294, AGU, Washington, D. C.
Coblentz, D., R. M. Richardson, and M. Sandiford (1994),On the gravitational potential of the Earth’s lithosphere,Tectonics, 13(4), 929–945, doi:10.1029/94TC01033.
Coblentz, D., J. C. Libarkin, C. G. Chase, and A. J. Sussman(2007), Paleolithospheric structure revealed by continentalgeoid anomalies, Tectonophysics, 443(1–2), 106–120,doi:10.1016/j.tecto.2007.06.003.
Crough, S. T. (1978), Thermal origin of mid‐plate hot‐spotswells, Geophys. J. R. Astron. Soc., 55(2), 451–469.
Crough, S. T. (1979), Geoid anomalies across fracture‐zonesand the thickness of the lithosphere, Earth Planet. Sci. Lett.,44(2), 224–230, doi:10.1016/0012-821X(79)90170-5.
Cserepes, L., U. R. Christensen, and N. M. Ribe (2000), Geoidheight versus topography for a plume model of the Hawaiianswell , Earth Planet . Sci . Let t . , 178(1–2), 29–38,doi:10.1016/S0012-821X(00)00065-0.
Doin, M. P., L. Fleitout, and D. McKenzie (1996), Geoidanomalies and the structure of continental and oceanic litho-spheres, J. Geophys. Res., 101(B7), 16,119–16,135,doi:10.1029/96JB00640.
Dorman, L. M., and B. T. R. Lewis (1970), Experimental isos-tasy: 1. Theory of determination of Earth’s isostatic responseto a concentrated load, J. Geophys. Res., 75(17), 3357–3365,doi:10.1029/JB075i017p03357.
Dorman, L. M., and B. T. R. Lewis (1972), Experimental isos-tasy: 3. Inversion of isostatic Green function and lateral den-sity changes, J. Geophys. Res., 77(17), 3068–3077,doi:10.1029/JB077i017p03068.
Eaton, G. P. (1986), A tectonic redefinition of the southernRocky Mountains, Tectonophysics , 132 , 163–193,doi:10.1016/0040-1951(86)90031-4.
Eaton, G. P. (2008), Epeirogeny in the southern RockyMountains region: Evidence and origin, Geosphere, 4(5),764–784, doi:10.1130/GES00149.1.
Ebbing, J., C. Braitenberg, and H. J. Gotze (2001), Forwardand inverse modelling of gravity revealing insight intocrustal structures of the eastern Alps, Tectonophysics,337(3–4), 191–208, doi:10.1016/S0040-1951(01)00119-6.
Forsyth, D. W. (1985), Subsurface loading and estimates of theflexural rigidity of continental lithosphere, J. Geophys. Res.,90, 12,623–12,632.
Grevemeyer, I. (1999), Isostatic geoid anomalies over mid‐plate swells in the central North Atlantic, J. Geodyn.,28(1), 41–50, doi:10.1016/S0264-3707(98)00031-3.
Hansen, S., J. Stachnik, and D. K. Dueker (2011), Lithosphericstructure of the Colorado Rockies from CREST and TA seis-mic data, Geophys. Res. Abstr., 13, Abstract EGU2011‐13560.
Haxby, W. F., and D. L. Turcotte (1978), Isostatic geoidanomalies, J. Geophys. Res., 83, 5473–5478, doi:10.1029/JB083iB11p05473.
Humphreys, E. D., and K. G. Dueker (1994), Western U.S.upper mantle structure, J. Geophys. Res., 99(B5), 9615–9634, doi:10.1029/93JB01724.
Jones, C. H., J. R. Unruh, and L. J. Sonder (1996), The role ofgravitational potential energy in active deformation in thesouthwestern United States, Nature, 381(6577), 37–41.
Jones, C. H., L. J. Sonder, and J. R. Unruh (1998), Litho-spheric gravitational potential energy and past orogenesis:Implications for conditions of initial basin and range andLaramide deformation, Geology, 26(7), 639–642.
Karlstrom, K. E., and E. D. Humphreys (1998), Persistentinfluence of Proterozoic accretionary boundaries in the tec-tonic evolution of southwestern North America, Rocky Mt.Geol., 33, 161–179.
Karlstrom, K. E., R. Crow, L. J. Crossey, D. Coblentz, andJ. van Wijk (2008), Model for tectonically driven incisionof the <6 Ma Grand Canyon, Geology, 36, 835–838,doi:10.1130/G25032A.1.
Karlstrom, K. E., K. Dueker, R. Aster, J. K. MacCarthy,S. Hansen, R. Crow, S. Kelley, and D. Coblentz (2010),CREST—Colorado Rockies Experiment and Seismic Trans-ects: Time‐space patterns of Neogene uplift and their corre-spondence to the Aspen anomaly, Geol. Soc. Am. Abstr.Programs, 42(5), 77.
Lambeck, K., G. Burgess, and R. D. Shaw (1988), Teleseismictravel‐time anomalies and deep crustal structure in centralAustralia, Geophys. J., 94(1), 105–124.
Li, A. B., D. W. Forsyth, and K. M. Fischer (2002), Evidencefor shallow isostatic compensation of the southern RockyMountains from Rayleigh wave tomography, Geology,30(8), 683–686, doi:10.1130/0091-7613(2002)030<0683:EFSICO>2.0.CO;2.
Londe, M. D. (1990), The isostatic compensation of theColorado Plateau‐Basin and Range transition zone in centralUtah, Tectonophysics, 174(1–2), 63–76, doi:10.1016/0040-1951(90)90384-K.
Martinec, Z. (1994a), The minimum depth of compensation oftopographic masses, Geophys. J. Int., 117(2), 545–554,doi:10.1111/j.1365-246X.1994.tb03951.x.
Martinec, Z. (1994b), The density contrast at the Mohorovicicdiscont inuity, Geophys. J. Int . , 117(2), 539–544,doi:10.1111/j.1365-246X.1994.tb03950.x.
McKenzie, D., and C. Bowin (1976), Relationship betweenbathymetry and gravity in Atlantic Ocean, J. Geophys.Res., 81(11), 1903–1915, doi:10.1029/JB081i011p01903.
McKenzie, D., and D. Fairhead (1997), Estimates of the effec-tive elastic thickness of the continental lithosphere fromBouguer and free air gravity anomalies, J. Geophys. Res.,102(B12), 27,523–27,552, doi:10.1029/97JB02481.
McKenzie, D., A. Watts, B. Parsons, and M. Roufosse (1980),Planform of mantle convection beneath the Pacific Ocean,Nature, 288(5790), 442–446, doi:10.1038/288442a0.
McNutt, M. K., and H. W. Menard (1979), Reply, J. Geophys.Res., 84(10), 5695–5697.
GeochemistryGeophysicsGeosystems G3G3 COBLENTZ ET AL.: SOUTHERN ROCKY MOUNTAINS COMPENSATION 10.1029/2010GC003459
17 of 18

McNutt, M. K., and H. W. Menard (1982), Constraintson yield strength in the oceanic lithosphere derived fromobservations of flexure, Geophys. J. R. Astron. Soc., 71(2),363–394.
Moucha, R., A. Forte, D. Rowlegy, J. Mitrovica, N. Simmons,and S. Grand (2009), Deep mantle forces and the uplift of theColorado Plateau, Geophys. Res. Lett., 36, L19310,doi:10.1029/2009GL039778.
Panasyuk, S. V., and B. H. Hager (2000), Models of isostaticand dynamic topography, geoid anomalies, and their uncer-tainties, J. Geophys. Res., 105(B12), 28,199–28,209,doi:10.1029/2000JB900249.
Pavils, N. K., S. A. Holmes, S. C. Kenyon, and J. K. Factor(2008), An Earth gravitational model to degree 2160:EGM2008, paper presented at General Assembly, Eur.Geosci. Union, Vienna, 13–18 April.
Pilkington, M. (1990), Lithospheric flexure and gravityanomalies at Proterozoic plate boundaries in the CanadianShield, Tectonophysics, 176(3–4), 277–290, doi:10.1016/0040-1951(90)90074-I.
Sandiford, M., and R. Powell (1990), Some isostatic andthermal consequences of the vertical strain geometry in con-vergent orogens, Earth Planet. Sci. Lett., 98(2), 154–165,doi:10.1016/0012-821X(90)90056-4.
Sandwell, D. T., and K. R. MacKenzie (1989), Geoidheight versus topography for oceanic plateaus and swells,J. Geophys. Res., 94(B6), 7403–7418, doi:10.1029/JB094iB06p07403.
Sandwell, D. T., and M. L. Renkin (1988), Compensation ofswells and plateaus in the North Pacific: No direct evidencefor mantle convection, J. Geophys. Res., 93(B4), 2775–2783, doi:10.1029/JB093iB04p02775.
Schmandt, B., and E. Humphreys (2010), Complex subductionand small‐scale convection revealed by body‐wave tomogra-phy of the western United States upper mantle, Earth Planet.Sci. Lett., 297(3–4), 435–445, doi:10.1016/j.epsl.2010.06.047.
Simmons, N., A. Forte, and S. Grand (2009), Joint seismic,geodynamic and mineral physics constraints on three‐dimensional mantle heterogeneity: Implications for therelative importance of thermal versus compositional hetero-geneity, Geophys. J. Int., 177, 1284–1304, doi:10.1111/j.1365-246X.2009.04133.x.
Sonder, L. J., and C. H. Jones (1999), Western United Statesextension: How the West was widened, Annu. Rev. EarthPlanet. Sci., 27, 417–466.
Suppe, J., C. Powell, and R. Berry (1975), Regional topogra-phy, seismicity, Quaternary volcanism, and present‐day tec-tonics of western United States, Am. J. Sci., A275, 397–436.
Thompson, G. A., and M. Talwani (1964), Geology of thecrust and mantle, western United States: Geophysical datareveal a thin crust and anomalous upper mantle characteristicof active regions, Science , 146(3651), 1539–1549,doi:10.1126/science.146.3651.1539.
Thompson, G. A., and M. L. Zoback (1979), Regional geo-physics of the Colorado Plateau, Tectonophysics, 61(1–3),149–181, doi:10.1016/0040-1951(79)90296-8.
Turcotte, D. L., and D. C. Mcadoo (1979), Geoid anomaliesand the thickness of the lithosphere, J. Geophys. Res.,84(B5), 2381–2387.
Turcotte, D. L., and G. Schubert (2002), Geodynamics,2nd ed., 456 pp., Cambridge Univ. Press, Cambridge, U. K.
van Wijk, J. W., W. S. Baldridge, J. Hunen, S. Goes, R. Aster,D. Coblentz, S. Grand, and J. Ni (2010), Small‐scale convec-tion at the edge of the Colorado Plateau: Implications fortopography, magmatism, and evolution of Proterozoic litho-sphere, Geology, 38(7), 611–614, doi:10.1130/G31031.1.
Watts, A. B. (1978), Observations of flexure, Eos Trans. AGU,59(4), 371.
Watts, A. B. (2001), Isostasy and Flexure of the Lithosphere,458 pp., Cambridge Univ. Press, Cambridge, U. K.
Wessel, P. (1993), Observational constraints on models ofthe Hawaiian hot‐spot swell, J. Geophys. Res., 98(B9),16,095–16,104, doi:10.1029/93JB01230.
Yuan, H. Y., and B. Romanowicz (2010), Lithospheric layer-ing in the North American craton, Nature, 466(7310), 1063–1068, doi:10.1038/nature09332.
Zhou, S. H., and M. Sandiford (1992), On the stability of iso-statically compensated mountain belts, J. Geophys. Res.,97(B10), 14,207–14,221, doi:10.1029/92JB01091.
Zoback, M. L., and W. D. Mooney (2003), Lithospheric buoy-ancy and continental intraplate stresses, Int. Geol. Rev.,45(2), 95–118, doi:10.2747/0020-6814.45.2.95.
GeochemistryGeophysicsGeosystems G3G3 COBLENTZ ET AL.: SOUTHERN ROCKY MOUNTAINS COMPENSATION 10.1029/2010GC003459
18 of 18