
Topics in GIS Webinar Workshop - Emory University · Topics in GIS Webinar Workshop ... 20. Using...
86
Using Census 2010/ American Community Survey Data For Cancer Surveillance 7/11/13 NAACCR Webinar Series 2012‐2013 1 Topics in GIS Webinar Workshop Using Census 2010/American Community Survey Data for Cancer Surveillance Q&A • Please submit all questions concerning webinar content through the Q&A panel. Reminder: • If you have participants watching this webinar at your site, please collect their names and emails. – We will be distributing a Q&A document in about one week. This document will fully answer questions asked during the webinar and will contain any corrections that we may discover after the webinar.
-
Upload
truongngoc -
Category
Documents
-
view
214 -
download
1
Transcript of Topics in GIS Webinar Workshop - Emory University · Topics in GIS Webinar Workshop ... 20. Using...
Using Census 2010/ American Community Survey Data For Cancer Surveillance
7/11/13
NAACCR Webinar Series 2012‐2013 1
Topics in GIS Webinar Workshop
Using Census 2010/AmericanCommunity Survey Data for Cancer Surveillance
Q&A• Please submit all questions concerning webinar content through the Q&A panel.
Reminder:• If you have participants watching this webinar at your site, please collect their names and emails.– We will be distributing a Q&A document in about one week. This document will fully answer questions asked during the webinar and will contain any corrections that we may discover after the webinar.

Using Census 2010/ American Community Survey Data For Cancer Surveillance
7/11/13
NAACCR Webinar Series 2012‐2013 2
Fabulous Prizes
NAACCR WebinarTopics in GIS – July 11, 2013Using Census 2010/American Community Survey Data for Cancer Surveillance
Overview
Using Census 2010/ American Community Survey Data For Cancer Surveillance
7/11/13
NAACCR Webinar Series 2012‐2013 3
Faculty
• Dr. Frank Boscoe– New York State Cancer Registry
• Dr. Dan Goldberg– Texas A & M University
• Recinda Sherman– Florida Cancer Data System
• David Stinchcomb– Westat
5
Agenda
• Census 2010 – David • ACS – Recinda
15 minute break
• Denominator Data and Cancer Rates – Dan, All • Accessing Census Data – David
– NAACCR Tools/Datasets
6
Using Census 2010/ American Community Survey Data For Cancer Surveillance
7/11/13
NAACCR Webinar Series 2012‐2013 4
Questions
During Webinar:• Please send to Q&A as they come up• Will be answered at end of each section or end of session
Post Webinar:
Dan: [email protected]: [email protected]: [email protected]: [email protected]
7
GIS Committee
Census Work Groupuser forum, resource provider
8
Using Census 2010/ American Community Survey Data For Cancer Surveillance
7/11/13
NAACCR Webinar Series 2012‐2013 5
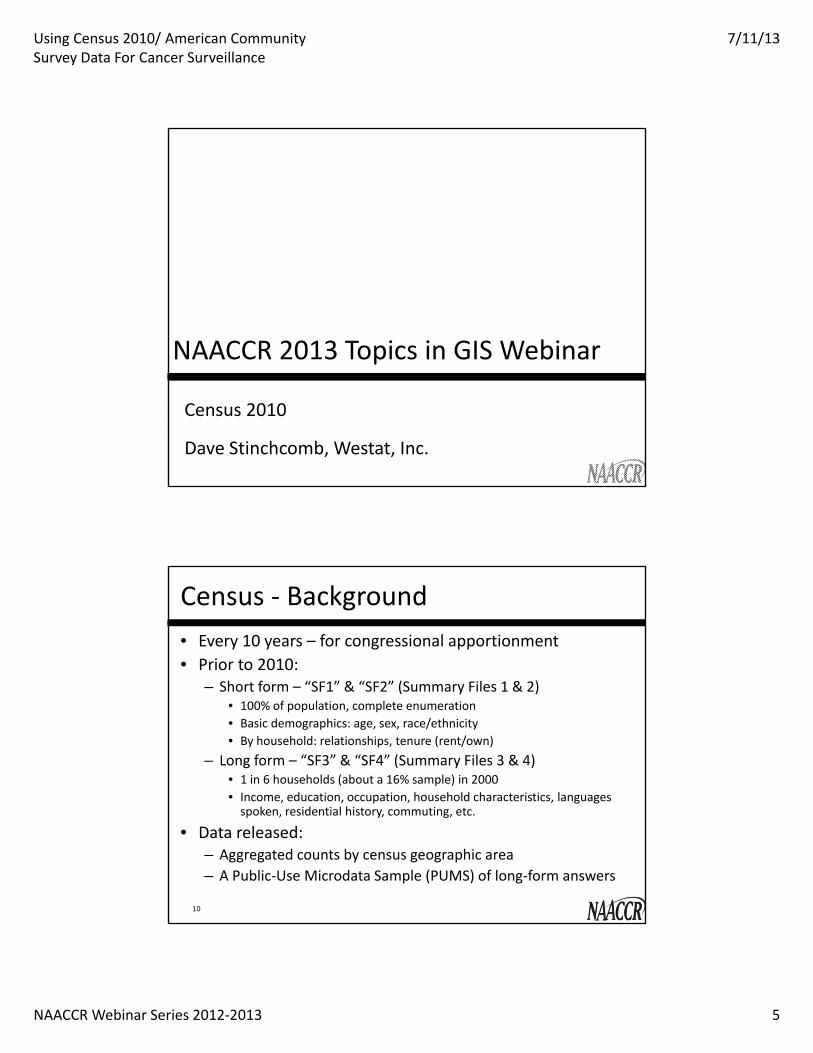
NAACCR 2013 Topics in GIS Webinar
Census 2010
Dave Stinchcomb, Westat, Inc.
Census ‐ Background• Every 10 years – for congressional apportionment• Prior to 2010:
– Short form – “SF1” & “SF2” (Summary Files 1 & 2)• 100% of population, complete enumeration• Basic demographics: age, sex, race/ethnicity• By household: relationships, tenure (rent/own)
– Long form – “SF3” & “SF4” (Summary Files 3 & 4)• 1 in 6 households (about a 16% sample) in 2000• Income, education, occupation, household characteristics, languages spoken, residential history, commuting, etc.
• Data released:– Aggregated counts by census geographic area– A Public‐Use Microdata Sample (PUMS) of long‐form answers
10
Using Census 2010/ American Community Survey Data For Cancer Surveillance
7/11/13
NAACCR Webinar Series 2012‐2013 6
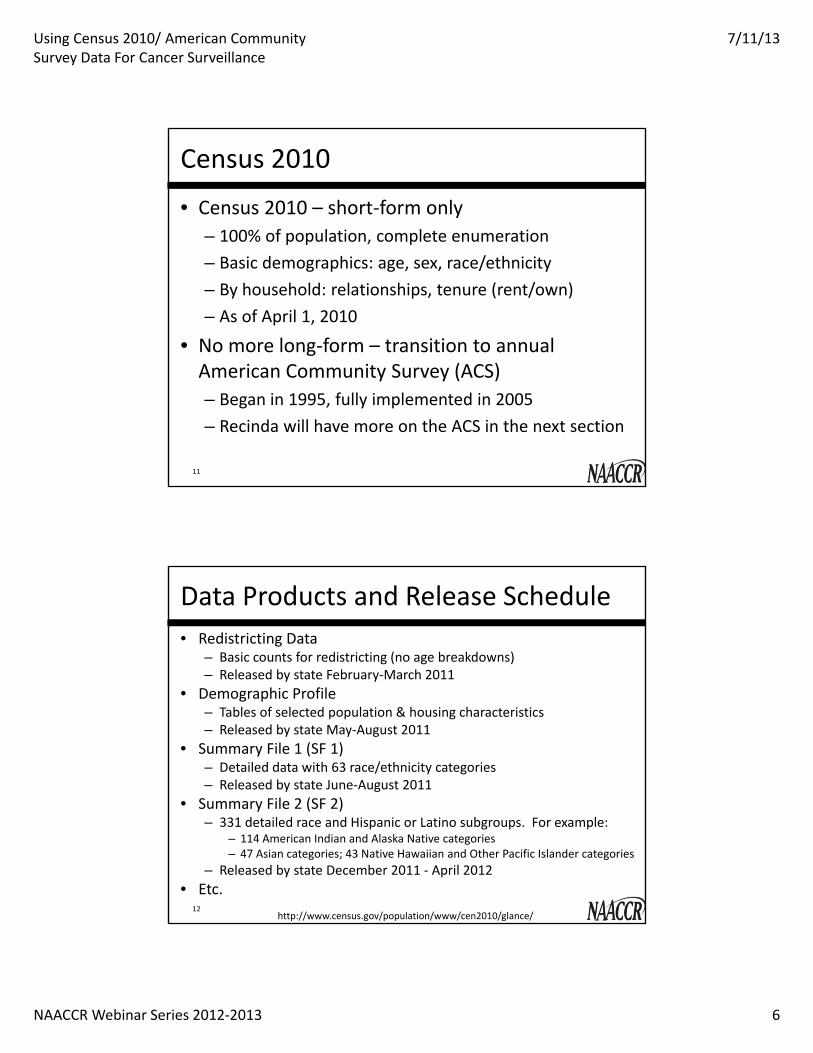
Census 2010
• Census 2010 – short‐form only– 100% of population, complete enumeration– Basic demographics: age, sex, race/ethnicity– By household: relationships, tenure (rent/own)– As of April 1, 2010
• No more long‐form – transition to annual American Community Survey (ACS)– Began in 1995, fully implemented in 2005– Recinda will have more on the ACS in the next section
11
Data Products and Release Schedule• Redistricting Data
– Basic counts for redistricting (no age breakdowns)– Released by state February‐March 2011
• Demographic Profile– Tables of selected population & housing characteristics– Released by state May‐August 2011
• Summary File 1 (SF 1)– Detailed data with 63 race/ethnicity categories– Released by state June‐August 2011
• Summary File 2 (SF 2)– 331 detailed race and Hispanic or Latino subgroups. For example:
– 114 American Indian and Alaska Native categories– 47 Asian categories; 43 Native Hawaiian and Other Pacific Islander categories
– Released by state December 2011 ‐ April 2012• Etc.
12http://www.census.gov/population/www/cen2010/glance/
Using Census 2010/ American Community Survey Data For Cancer Surveillance
7/11/13
NAACCR Webinar Series 2012‐2013 7
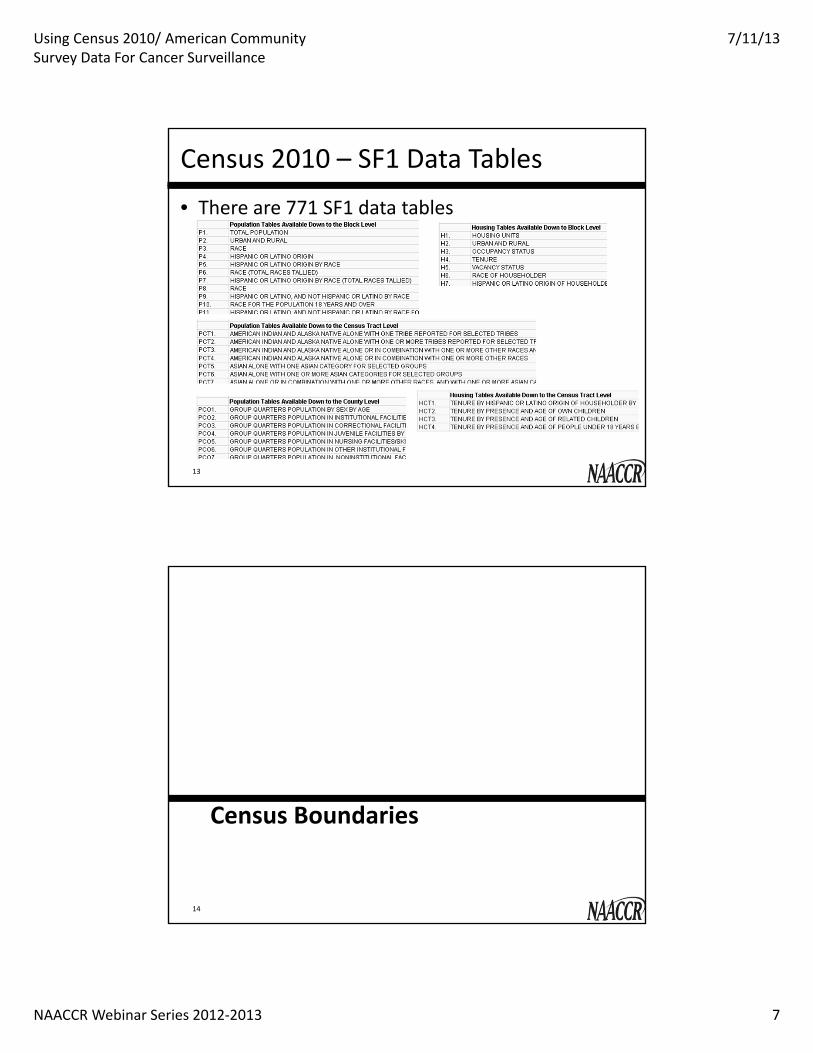
Census 2010 – SF1 Data Tables
• There are 771 SF1 data tables
13
Census Boundaries
14
Using Census 2010/ American Community Survey Data For Cancer Surveillance
7/11/13
NAACCR Webinar Series 2012‐2013 8
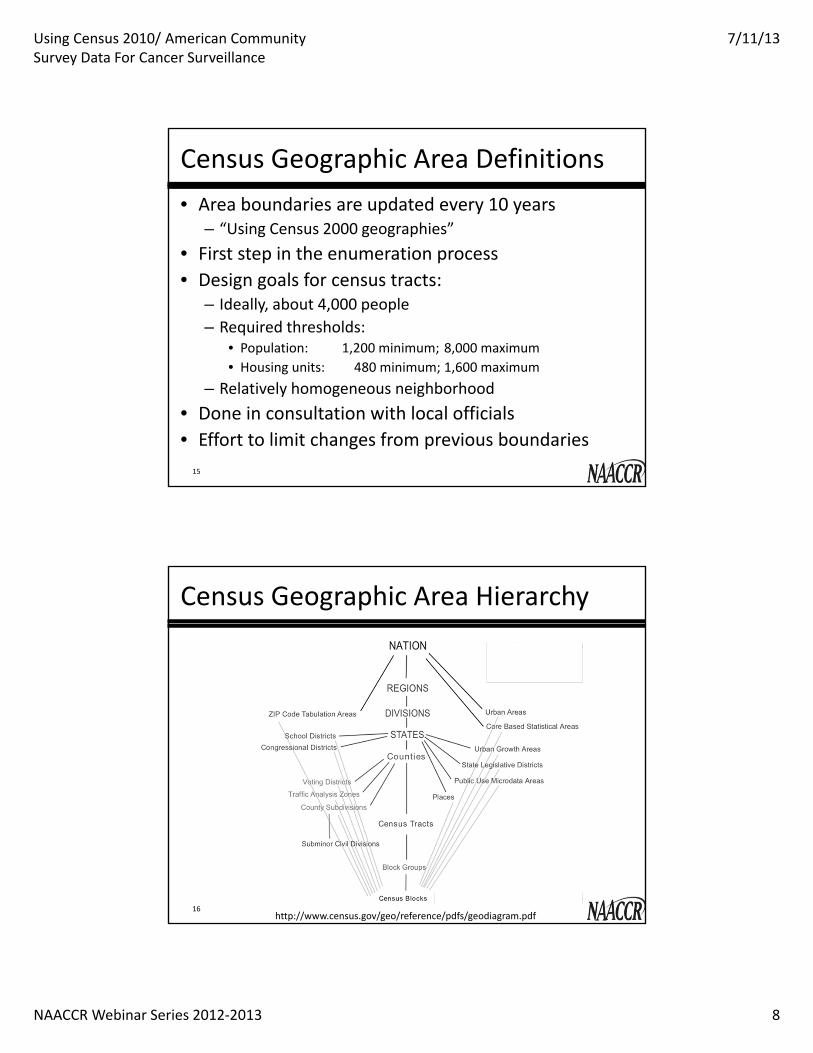
Census Geographic Area Definitions• Area boundaries are updated every 10 years
– “Using Census 2000 geographies”• First step in the enumeration process• Design goals for census tracts:
– Ideally, about 4,000 people– Required thresholds:
• Population: 1,200 minimum; 8,000 maximum• Housing units: 480 minimum; 1,600 maximum
– Relatively homogeneous neighborhood• Done in consultation with local officials• Effort to limit changes from previous boundaries
15
Census Geographic Area Hierarchy
16http://www.census.gov/geo/reference/pdfs/geodiagram.pdf
Using Census 2010/ American Community Survey Data For Cancer Surveillance
7/11/13
NAACCR Webinar Series 2012‐2013 9
Summary Levels
• A three digit code to indicate the geographic level of detail
• For example:– 040: State
• 050: State‐County– 140: State‐County‐Census Tract
» 150: State‐County‐Census Tract‐Block Group
• Useful in American FactFinder as well as for custom processing of Census data files
17
Census Area Codes (FIPS/ANSI codes)• Each census area is identified with a numeric code
– States, counties, and Census places use national standards• Formerly the Federal Information Processing Standards (FIPS) from National Institute of Standards and Technology (NIST)
• Converting to American National Standards Institute (ANSI) for future maintenance of place codes
• Number of digits for the main census hierarchy:– State (2), county (3), tract (6), block group (1), block (3)
• Census tract code has an implied 2 decimals– 001234 = “Tract 12.34”, 123400 = “Tract 1234”– Source of coding errors in NAACCR records
• Fully‐qualified census tract: 11 digits18
Using Census 2010/ American Community Survey Data For Cancer Surveillance
7/11/13
NAACCR Webinar Series 2012‐2013 10
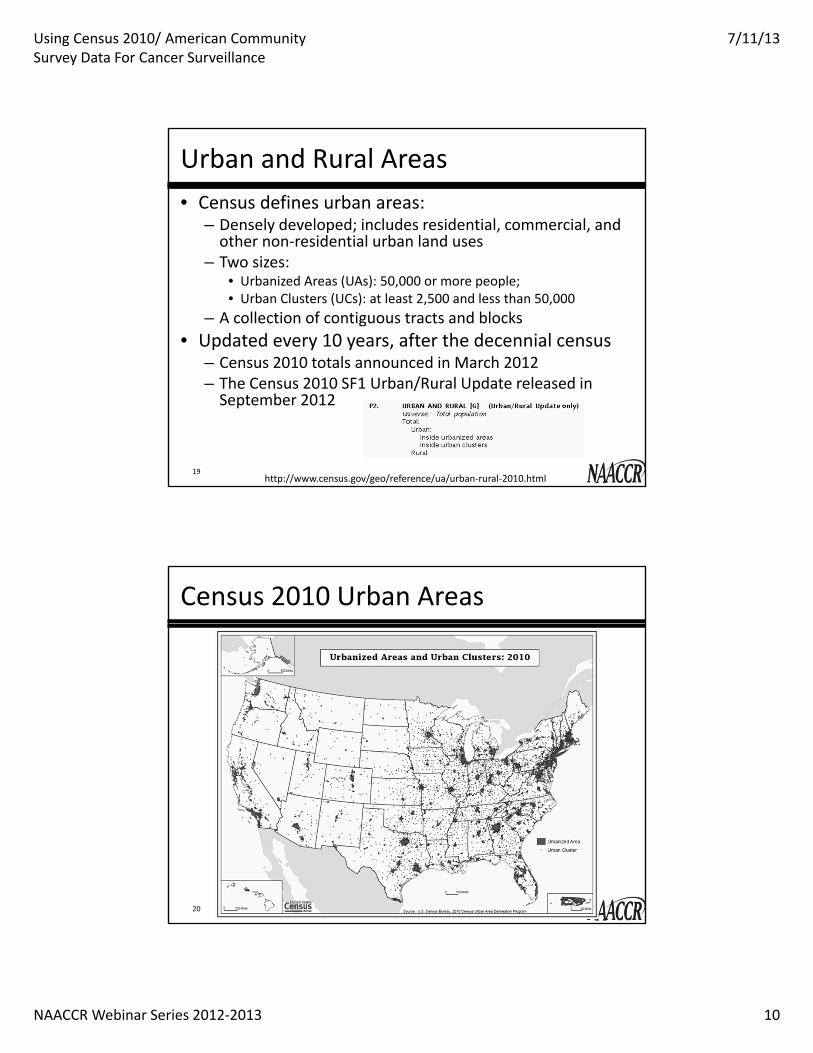
Urban and Rural Areas• Census defines urban areas:
– Densely developed; includes residential, commercial, and other non‐residential urban land uses
– Two sizes:• Urbanized Areas (UAs): 50,000 or more people; • Urban Clusters (UCs): at least 2,500 and less than 50,000
– A collection of contiguous tracts and blocks• Updated every 10 years, after the decennial census
– Census 2010 totals announced in March 2012– The Census 2010 SF1 Urban/Rural Update released in September 2012
19http://www.census.gov/geo/reference/ua/urban‐rural‐2010.html
Census 2010 Urban Areas
20
Using Census 2010/ American Community Survey Data For Cancer Surveillance
7/11/13
NAACCR Webinar Series 2012‐2013 11
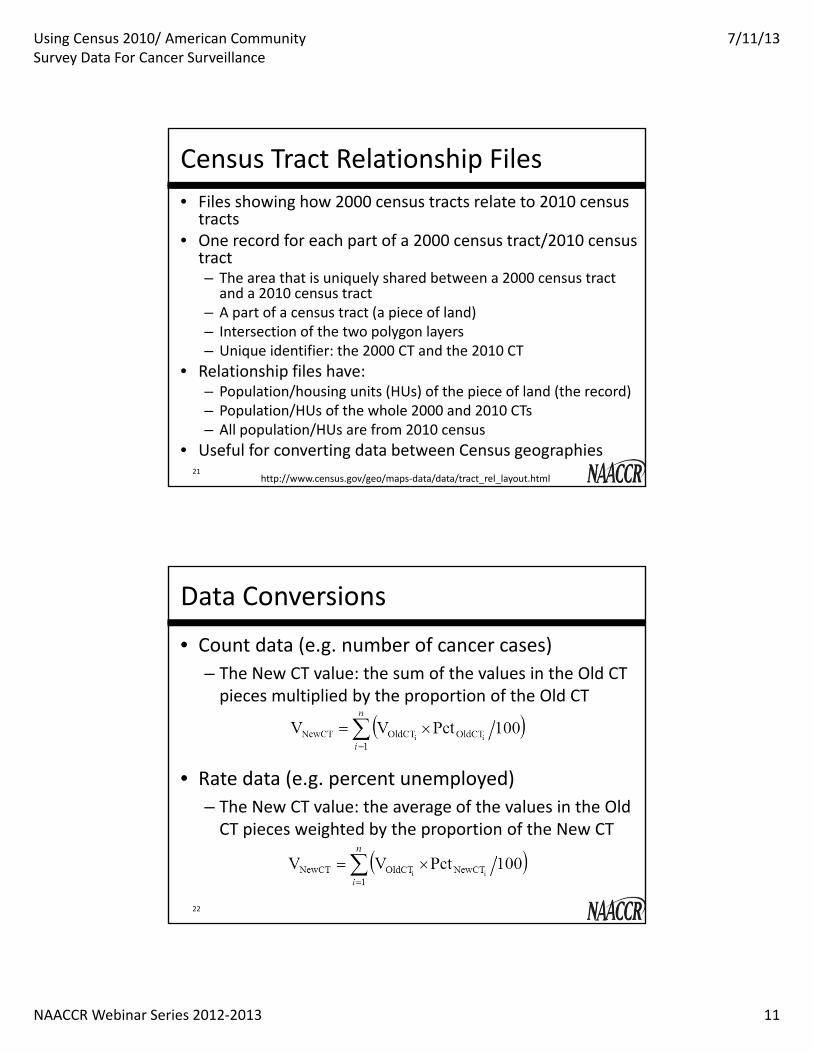
Census Tract Relationship Files• Files showing how 2000 census tracts relate to 2010 census tracts
• One record for each part of a 2000 census tract/2010 census tract– The area that is uniquely shared between a 2000 census tract and a 2010 census tract
– A part of a census tract (a piece of land)– Intersection of the two polygon layers– Unique identifier: the 2000 CT and the 2010 CT
• Relationship files have:– Population/housing units (HUs) of the piece of land (the record)– Population/HUs of the whole 2000 and 2010 CTs– All population/HUs are from 2010 census
• Useful for converting data between Census geographies21
http://www.census.gov/geo/maps‐data/data/tract_rel_layout.html
Data Conversions
• Count data (e.g. number of cancer cases)– The New CT value: the sum of the values in the Old CT pieces multiplied by the proportion of the Old CT
• Rate data (e.g. percent unemployed)– The New CT value: the average of the values in the Old CT pieces weighted by the proportion of the New CT
22
Using Census 2010/ American Community Survey Data For Cancer Surveillance
7/11/13
NAACCR Webinar Series 2012‐2013 12
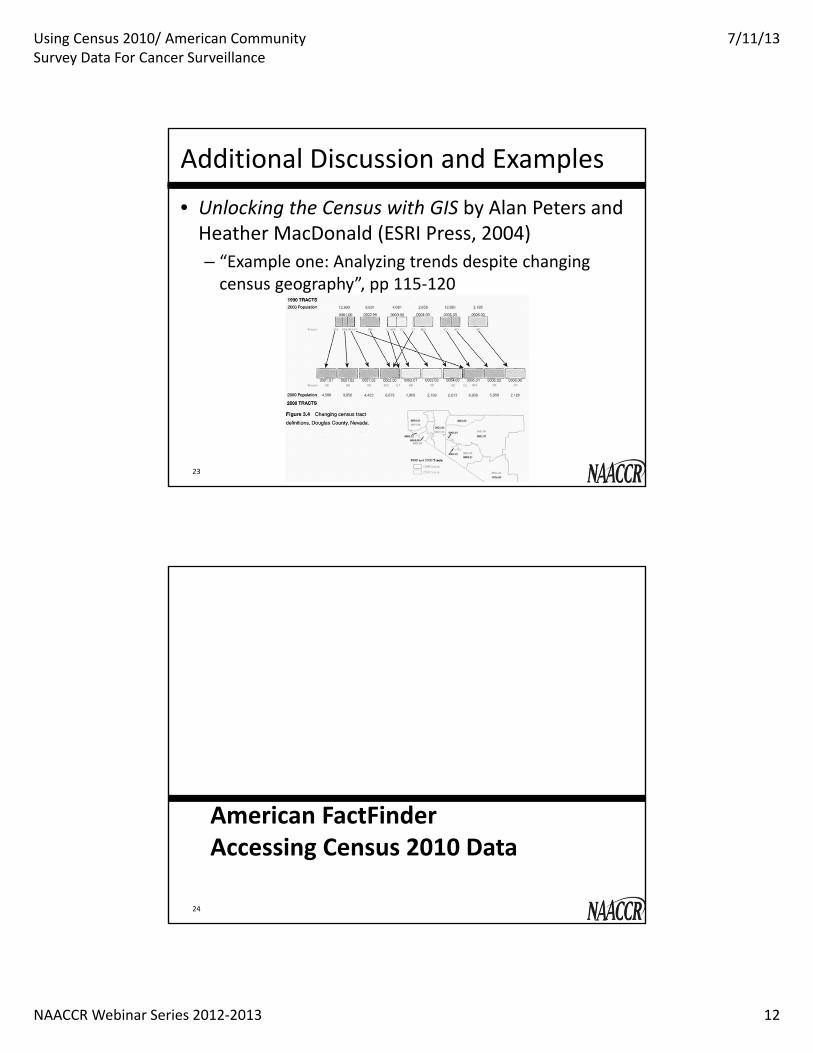
Additional Discussion and Examples
• Unlocking the Census with GIS by Alan Peters and Heather MacDonald (ESRI Press, 2004)– “Example one: Analyzing trends despite changing census geography”, pp 115‐120
23
American FactFinderAccessing Census 2010 Data
24

Using Census 2010/ American Community Survey Data For Cancer Surveillance
7/11/13
NAACCR Webinar Series 2012‐2013 13
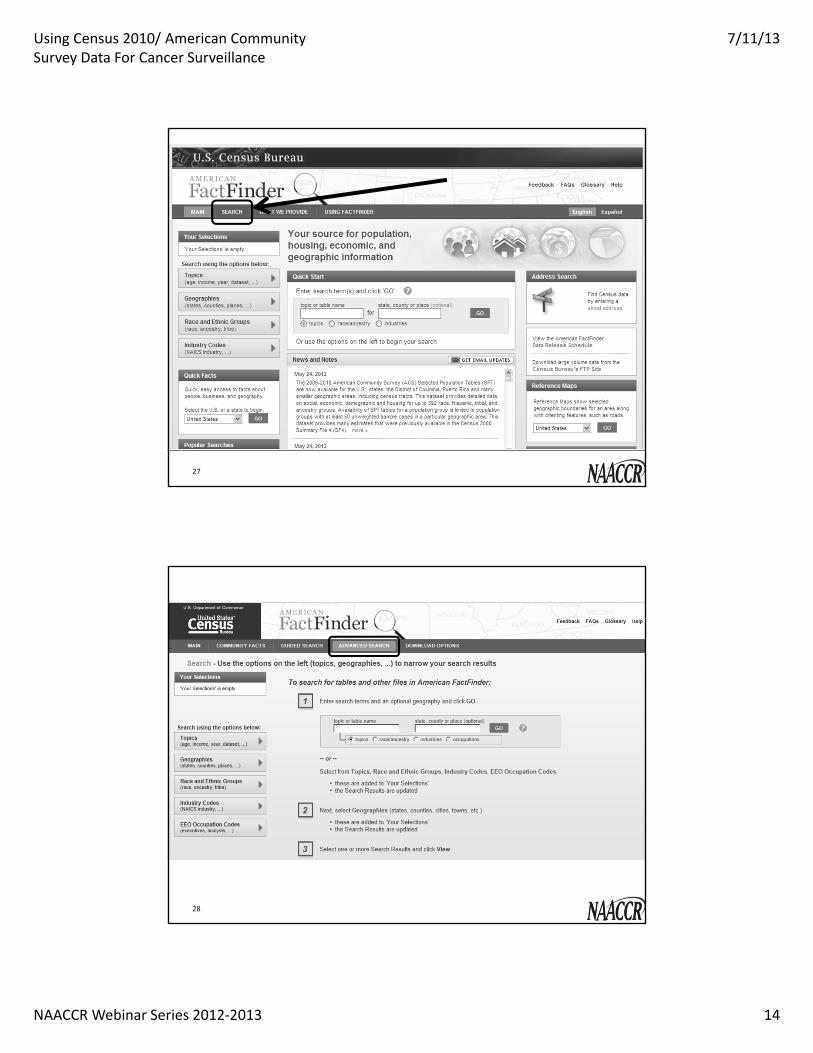
American FactFinder – Introduction
• Interactive Web interface to most Census Bureau data products
• Original “legacy” version has been retired• The New American FactFinder – FactFinder2
– http://www.census.gov/• Data tab –> American FactFinder
– http://factfinder2.census.gov/– Google “american factfinder” or “factfinder2”
• New features are being added quarterly
25
26
Using Census 2010/ American Community Survey Data For Cancer Surveillance
7/11/13
NAACCR Webinar Series 2012‐2013 14
27
28
Using Census 2010/ American Community Survey Data For Cancer Surveillance
7/11/13
NAACCR Webinar Series 2012‐2013 15
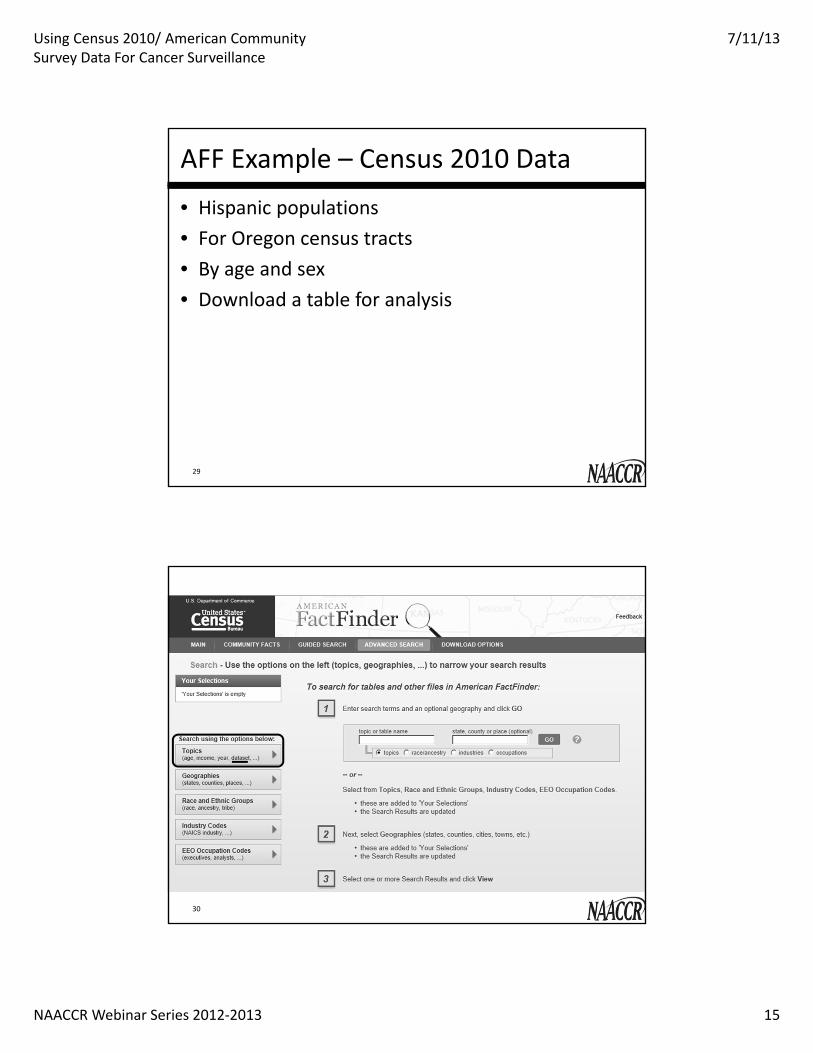
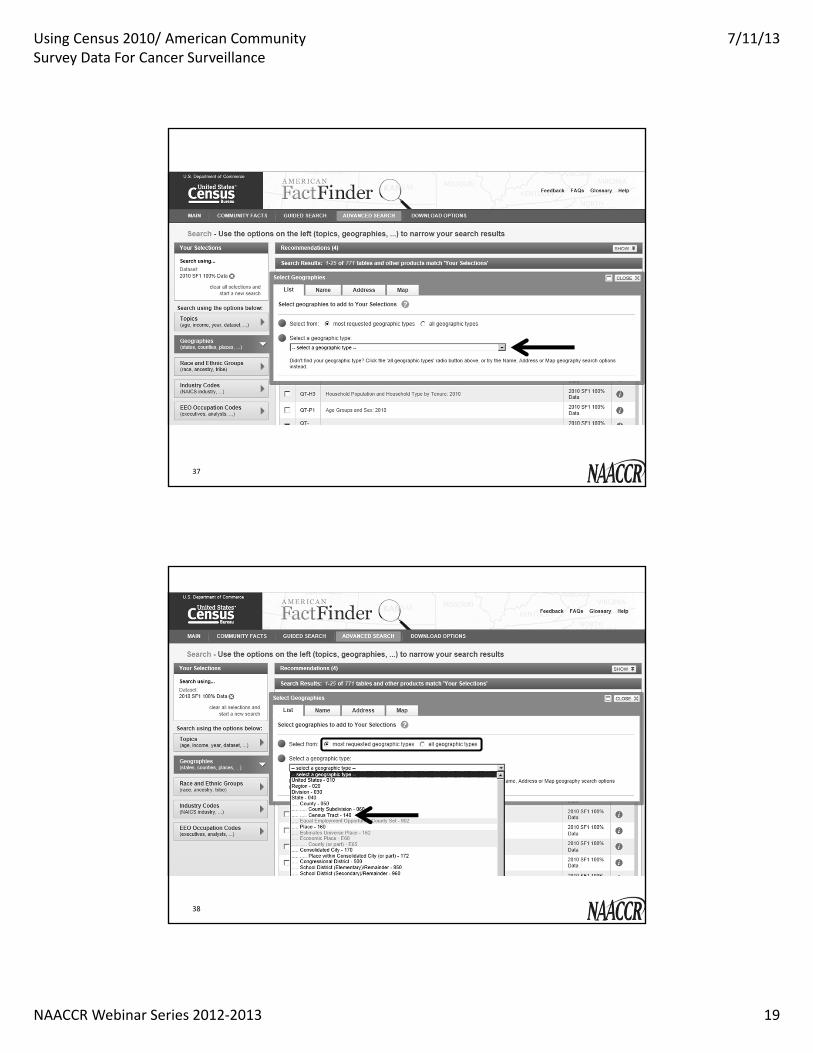
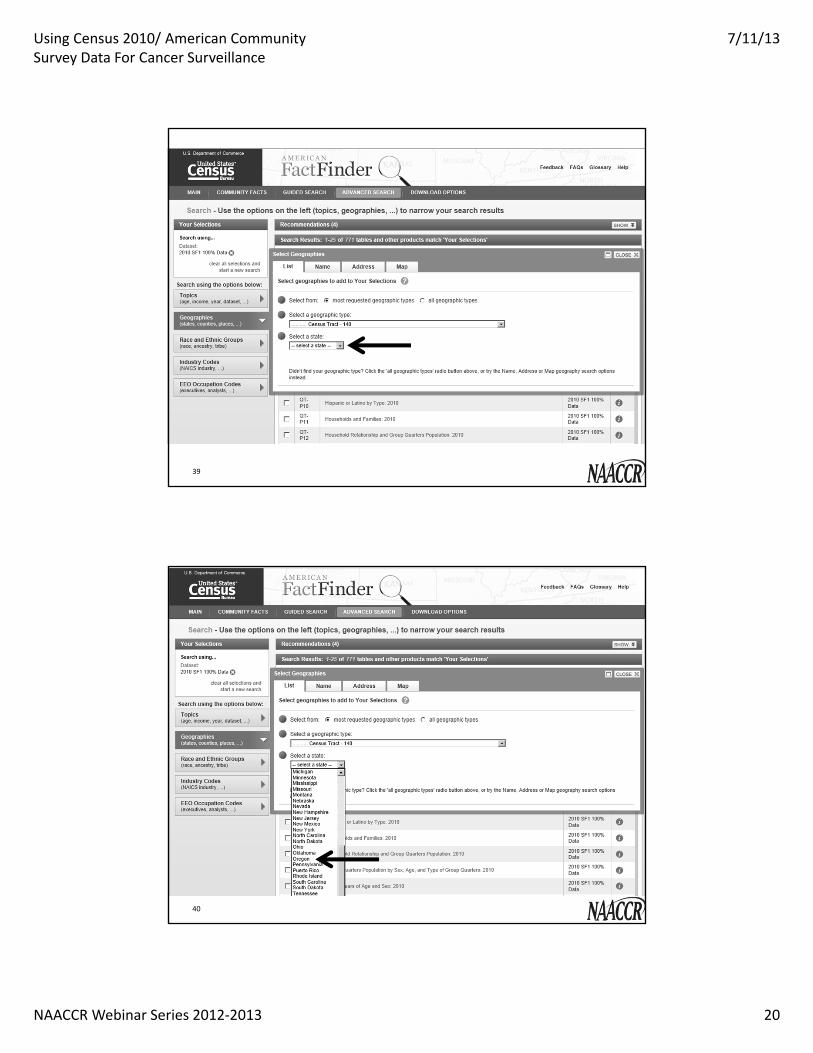
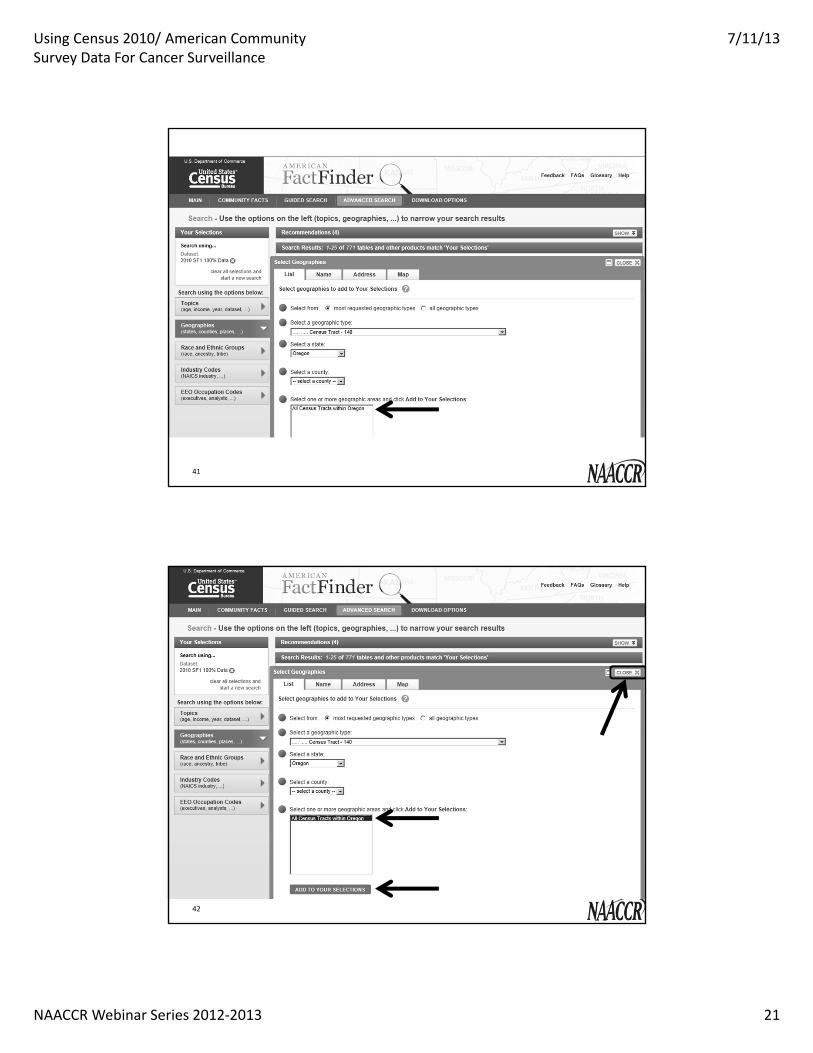
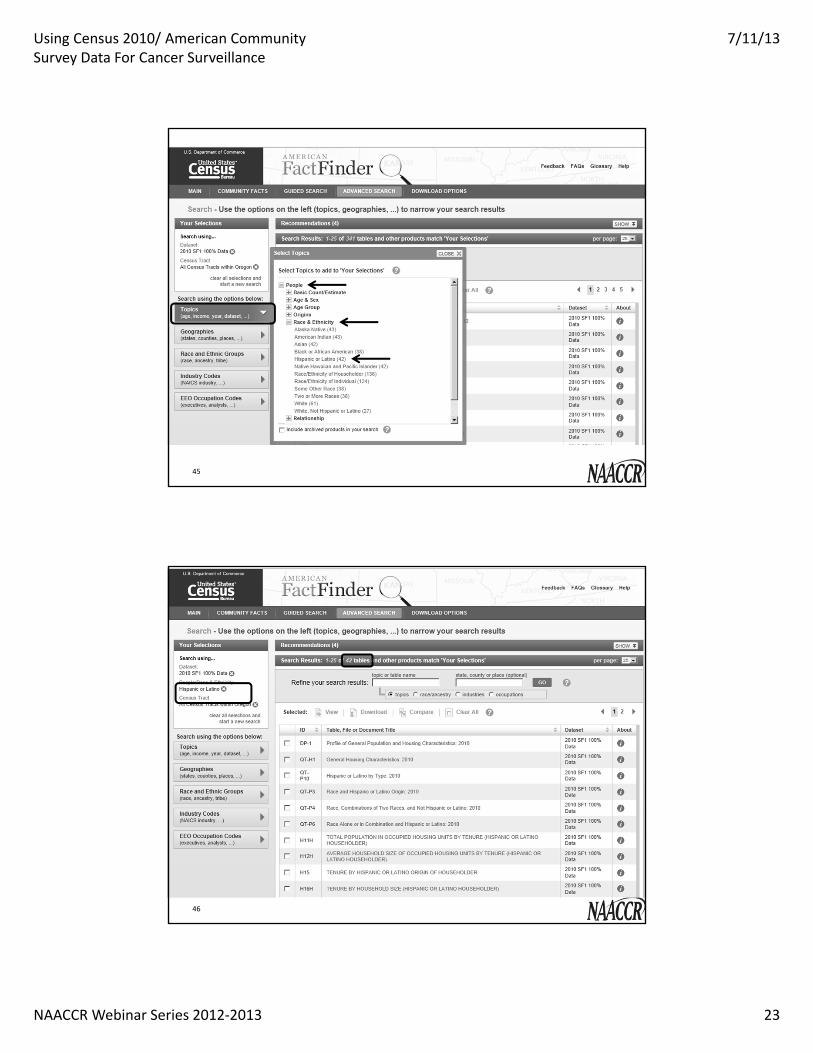
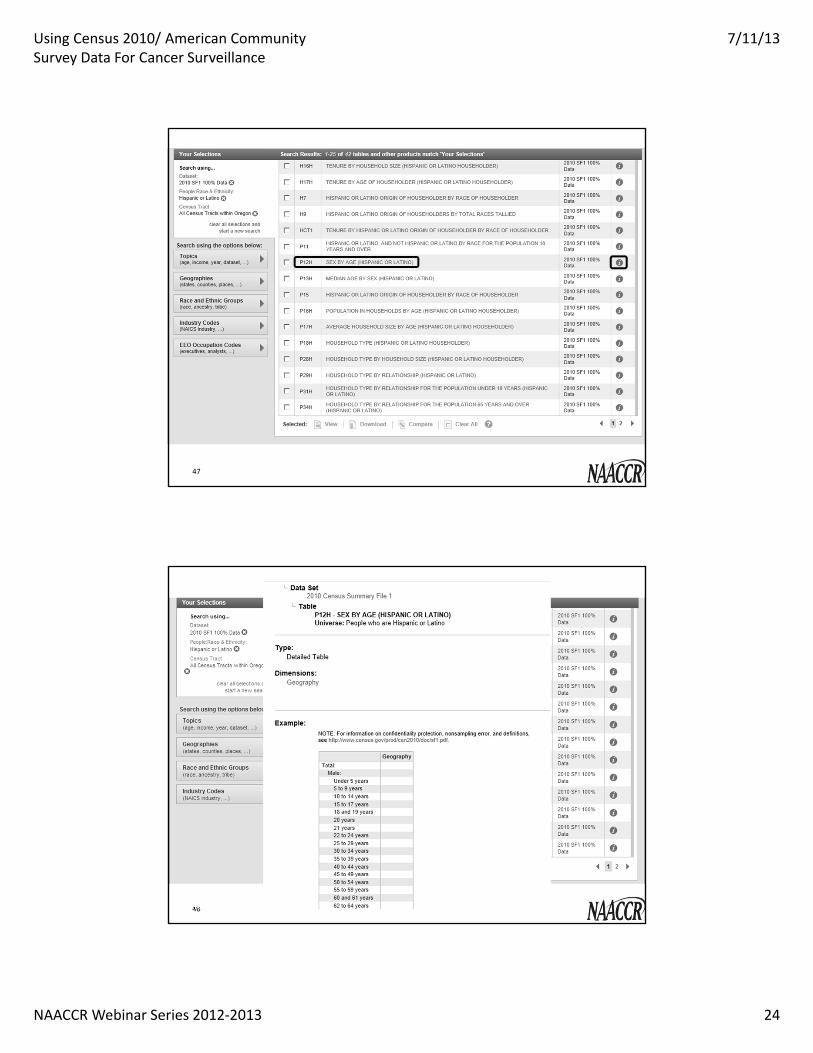
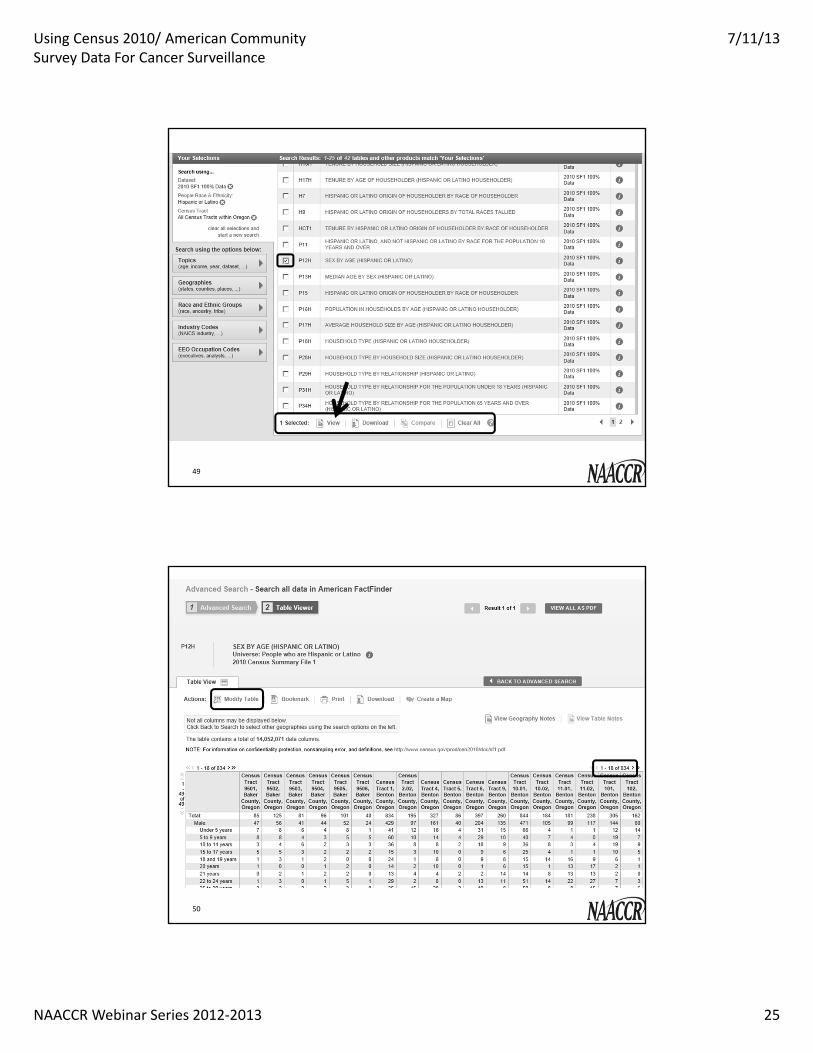
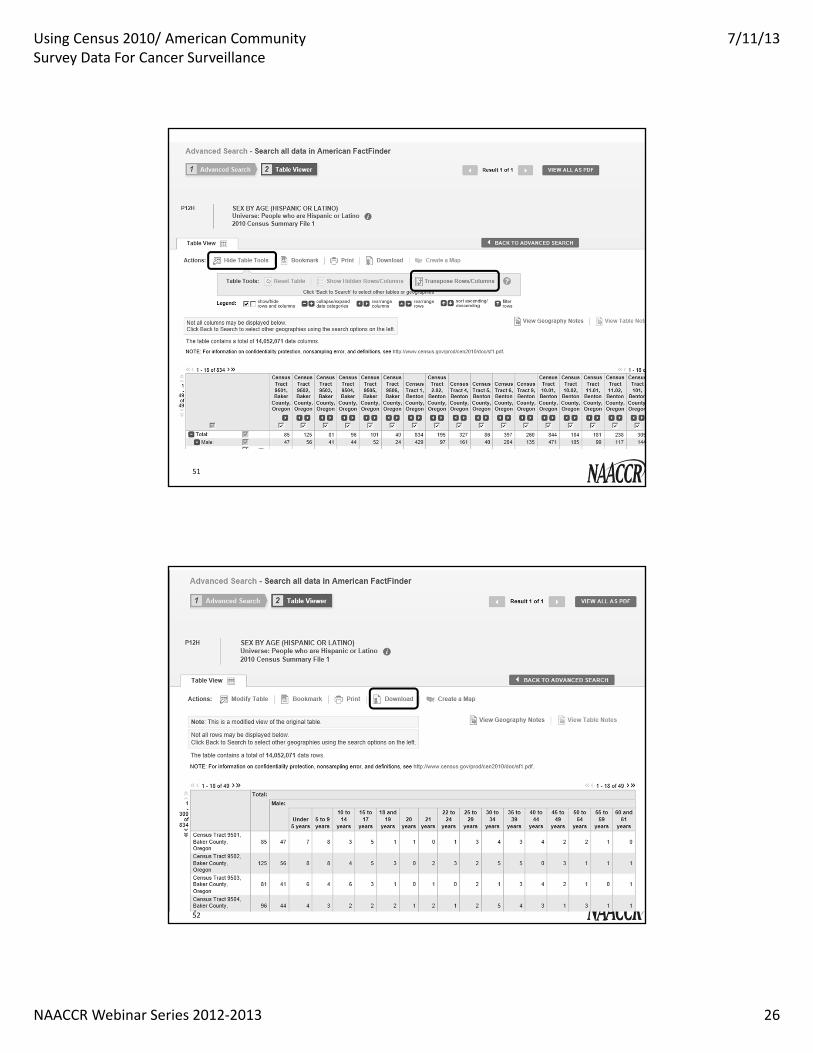
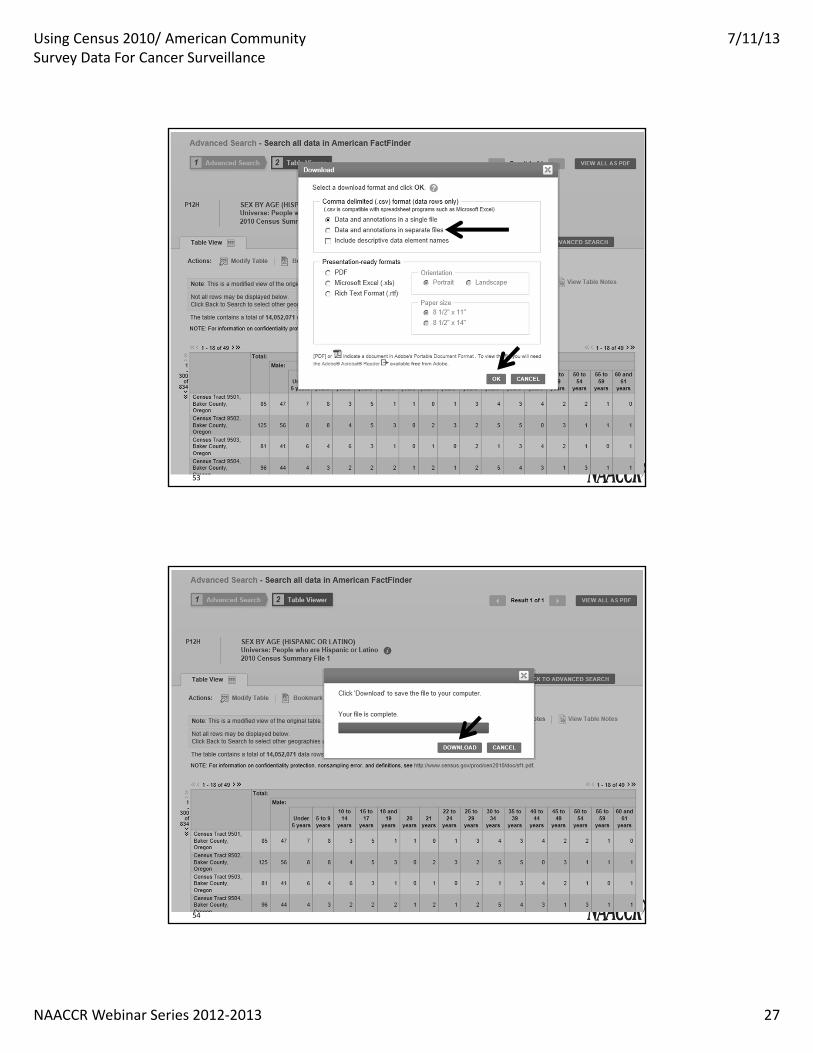
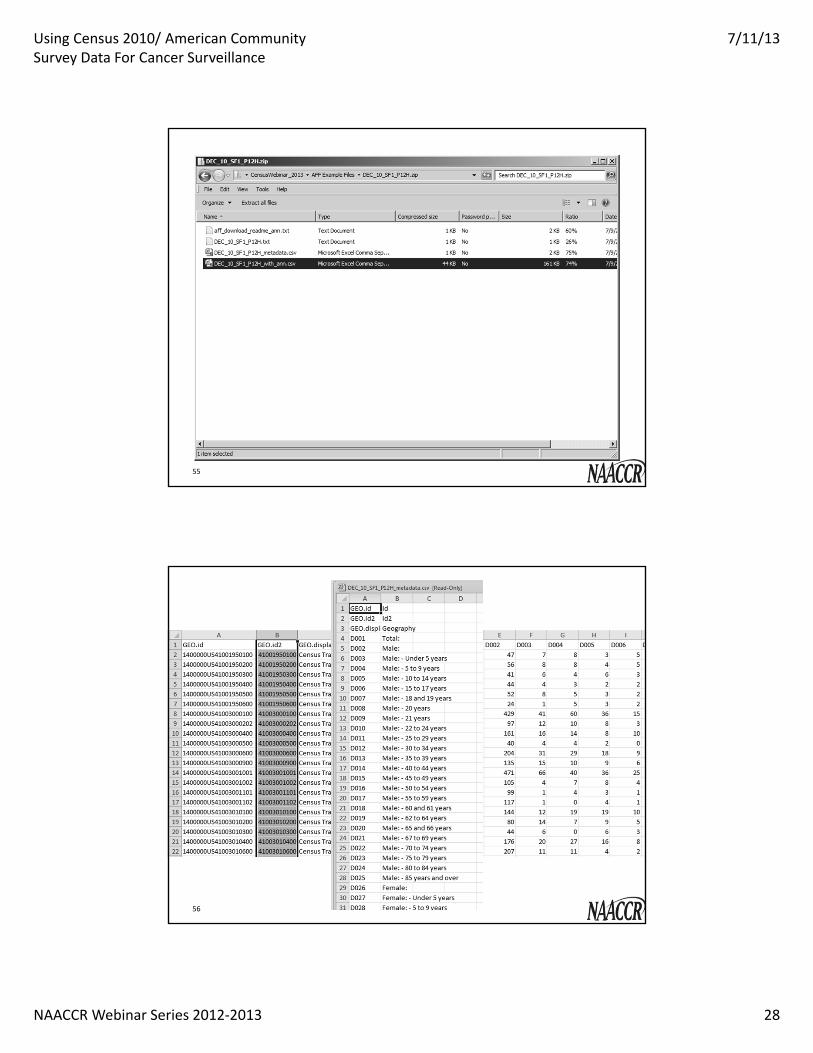
AFF Example – Census 2010 Data
• Hispanic populations• For Oregon census tracts• By age and sex• Download a table for analysis
29
30
Using Census 2010/ American Community Survey Data For Cancer Surveillance
7/11/13
NAACCR Webinar Series 2012‐2013 16
31
32
Using Census 2010/ American Community Survey Data For Cancer Surveillance
7/11/13
NAACCR Webinar Series 2012‐2013 17
33
34
Using Census 2010/ American Community Survey Data For Cancer Surveillance
7/11/13
NAACCR Webinar Series 2012‐2013 18
35
36
Using Census 2010/ American Community Survey Data For Cancer Surveillance
7/11/13
NAACCR Webinar Series 2012‐2013 19
37
38
Using Census 2010/ American Community Survey Data For Cancer Surveillance
7/11/13
NAACCR Webinar Series 2012‐2013 20
39
40
Using Census 2010/ American Community Survey Data For Cancer Surveillance
7/11/13
NAACCR Webinar Series 2012‐2013 21
41
42
Using Census 2010/ American Community Survey Data For Cancer Surveillance
7/11/13
NAACCR Webinar Series 2012‐2013 22
43
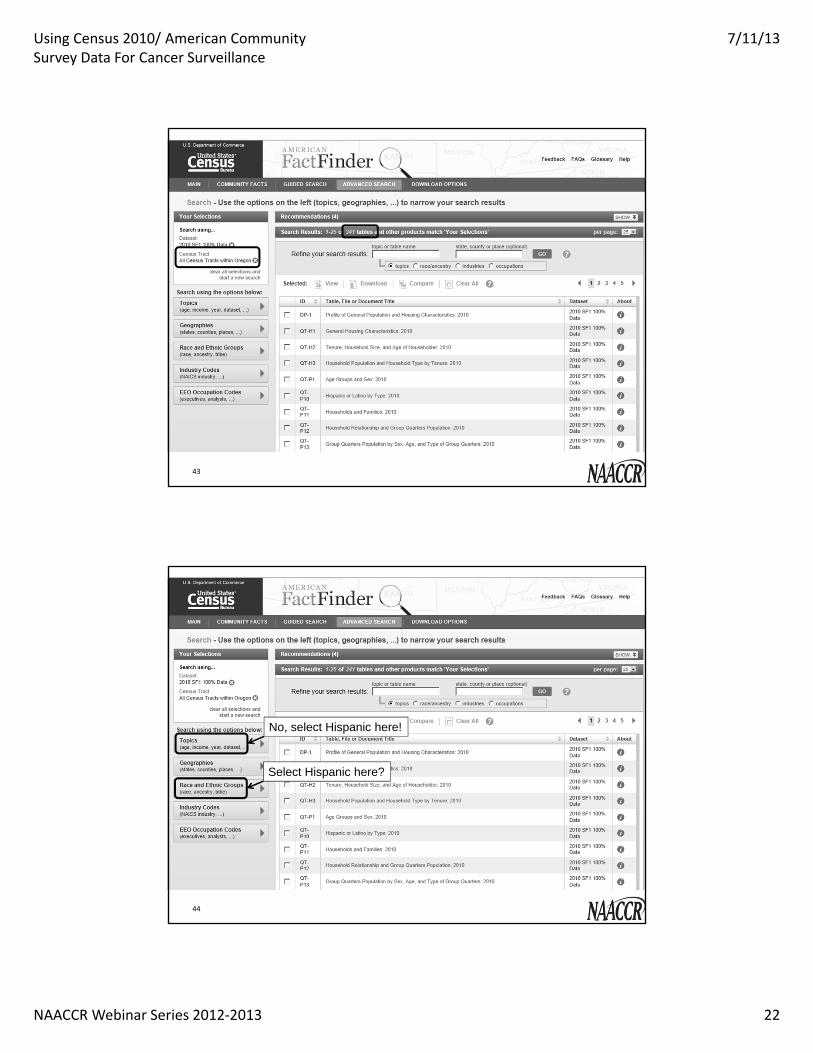
44
Select Hispanic here?
No, select Hispanic here!
Using Census 2010/ American Community Survey Data For Cancer Surveillance
7/11/13
NAACCR Webinar Series 2012‐2013 23
45
46
Using Census 2010/ American Community Survey Data For Cancer Surveillance
7/11/13
NAACCR Webinar Series 2012‐2013 24
47
48
Using Census 2010/ American Community Survey Data For Cancer Surveillance
7/11/13
NAACCR Webinar Series 2012‐2013 25
49
50
Using Census 2010/ American Community Survey Data For Cancer Surveillance
7/11/13
NAACCR Webinar Series 2012‐2013 26
51
52
Using Census 2010/ American Community Survey Data For Cancer Surveillance
7/11/13
NAACCR Webinar Series 2012‐2013 27
53
54
Using Census 2010/ American Community Survey Data For Cancer Surveillance
7/11/13
NAACCR Webinar Series 2012‐2013 28
55
56
Using Census 2010/ American Community Survey Data For Cancer Surveillance
7/11/13
NAACCR Webinar Series 2012‐2013 29
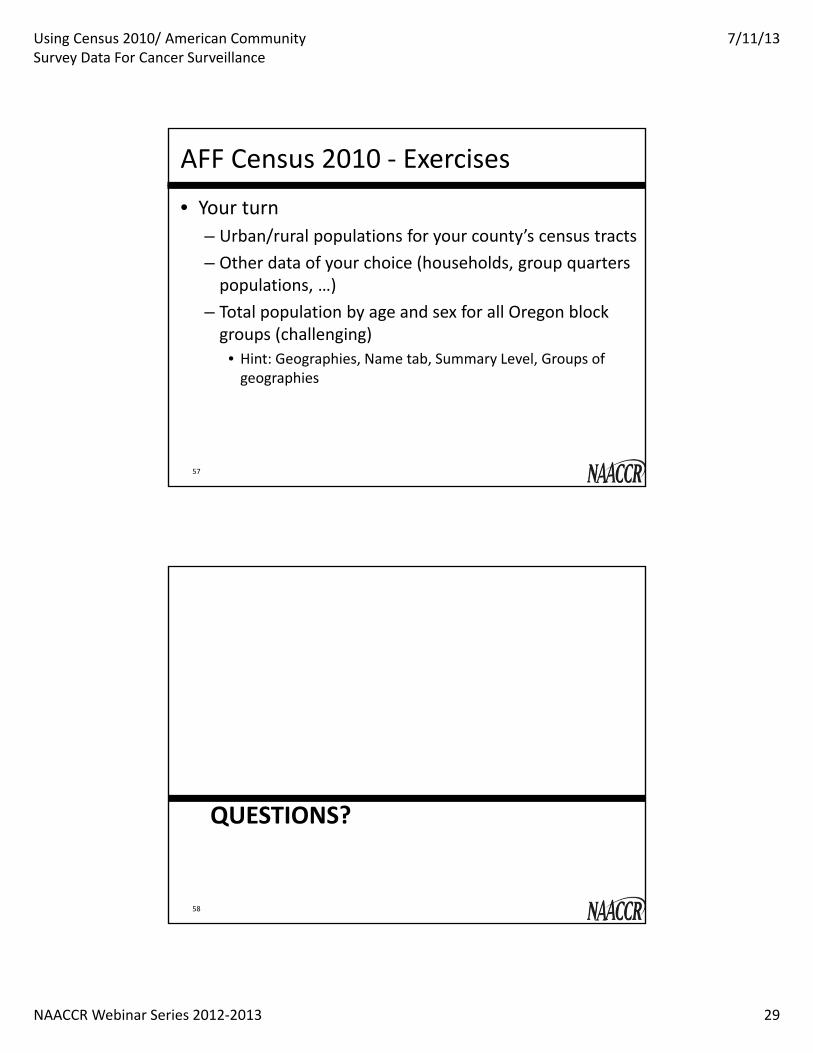
AFF Census 2010 ‐ Exercises
• Your turn– Urban/rural populations for your county’s census tracts– Other data of your choice (households, group quarters populations, …)
– Total population by age and sex for all Oregon block groups (challenging)
• Hint: Geographies, Name tab, Summary Level, Groups of geographies
57
QUESTIONS?
58
Using Census 2010/ American Community Survey Data For Cancer Surveillance
7/11/13
NAACCR Webinar Series 2012‐2013 30
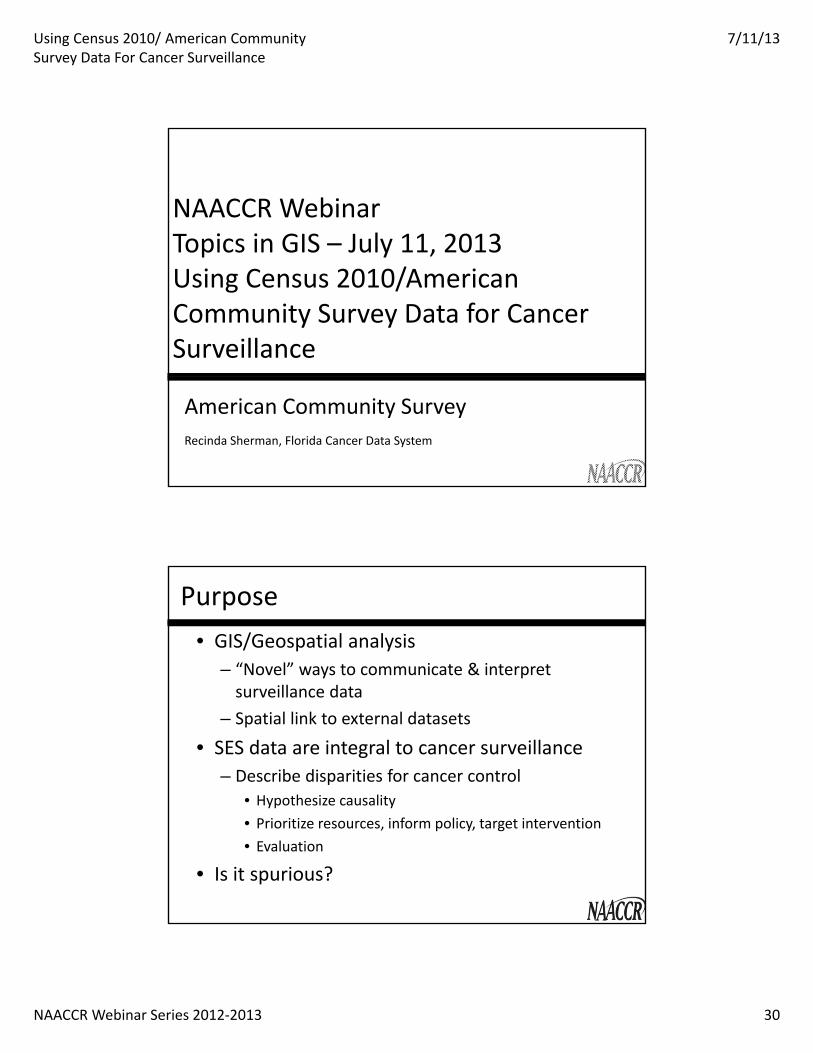
NAACCR WebinarTopics in GIS – July 11, 2013Using Census 2010/American Community Survey Data for Cancer Surveillance
American Community SurveyRecinda Sherman, Florida Cancer Data System
Purpose• GIS/Geospatial analysis
– “Novel” ways to communicate & interpret surveillance data
– Spatial link to external datasets
• SES data are integral to cancer surveillance– Describe disparities for cancer control
• Hypothesize causality• Prioritize resources, inform policy, target intervention • Evaluation
• Is it spurious?
Using Census 2010/ American Community Survey Data For Cancer Surveillance
7/11/13
NAACCR Webinar Series 2012‐2013 31
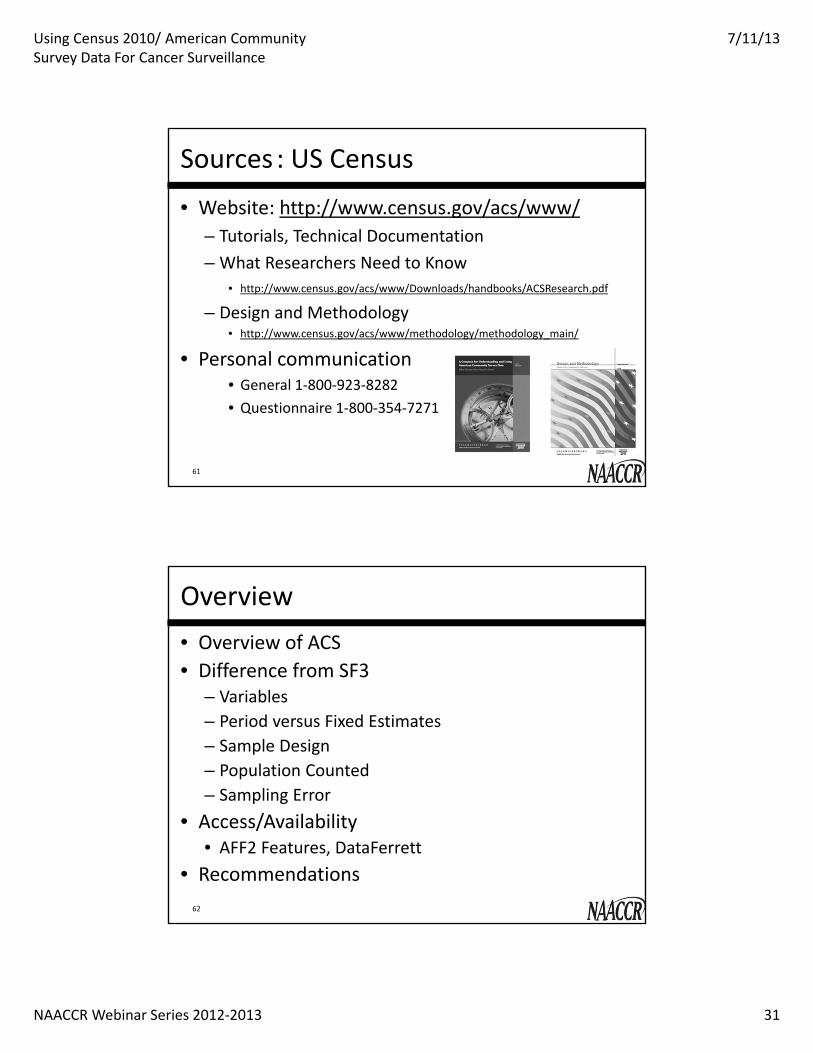
Sources : US Census
• Website: http://www.census.gov/acs/www/– Tutorials, Technical Documentation – What Researchers Need to Know
• http://www.census.gov/acs/www/Downloads/handbooks/ACSResearch.pdf
– Design and Methodology• http://www.census.gov/acs/www/methodology/methodology_main/
• Personal communication• General 1‐800‐923‐8282 • Questionnaire 1‐800‐354‐7271
61
Overview• Overview of ACS• Difference from SF3
– Variables– Period versus Fixed Estimates– Sample Design– Population Counted– Sampling Error
• Access/Availability• AFF2 Features, DataFerrett
• Recommendations62

Using Census 2010/ American Community Survey Data For Cancer Surveillance
7/11/13
NAACCR Webinar Series 2012‐2013 32
Overview: ACS• American Community Survey• Estimates not counts
– Description of population • Social, demographic, housing, economic characteristics
• Replaces Summary File 3 – Rolling survey– Puerto Rico Community Survey– “essentially” same information– 55 individual q’s, 30 household
• Annual estimates– Single year (65,000+), 3 year (20,000+), 5 year(all geographies)
63
ACS History
• Proposed in 1986• 1994 – 2004 demonstration period• Fully implemented in 2005• Replaced SF3 in 2010• Goal
– More timely & frequent data– Streamline operations & improve data quality
64
Using Census 2010/ American Community Survey Data For Cancer Surveillance
7/11/13
NAACCR Webinar Series 2012‐2013 33
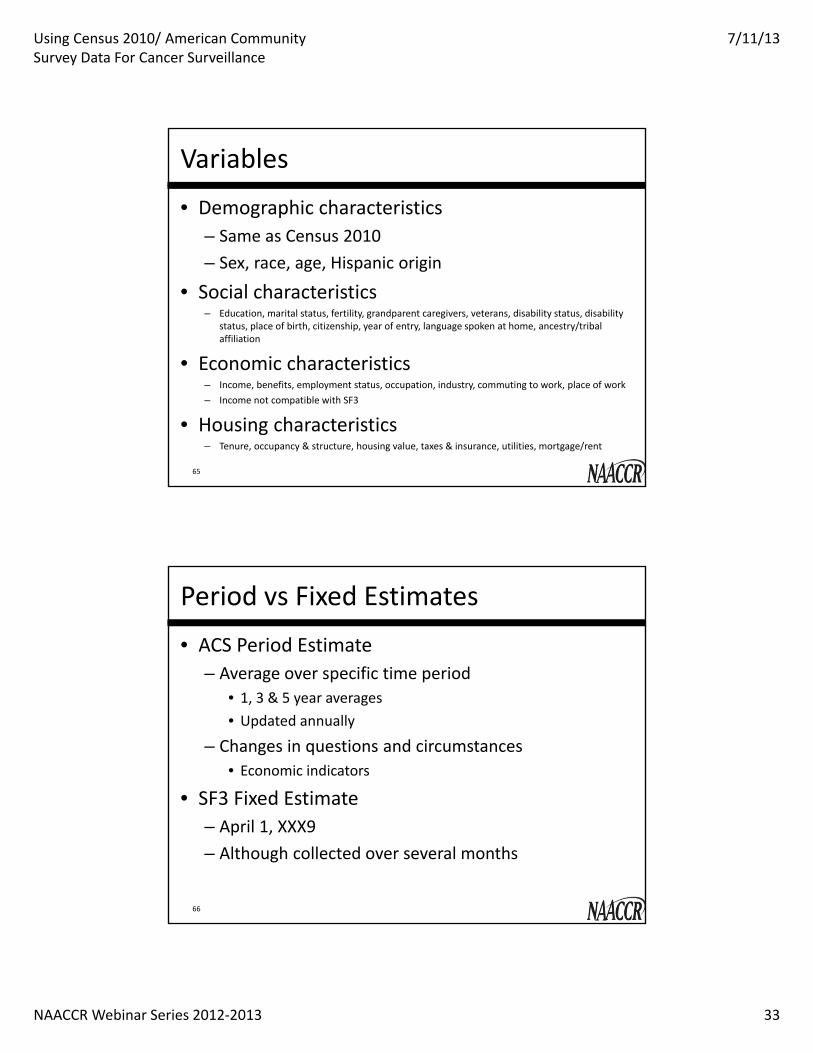
Variables
• Demographic characteristics– Same as Census 2010– Sex, race, age, Hispanic origin
• Social characteristics– Education, marital status, fertility, grandparent caregivers, veterans, disability status, disability
status, place of birth, citizenship, year of entry, language spoken at home, ancestry/tribal affiliation
• Economic characteristics– Income, benefits, employment status, occupation, industry, commuting to work, place of work– Income not compatible with SF3
• Housing characteristics– Tenure, occupancy & structure, housing value, taxes & insurance, utilities, mortgage/rent
65
Period vs Fixed Estimates
• ACS Period Estimate– Average over specific time period
• 1, 3 & 5 year averages• Updated annually
– Changes in questions and circumstances• Economic indicators
• SF3 Fixed Estimate– April 1, XXX9– Although collected over several months
66

Using Census 2010/ American Community Survey Data For Cancer Surveillance
7/11/13
NAACCR Webinar Series 2012‐2013 34
Continuous versus point‐in‐time• No longer “snapshot” now an abstract picture
– Averaged data• Median income
– Averaged throughout year & adjusted for inflation• Permanent, professional staff
– Smaller, cost efficient– Highly trained
• Same number of households sampled annually– Smaller percentage each year
Continuous versus point‐in‐time
• Reference period changes throughout year– Seasonal or rapid trends
• Multiyear estimates are not average of single year– Adjusted for age, sex, race, & Hispanic origin– More complex weighting scheme– More precise, more reliable
68

Using Census 2010/ American Community Survey Data For Cancer Surveillance
7/11/13
NAACCR Webinar Series 2012‐2013 35
Sample Design• Continuous sampling
– 250,000 addresses monthly; every county• 3 million addresses annually
– 2.3% of 2005 US population • Roughly same at state level
– However, sample size not met• Closer to 2 million
• Mail, phone, personal visit• Unique address once per 5 years• Numerous geographic levels
– Single year• States, congressional districts, 700 counties
– 5 year aggregates: all geographies
69
Sample design• Sent to address• Phone f/u for non‐responders• Interviewer sent 3 months later
– subsample• Oversample: small areas (county, towns, school districts), AI/AN, and tracts expected to have low response rate (‐8% in tracts expected to have high response rate)
• Highly complex design
Using Census 2010/ American Community Survey Data For Cancer Surveillance
7/11/13
NAACCR Webinar Series 2012‐2013 36
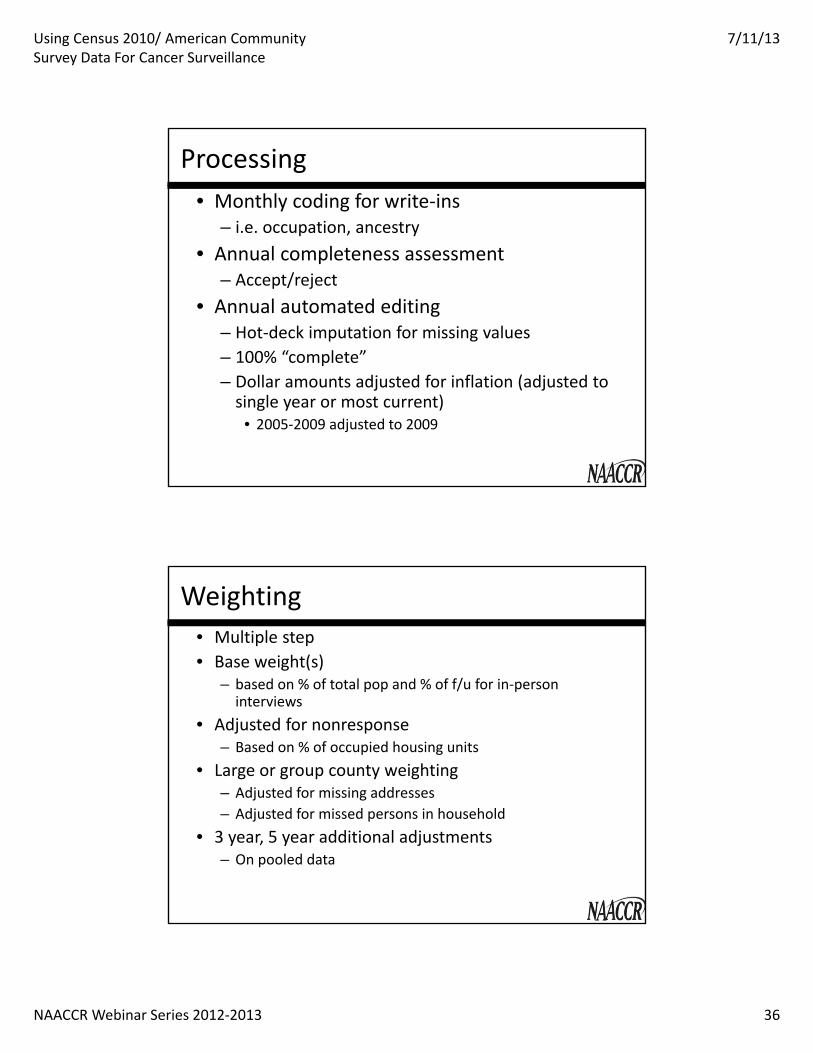
Processing• Monthly coding for write‐ins
– i.e. occupation, ancestry• Annual completeness assessment
– Accept/reject• Annual automated editing
– Hot‐deck imputation for missing values– 100% “complete”– Dollar amounts adjusted for inflation (adjusted to single year or most current)
• 2005‐2009 adjusted to 2009
Weighting• Multiple step• Base weight(s)
– based on % of total pop and % of f/u for in‐person interviews
• Adjusted for nonresponse– Based on % of occupied housing units
• Large or group county weighting– Adjusted for missing addresses – Adjusted for missed persons in household
• 3 year, 5 year additional adjustments– On pooled data

Using Census 2010/ American Community Survey Data For Cancer Surveillance
7/11/13
NAACCR Webinar Series 2012‐2013 37
Sampling error• Sample to lower cost• 2000 SF3 also sample
– 1 in 6 households– Results from 1 household represent 5 additional
• 2010 ACS– 1 in 8 (5 year estimate); 1 in 40 (single‐year estimate)
– Less precise• SF3 errors significantly smaller, published for table not data item
Sampling Error• Uncertainty of data based on sample versus full population
• Used to show reliability and usability, compare estimates, conduct statistical tests, inform conclusions
• Margin of Error is reported for each data point– MOE measures the precision of the estimate at given level of confidence
– 90% CI (90% likelihood that difference between population and sample is less than or equal to MOE)
• 95% etc can be calculated (Compass Handbook) – SE = MOE/1.645; CI = Estimate ±MOE
• How do we account for the MOE in analysis, presentation, interpretation?
74
Using Census 2010/ American Community Survey Data For Cancer Surveillance
7/11/13
NAACCR Webinar Series 2012‐2013 38
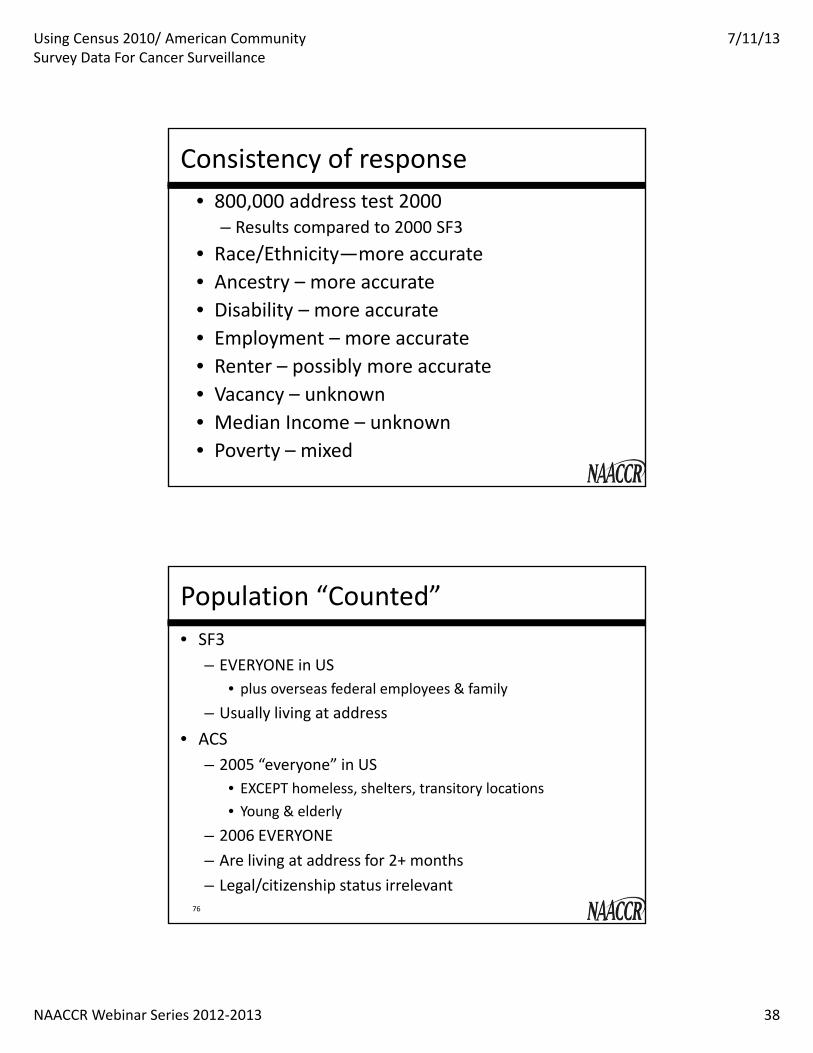
Consistency of response• 800,000 address test 2000
– Results compared to 2000 SF3• Race/Ethnicity—more accurate• Ancestry – more accurate• Disability – more accurate• Employment – more accurate• Renter – possibly more accurate• Vacancy – unknown• Median Income – unknown• Poverty – mixed
Population “Counted”• SF3
– EVERYONE in US• plus overseas federal employees & family
– Usually living at address• ACS
– 2005 “everyone” in US• EXCEPT homeless, shelters, transitory locations• Young & elderly
– 2006 EVERYONE– Are living at address for 2+ months– Legal/citizenship status irrelevant
76
Using Census 2010/ American Community Survey Data For Cancer Surveillance
7/11/13
NAACCR Webinar Series 2012‐2013 39
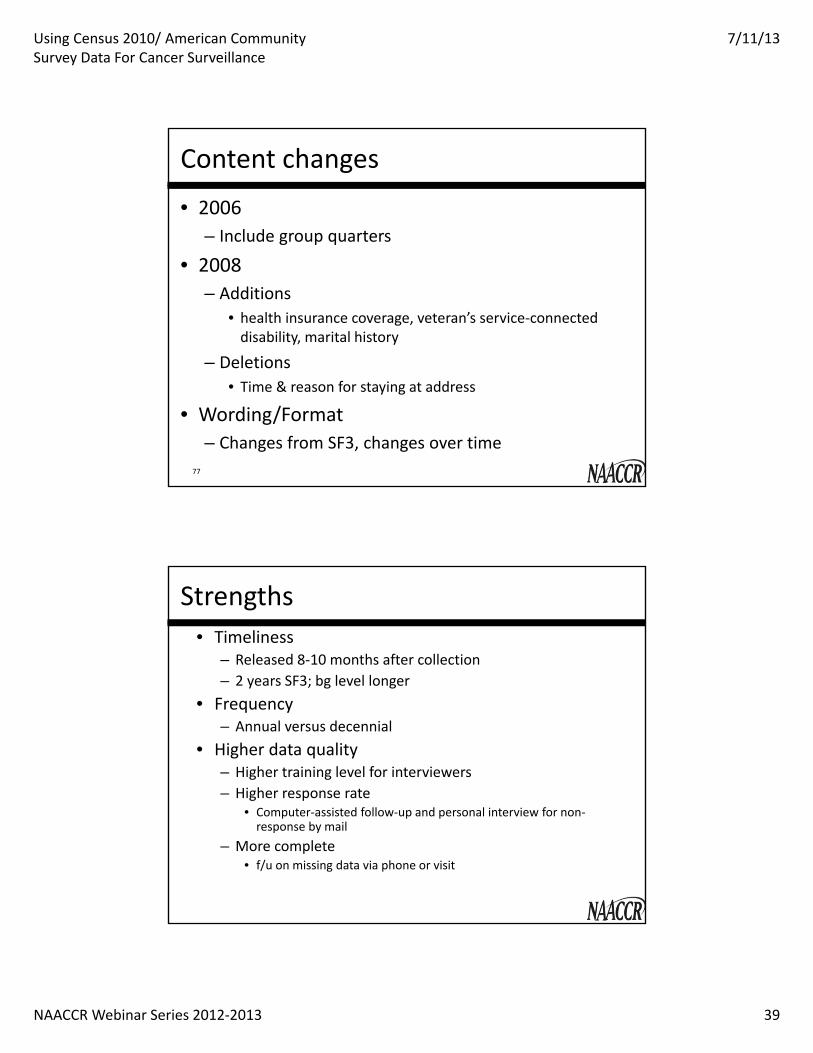
Content changes
• 2006– Include group quarters
• 2008– Additions
• health insurance coverage, veteran’s service‐connected disability, marital history
– Deletions• Time & reason for staying at address
• Wording/Format – Changes from SF3, changes over time
77
Strengths• Timeliness
– Released 8‐10 months after collection– 2 years SF3; bg level longer
• Frequency– Annual versus decennial
• Higher data quality– Higher training level for interviewers– Higher response rate
• Computer‐assisted follow‐up and personal interview for non‐response by mail
– More complete• f/u on missing data via phone or visit
Using Census 2010/ American Community Survey Data For Cancer Surveillance
7/11/13
NAACCR Webinar Series 2012‐2013 40
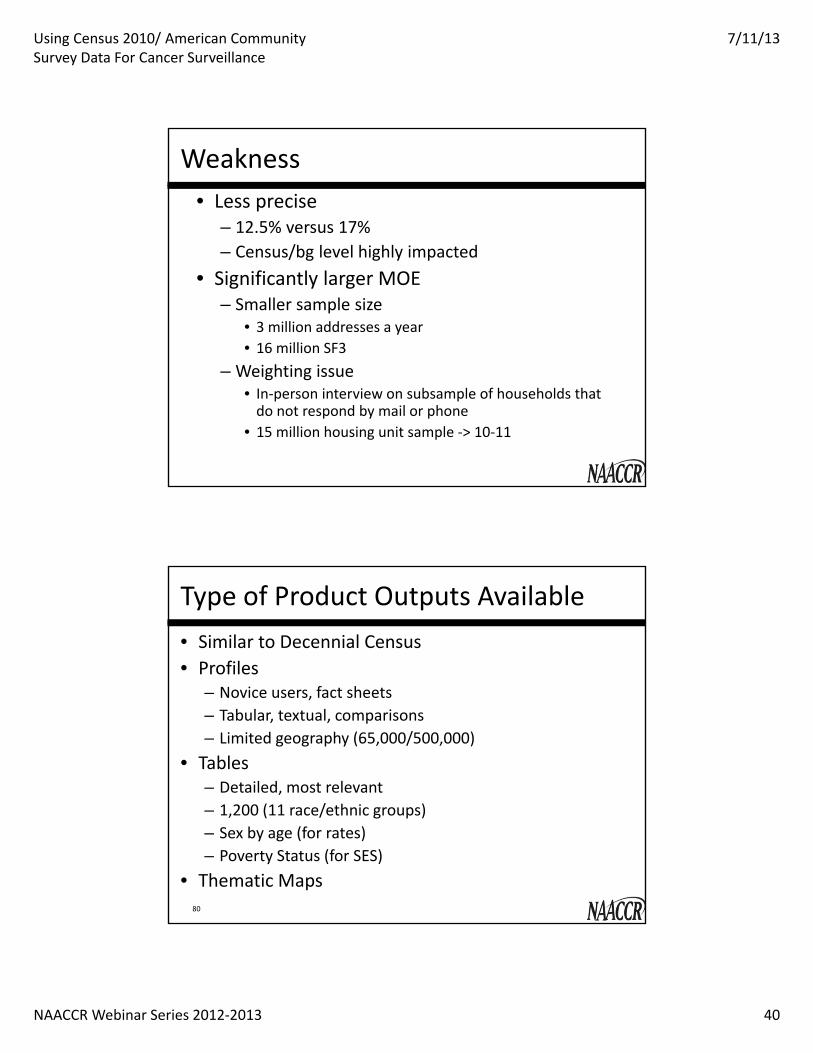
Weakness• Less precise
– 12.5% versus 17%– Census/bg level highly impacted
• Significantly larger MOE– Smaller sample size
• 3 million addresses a year• 16 million SF3
– Weighting issue• In‐person interview on subsample of households that do not respond by mail or phone
• 15 million housing unit sample ‐> 10‐11
Type of Product Outputs Available• Similar to Decennial Census• Profiles
– Novice users, fact sheets– Tabular, textual, comparisons– Limited geography (65,000/500,000)
• Tables– Detailed, most relevant– 1,200 (11 race/ethnic groups)– Sex by age (for rates)– Poverty Status (for SES)
• Thematic Maps80

Using Census 2010/ American Community Survey Data For Cancer Surveillance
7/11/13
NAACCR Webinar Series 2012‐2013 41
Public Use Microdata Sample (PUMS)• Subsample of individual records
– Anonymized• More subject detail
– Detailed population group; Custom variables• Less geographic detail
– 100,000 threshold• Documented data errors
– Compared to tables– Age & Sex – 65+ 15% difference in counts– 65+ not representative– Byproduct of “misapplication of disclosure avoidance”
• Data swapping, imputation
81
How to Access Data Products• American FactFinder• DataFerrett
– Block Group Level for limited tables• FTP
– http://www2.census.gov/acs2009_5yr/summaryfile/• DVD
– [email protected]– Comma delimited
• Summary File Retrieval Tool– Excel macro
82
Using Census 2010/ American Community Survey Data For Cancer Surveillance
7/11/13
NAACCR Webinar Series 2012‐2013 42
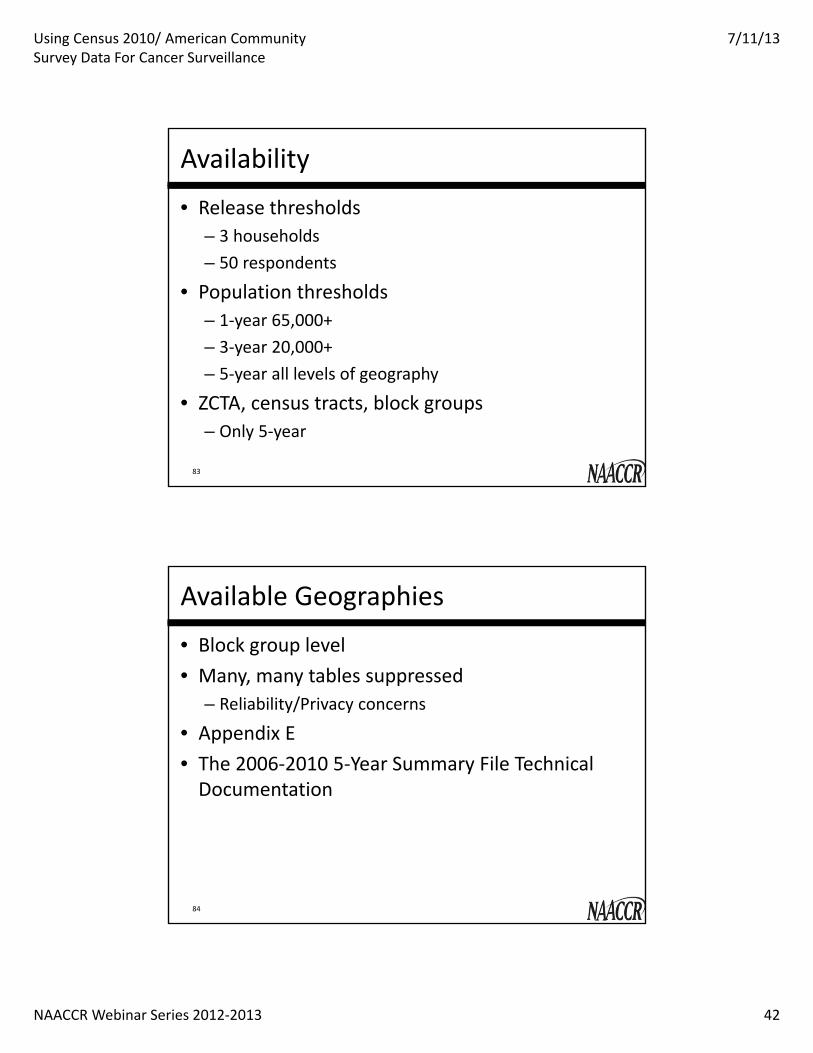
Availability
• Release thresholds– 3 households– 50 respondents
• Population thresholds– 1‐year 65,000+– 3‐year 20,000+– 5‐year all levels of geography
• ZCTA, census tracts, block groups– Only 5‐year
83
Available Geographies
• Block group level • Many, many tables suppressed
– Reliability/Privacy concerns
• Appendix E• The 2006‐2010 5‐Year Summary File Technical Documentation
84
Using Census 2010/ American Community Survey Data For Cancer Surveillance
7/11/13
NAACCR Webinar Series 2012‐2013 43
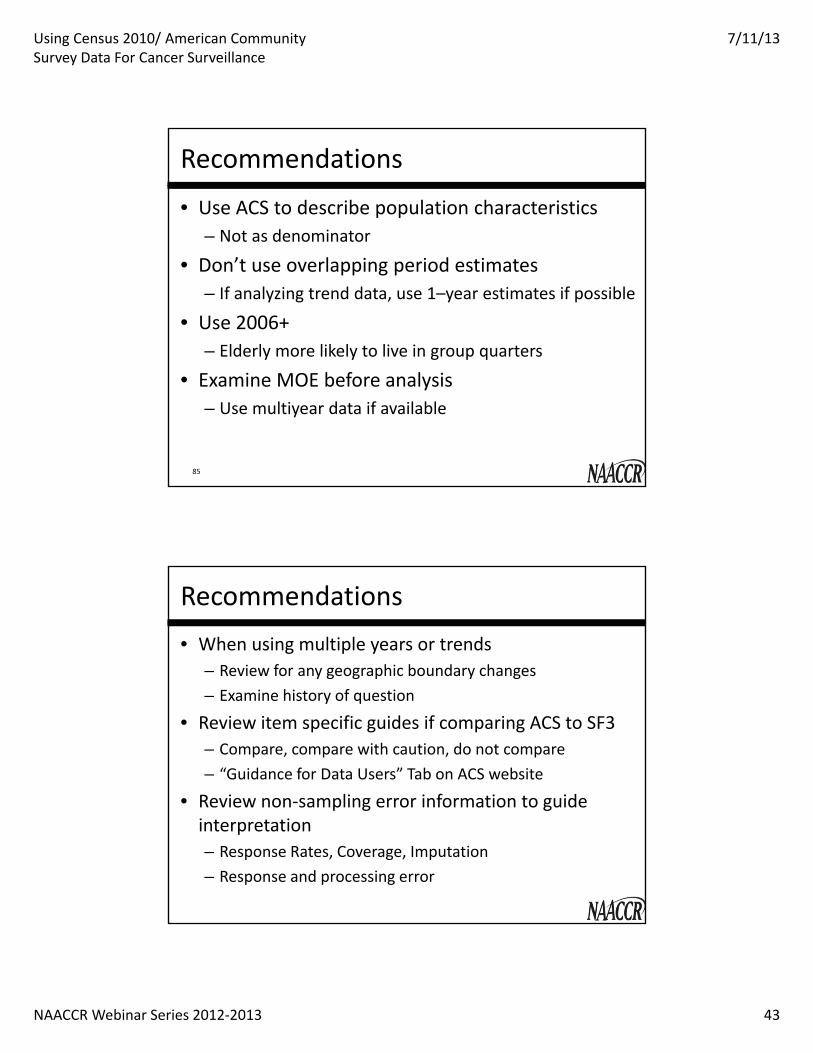
Recommendations
• Use ACS to describe population characteristics– Not as denominator
• Don’t use overlapping period estimates– If analyzing trend data, use 1–year estimates if possible
• Use 2006+– Elderly more likely to live in group quarters
• Examine MOE before analysis– Use multiyear data if available
85
Recommendations• When using multiple years or trends
– Review for any geographic boundary changes– Examine history of question
• Review item specific guides if comparing ACS to SF3– Compare, compare with caution, do not compare– “Guidance for Data Users” Tab on ACS website
• Review non‐sampling error information to guide interpretation– Response Rates, Coverage, Imputation – Response and processing error
Using Census 2010/ American Community Survey Data For Cancer Surveillance
7/11/13
NAACCR Webinar Series 2012‐2013 44
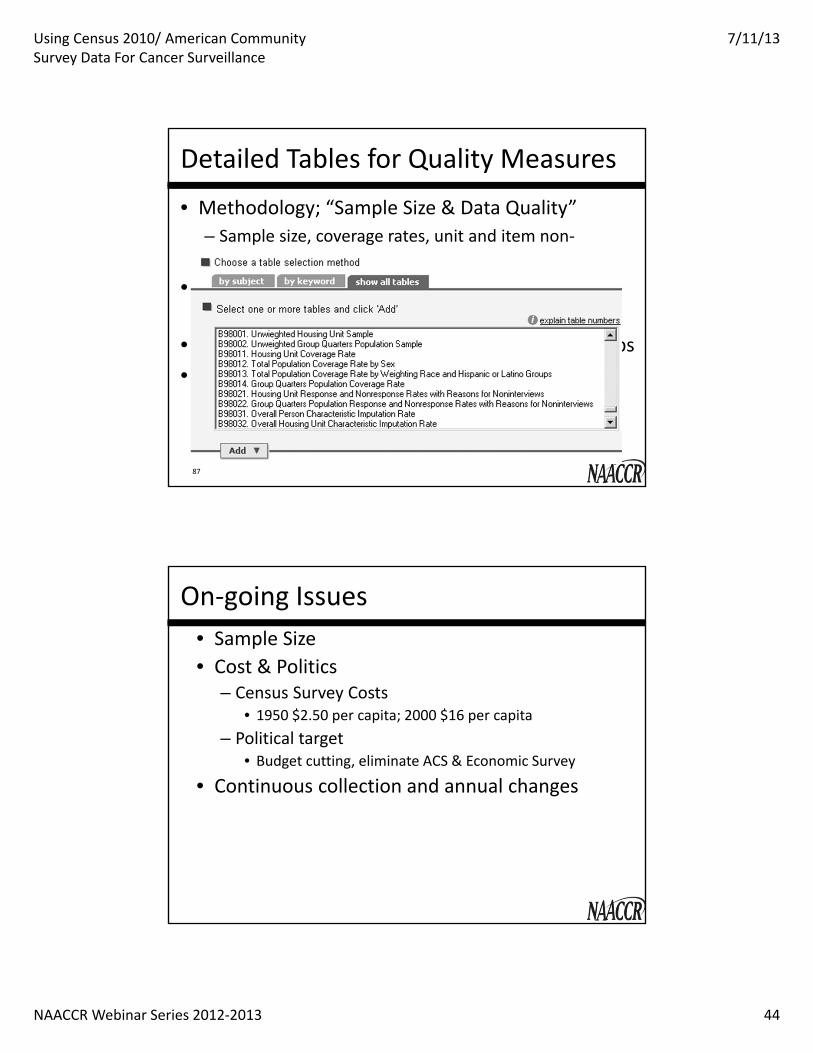
Detailed Tables for Quality Measures
• Methodology; “Sample Size & Data Quality” – Sample size, coverage rates, unit and item non‐response rates
• AFF– 10 quality describing tables (weights/imputation)
• Not available at all geographies/population groups• Limited details
87
On‐going Issues• Sample Size• Cost & Politics
– Census Survey Costs• 1950 $2.50 per capita; 2000 $16 per capita
– Political target• Budget cutting, eliminate ACS & Economic Survey
• Continuous collection and annual changes
Using Census 2010/ American Community Survey Data For Cancer Surveillance
7/11/13
NAACCR Webinar Series 2012‐2013 45
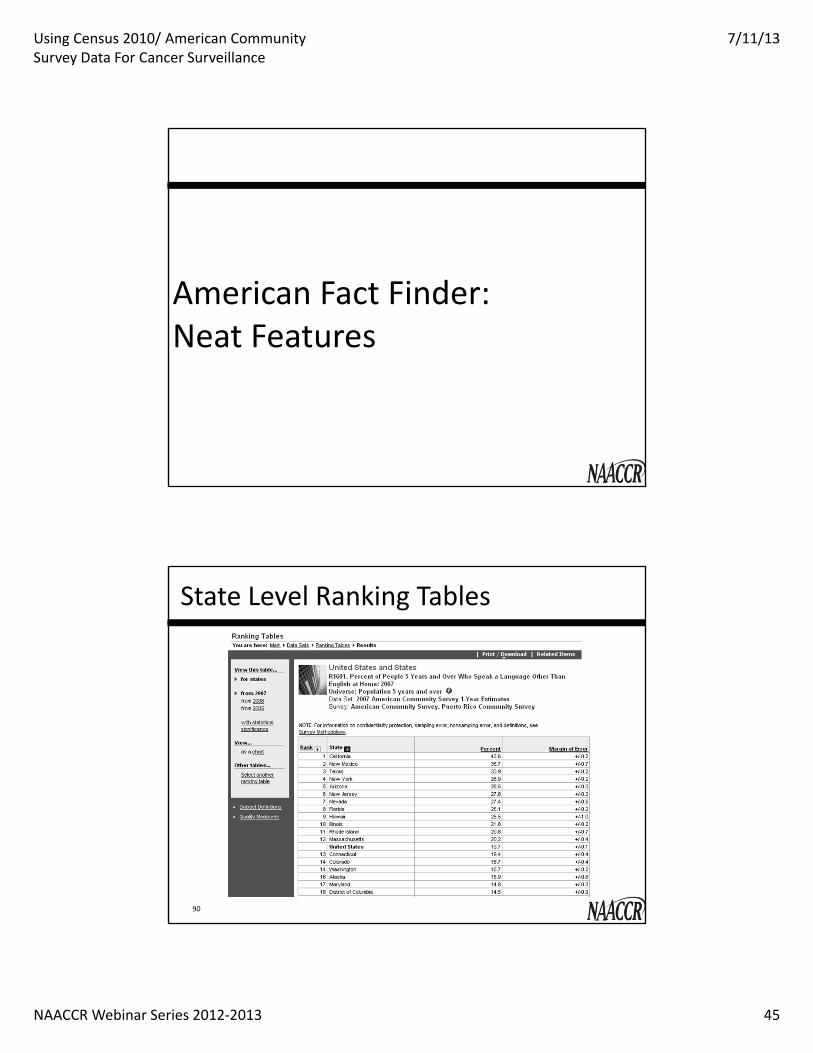
American Fact Finder:Neat Features
State Level Ranking Tables
90
Using Census 2010/ American Community Survey Data For Cancer Surveillance
7/11/13
NAACCR Webinar Series 2012‐2013 46
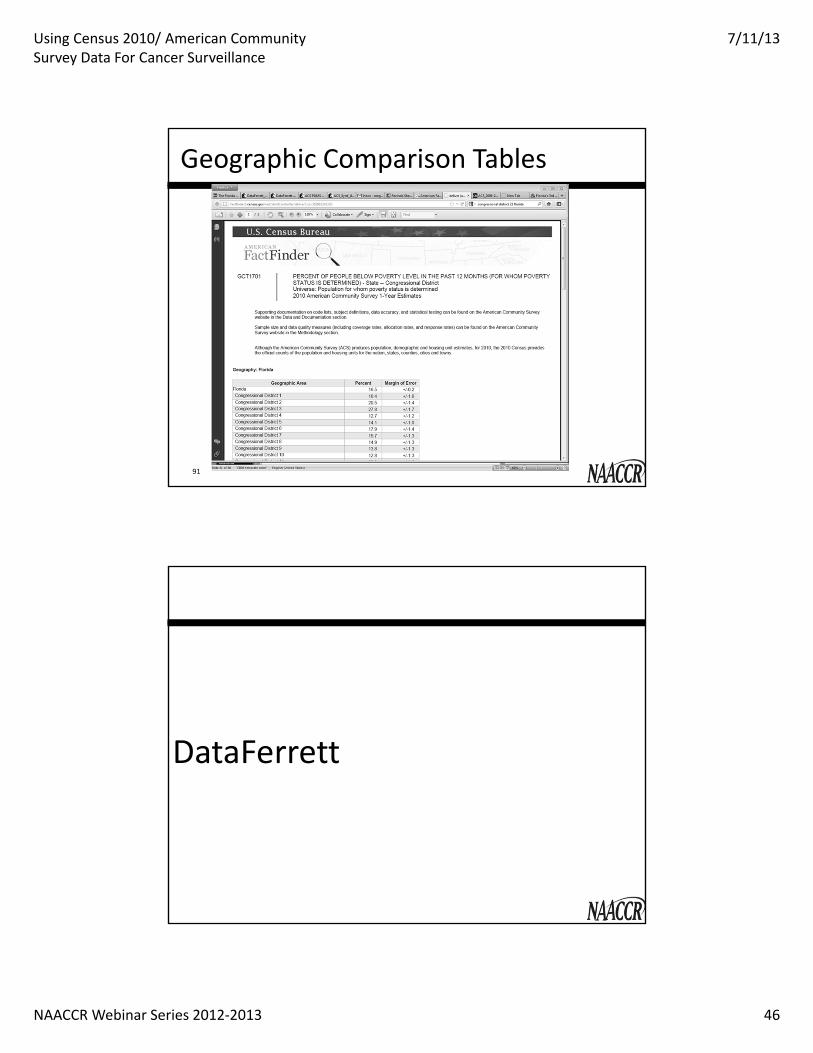
Geographic Comparison Tables
91
DataFerrett
Using Census 2010/ American Community Survey Data For Cancer Surveillance
7/11/13
NAACCR Webinar Series 2012‐2013 47
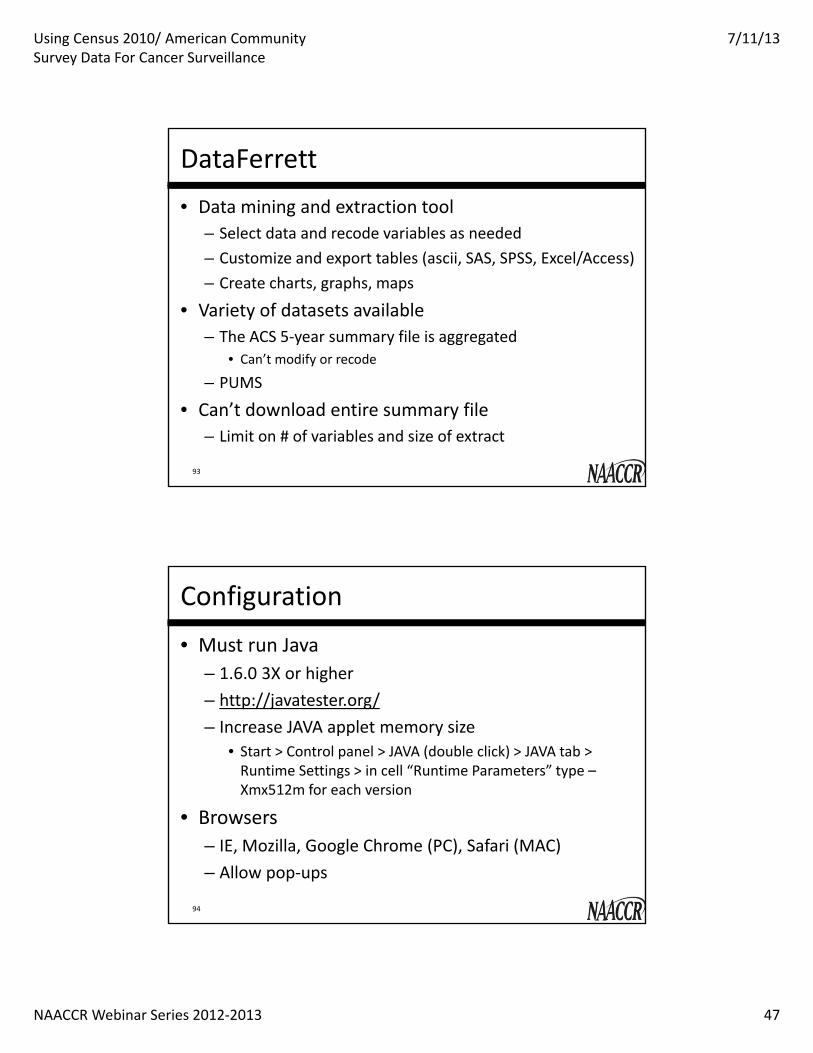
DataFerrett• Data mining and extraction tool
– Select data and recode variables as needed– Customize and export tables (ascii, SAS, SPSS, Excel/Access)– Create charts, graphs, maps
• Variety of datasets available– The ACS 5‐year summary file is aggregated
• Can’t modify or recode
– PUMS
• Can’t download entire summary file– Limit on # of variables and size of extract
93
Configuration
• Must run Java– 1.6.0 3X or higher– http://javatester.org/– Increase JAVA applet memory size
• Start > Control panel > JAVA (double click) > JAVA tab > Runtime Settings > in cell “Runtime Parameters” type –Xmx512m for each version
• Browsers– IE, Mozilla, Google Chrome (PC), Safari (MAC)– Allow pop‐ups
94
Using Census 2010/ American Community Survey Data For Cancer Surveillance
7/11/13
NAACCR Webinar Series 2012‐2013 48
DataFerrett
• http://dataferrett.census.gov/run.html• Supplement for ACS 5‐year
– http://dataferrett.census.gov/acs/ACS_5yrsf_UserGuide.pdf
95
Questions?
96
Using Census 2010/ American Community Survey Data For Cancer Surveillance
7/11/13
NAACCR Webinar Series 2012‐2013 49
BREAK
97
NAACCR WebinarTopics in GIS – July 11, 2013Using Census 2010/American Community Survey Data for Cancer Surveillance :
Denominator Data and Cancer Rates:Applications and ComplicationsFrank Boscoe, New York State Cancer RegistryDan Goldberg, Texas A&M University
Using Census 2010/ American Community Survey Data For Cancer Surveillance
7/11/13
NAACCR Webinar Series 2012‐2013 50
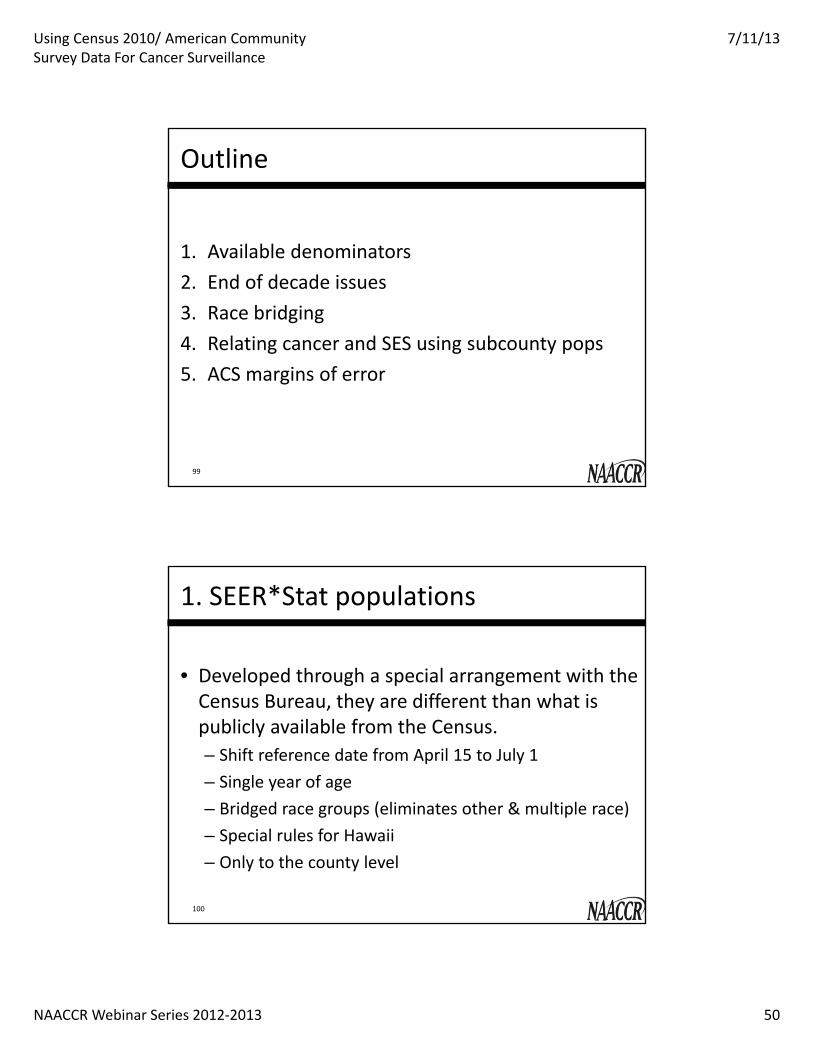
Outline
1. Available denominators2. End of decade issues3. Race bridging4. Relating cancer and SES using subcounty pops5. ACS margins of error
99
1. SEER*Stat populations
• Developed through a special arrangement with the Census Bureau, they are different than what is publicly available from the Census.– Shift reference date from April 15 to July 1– Single year of age– Bridged race groups (eliminates other & multiple race)– Special rules for Hawaii– Only to the county level
100
Using Census 2010/ American Community Survey Data For Cancer Surveillance
7/11/13
NAACCR Webinar Series 2012‐2013 51
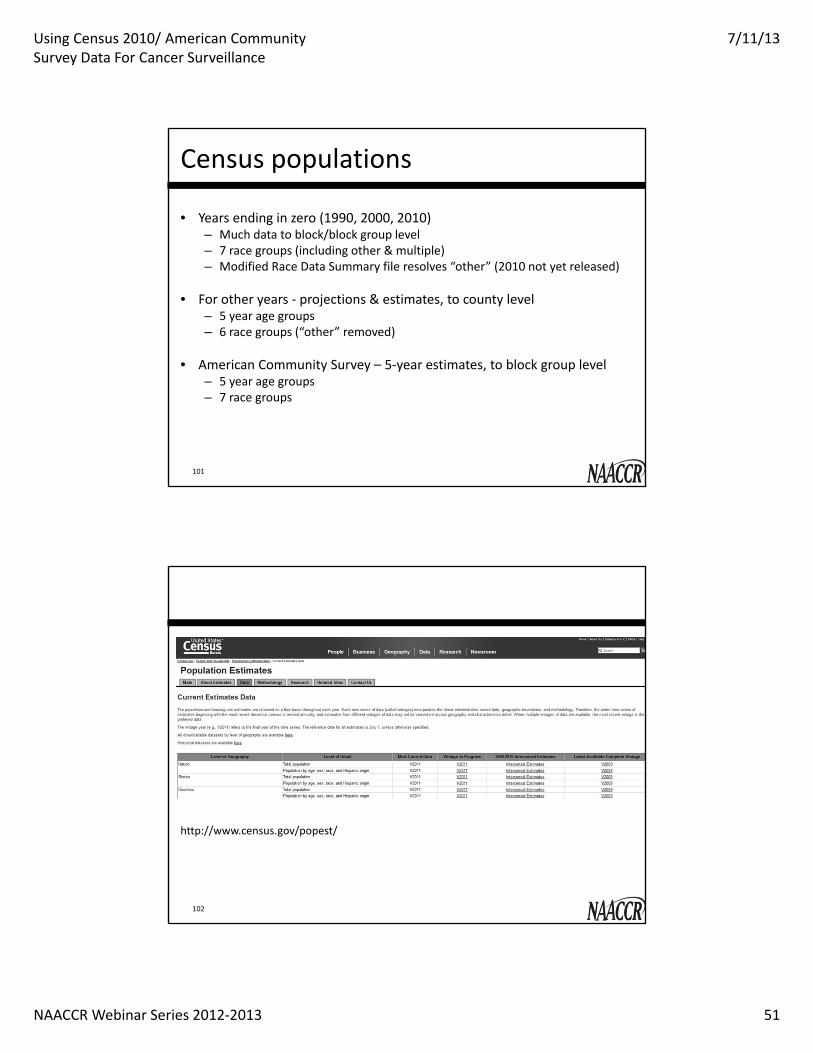
Census populations
• Years ending in zero (1990, 2000, 2010)– Much data to block/block group level– 7 race groups (including other & multiple)– Modified Race Data Summary file resolves “other” (2010 not yet released)
• For other years ‐ projections & estimates, to county level– 5 year age groups– 6 race groups (“other” removed)
• American Community Survey – 5‐year estimates, to block group level– 5 year age groups– 7 race groups
101
102
http://www.census.gov/popest/

Using Census 2010/ American Community Survey Data For Cancer Surveillance
7/11/13
NAACCR Webinar Series 2012‐2013 52
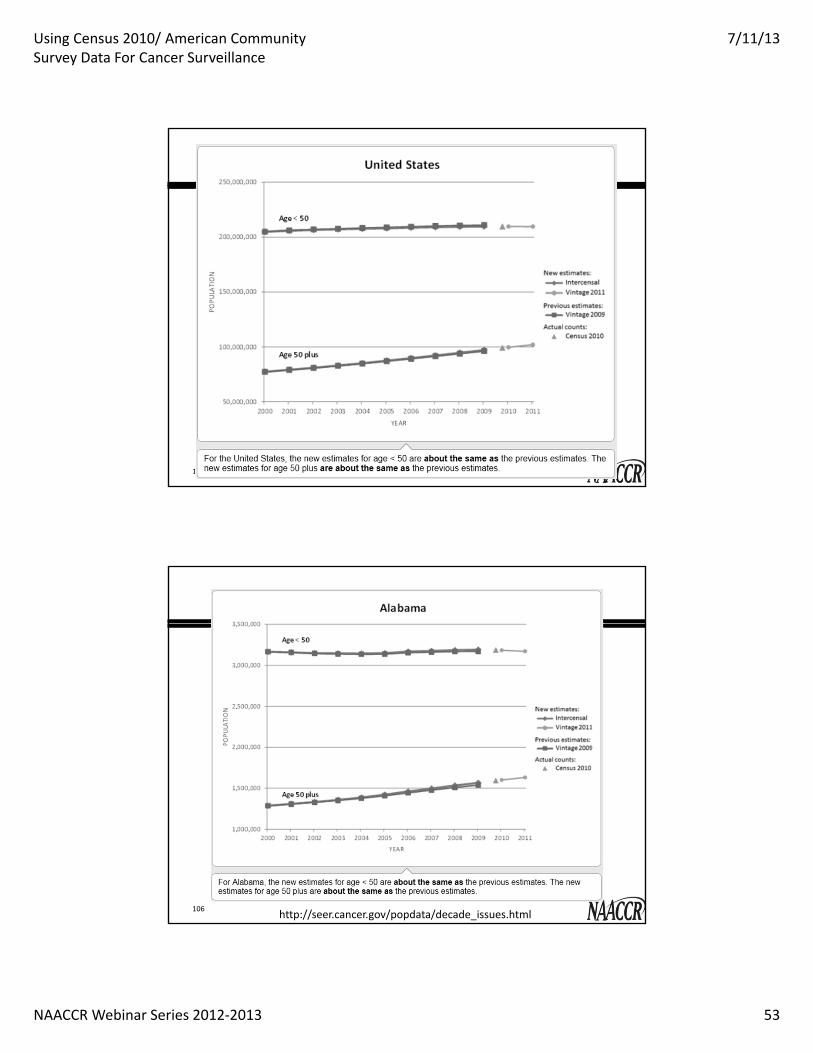
2. End of decade issues
• Affects all population sources (except arguably ACS)
• Population estimates are based on births (highly accurate), deaths (highly accurate), and migration (not very accurate)– Gets worse the further removed from a decadal census
103
104
Using Census 2010/ American Community Survey Data For Cancer Surveillance
7/11/13
NAACCR Webinar Series 2012‐2013 53
105
106 http://seer.cancer.gov/popdata/decade_issues.html
Using Census 2010/ American Community Survey Data For Cancer Surveillance
7/11/13
NAACCR Webinar Series 2012‐2013 54
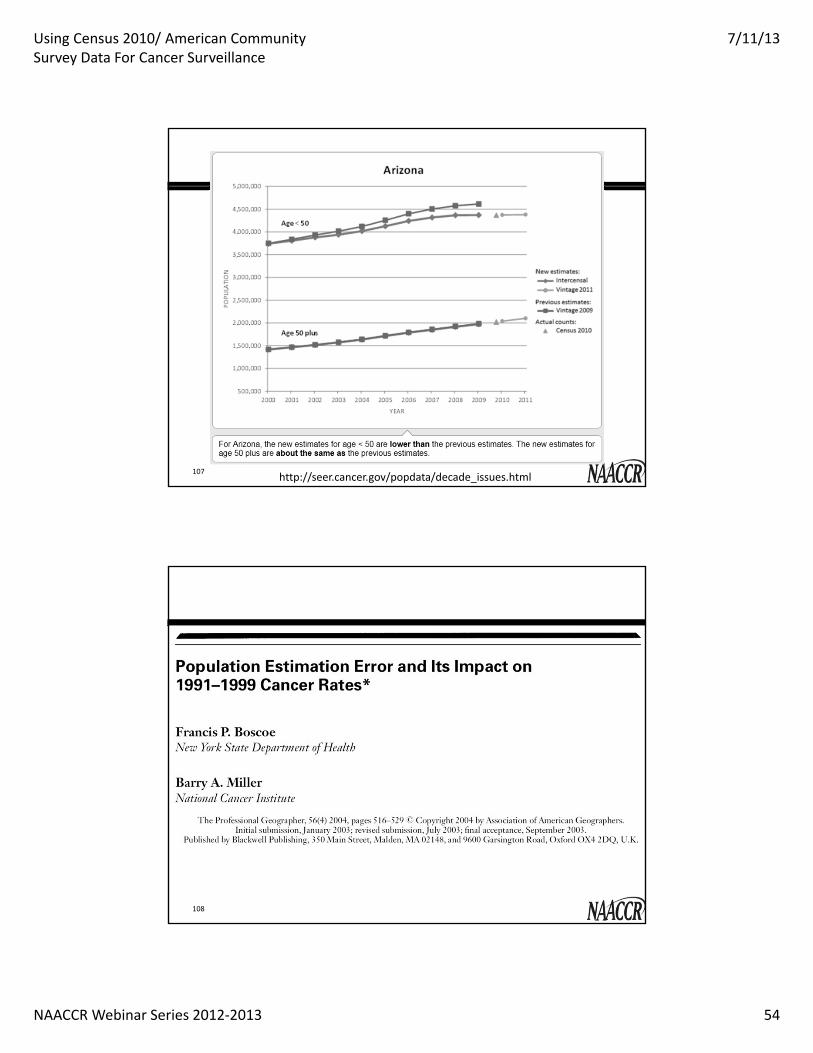
107 http://seer.cancer.gov/popdata/decade_issues.html
108
Using Census 2010/ American Community Survey Data For Cancer Surveillance
7/11/13
NAACCR Webinar Series 2012‐2013 55
109
110
Using Census 2010/ American Community Survey Data For Cancer Surveillance
7/11/13
NAACCR Webinar Series 2012‐2013 56
111
112

Using Census 2010/ American Community Survey Data For Cancer Surveillance
7/11/13
NAACCR Webinar Series 2012‐2013 57
113
1995‐99, All sites combined, both sexes
(a) everyone (b) children (c) blacks (d) Asians/Pacific Islanders
114
Using Census 2010/ American Community Survey Data For Cancer Surveillance
7/11/13
NAACCR Webinar Series 2012‐2013 58
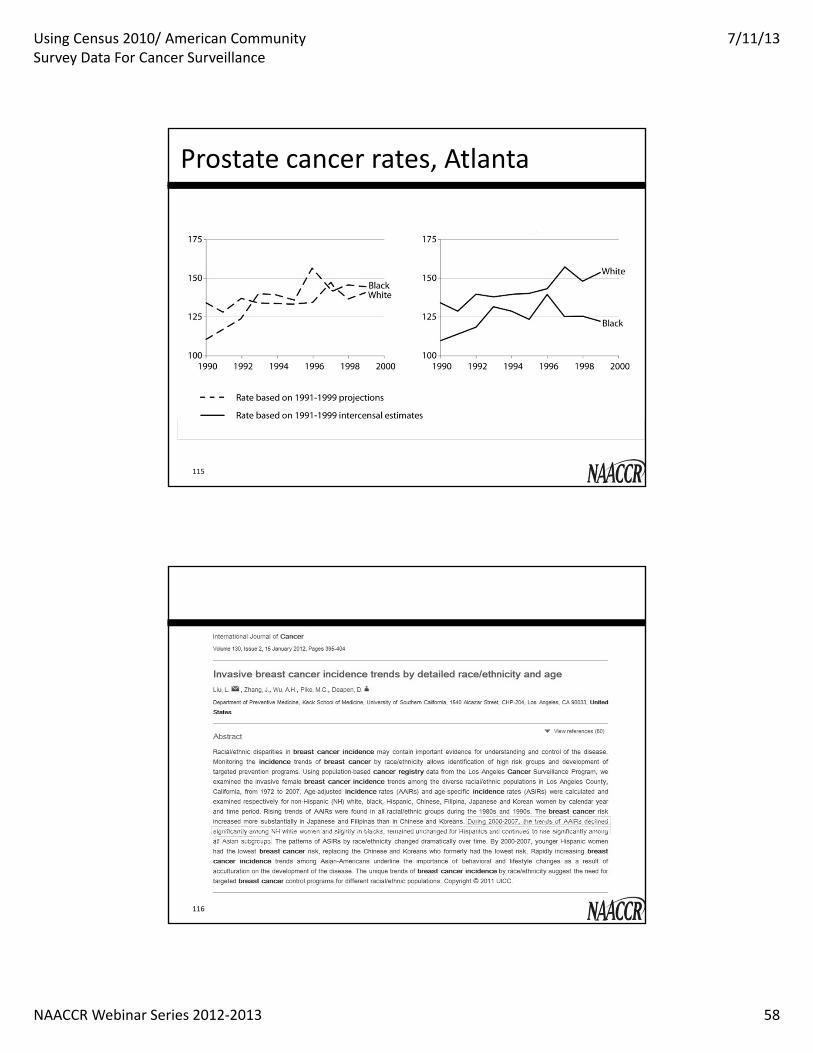
Prostate cancer rates, Atlanta
115
116
Using Census 2010/ American Community Survey Data For Cancer Surveillance
7/11/13
NAACCR Webinar Series 2012‐2013 59
117
3. Race bridging
• Multiple Race in California (2010 census)– Imperial County 1.7%– Los Angeles County 2.7%– Sacramento County 5.6%– Solano County 6.5%
118
Using Census 2010/ American Community Survey Data For Cancer Surveillance
7/11/13
NAACCR Webinar Series 2012‐2013 60
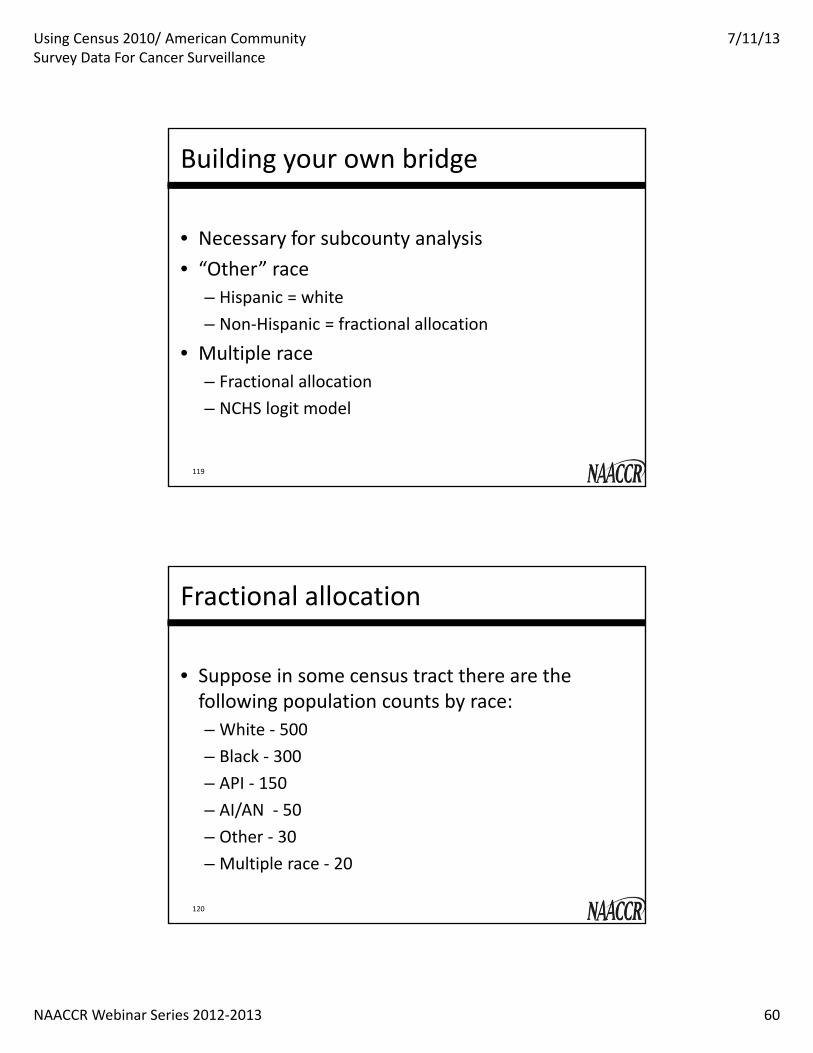
Building your own bridge
• Necessary for subcounty analysis• “Other” race
– Hispanic = white– Non‐Hispanic = fractional allocation
• Multiple race– Fractional allocation– NCHS logit model
119
Fractional allocation
• Suppose in some census tract there are the following population counts by race:– White ‐ 500– Black ‐ 300– API ‐ 150– AI/AN ‐ 50– Other ‐ 30– Multiple race ‐ 20
120
Using Census 2010/ American Community Survey Data For Cancer Surveillance
7/11/13
NAACCR Webinar Series 2012‐2013 61
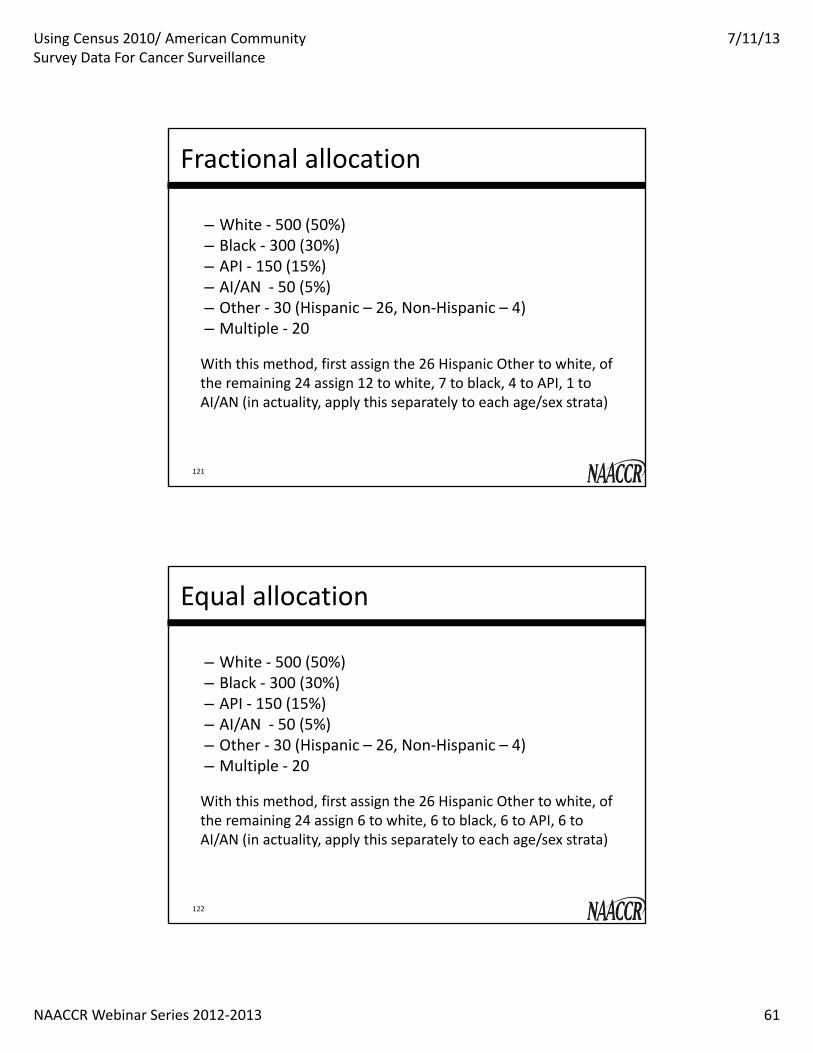
Fractional allocation
– White ‐ 500 (50%)– Black ‐ 300 (30%)– API ‐ 150 (15%)– AI/AN ‐ 50 (5%)– Other ‐ 30 (Hispanic – 26, Non‐Hispanic – 4)– Multiple ‐ 20
121
With this method, first assign the 26 Hispanic Other to white, of the remaining 24 assign 12 to white, 7 to black, 4 to API, 1 to AI/AN (in actuality, apply this separately to each age/sex strata)
Equal allocation
– White ‐ 500 (50%)– Black ‐ 300 (30%)– API ‐ 150 (15%)– AI/AN ‐ 50 (5%)– Other ‐ 30 (Hispanic – 26, Non‐Hispanic – 4)– Multiple ‐ 20
122
With this method, first assign the 26 Hispanic Other to white, of the remaining 24 assign 6 to white, 6 to black, 6 to API, 6 to AI/AN (in actuality, apply this separately to each age/sex strata)
Using Census 2010/ American Community Survey Data For Cancer Surveillance
7/11/13
NAACCR Webinar Series 2012‐2013 62
NCHS logit model
• Based on the National Health Interview Survey, which asks multiple‐race respondents to choose the single race with which they most closely identify
• A separate model was developed for each multi‐race combination (e.g. white and black, Asian and American Indian)
123
NCHS logit model
• Other variables used in the model:– Age– Hispanic origin– Sex– Region (NE, Midwest, South, West)– Urbanization– Percent of each race group in the county– Percent multiple race in the county
124
Using Census 2010/ American Community Survey Data For Cancer Surveillance
7/11/13
NAACCR Webinar Series 2012‐2013 63
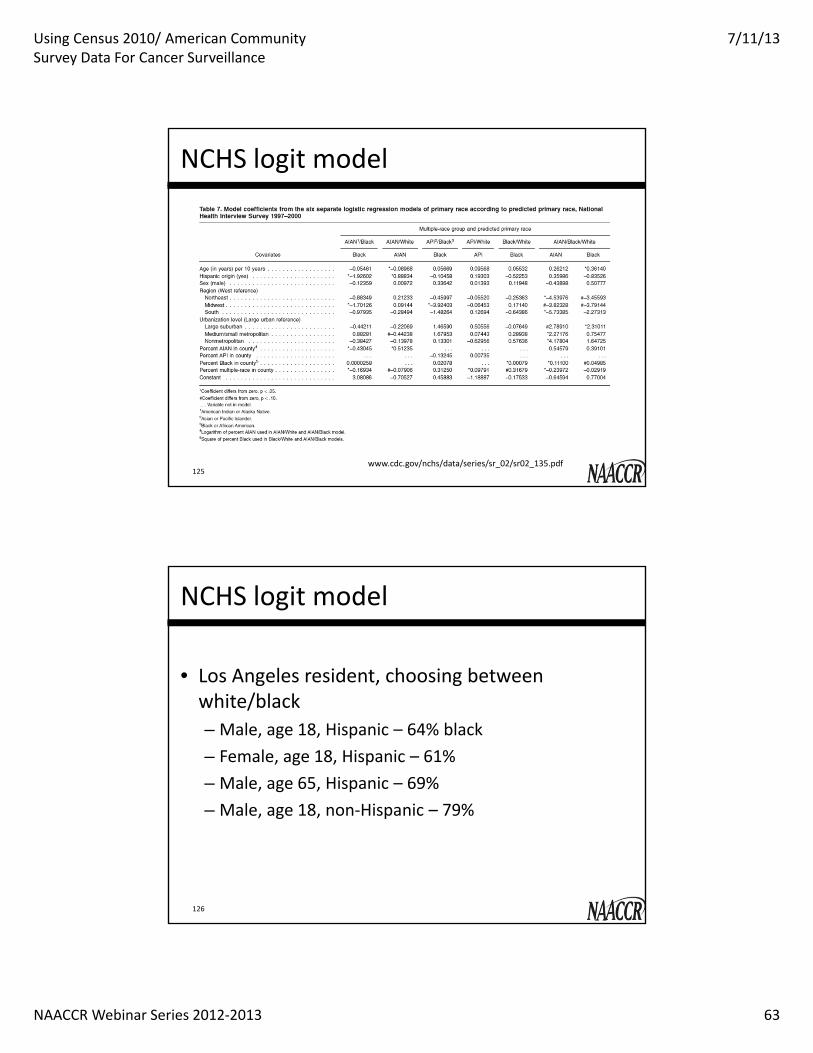
NCHS logit model
125www.cdc.gov/nchs/data/series/sr_02/sr02_135.pdf
NCHS logit model
• Los Angeles resident, choosing between white/black– Male, age 18, Hispanic – 64% black– Female, age 18, Hispanic – 61%– Male, age 65, Hispanic – 69%– Male, age 18, non‐Hispanic – 79%
126
Using Census 2010/ American Community Survey Data For Cancer Surveillance
7/11/13
NAACCR Webinar Series 2012‐2013 64
NCHS logit model
• Limitations
– Some data sets only provide the total number of multi‐race, not the actual combinations
– Model is probably seriously overfitted– All methods give us strange results in Guyanan and Trinidadian neighborhoods in Queens
127
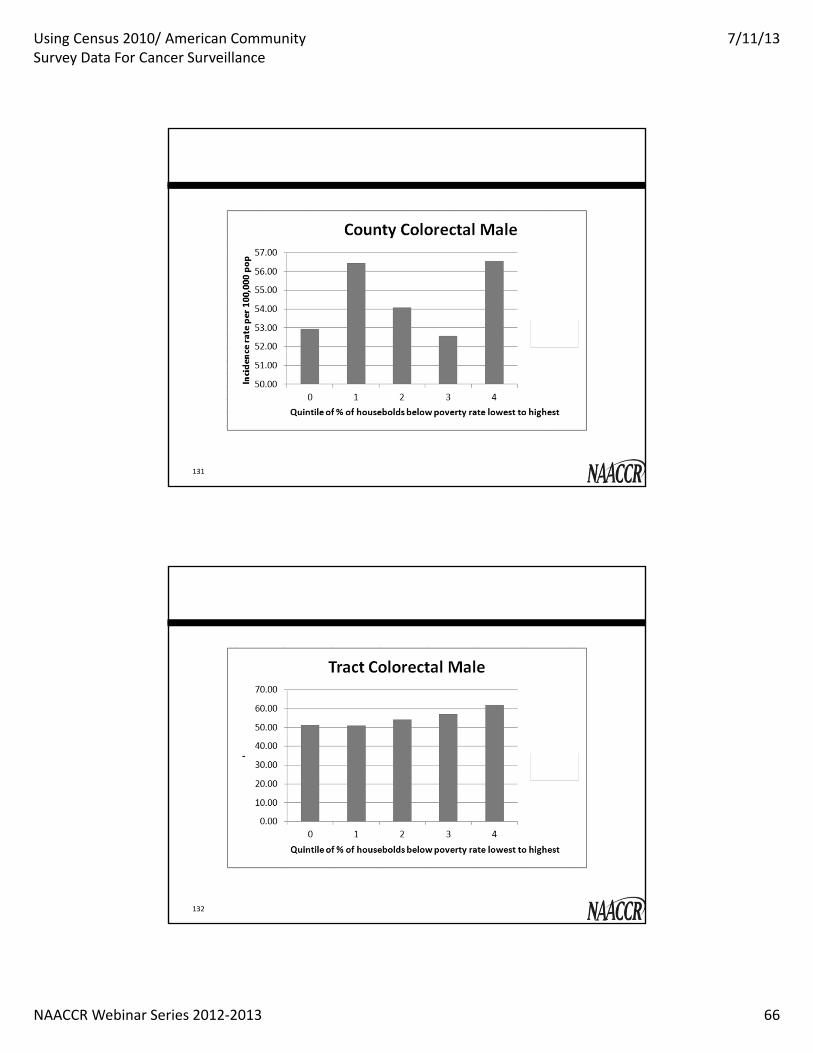
4. Subcounty SES and cancer
• County is not a useful unit of measure for ecologic analysis– Small number of highly heterogeneous urban counties with a large share of the population
– Directions of associations are often reversed!
128
Using Census 2010/ American Community Survey Data For Cancer Surveillance
7/11/13
NAACCR Webinar Series 2012‐2013 65
NAACCR Census Tract Poverty Indicator
• Helpful for interstate analyses– Poverty rate has been found to be a “singularly effective” measure of SES
– Cut points are <5%, 5‐10%, 10‐20%, and >20%– Within your own state, higher precision is possible
• Finer cut points (or even continuous)• Block group• Other measures than poverty
129
New York State analysis• Divided the state into quintiles at the block group, tract, and county level using different SES measures– 3,000 block groups per quintile– 1,000 tracts per quintile– 12‐13 counties per quintile
• Calculated cancer rates for each quintile for 23 common cancer sites
• SES measures used were median income, poverty rate, % foreign born, and % without HS education (only results for poverty reported here)
130
Using Census 2010/ American Community Survey Data For Cancer Surveillance
7/11/13
NAACCR Webinar Series 2012‐2013 66
131
132

Using Census 2010/ American Community Survey Data For Cancer Surveillance
7/11/13
NAACCR Webinar Series 2012‐2013 67
133
134
Using Census 2010/ American Community Survey Data For Cancer Surveillance
7/11/13
NAACCR Webinar Series 2012‐2013 68
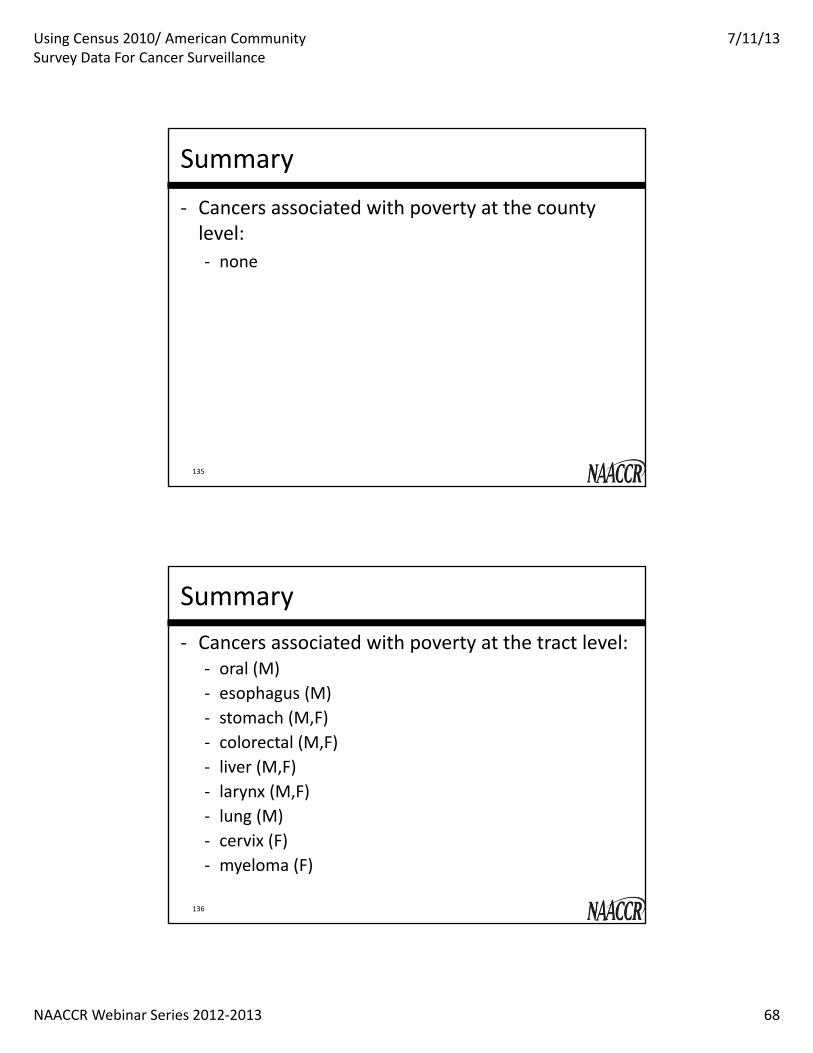
Summary
‐ Cancers associated with poverty at the county level:‐ none
135
Summary‐ Cancers associated with poverty at the tract level:
‐ oral (M)‐ esophagus (M)‐ stomach (M,F)‐ colorectal (M,F)‐ liver (M,F)‐ larynx (M,F)‐ lung (M)‐ cervix (F)‐ myeloma (F)
136

Using Census 2010/ American Community Survey Data For Cancer Surveillance
7/11/13
NAACCR Webinar Series 2012‐2013 69
Summary‐ Cancer associated with affluence at the tract level:
‐ all sites (F) ‐ Breast (F)‐ Uterus (F)‐ Ovary (F)‐ Bladder (M,F)‐ Kidney (M)‐ Melanoma (M,F)‐ Testis (M)‐ Thyroid (M,F)‐ Brain (M,F)‐ NHL (M,F)‐ Leukemia (M,F)
137
138
Using Census 2010/ American Community Survey Data For Cancer Surveillance
7/11/13
NAACCR Webinar Series 2012‐2013 70
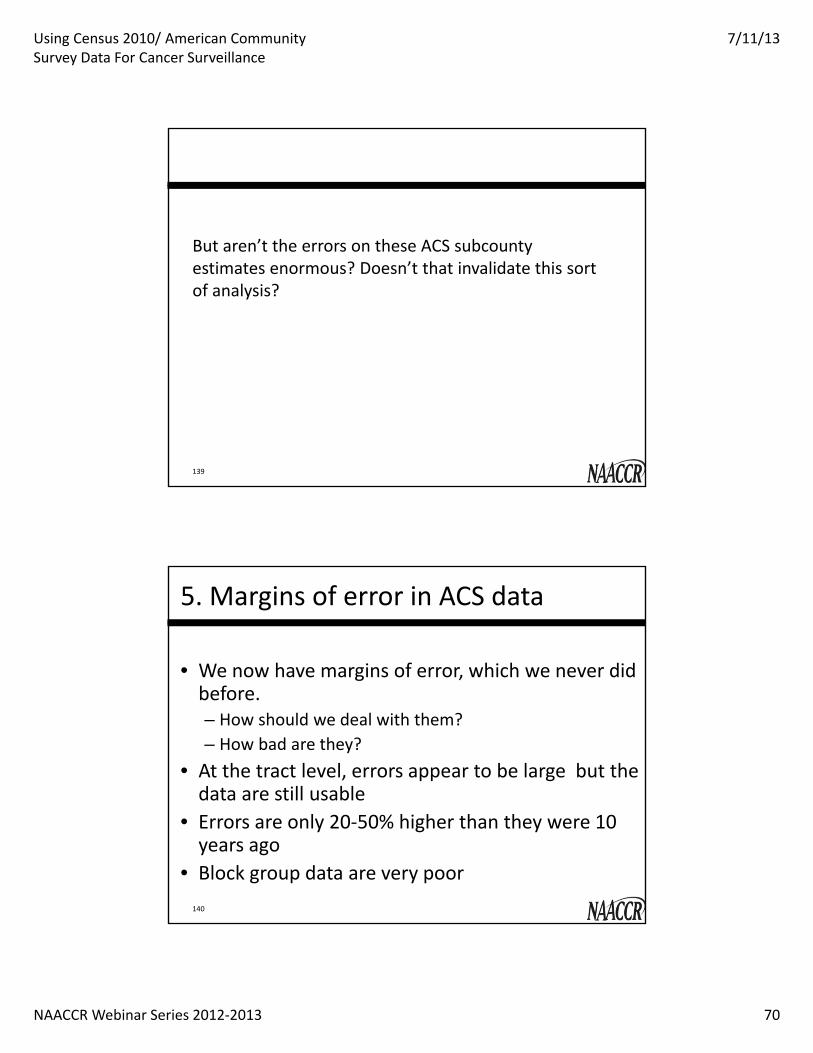
139
But aren’t the errors on these ACS subcountyestimates enormous? Doesn’t that invalidate this sort of analysis?
5. Margins of error in ACS data
• We now have margins of error, which we never did before. – How should we deal with them?– How bad are they?
• At the tract level, errors appear to be large but the data are still usable
• Errors are only 20‐50% higher than they were 10 years ago
• Block group data are very poor140
Using Census 2010/ American Community Survey Data For Cancer Surveillance
7/11/13
NAACCR Webinar Series 2012‐2013 71
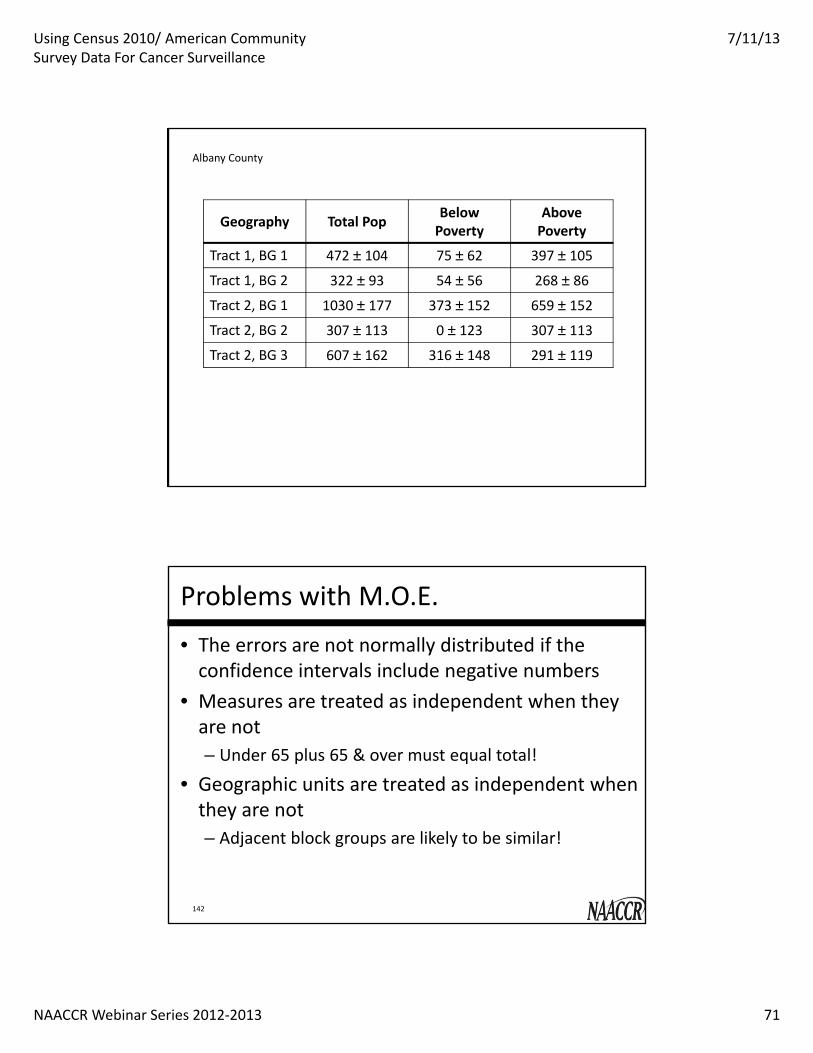
Source: U.S. Bureau of the Census. Confidence intervals are reported as 90%.
Albany County
Geography Total Pop Below Poverty
AbovePoverty
Tract 1, BG 1 472 ± 104 75 ± 62 397 ± 105
Tract 1, BG 2 322 ± 93 54 ± 56 268 ± 86
Tract 2, BG 1 1030 ± 177 373 ± 152 659 ± 152
Tract 2, BG 2 307 ± 113 0 ± 123 307 ± 113
Tract 2, BG 3 607 ± 162 316 ± 148 291 ± 119
Problems with M.O.E.
• The errors are not normally distributed if the confidence intervals include negative numbers
• Measures are treated as independent when they are not– Under 65 plus 65 & over must equal total!
• Geographic units are treated as independent when they are not– Adjacent block groups are likely to be similar!
142
Using Census 2010/ American Community Survey Data For Cancer Surveillance
7/11/13
NAACCR Webinar Series 2012‐2013 72
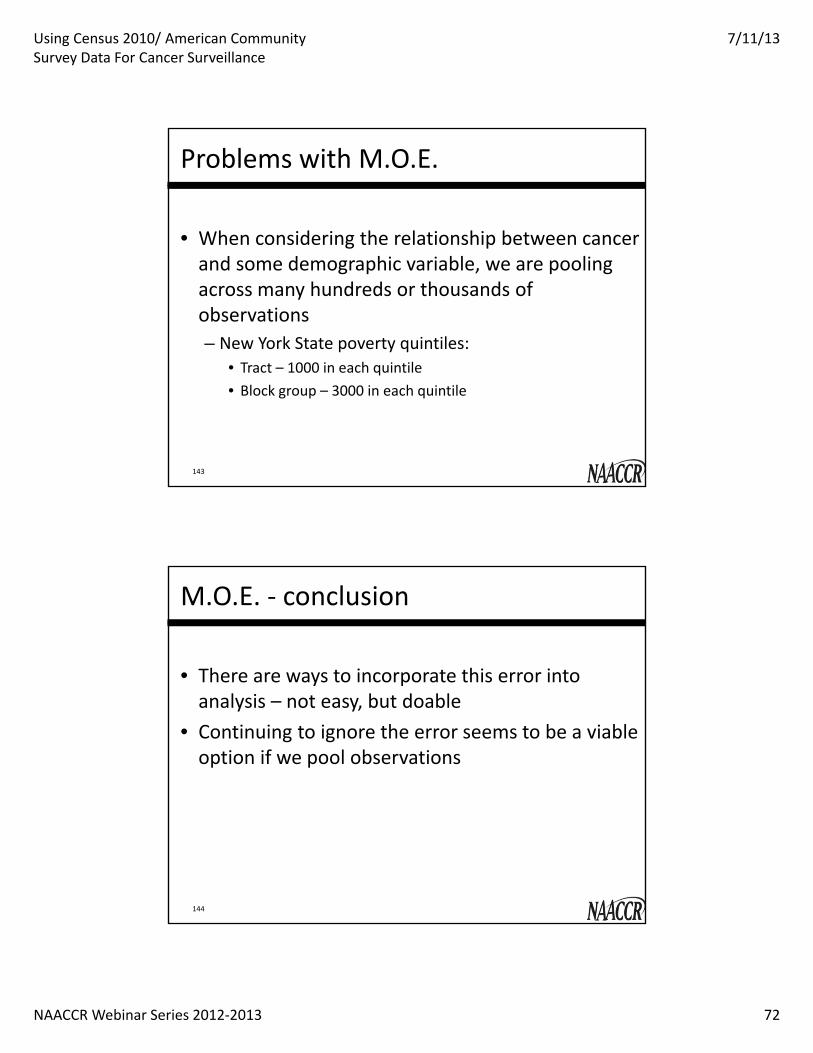
Problems with M.O.E.
• When considering the relationship between cancer and some demographic variable, we are pooling across many hundreds or thousands of observations– New York State poverty quintiles:
• Tract – 1000 in each quintile• Block group – 3000 in each quintile
143
M.O.E. ‐ conclusion
• There are ways to incorporate this error into analysis – not easy, but doable
• Continuing to ignore the error seems to be a viable option if we pool observations
144
Using Census 2010/ American Community Survey Data For Cancer Surveillance
7/11/13
NAACCR Webinar Series 2012‐2013 73
NAACCR 2013 Topics in GIS Webinar
Accessing Census Data Using NAACCR Tools/Datasets
Dave Stinchcomb, Westat, Inc.
ACS Data on NAACCR GIS Web Page
• Commonly used demographic and socio‐economic variables at the census tract level– Percentages for comparison across areas– All of the U.S. and Puerto Rico– Currently ACS 2005‐2009 and 2006‐2010(2007‐2011 coming soon)
• Finding the NAACCR GIS Resources Web page:– NAACCR Home Page / Research / GIS Resources– Google “NAACCR GIS”– http://www.naaccr.org/Research/GISResources.aspx
146
Using Census 2010/ American Community Survey Data For Cancer Surveillance
7/11/13
NAACCR Webinar Series 2012‐2013 74
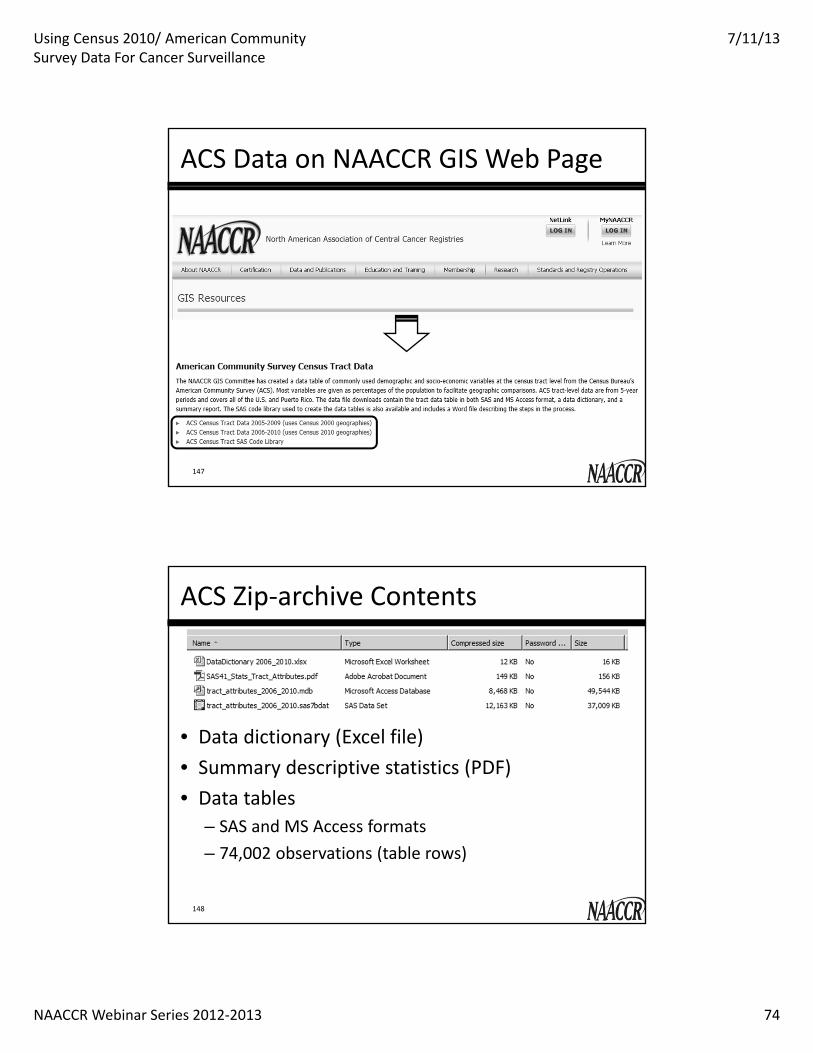
ACS Data on NAACCR GIS Web Page
147
ACS Zip‐archive Contents
• Data dictionary (Excel file)• Summary descriptive statistics (PDF)• Data tables
– SAS and MS Access formats– 74,002 observations (table rows)
148
Using Census 2010/ American Community Survey Data For Cancer Surveillance
7/11/13
NAACCR Webinar Series 2012‐2013 75
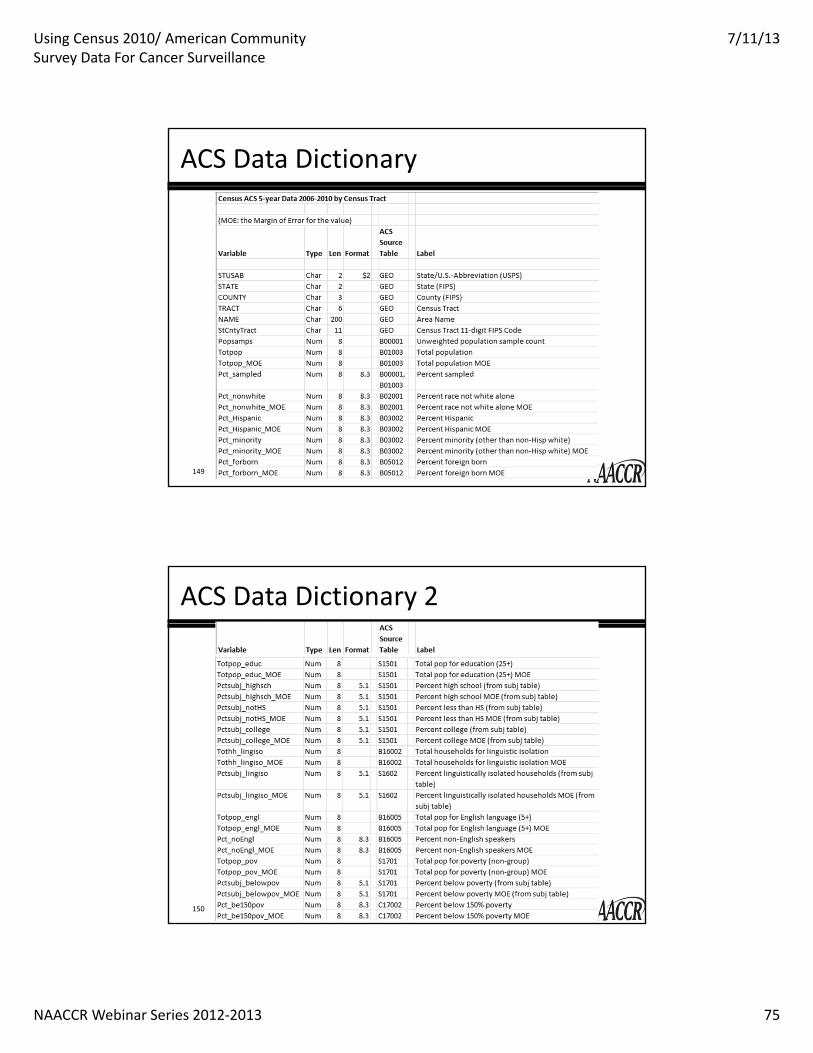
ACS Data Dictionary
149
ACS Data Dictionary 2
150
Using Census 2010/ American Community Survey Data For Cancer Surveillance
7/11/13
NAACCR Webinar Series 2012‐2013 76
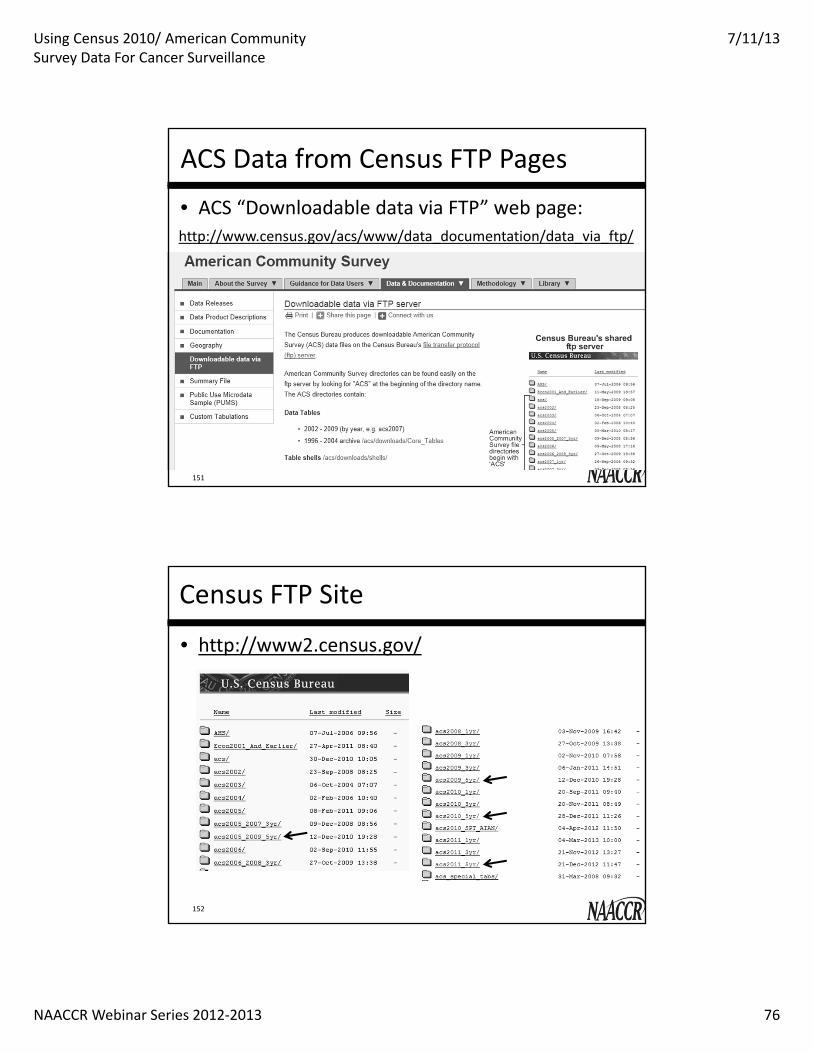
ACS Data from Census FTP Pages
• ACS “Downloadable data via FTP” web page:
151
http://www.census.gov/acs/www/data_documentation/data_via_ftp/
Census FTP Site
• http://www2.census.gov/
152
Using Census 2010/ American Community Survey Data For Cancer Surveillance
7/11/13
NAACCR Webinar Series 2012‐2013 77
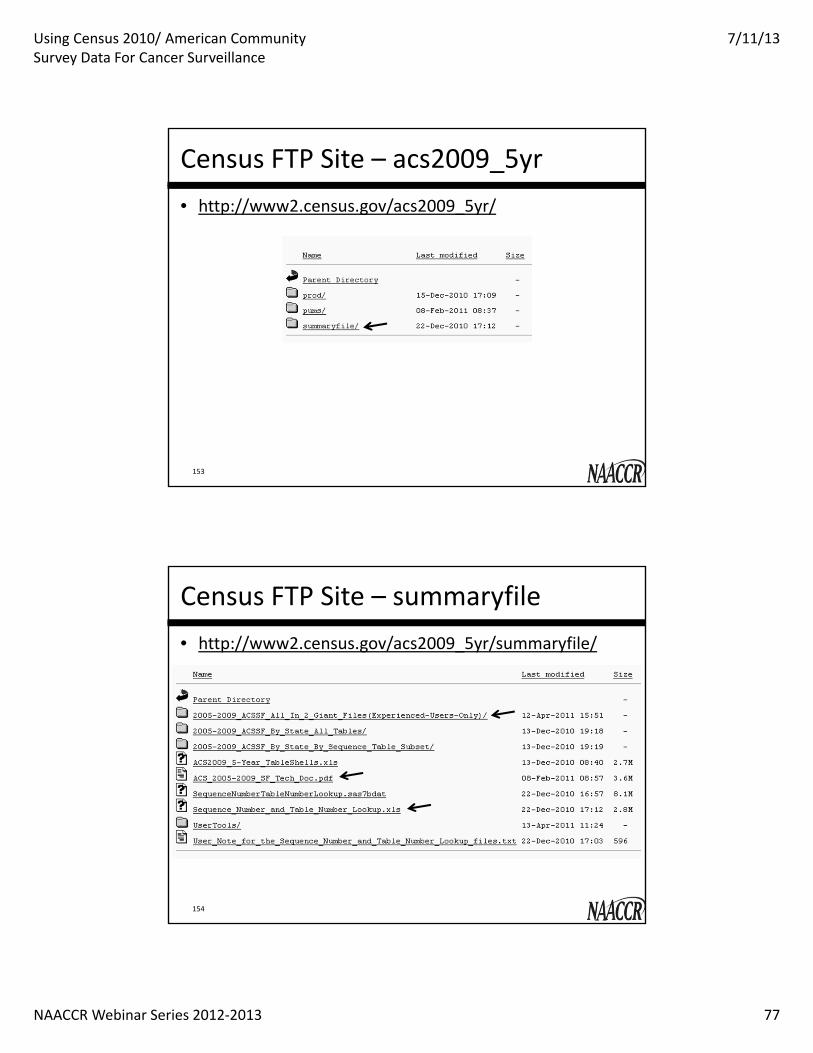
Census FTP Site – acs2009_5yr• http://www2.census.gov/acs2009_5yr/
153
Census FTP Site – summaryfile• http://www2.census.gov/acs2009_5yr/summaryfile/
154

Using Census 2010/ American Community Survey Data For Cancer Surveillance
7/11/13
NAACCR Webinar Series 2012‐2013 78
Census FTP Site – 2_Giant_Files• http://www2.census.gov/acs2009_5yr/summaryfile/
/2005‐2009_ACSSF_All_In_2_Giant_Files(Experienced‐Users‐Only)/
155
ACS Technical Documentation
156
Using Census 2010/ American Community Survey Data For Cancer Surveillance
7/11/13
NAACCR Webinar Series 2012‐2013 79
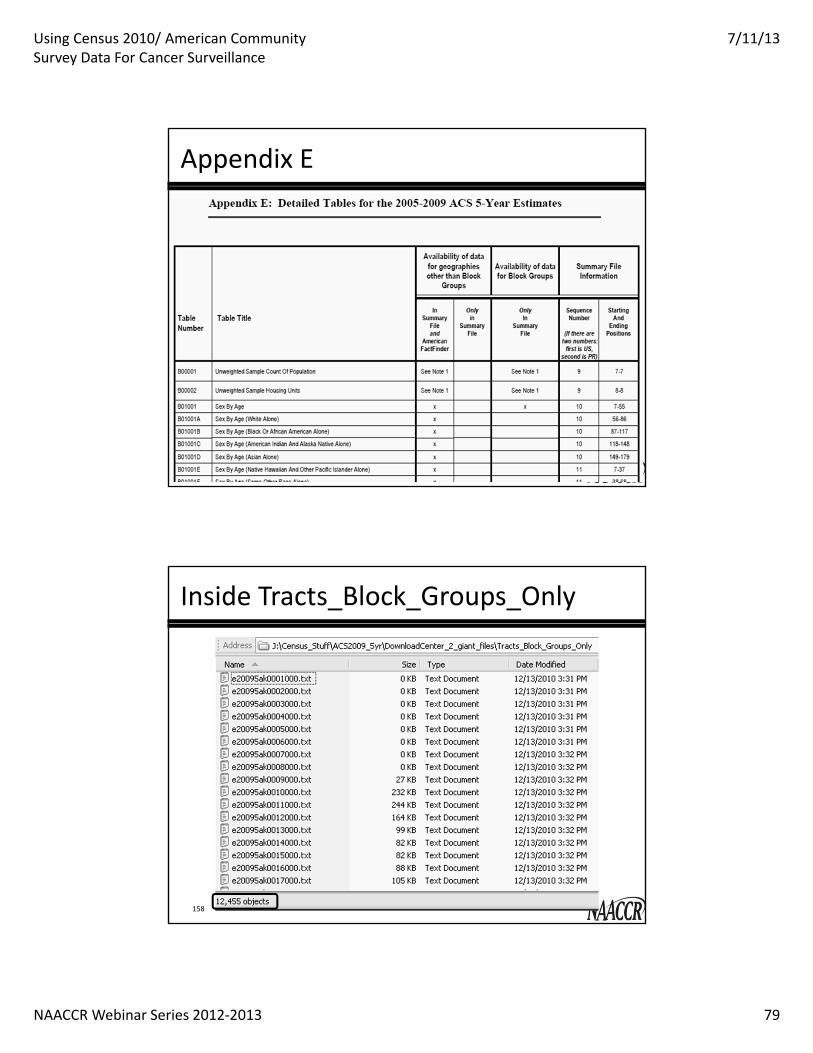
Appendix E
157
Inside Tracts_Block_Groups_Only
158
Using Census 2010/ American Community Survey Data For Cancer Surveillance
7/11/13
NAACCR Webinar Series 2012‐2013 80
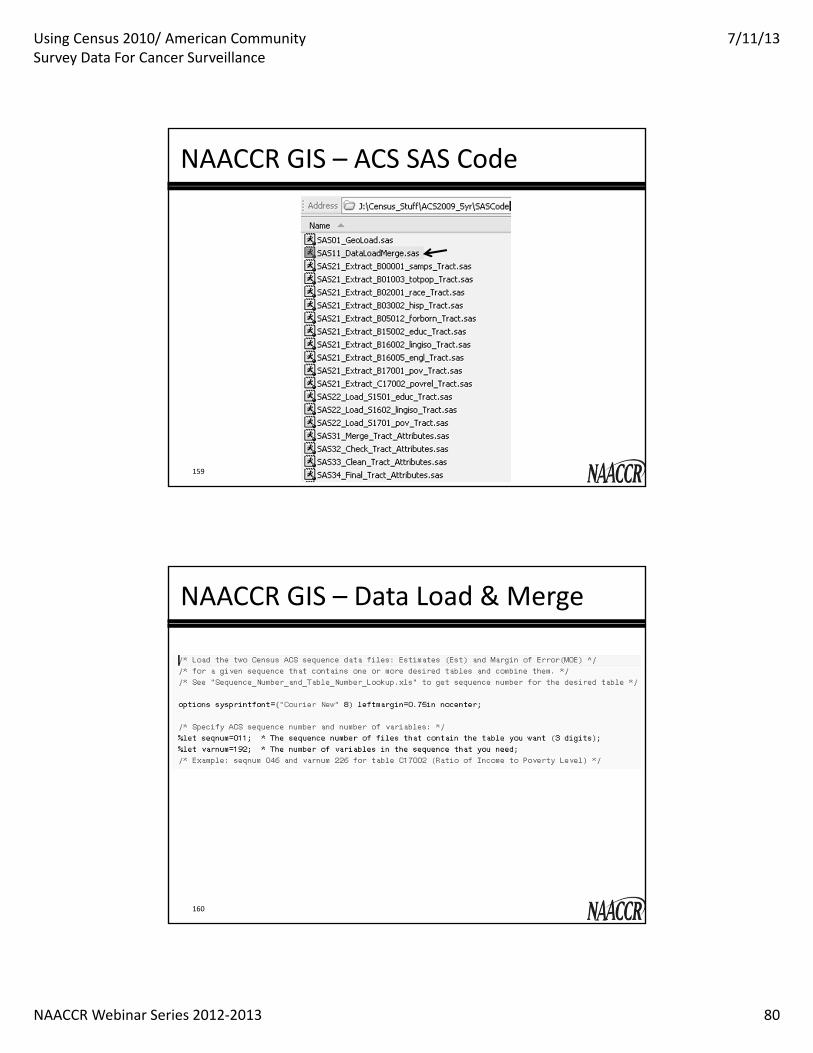
NAACCR GIS – ACS SAS Code
159
NAACCR GIS – Data Load & Merge
160
Using Census 2010/ American Community Survey Data For Cancer Surveillance
7/11/13
NAACCR Webinar Series 2012‐2013 81
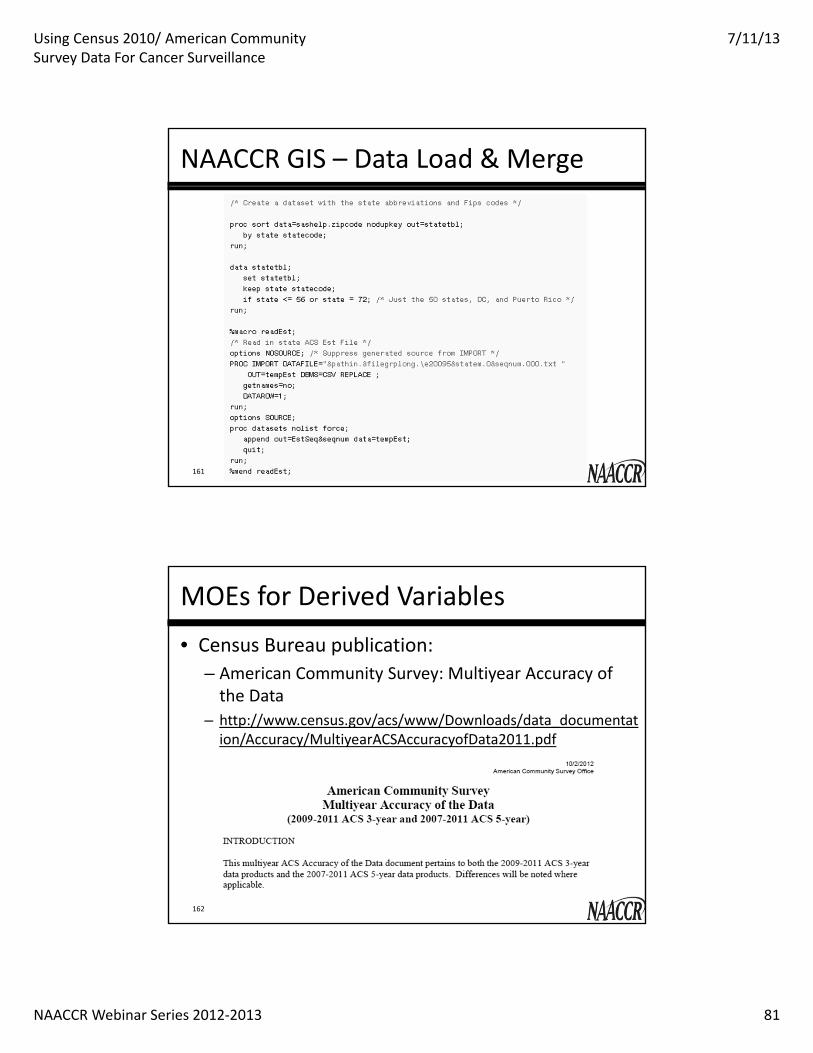
NAACCR GIS – Data Load & Merge
161
MOEs for Derived Variables
• Census Bureau publication:– American Community Survey: Multiyear Accuracy of the Data
– http://www.census.gov/acs/www/Downloads/data_documentation/Accuracy/MultiyearACSAccuracyofData2011.pdf
162
Using Census 2010/ American Community Survey Data For Cancer Surveillance
7/11/13
NAACCR Webinar Series 2012‐2013 82
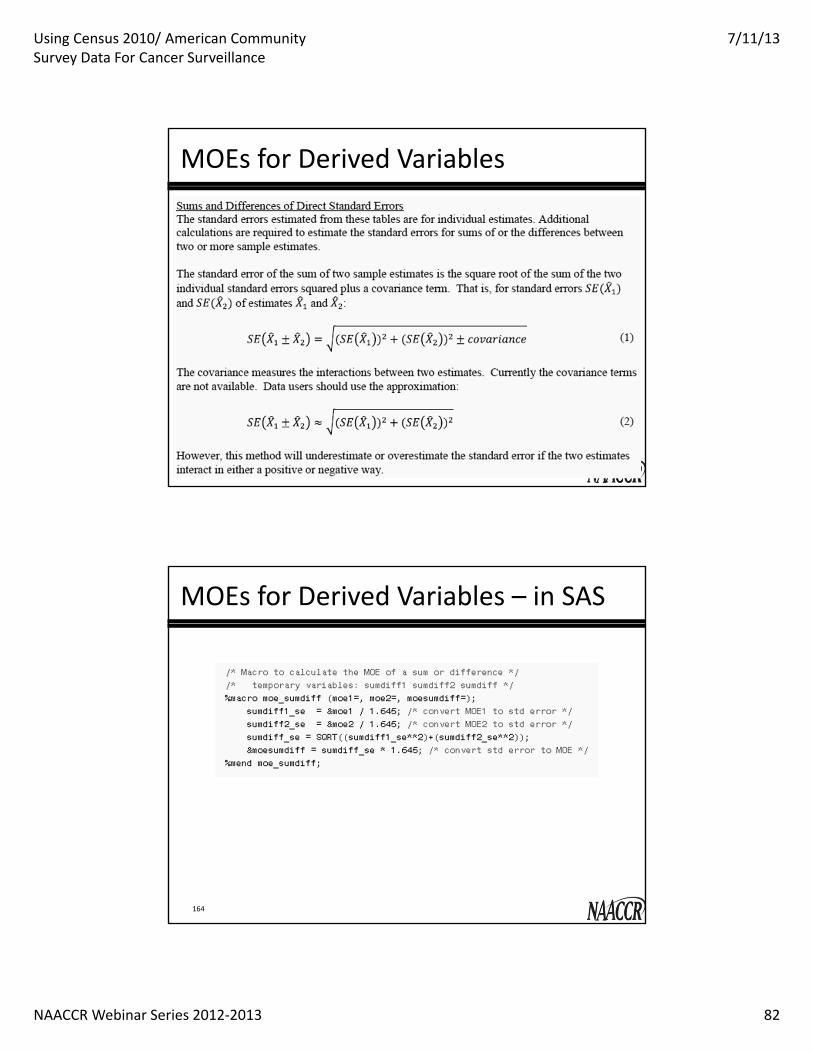
MOEs for Derived Variables
163
MOEs for Derived Variables – in SAS
164

Using Census 2010/ American Community Survey Data For Cancer Surveillance
7/11/13
NAACCR Webinar Series 2012‐2013 83
MOEs for Derived Variables – Example
165
Proportion below 150% of poverty = (79 + 194 + 109 + 88) / 2714
Proportion with income below 150% of poverty
An ACS GIS Tool from the CDC
• Esri ArcGIS ACS Toolbox– Calculates MOEs for user‐derived data– Determines statistically significant differences– Helps find a suitable mapping scheme considering data uncertainty
• Availability:– Current version running on ArcGIS 10– Contact Elaine Hallisey, CDC/ATSDR ([email protected])
166
Using Census 2010/ American Community Survey Data For Cancer Surveillance
7/11/13
NAACCR Webinar Series 2012‐2013 84
Future Plans
• Census tract data for ACS 2007‐2011• Expanded variables• Suggestions from user feedback
167
168
Questions?

Using Census 2010/ American Community Survey Data For Cancer Surveillance
7/11/13
NAACCR Webinar Series 2012‐2013 85
Coming up!• 8/1/13
– Cancer Registry Quality Control• 9/5/13
– Coding Pitfalls
Certificate phrase: Census 2010
http://www.surveygizmo.com/s3/1303184/GIS‐Webinar
Fabulous Prize Winners Are…

Using Census 2010/ American Community Survey Data For Cancer Surveillance
7/11/13
NAACCR Webinar Series 2012‐2013 86
Thank You!


![Meet the AppNexperts: Four Big Topics in Mobile for 2016 [Webinar]](https://static.fdocuments.in/doc/165x107/587aba0c1a28abc0478b5269/meet-the-appnexperts-four-big-topics-in-mobile-for-2016-webinar.jpg)


