TOPIC 8 Spray G Nozzle Geometry and Internal Nozzle Flow · PDF fileSpray G Nozzle Geometry...
70
ECN 4: Spray G - Internal Geometry and Flow 1 5-6 September 2015 TOPIC 8 Spray G Nozzle Geometry and Internal Nozzle Flow Chris Powell, Daniel Duke, Energy Systems Division, Argonne National Laboratory Ron Grover, GM R&D 1. Nozzle geometry and near-nozzle experiments 2. Internal and near-nozzle flow modeling
Transcript of TOPIC 8 Spray G Nozzle Geometry and Internal Nozzle Flow · PDF fileSpray G Nozzle Geometry...
ECN 4: Spray G - Internal Geometry and Flow 1 5-6 September 2015
TOPIC 8 Spray G Nozzle Geometry and Internal Nozzle Flow Chris Powell, Daniel Duke, Energy Systems Division, Argonne National Laboratory Ron Grover, GM R&D
1. Nozzle geometry and near-nozzle experiments 2. Internal and near-nozzle flow modeling
ECN 4: Spray G - Internal Geometry and Flow 2 5-6 September 2015
Contributors / Acknowledgements
• Scott Parrish, Ron Grover (GM R&D) – Near nozzle-tip imaging, Rate of Injection, PDA
• Lee Markle (Delphi) – Patternation
• Julien Manin, Lyle Pickett (Sandia) – Microscopy, Tomography, geometric analysis
• Raul Payri, Jaime Gimeno, Pedro Marti-Aldaravi, Daniel Vaquerizo (CMT) – ROI, ROM, Silicone mold
• Alan Kastengren, Daniel Duke, Andrew Swantek, Nick Sovis, Chris Powell (ANL) – Radiography & Tomography
ECN 4: Spray G - Internal Geometry and Flow 3 5-6 September 2015
Outline
• Nozzle Geometry – X-ray tomography – Microscopy – Meshes used for simulation contributions – Deviation of actual injector geometry from ideal
• Internal & near nozzle experiments – Rate of injection & rate of momentum – Patternation – Near tip microscopic imaging – X-ray radiography
• Internal flow modeling contributions
ECN 4: Spray G - Internal Geometry and Flow 4 5-6 September 2015
Goals of Topic 8
• Characterize the geometry of the Spray G injectors
• Evaluate the available measured geometries in terms of accuracy and precision
• Decide on a “reference” geometry • Experimentally characterize the internal flow of
Spray G nozzles • Co-ordinate simulations of the internal flow • If possible, determine best practices for nozzle
flow simulations
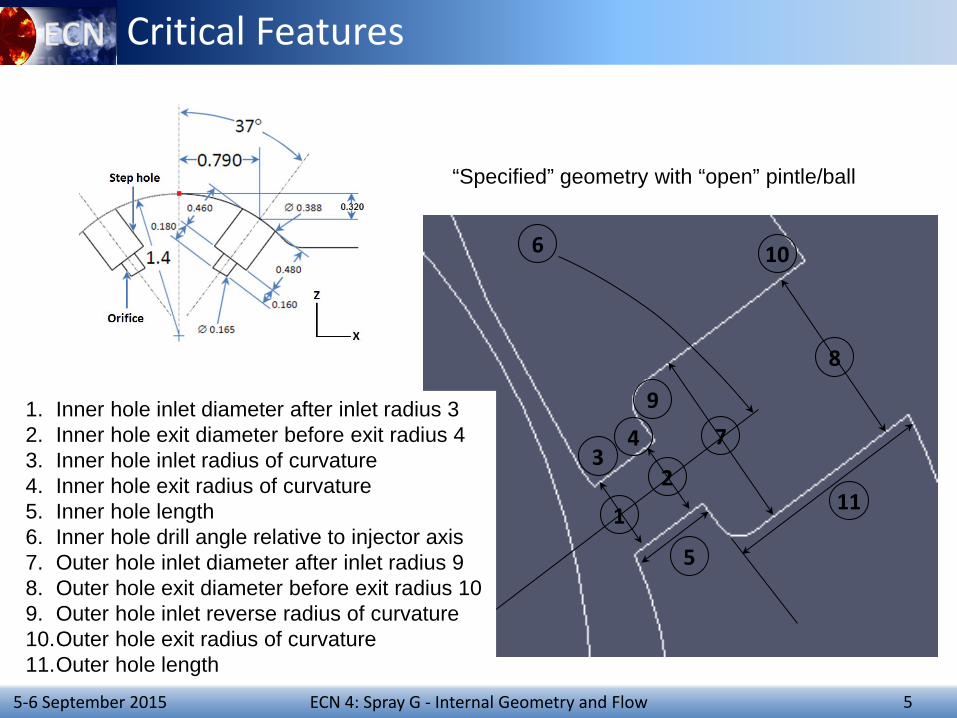
5 ECN 4: Spray G - Internal Geometry and Flow 5-6 September 2015
Critical Features
“Specified” geometry with “open” pintle/ball
3
1
2
4
6
7
8
9
10
5
11
1. Inner hole inlet diameter after inlet radius 3 2. Inner hole exit diameter before exit radius 4 3. Inner hole inlet radius of curvature 4. Inner hole exit radius of curvature 5. Inner hole length 6. Inner hole drill angle relative to injector axis 7. Outer hole inlet diameter after inlet radius 9 8. Outer hole exit diameter before exit radius 10 9. Outer hole inlet reverse radius of curvature 10.Outer hole exit radius of curvature 11.Outer hole length
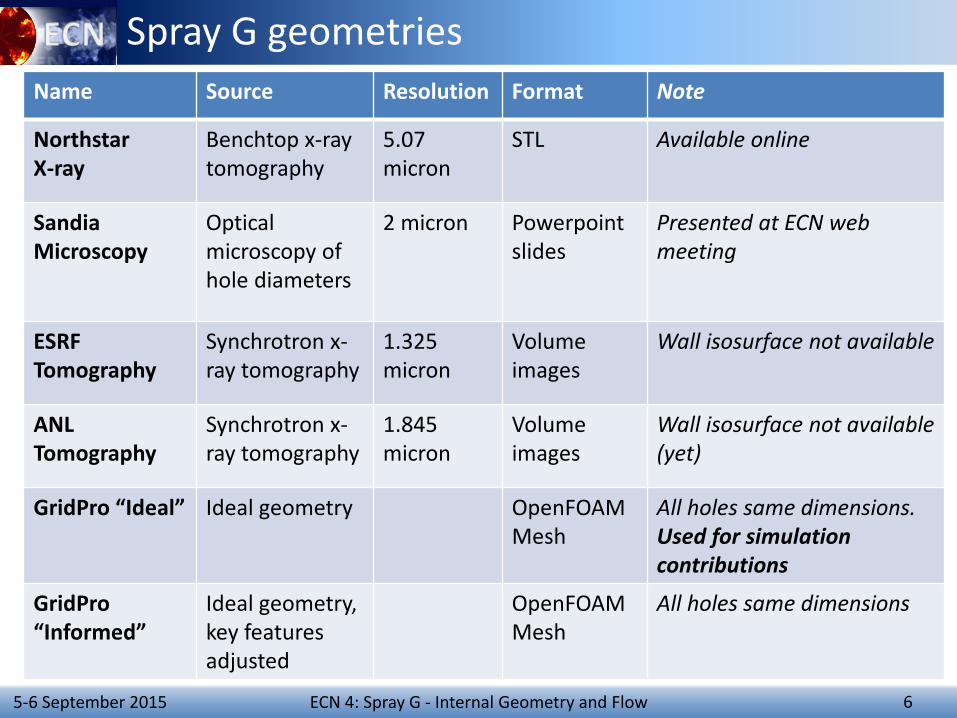
ECN 4: Spray G - Internal Geometry and Flow 6 5-6 September 2015
Spray G geometries Name Source Resolution Format Note
Northstar X-ray
Benchtop x-ray tomography
5.07 micron
STL Available online
Sandia Microscopy
Optical microscopy of hole diameters
2 micron Powerpoint slides
Presented at ECN web meeting
ESRF Tomography
Synchrotron x-ray tomography
1.325 micron
Volume images
Wall isosurface not available
ANL Tomography
Synchrotron x-ray tomography
1.845 micron
Volume images
Wall isosurface not available (yet)
GridPro “Ideal” Ideal geometry OpenFOAM Mesh
All holes same dimensions. Used for simulation contributions
GridPro “Informed”
Ideal geometry, key features adjusted
OpenFOAM Mesh
All holes same dimensions
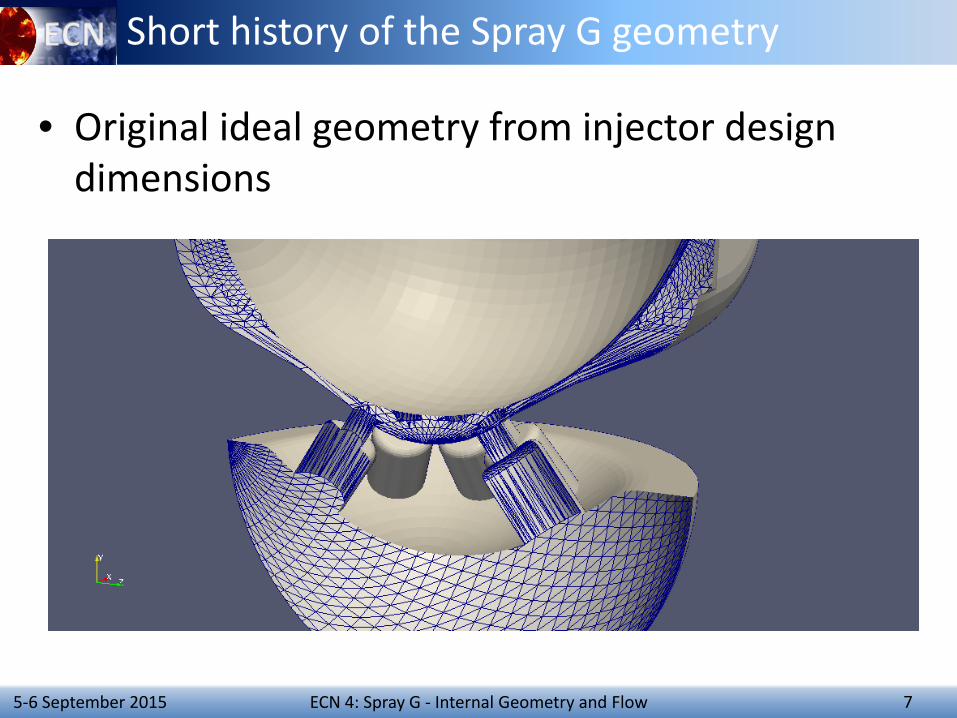
ECN 4: Spray G - Internal Geometry and Flow 7 5-6 September 2015
Short history of the Spray G geometry
• Original ideal geometry from injector design dimensions
ECN 4: Spray G - Internal Geometry and Flow 8 5-6 September 2015
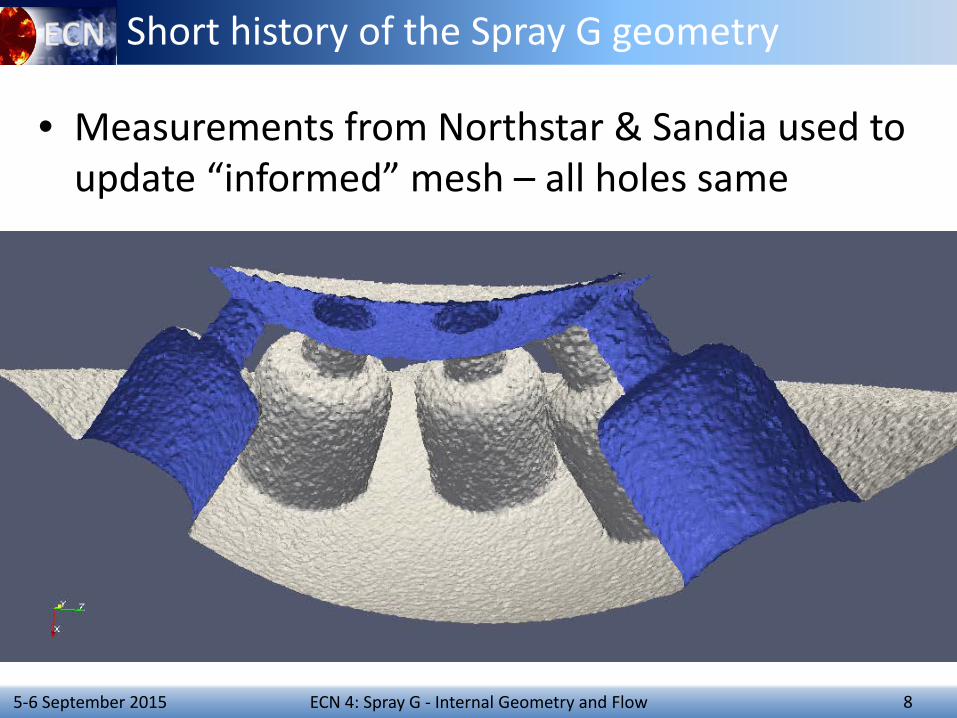
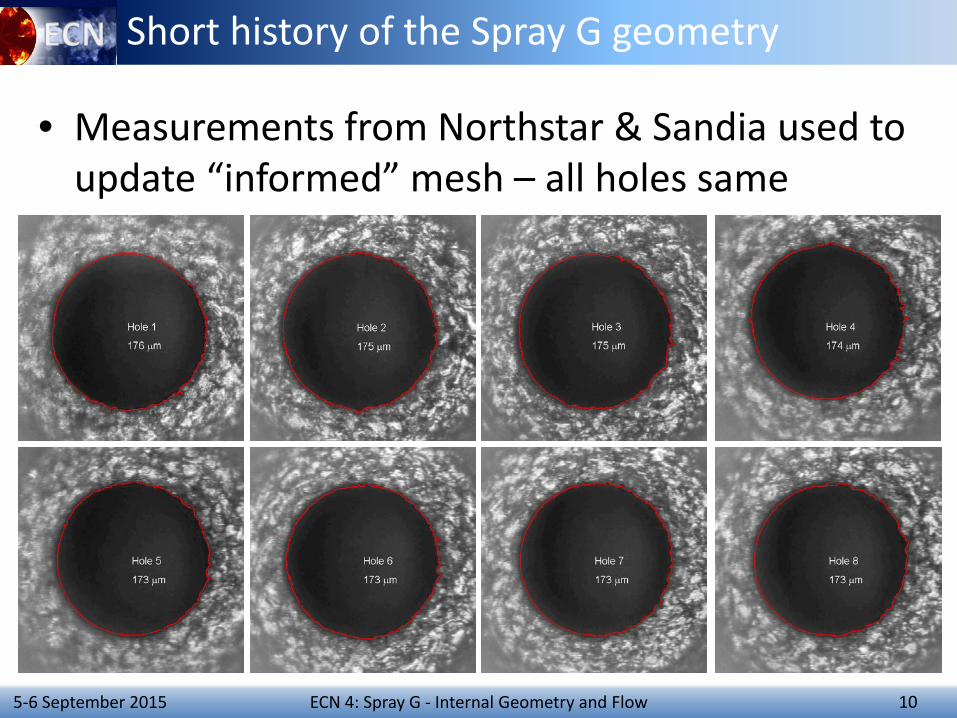
Short history of the Spray G geometry
• Measurements from Northstar & Sandia used to update “informed” mesh – all holes same
9 ECN 4: Spray G - Internal Geometry and Flow 5-6 September 2015
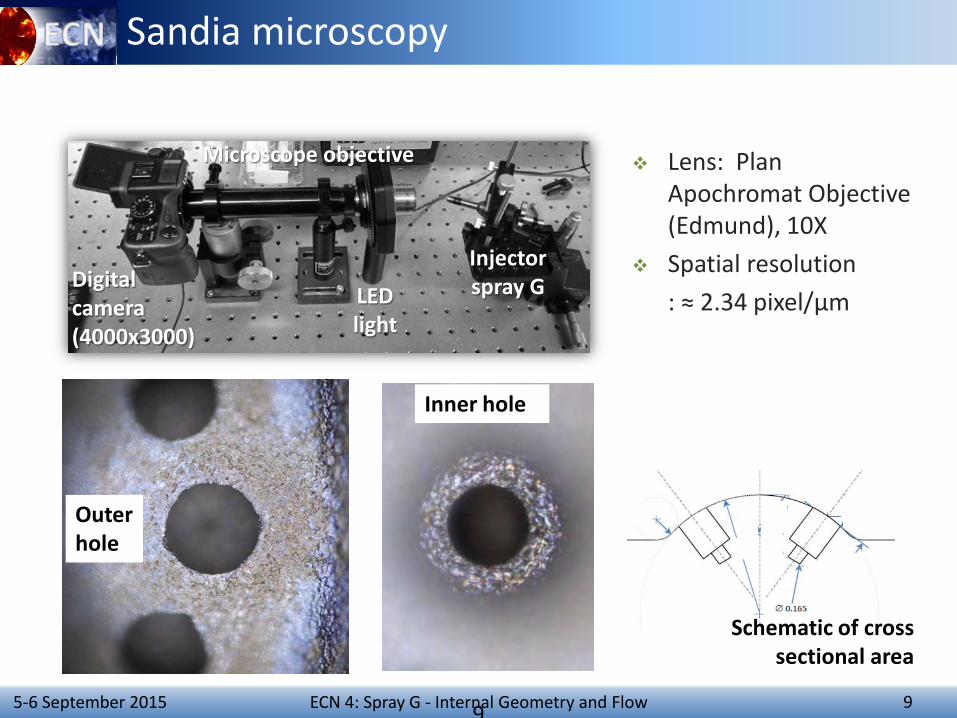
Sandia microscopy
9
Digital camera (4000x3000)
Microscope objective
LED light
Injector spray G
Outer hole
Inner hole
Lens: Plan Apochromat Objective (Edmund), 10X
Spatial resolution : ≈ 2.34 pixel/μm
Schematic of cross sectional area
ECN 4: Spray G - Internal Geometry and Flow 10 5-6 September 2015
Short history of the Spray G geometry
• Measurements from Northstar & Sandia used to update “informed” mesh – all holes same
11 ECN 4: Spray G - Internal Geometry and Flow 5-6 September 2015
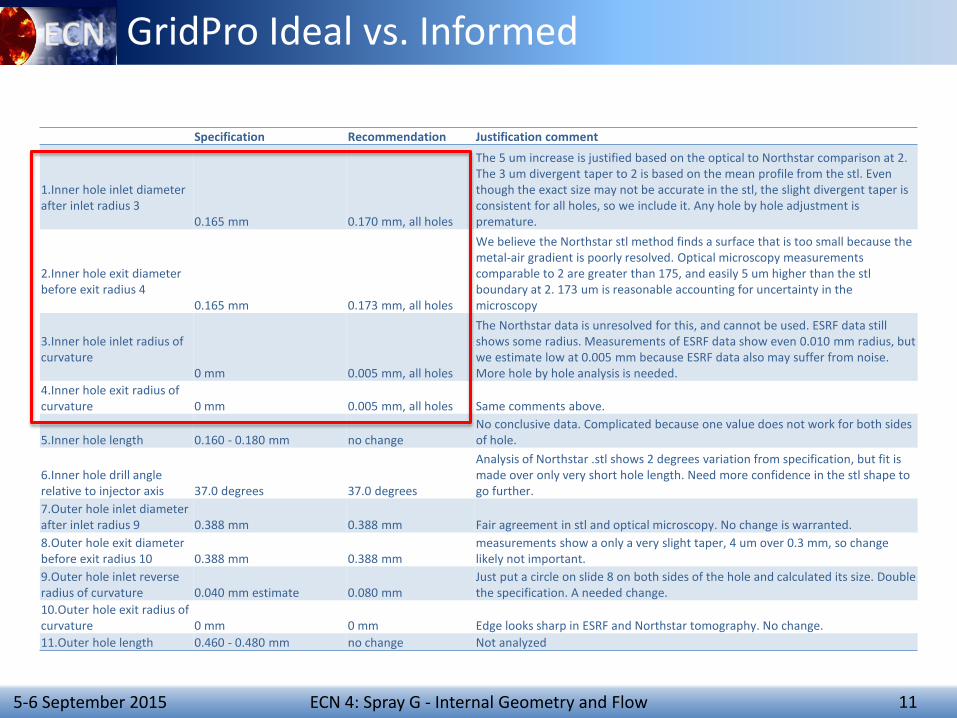
GridPro Ideal vs. Informed
Specification Recommendation Justification comment
1.Inner hole inlet diameter after inlet radius 3 0.165 mm 0.170 mm, all holes
The 5 um increase is justified based on the optical to Northstar comparison at 2. The 3 um divergent taper to 2 is based on the mean profile from the stl. Even though the exact size may not be accurate in the stl, the slight divergent taper is consistent for all holes, so we include it. Any hole by hole adjustment is premature.
2.Inner hole exit diameter before exit radius 4 0.165 mm 0.173 mm, all holes
We believe the Northstar stl method finds a surface that is too small because the metal-air gradient is poorly resolved. Optical microscopy measurements comparable to 2 are greater than 175, and easily 5 um higher than the stl boundary at 2. 173 um is reasonable accounting for uncertainty in the microscopy
3.Inner hole inlet radius of curvature 0 mm 0.005 mm, all holes
The Northstar data is unresolved for this, and cannot be used. ESRF data still shows some radius. Measurements of ESRF data show even 0.010 mm radius, but we estimate low at 0.005 mm because ESRF data also may suffer from noise. More hole by hole analysis is needed.
4.Inner hole exit radius of curvature 0 mm 0.005 mm, all holes Same comments above.
5.Inner hole length 0.160 - 0.180 mm no change No conclusive data. Complicated because one value does not work for both sides of hole.
6.Inner hole drill angle relative to injector axis 37.0 degrees 37.0 degrees
Analysis of Northstar .stl shows 2 degrees variation from specification, but fit is made over only very short hole length. Need more confidence in the stl shape to go further.
7.Outer hole inlet diameter after inlet radius 9 0.388 mm 0.388 mm Fair agreement in stl and optical microscopy. No change is warranted. 8.Outer hole exit diameter before exit radius 10 0.388 mm 0.388 mm
measurements show a only a very slight taper, 4 um over 0.3 mm, so change likely not important.
9.Outer hole inlet reverse radius of curvature 0.040 mm estimate 0.080 mm
Just put a circle on slide 8 on both sides of the hole and calculated its size. Double the specification. A needed change.
10.Outer hole exit radius of curvature 0 mm 0 mm Edge looks sharp in ESRF and Northstar tomography. No change. 11.Outer hole length 0.460 - 0.480 mm no change Not analyzed
ECN 4: Spray G - Internal Geometry and Flow 12 5-6 September 2015
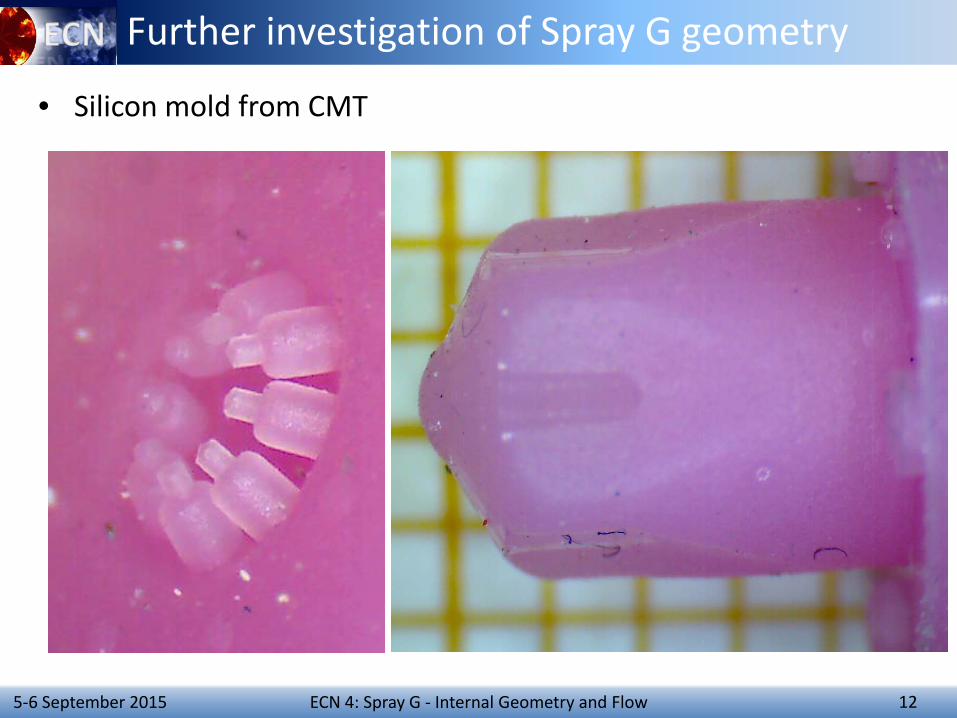
Further investigation of Spray G geometry
• Silicon mold from CMT
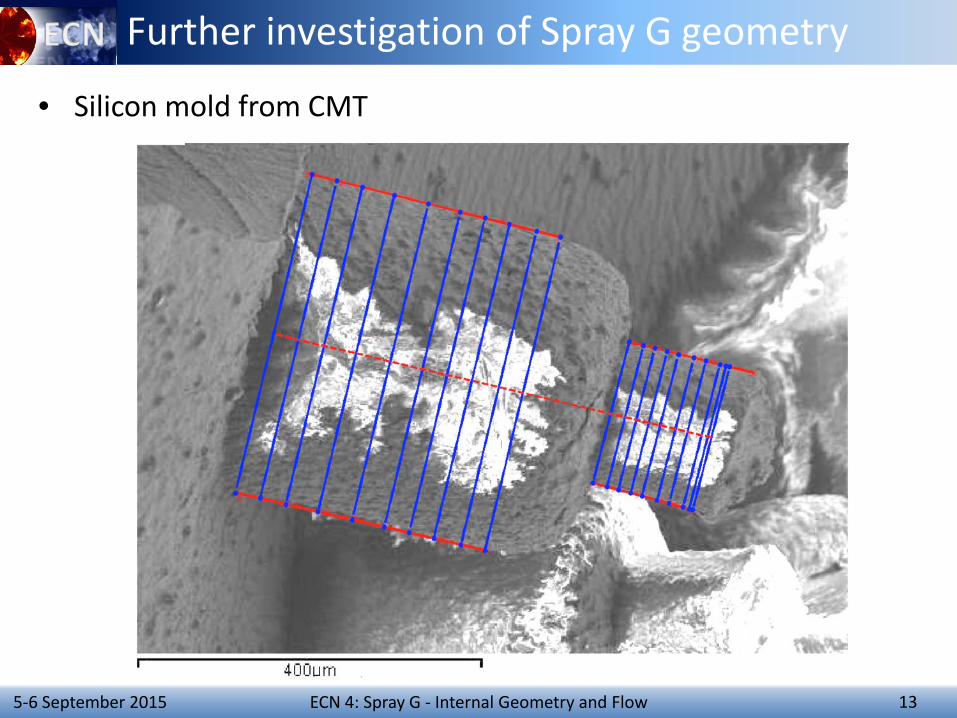
ECN 4: Spray G - Internal Geometry and Flow 13 5-6 September 2015
Further investigation of Spray G geometry
• Silicon mold from CMT
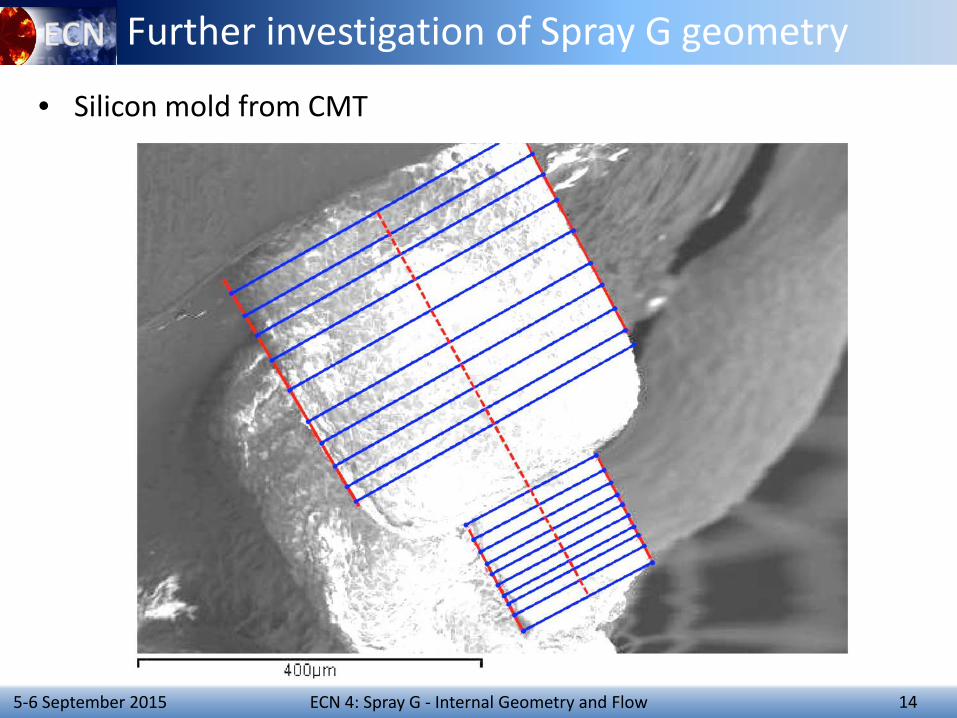
ECN 4: Spray G - Internal Geometry and Flow 14 5-6 September 2015
Further investigation of Spray G geometry
• Silicon mold from CMT
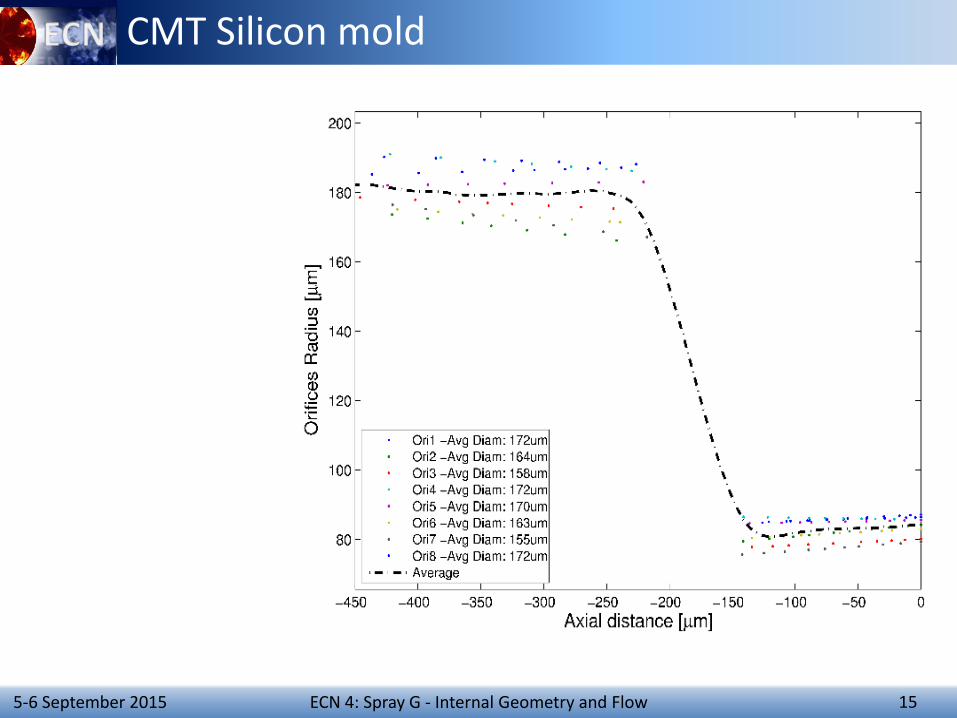
15 ECN 4: Spray G - Internal Geometry and Flow 5-6 September 2015
CMT Silicon mold
ECN 4: Spray G - Internal Geometry and Flow 16 5-6 September 2015
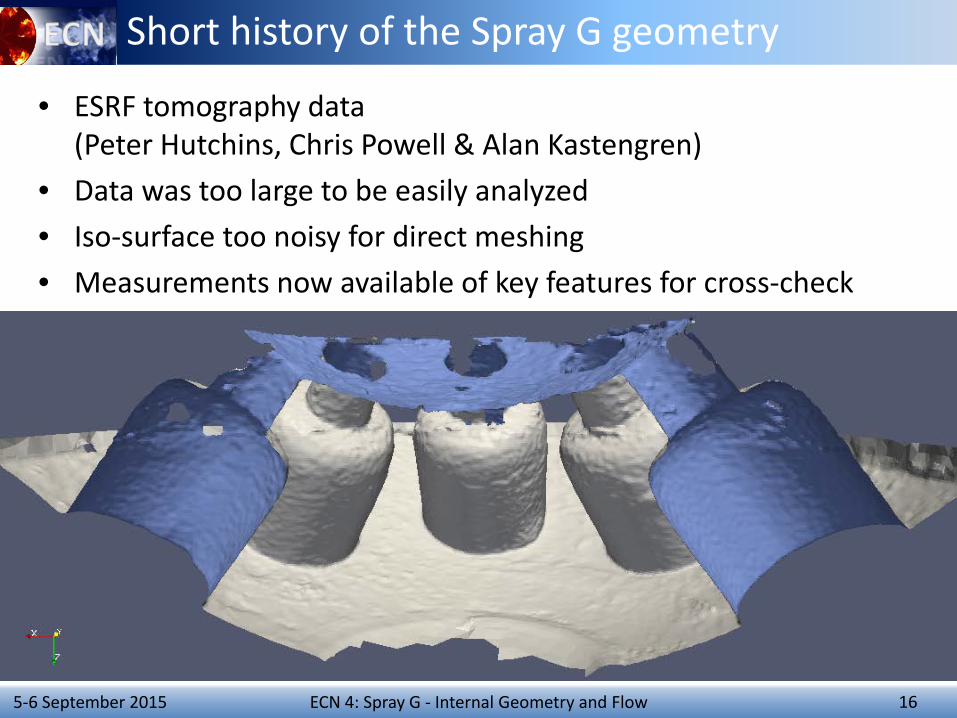
Short history of the Spray G geometry
• ESRF tomography data (Peter Hutchins, Chris Powell & Alan Kastengren)
• Data was too large to be easily analyzed • Iso-surface too noisy for direct meshing • Measurements now available of key features for cross-check
ECN 4: Spray G - Internal Geometry and Flow 17 5-6 September 2015
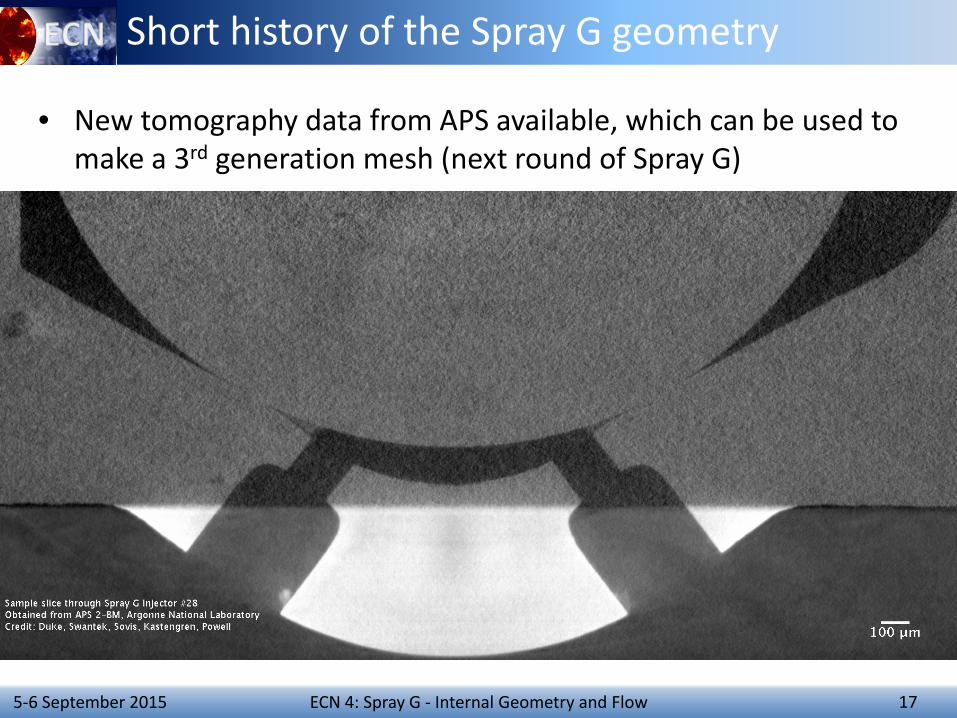
Short history of the Spray G geometry
• New tomography data from APS available, which can be used to make a 3rd generation mesh (next round of Spray G)
18 ECN 4: Spray G - Internal Geometry and Flow 5-6 September 2015
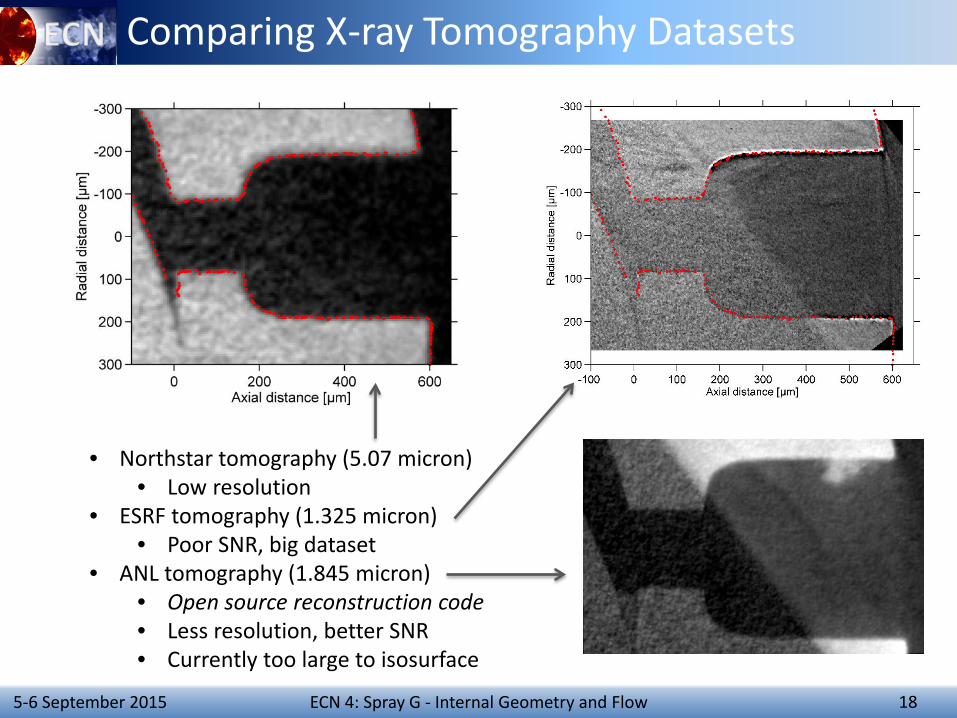
Comparing X-ray Tomography Datasets
• Northstar tomography (5.07 micron) • Low resolution
• ESRF tomography (1.325 micron) • Poor SNR, big dataset
• ANL tomography (1.845 micron) • Open source reconstruction code • Less resolution, better SNR • Currently too large to isosurface
19 ECN 4: Spray G - Internal Geometry and Flow 5-6 September 2015
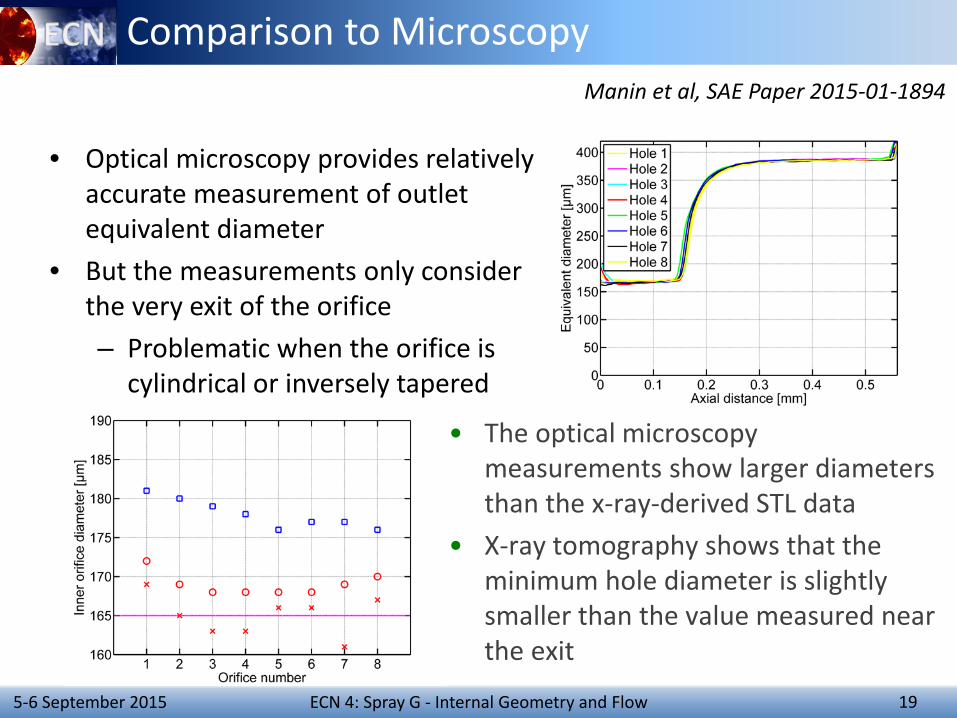
Comparison to Microscopy
• Optical microscopy provides relatively accurate measurement of outlet equivalent diameter
• But the measurements only consider the very exit of the orifice – Problematic when the orifice is
cylindrical or inversely tapered
• The optical microscopy measurements show larger diameters than the x-ray-derived STL data
• X-ray tomography shows that the minimum hole diameter is slightly smaller than the value measured near the exit
Manin et al, SAE Paper 2015-01-1894
20 ECN 4: Spray G - Internal Geometry and Flow 5-6 September 2015
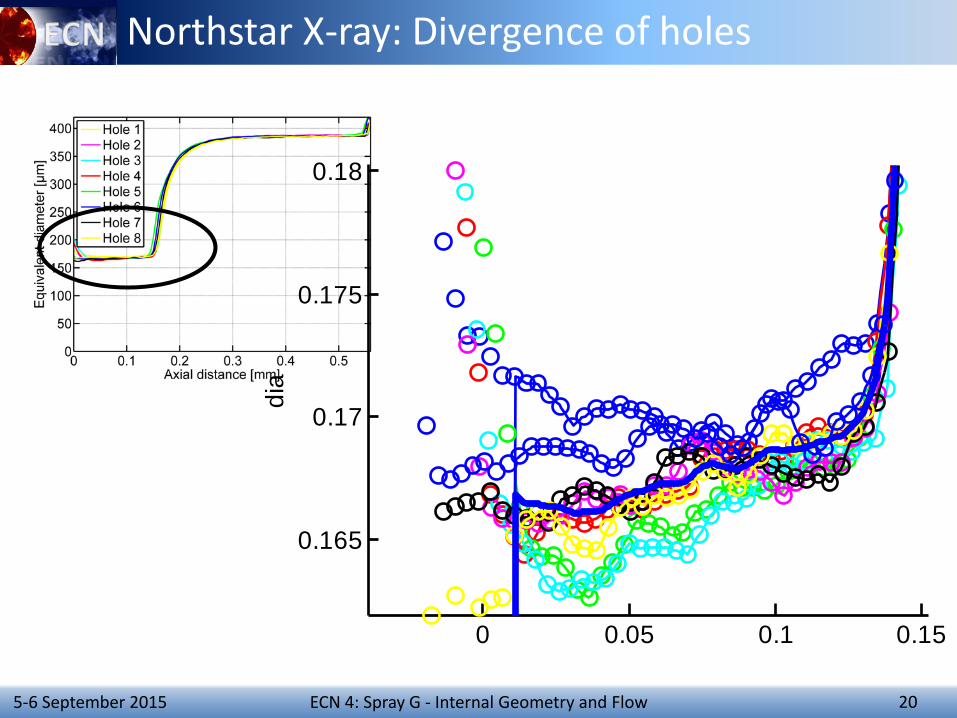
Northstar X-ray: Divergence of holes
0 0.05 0.1 0.15
0.165
0.17
0.175
0.18
dia
ECN 4: Spray G - Internal Geometry and Flow 21 5-6 September 2015
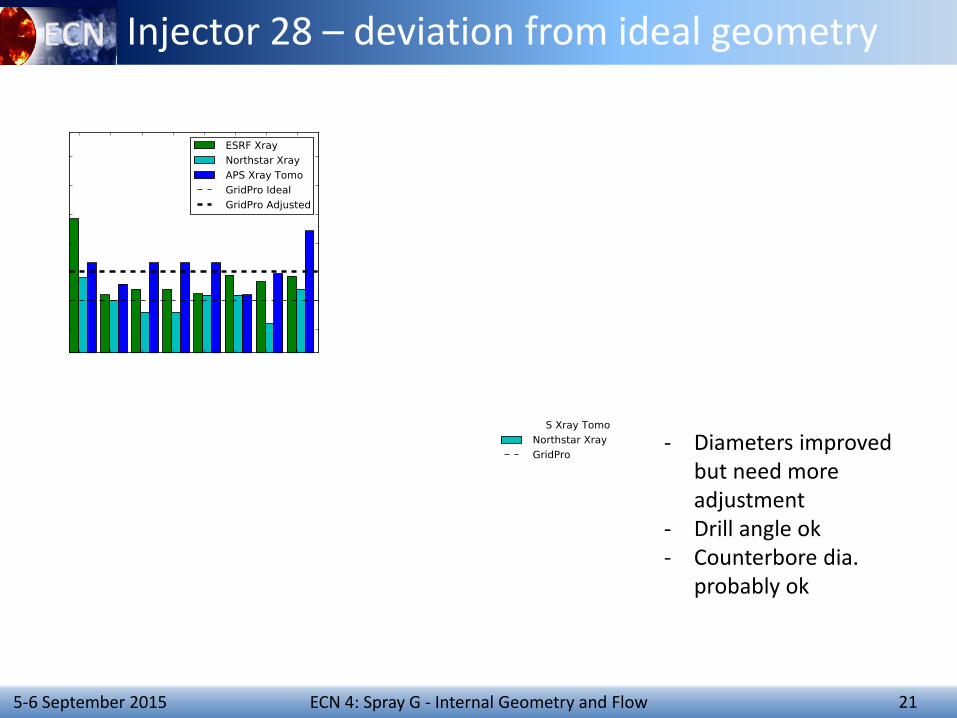
Injector 28 – deviation from ideal geometry
- Diameters improved but need more adjustment
- Drill angle ok - Counterbore dia.
probably ok
ECN 4: Spray G - Internal Geometry and Flow 22 5-6 September 2015
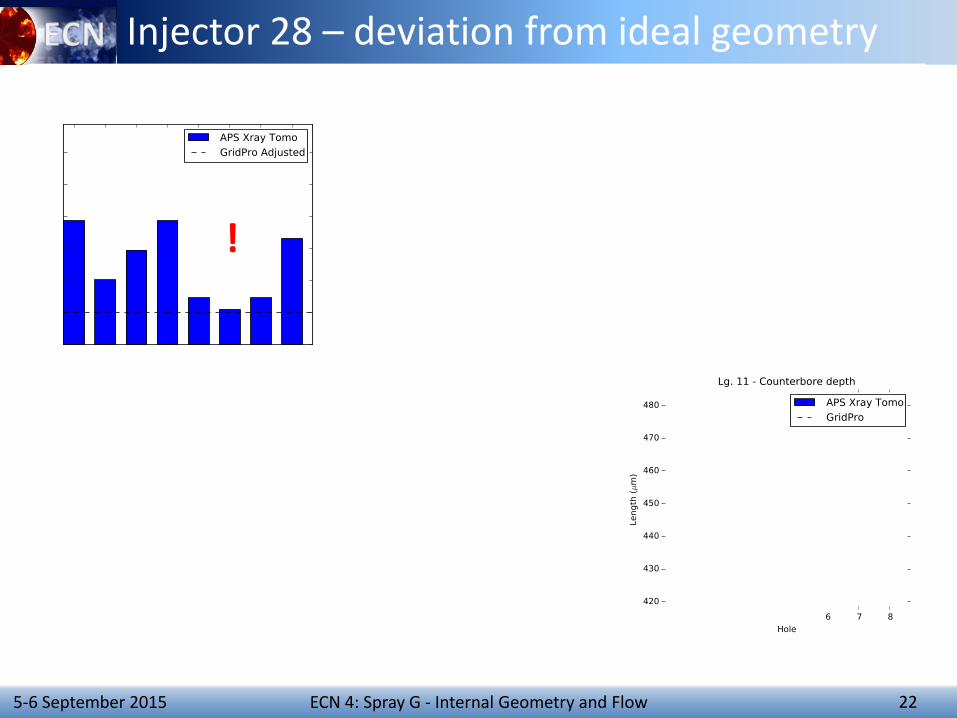
Injector 28 – deviation from ideal geometry
!
ECN 4: Spray G - Internal Geometry and Flow 23 5-6 September 2015
Geometry – conclusions / discussion points
• Hole diameters vary by 11 um (6%) – Correlated with plume mass variation (discussed next)
• Hole entrance radius of curvature varies from 6-17 um
– May have strong effect on cavitation in the hole at low ambient pressure conditions
• Holes are slightly divergent
• Need for new geometry with hole to hole variations included – Need to separate effect of geometry and flow physics in deviations between
models, and experiments – Can we capture the hole to hole variation with geometric variation alone?
• ANL/APS tomography data of #28 is recommended reference • Practical route – gen. 3 mesh informed by individual hole dimensions • Next year – full STL from the x-ray tomography data (gen 4?)
ECN 4: Spray G - Internal Geometry and Flow 24 5-6 September 2015
Outline
• Nozzle Geometry – X-ray tomography – Microscopy – Meshes used for simulation contributions – Deviation of actual injector geometry from ideal
• Internal & near nozzle experiments – Rate of injection & rate of momentum – Patternation – Near tip microscopic imaging – X-ray radiography
• Internal flow modeling contributions
ECN 4: Spray G - Internal Geometry and Flow 25 5-6 September 2015
Near-nozzle experiments
• Results will be presented in a comparative order, rather than individually
• Methodologies will be discussed as each experiment is introduced
26 ECN 4: Spray G - Internal Geometry and Flow 5-6 September 2015
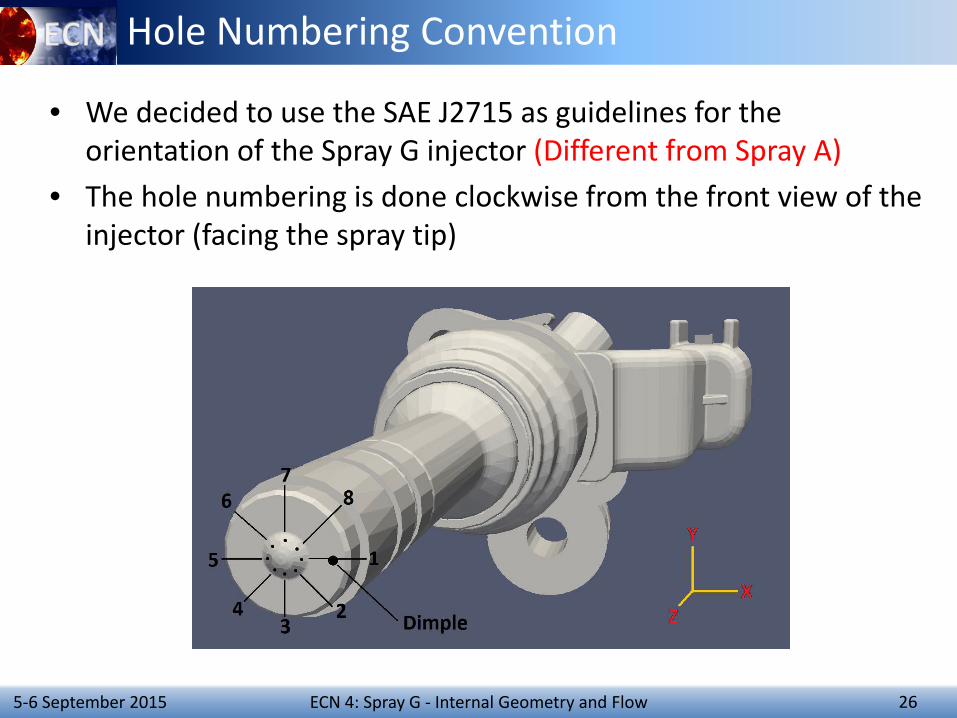
Hole Numbering Convention
• We decided to use the SAE J2715 as guidelines for the orientation of the Spray G injector (Different from Spray A)
• The hole numbering is done clockwise from the front view of the injector (facing the spray tip)
27 ECN 4: Spray G - Internal Geometry and Flow 5-6 September 2015
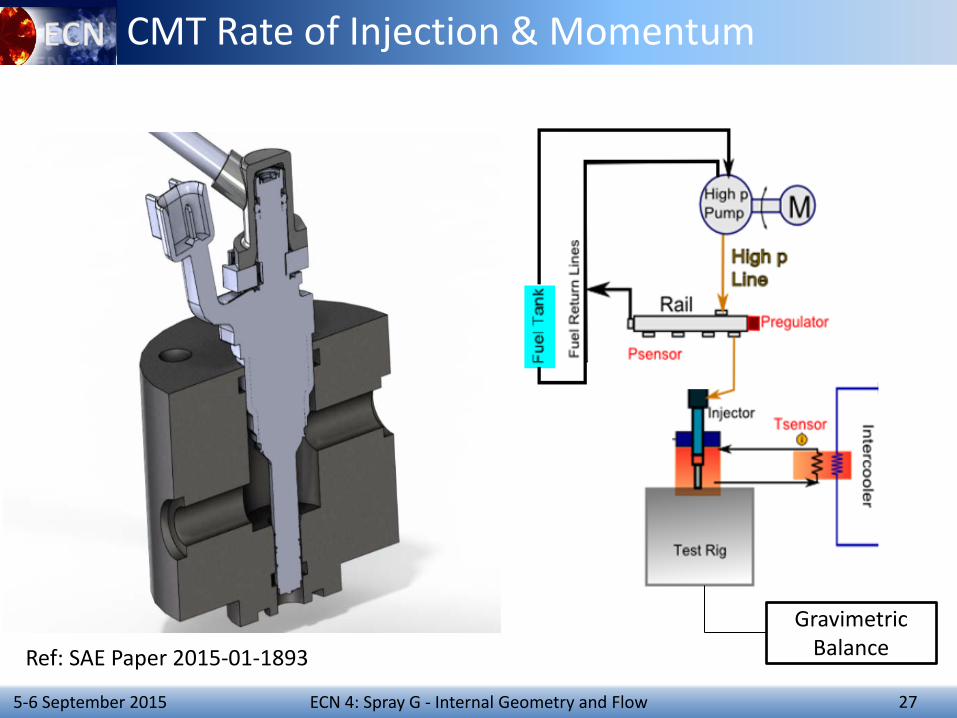
CMT Rate of Injection & Momentum
Gravimetric Balance Ref: SAE Paper 2015-01-1893
28 ECN 4: Spray G - Internal Geometry and Flow 5-6 September 2015
CMT Rate of Injection & Momentum
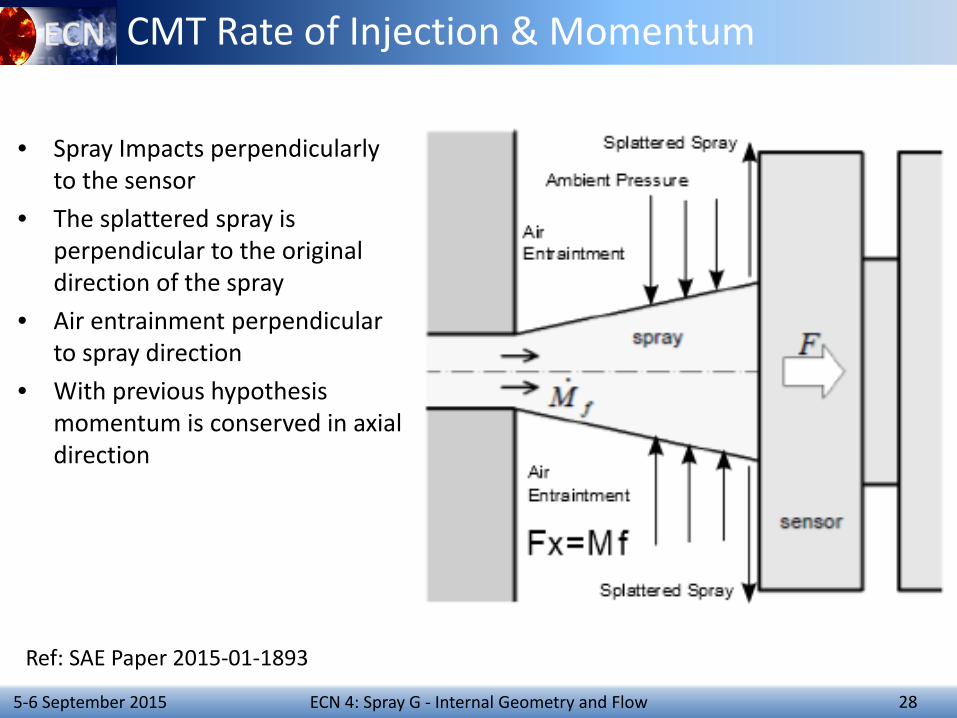
• Spray Impacts perpendicularly to the sensor
• The splattered spray is perpendicular to the original direction of the spray
• Air entrainment perpendicular to spray direction
• With previous hypothesis momentum is conserved in axial direction
Ref: SAE Paper 2015-01-1893
29 ECN 4: Spray G - Internal Geometry and Flow 5-6 September 2015
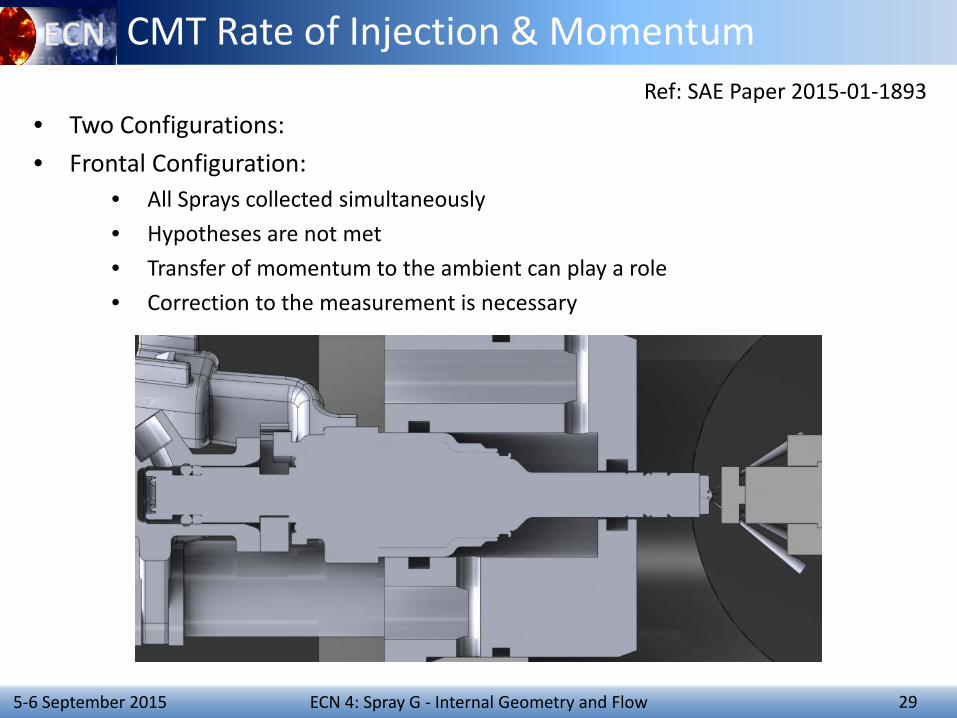
CMT Rate of Injection & Momentum
• Two Configurations: • Frontal Configuration:
• All Sprays collected simultaneously • Hypotheses are not met • Transfer of momentum to the ambient can play a role • Correction to the measurement is necessary
Ref: SAE Paper 2015-01-1893
30 ECN 4: Spray G - Internal Geometry and Flow 5-6 September 2015
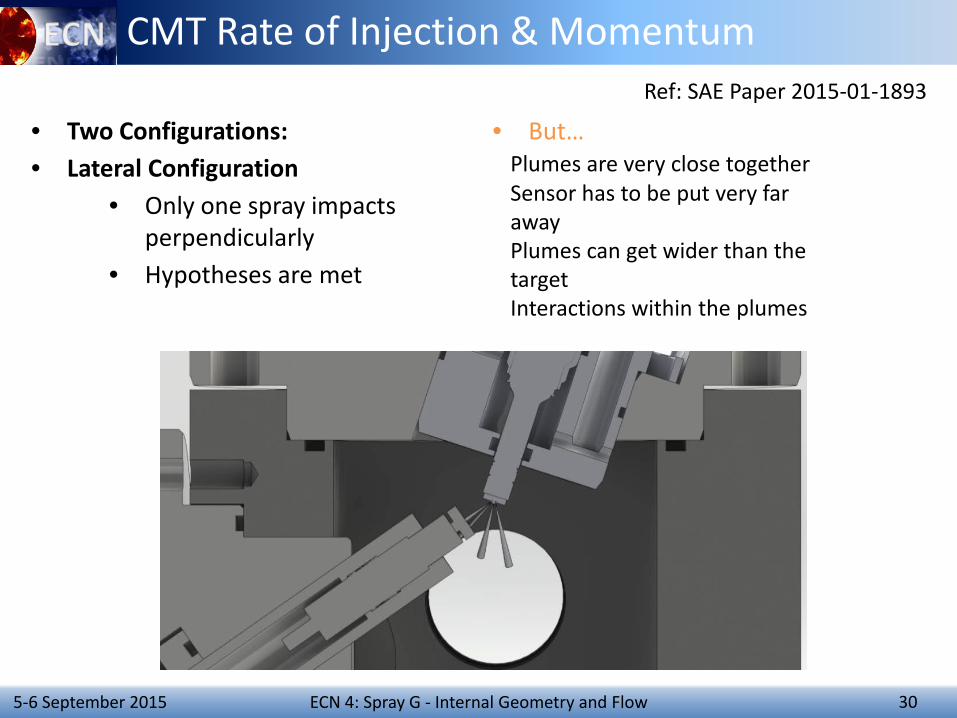
CMT Rate of Injection & Momentum
• Two Configurations: • Lateral Configuration
• Only one spray impacts perpendicularly
• Hypotheses are met
• But… Plumes are very close together Sensor has to be put very far away Plumes can get wider than the target Interactions within the plumes
Ref: SAE Paper 2015-01-1893
31 ECN 4: Spray G - Internal Geometry and Flow 5-6 September 2015
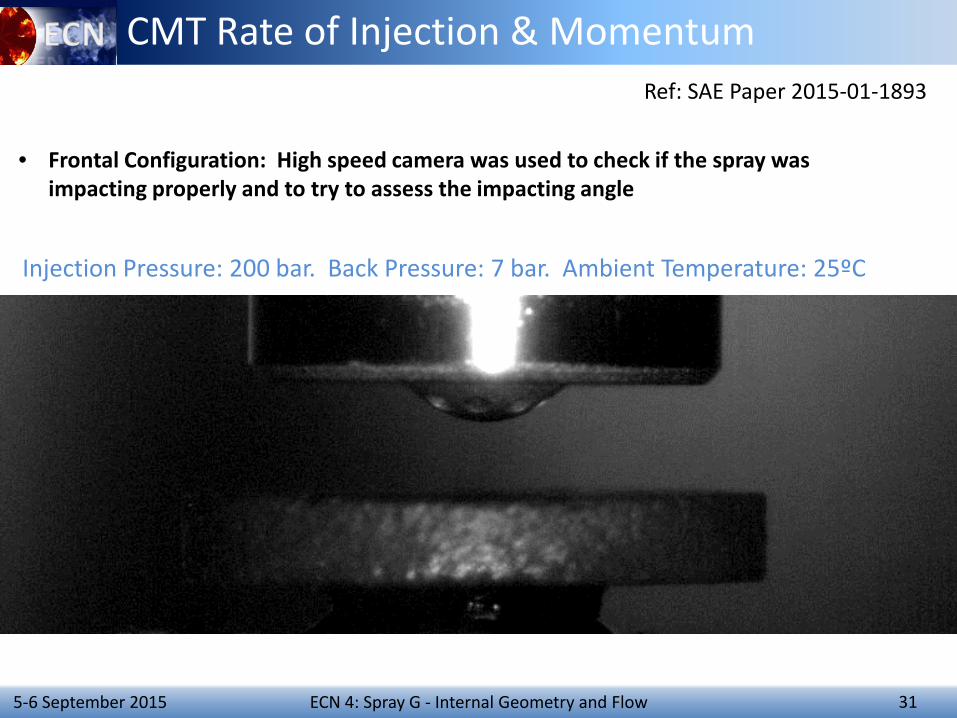
CMT Rate of Injection & Momentum
• Frontal Configuration: High speed camera was used to check if the spray was impacting properly and to try to assess the impacting angle
Injection Pressure: 200 bar. Back Pressure: 7 bar. Ambient Temperature: 25ºC
Ref: SAE Paper 2015-01-1893
32 ECN 4: Spray G - Internal Geometry and Flow 5-6 September 2015
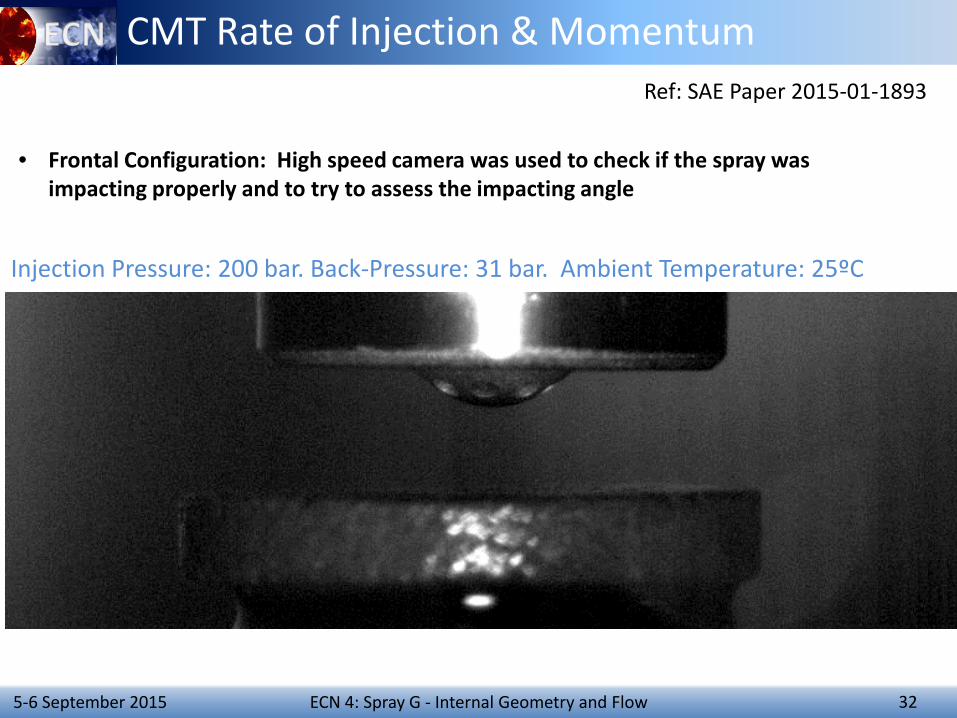
CMT Rate of Injection & Momentum
• Frontal Configuration: High speed camera was used to check if the spray was impacting properly and to try to assess the impacting angle
Injection Pressure: 200 bar. Back-Pressure: 31 bar. Ambient Temperature: 25ºC
Ref: SAE Paper 2015-01-1893
33 ECN 4: Spray G - Internal Geometry and Flow 5-6 September 2015
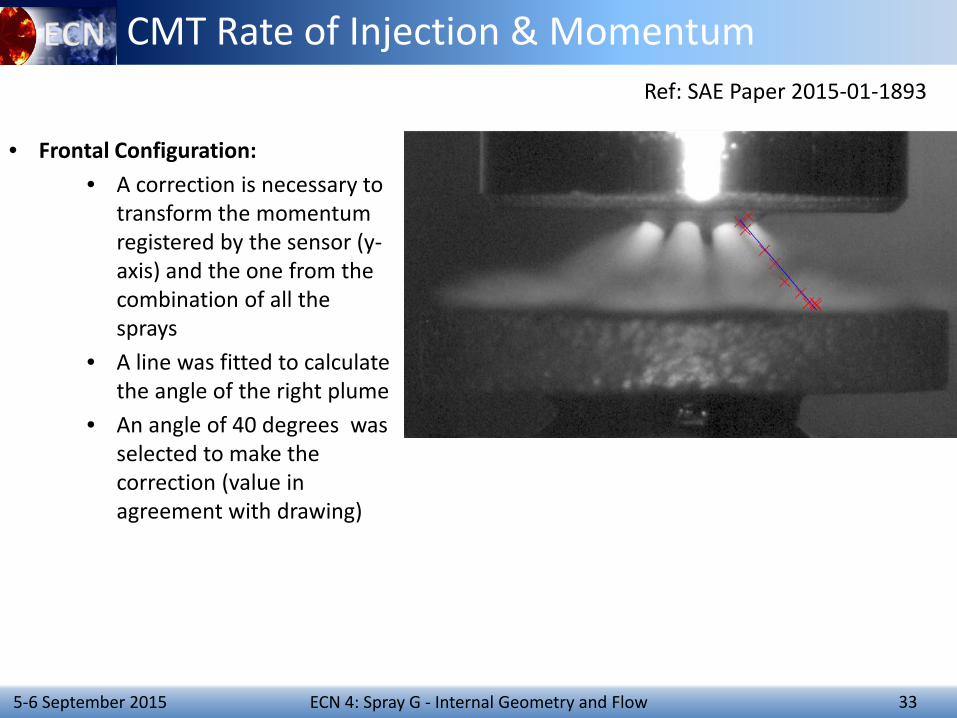
CMT Rate of Injection & Momentum
• Frontal Configuration: • A correction is necessary to
transform the momentum registered by the sensor (y-axis) and the one from the combination of all the sprays
• A line was fitted to calculate the angle of the right plume
• An angle of 40 degrees was selected to make the correction (value in agreement with drawing)
Ref: SAE Paper 2015-01-1893
34 ECN 4: Spray G - Internal Geometry and Flow 5-6 September 2015
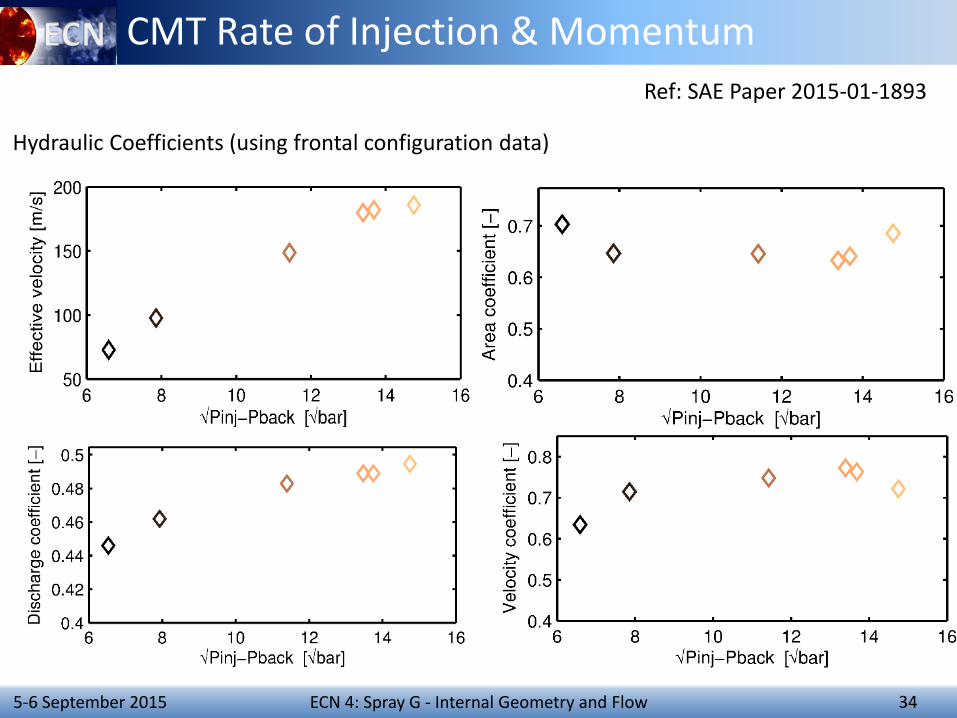
CMT Rate of Injection & Momentum
Hydraulic Coefficients (using frontal configuration data)
Ref: SAE Paper 2015-01-1893
ECN 4: Spray G - Internal Geometry and Flow 35 5-6 September 2015
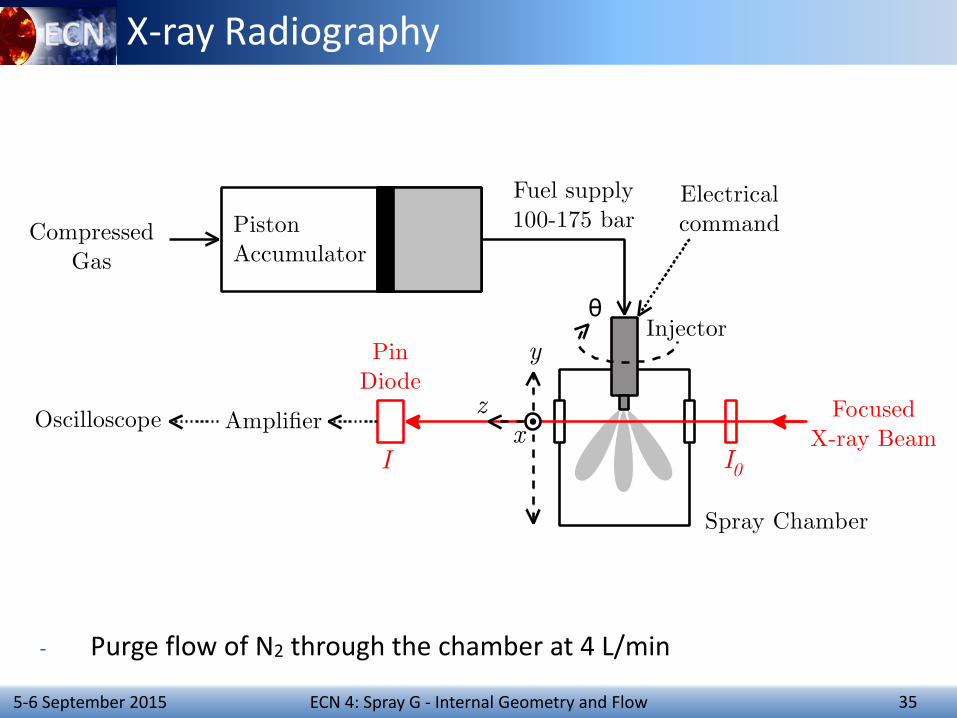
X-ray Radiography
- Purge flow of N2 through the chamber at 4 L/min
ECN 4: Spray G - Internal Geometry and Flow 36 5-6 September 2015
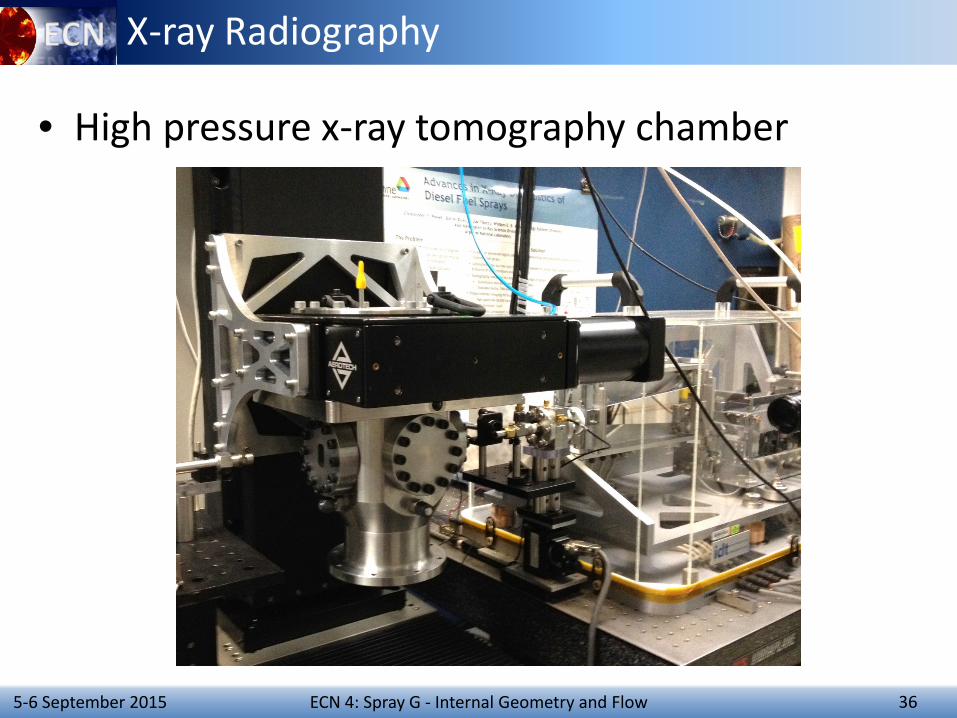
X-ray Radiography
• High pressure x-ray tomography chamber
37 ECN 4: Spray G - Internal Geometry and Flow 5-6 September 2015
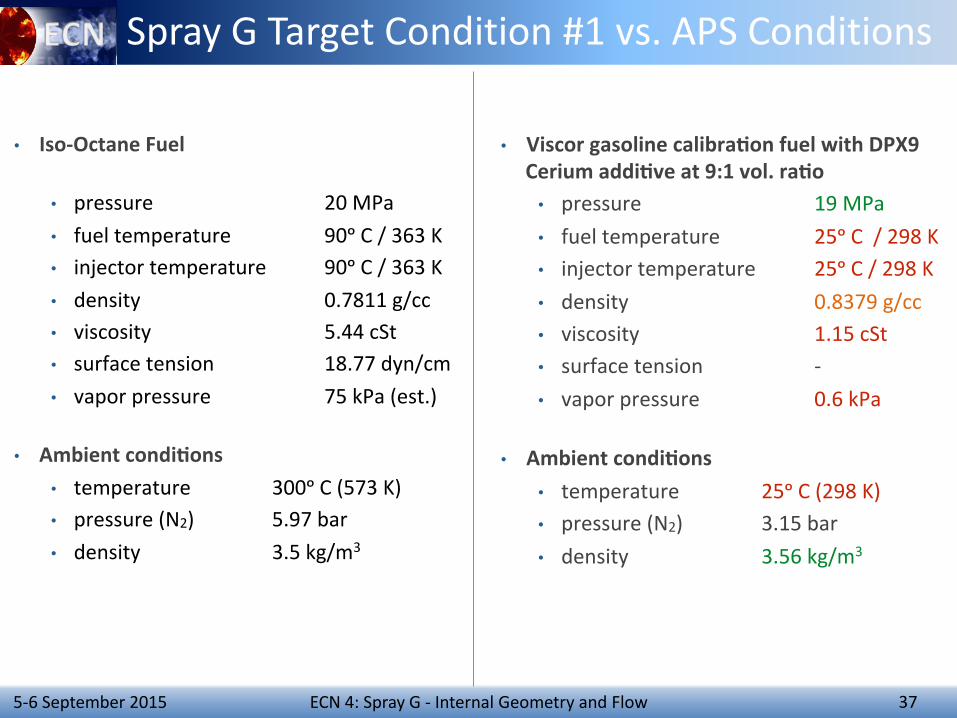
Spray G Target Condition #1 vs. APS Conditions
ECN 4: Spray G - Internal Geometry and Flow 38 5-6 September 2015
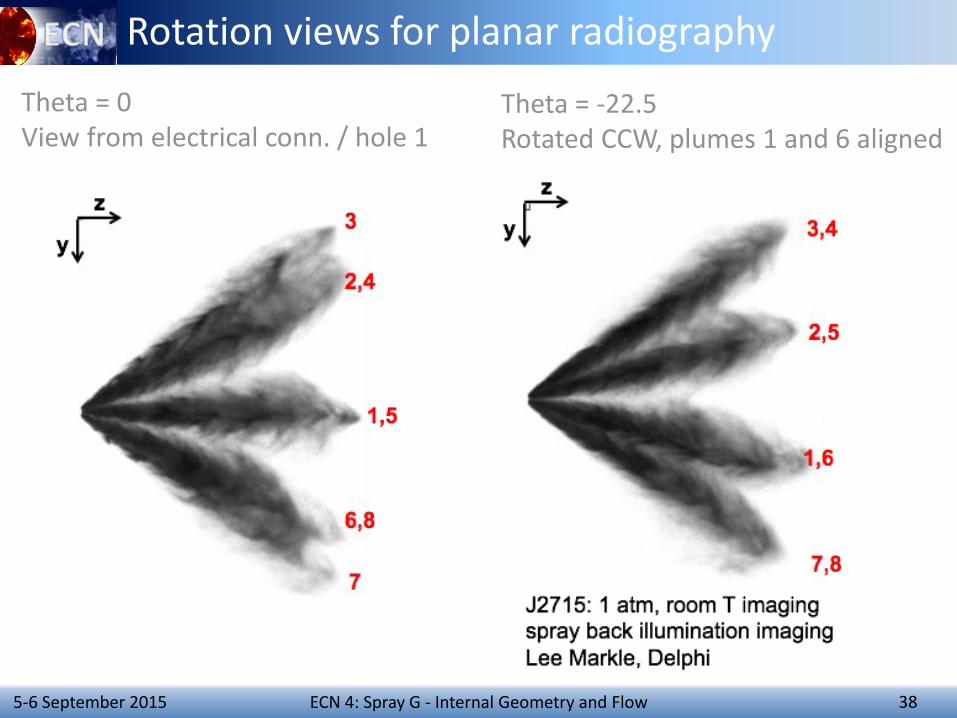
Rotation views for planar radiography Theta = 0 View from electrical conn. / hole 1
Theta = -22.5 Rotated CCW, plumes 1 and 6 aligned
39 ECN 4: Spray G - Internal Geometry and Flow 5-6 September 2015
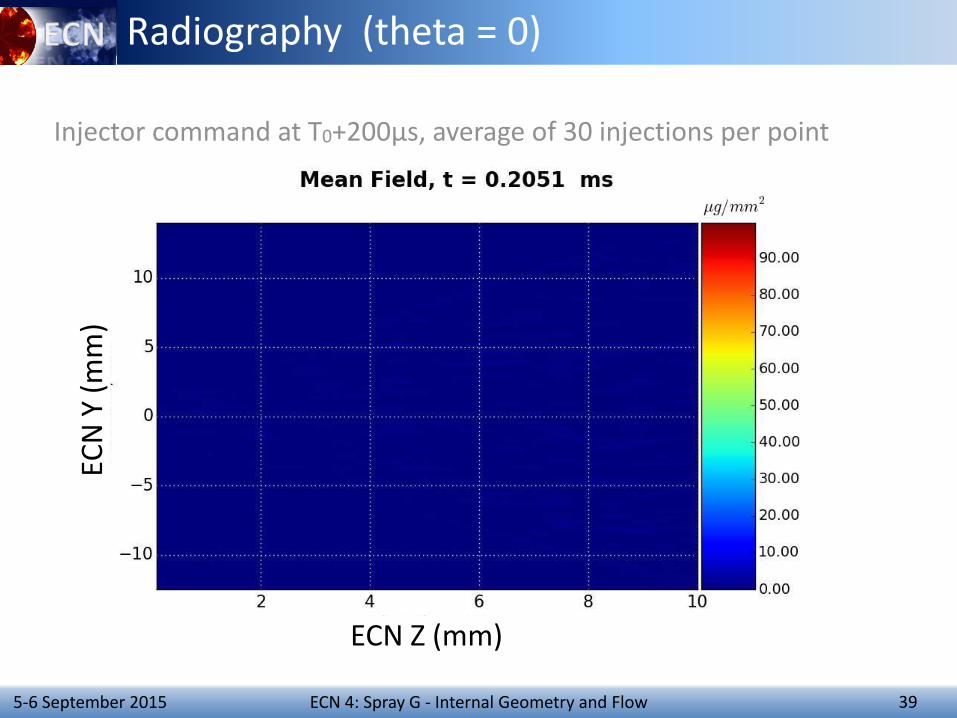
Injector command at T0+200µs, average of 30 injections per point
ECN Z (mm)
ECN
Y (m
m)
Radiography (theta = 0)
40 ECN 4: Spray G - Internal Geometry and Flow 5-6 September 2015
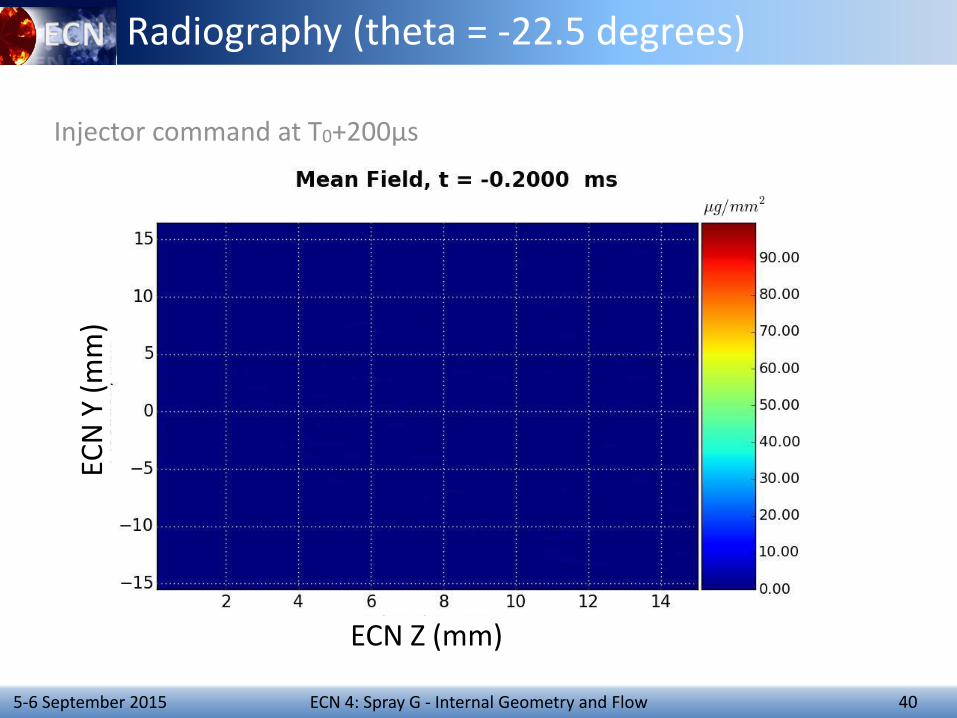
Injector command at T0+200µs
ECN Z (mm)
ECN
Y (m
m)
Radiography (theta = -22.5 degrees)
ECN 4: Spray G - Internal Geometry and Flow 41 5-6 September 2015
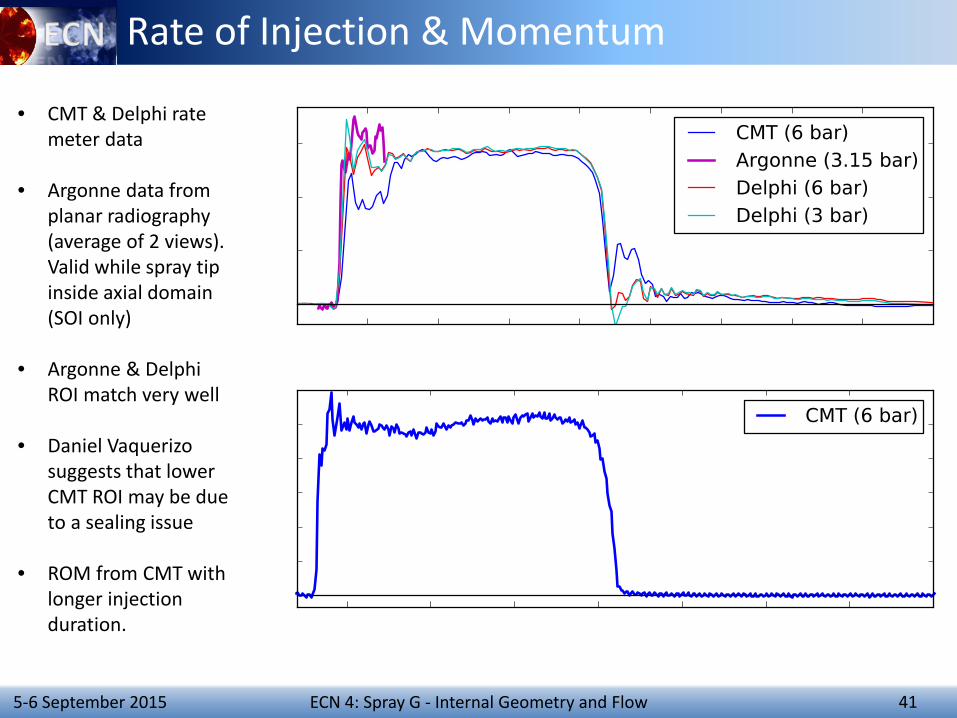
Rate of Injection & Momentum
• CMT & Delphi rate meter data
• Argonne data from planar radiography (average of 2 views). Valid while spray tip inside axial domain (SOI only)
• Argonne & Delphi ROI match very well
• Daniel Vaquerizo suggests that lower CMT ROI may be due to a sealing issue
• ROM from CMT with longer injection duration.
42
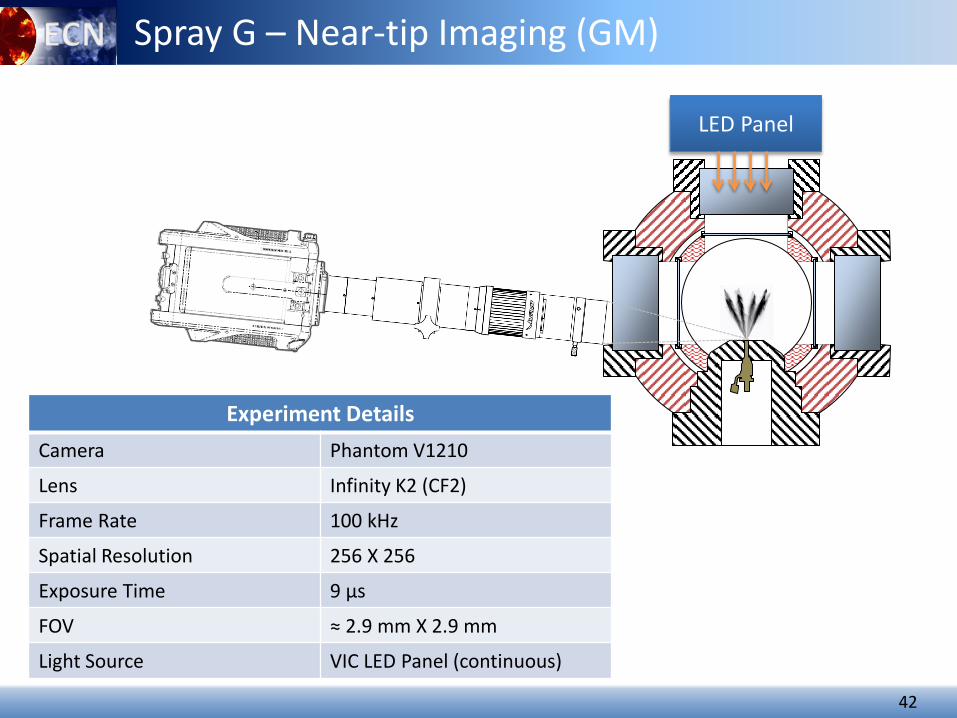
Spray G – Near-tip Imaging (GM)
Experiment Details Camera Phantom V1210
Lens Infinity K2 (CF2)
Frame Rate 100 kHz
Spatial Resolution 256 X 256
Exposure Time 9 μs
FOV ≈ 2.9 mm X 2.9 mm
Light Source VIC LED Panel (continuous)
LED Panel
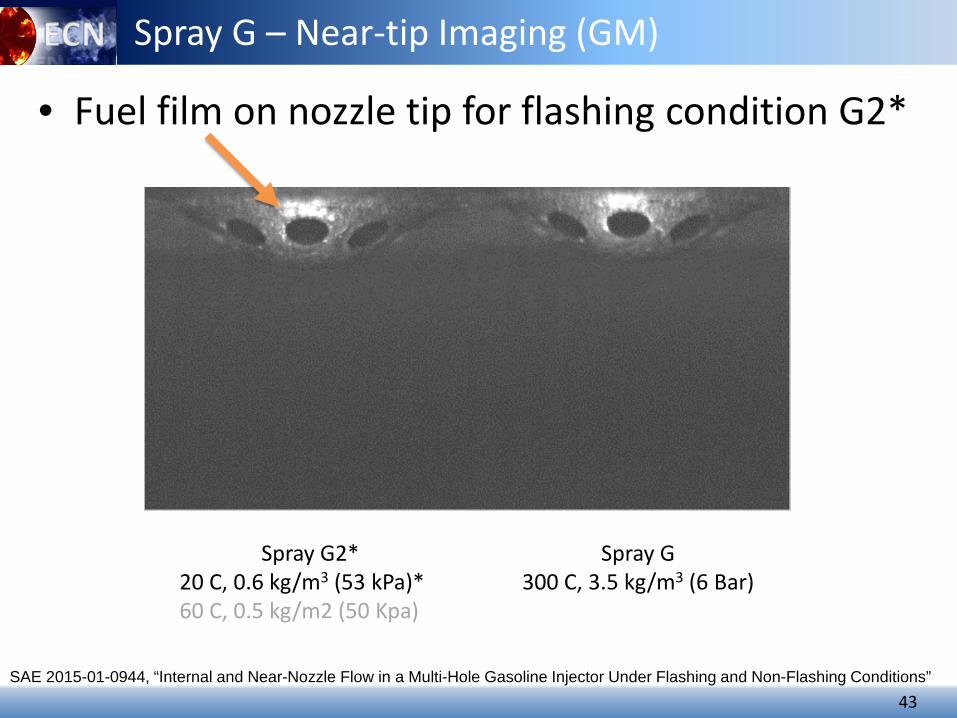
43
Spray G 300 C, 3.5 kg/m3 (6 Bar)
Spray G2* 20 C, 0.6 kg/m3 (53 kPa)* 60 C, 0.5 kg/m2 (50 Kpa)
Spray G – Near-tip Imaging (GM)
SAE 2015-01-0944, “Internal and Near-Nozzle Flow in a Multi-Hole Gasoline Injector Under Flashing and Non-Flashing Conditions”
• Fuel film on nozzle tip for flashing condition G2*
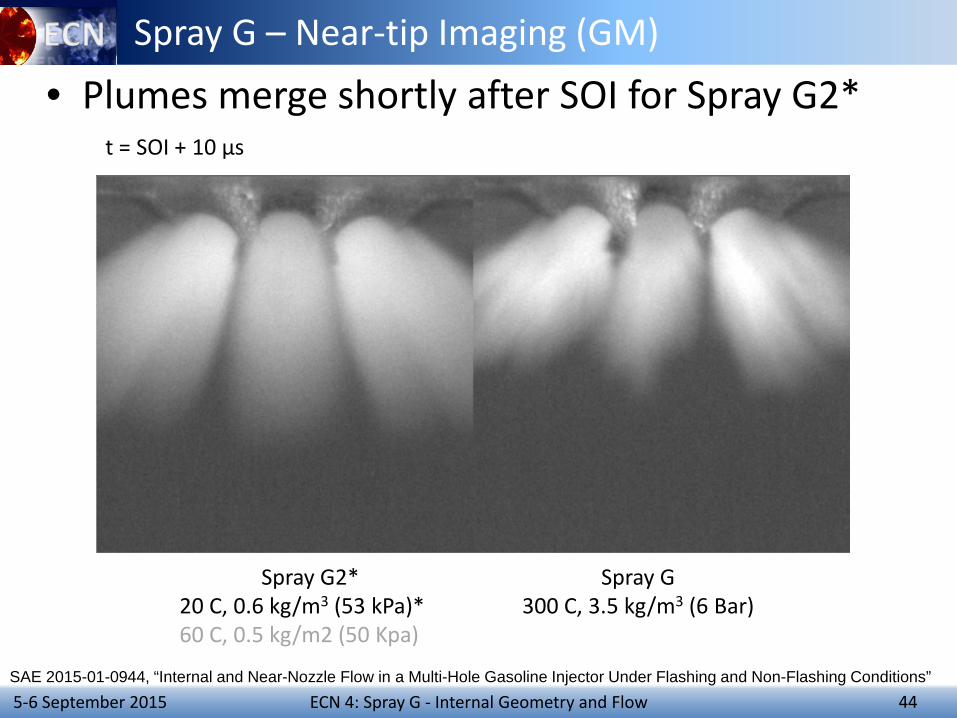
ECN 4: Spray G - Internal Geometry and Flow 44 5-6 September 2015
Spray G – Near-tip Imaging (GM)
SAE 2015-01-0944, “Internal and Near-Nozzle Flow in a Multi-Hole Gasoline Injector Under Flashing and Non-Flashing Conditions”
• Plumes merge shortly after SOI for Spray G2* t = SOI + 10 µs
Spray G 300 C, 3.5 kg/m3 (6 Bar)
Spray G2* 20 C, 0.6 kg/m3 (53 kPa)* 60 C, 0.5 kg/m2 (50 Kpa)
ECN 4: Spray G - Internal Geometry and Flow 45 5-6 September 2015
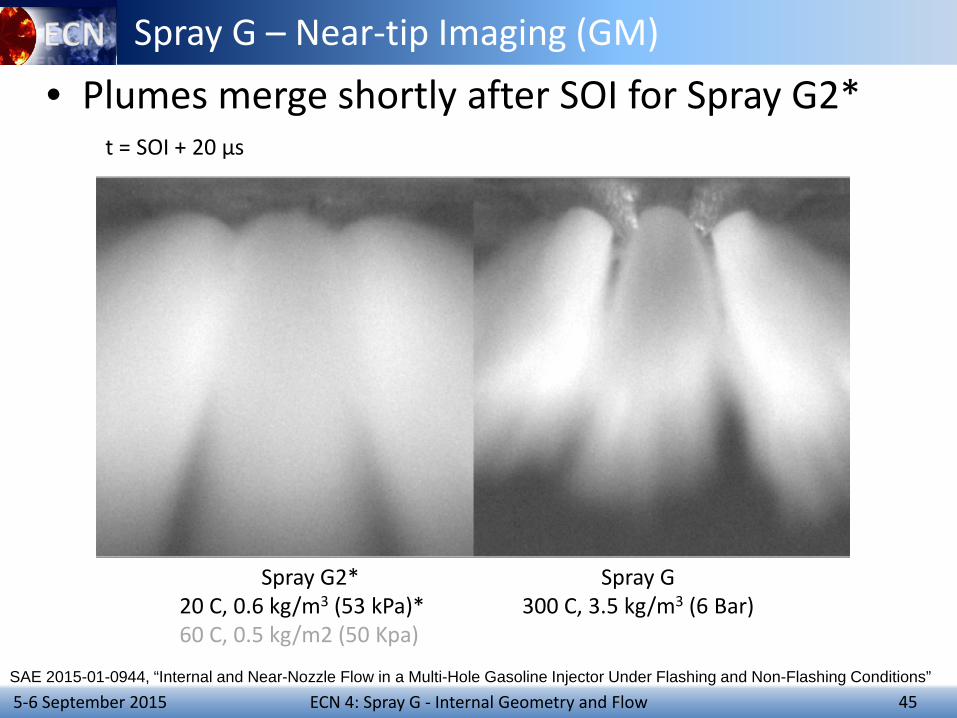
Spray G – Near-tip Imaging (GM)
SAE 2015-01-0944, “Internal and Near-Nozzle Flow in a Multi-Hole Gasoline Injector Under Flashing and Non-Flashing Conditions”
• Plumes merge shortly after SOI for Spray G2* t = SOI + 20 µs
Spray G 300 C, 3.5 kg/m3 (6 Bar)
Spray G2* 20 C, 0.6 kg/m3 (53 kPa)* 60 C, 0.5 kg/m2 (50 Kpa)
46 ECN 4: Spray G - Internal Geometry and Flow 5-6 September 2015
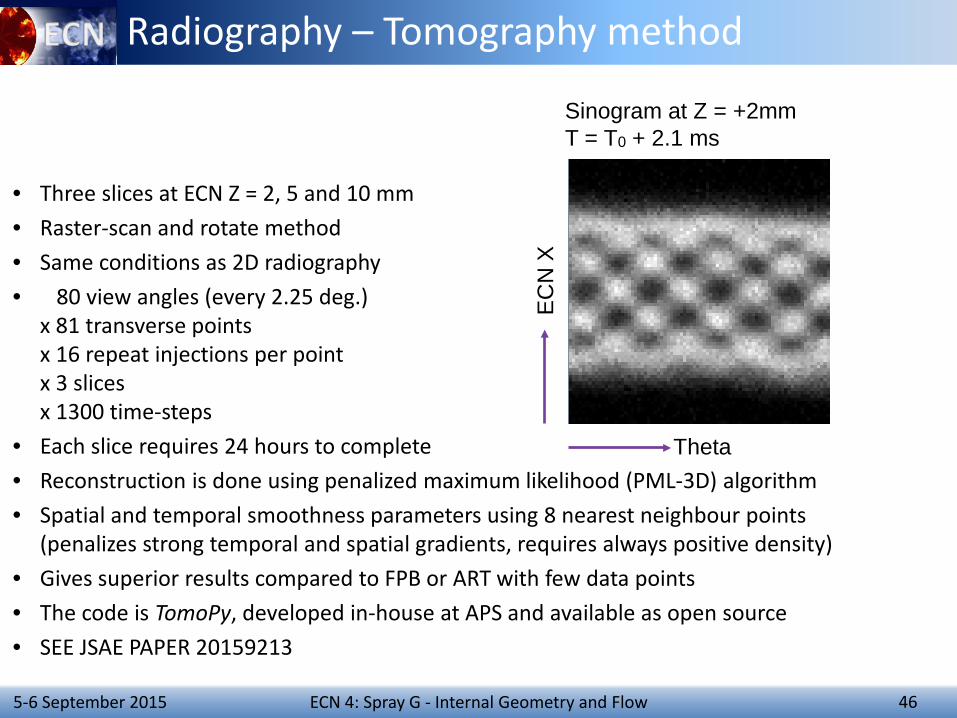
• Three slices at ECN Z = 2, 5 and 10 mm • Raster-scan and rotate method • Same conditions as 2D radiography • 80 view angles (every 2.25 deg.)
x 81 transverse points x 16 repeat injections per point x 3 slices x 1300 time-steps
• Each slice requires 24 hours to complete • Reconstruction is done using penalized maximum likelihood (PML-3D) algorithm • Spatial and temporal smoothness parameters using 8 nearest neighbour points
(penalizes strong temporal and spatial gradients, requires always positive density) • Gives superior results compared to FPB or ART with few data points • The code is TomoPy, developed in-house at APS and available as open source • SEE JSAE PAPER 20159213
EC
N X
Theta
Sinogram at Z = +2mm T = T0 + 2.1 ms
Radiography – Tomography method
47 ECN 4: Spray G - Internal Geometry and Flow 5-6 September 2015
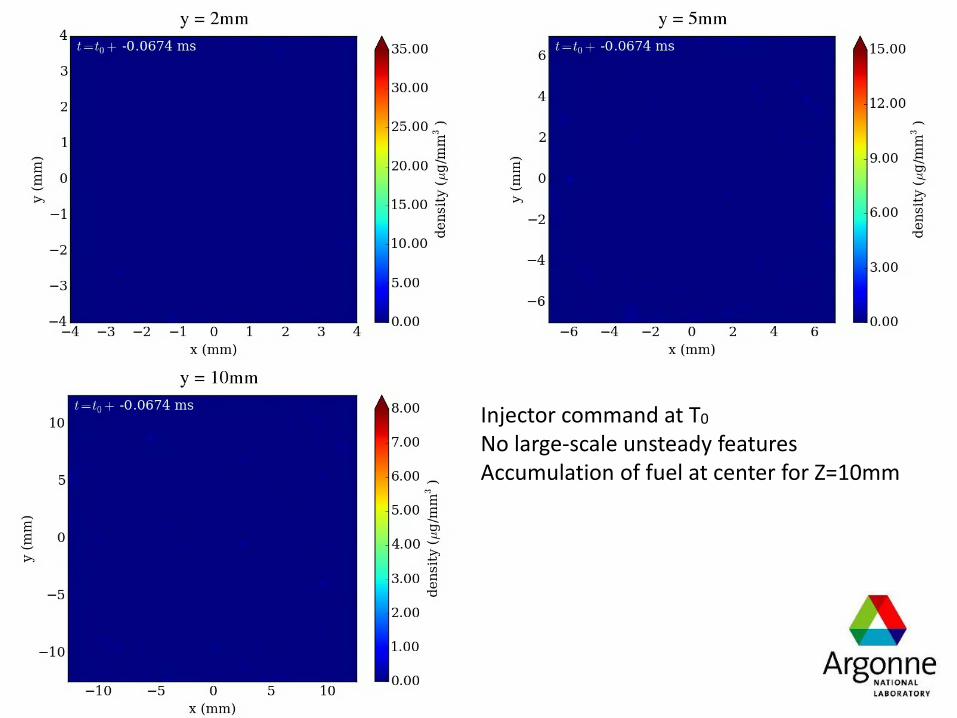
ECN 3.9
X-ray tomography slices Spray G 028
Injector command at T0 No large-scale unsteady features Accumulation of fuel at center for Z=10mm
48 ECN 4: Spray G - Internal Geometry and Flow 5-6 September 2015
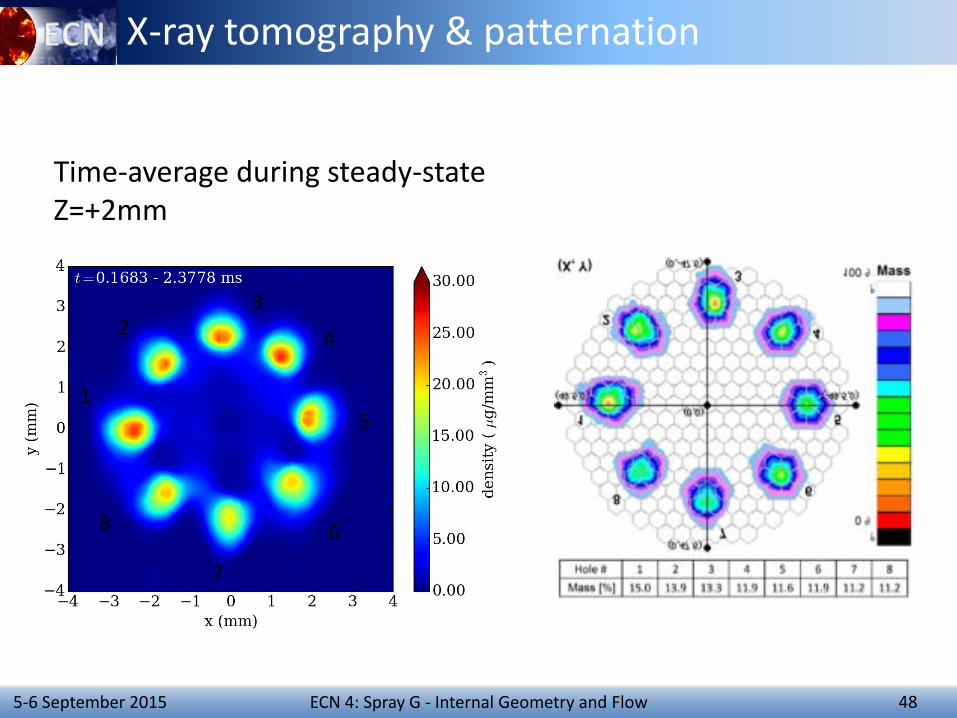
Time-average during steady-state Z=+2mm
1
2 3
4
5
6
7
8
X-ray tomography & patternation
49 ECN 4: Spray G - Internal Geometry and Flow 5-6 September 2015
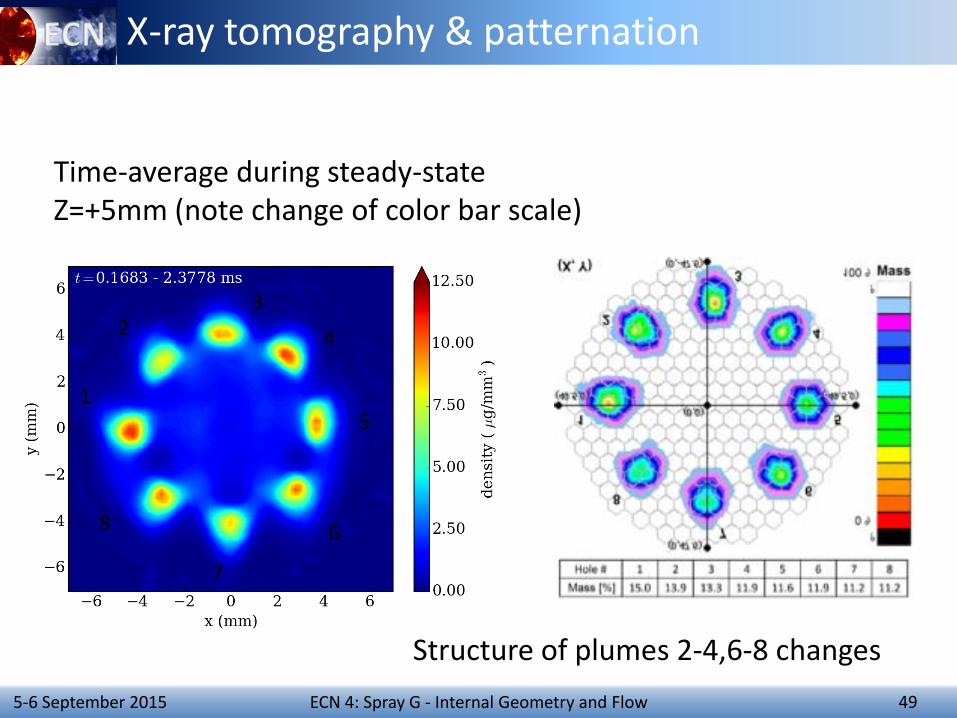
Time-average during steady-state Z=+5mm (note change of color bar scale)
1
2 3
4
5
6
7
8
Structure of plumes 2-4,6-8 changes
X-ray tomography & patternation
50 ECN 4: Spray G - Internal Geometry and Flow 5-6 September 2015 50
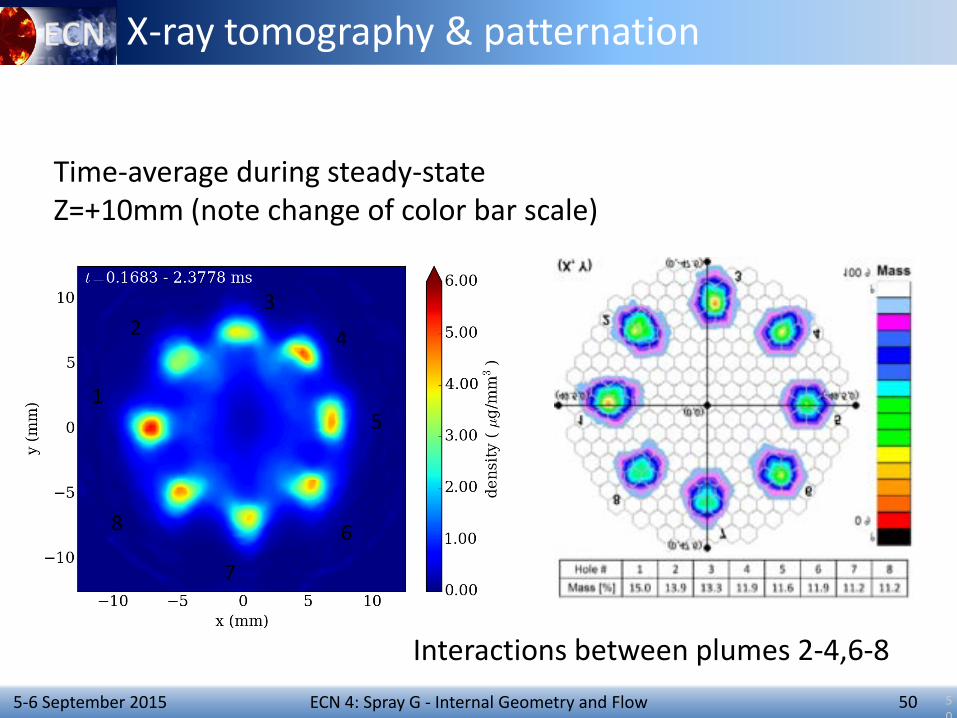
Time-average during steady-state Z=+10mm (note change of color bar scale)
1
2 3
4
5
6
7
8
Interactions between plumes 2-4,6-8
X-ray tomography & patternation
ECN 4: Spray G - Internal Geometry and Flow 51 5-6 September 2015
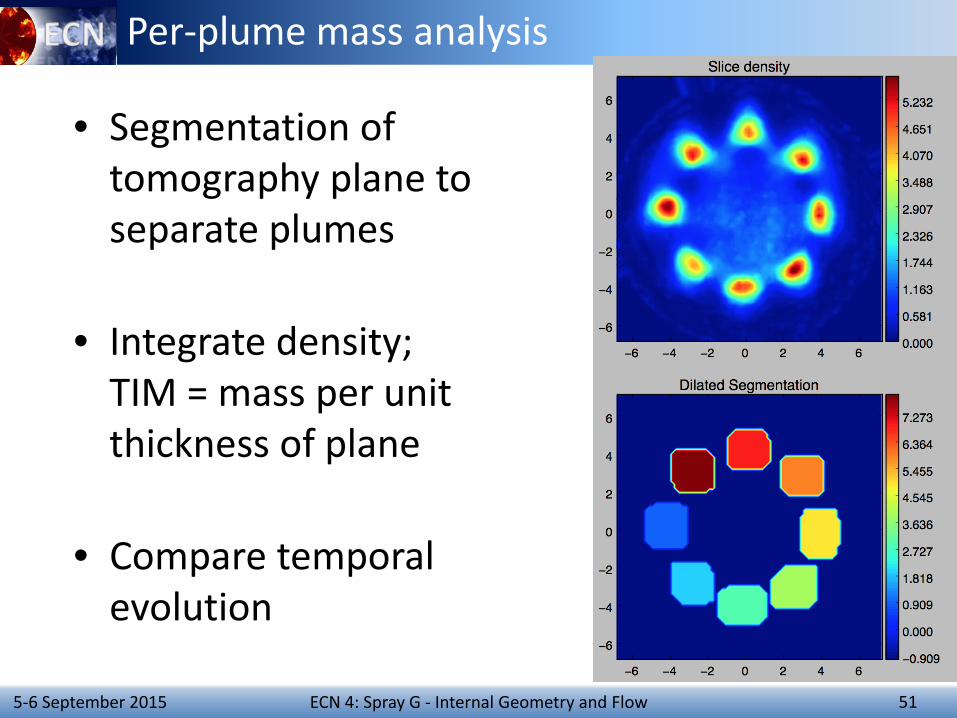
Per-plume mass analysis
• Segmentation of tomography plane to separate plumes
• Integrate density; TIM = mass per unit thickness of plane
• Compare temporal evolution
52 ECN 4: Spray G - Internal Geometry and Flow 5-6 September 2015
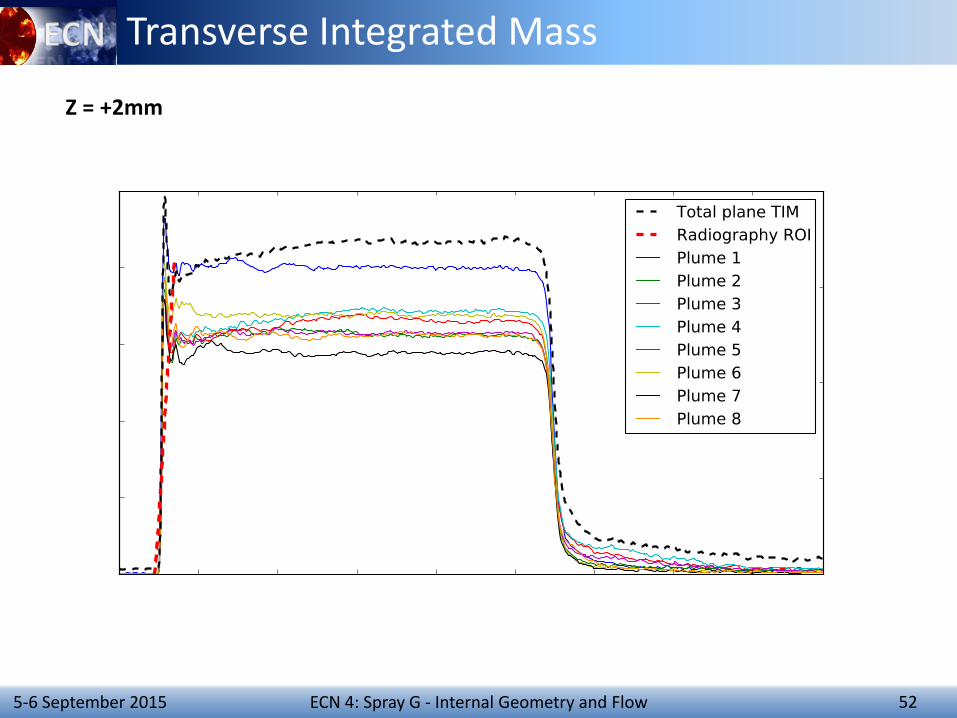
Transverse Integrated Mass
Z = +2mm
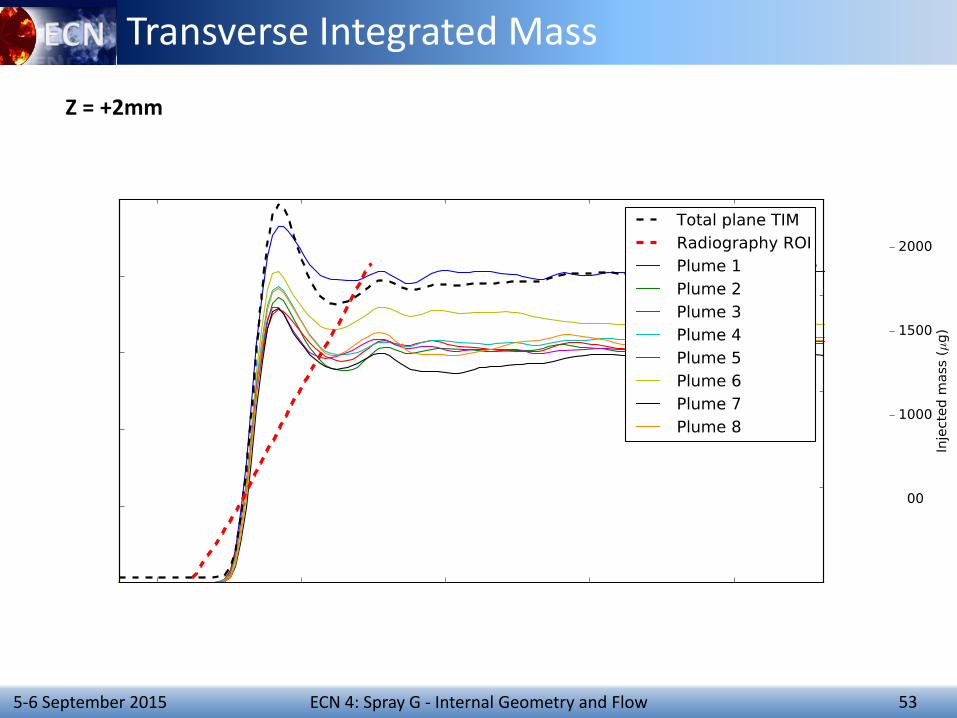
53 ECN 4: Spray G - Internal Geometry and Flow 5-6 September 2015
Transverse Integrated Mass
Z = +2mm
54 ECN 4: Spray G - Internal Geometry and Flow 5-6 September 2015
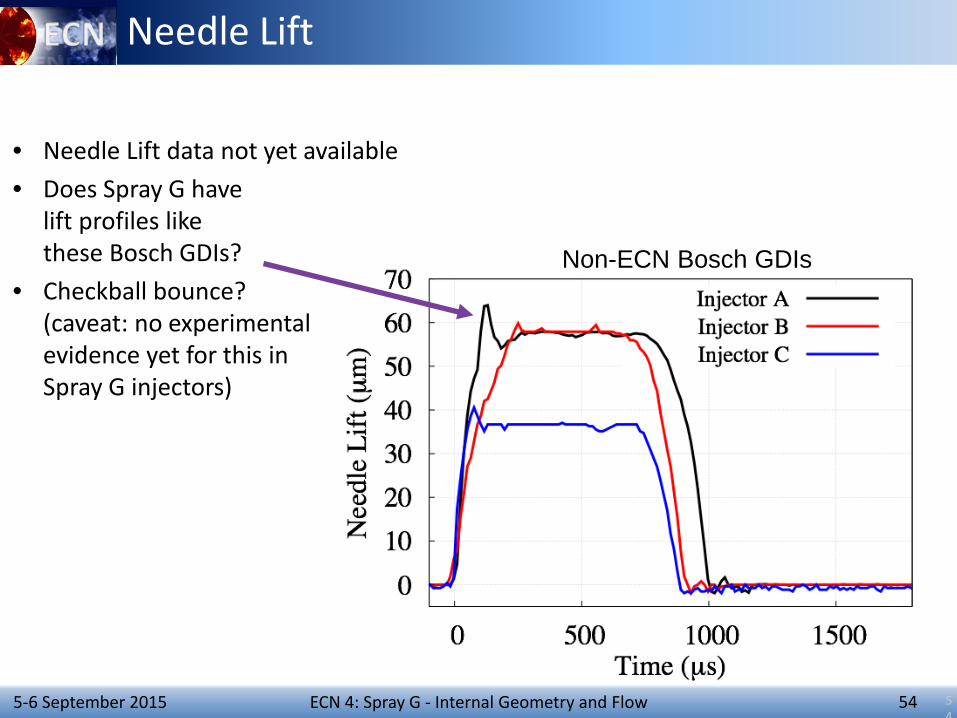
• Needle Lift data not yet available • Does Spray G have
lift profiles like these Bosch GDIs?
• Checkball bounce? (caveat: no experimental evidence yet for this in Spray G injectors)
54
Non-ECN Bosch GDIs
Needle Lift
55 ECN 4: Spray G - Internal Geometry and Flow 5-6 September 2015
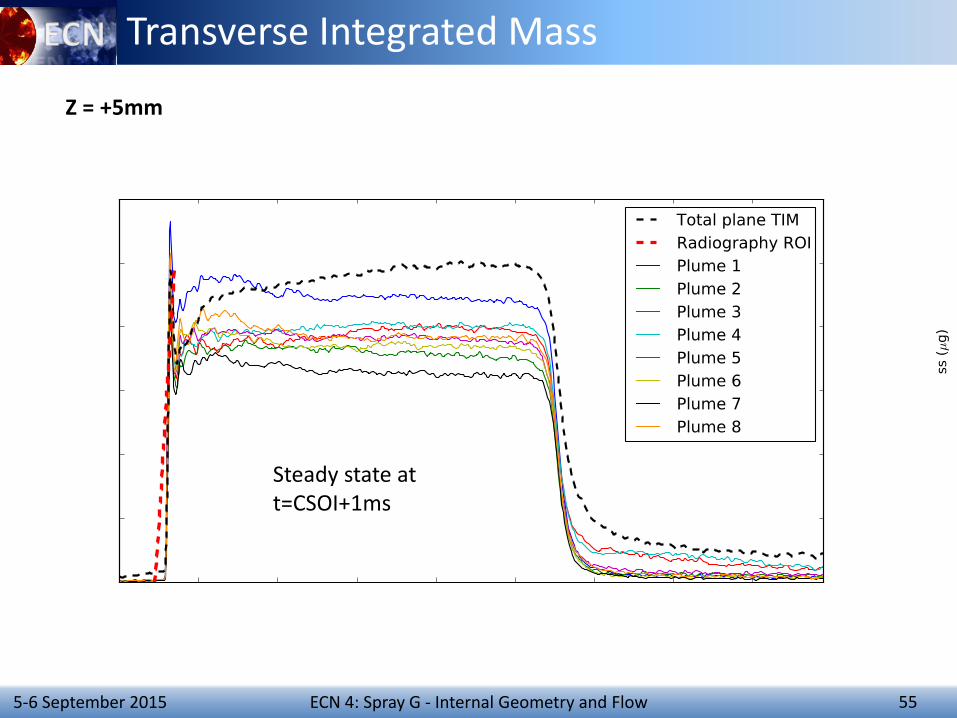
Transverse Integrated Mass
Z = +5mm
Steady state at t=CSOI+1ms
56 ECN 4: Spray G - Internal Geometry and Flow 5-6 September 2015
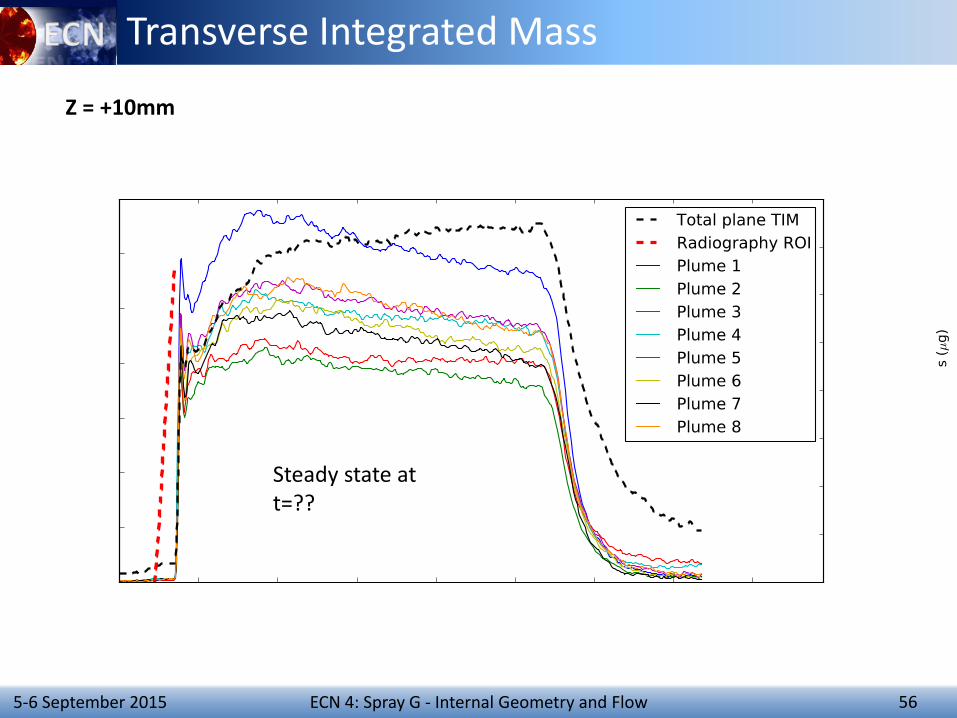
Transverse Integrated Mass
Z = +10mm
Steady state at t=??
57 ECN 4: Spray G - Internal Geometry and Flow 5-6 September 2015
Transverse Integrated Mass
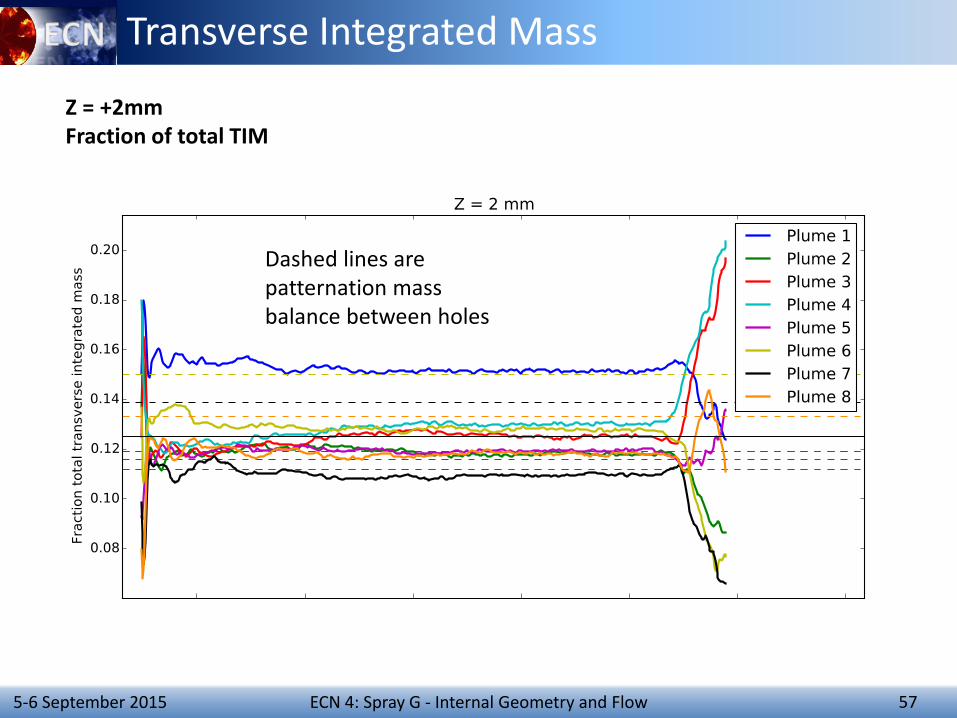
Z = +2mm Fraction of total TIM
Dashed lines are patternation mass balance between holes
58 ECN 4: Spray G - Internal Geometry and Flow 5-6 September 2015
Transverse Integrated Mass
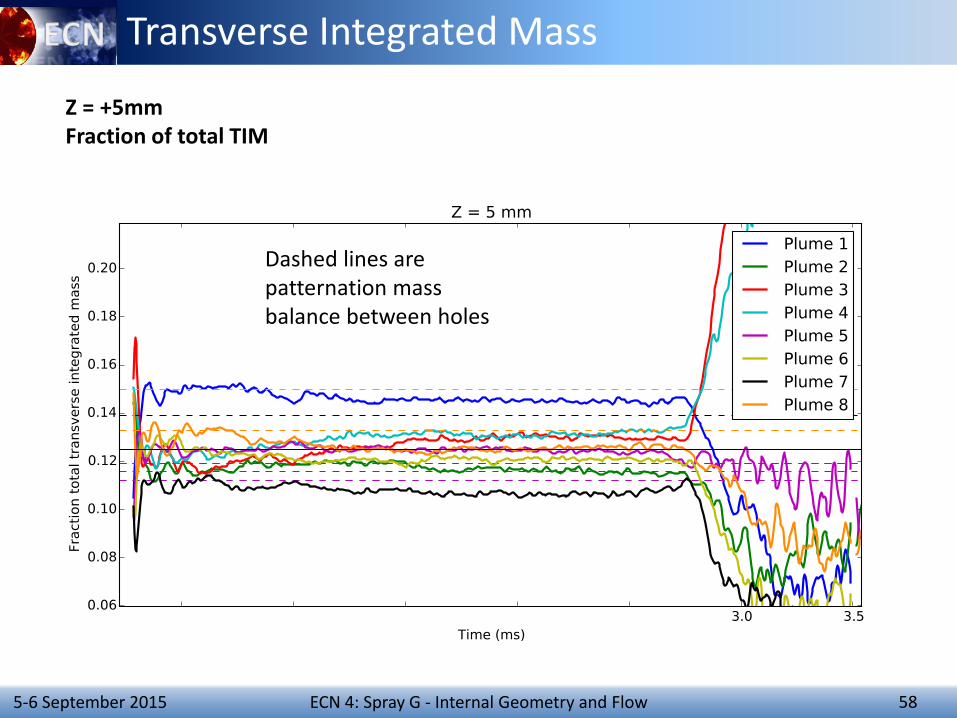
Z = +5mm Fraction of total TIM
Dashed lines are patternation mass balance between holes
59 ECN 4: Spray G - Internal Geometry and Flow 5-6 September 2015
Transverse Integrated Mass
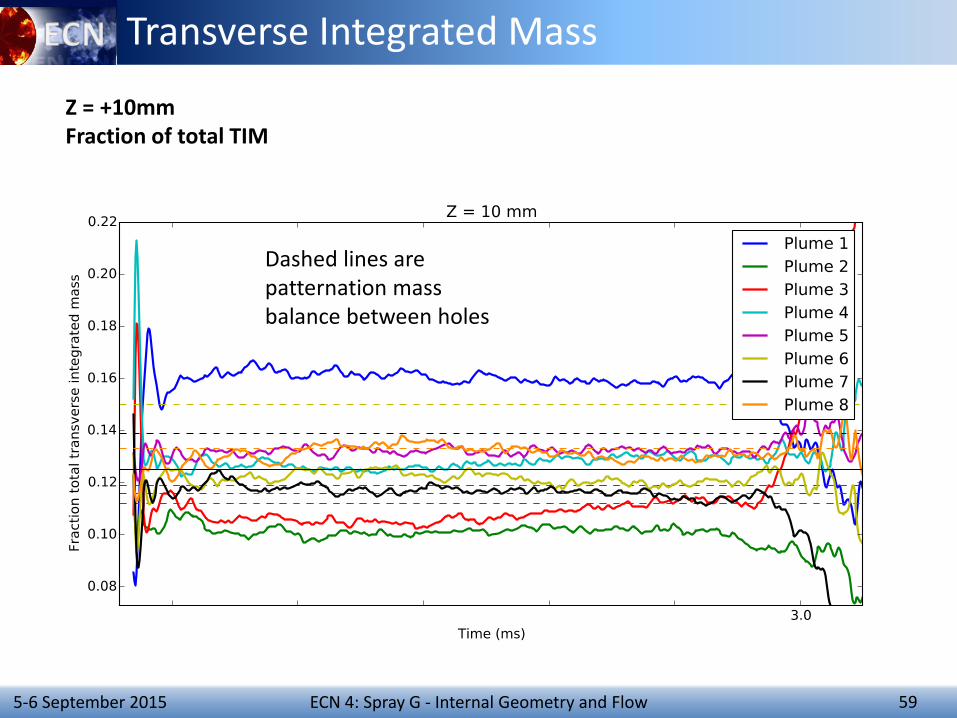
Z = +10mm Fraction of total TIM
Dashed lines are patternation mass balance between holes
60 ECN 4: Spray G - Internal Geometry and Flow 5-6 September 2015
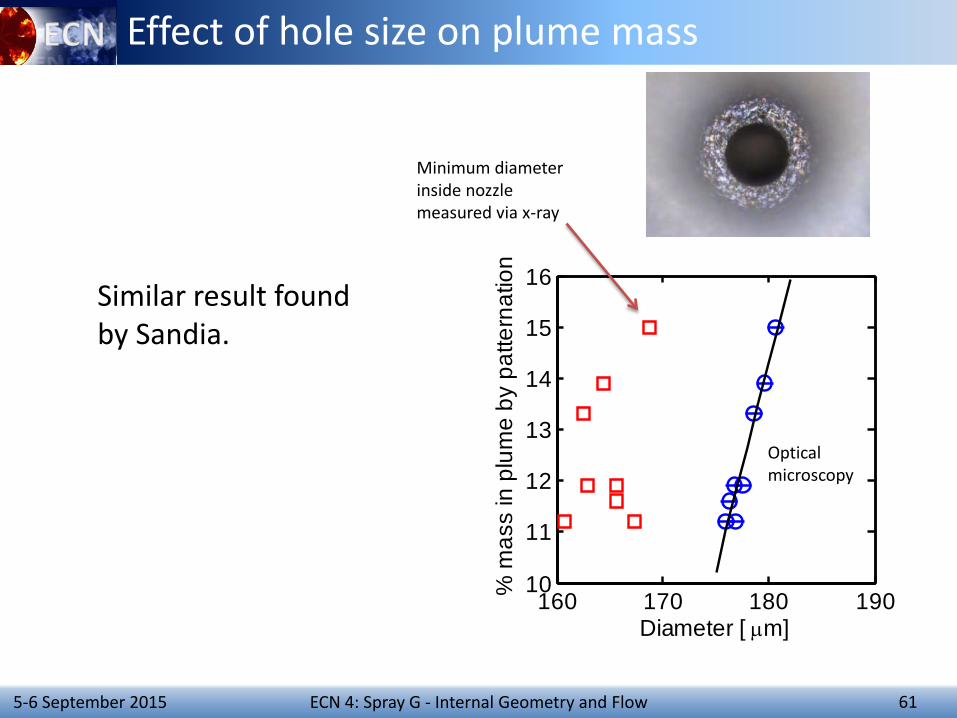
Effect of hole size on plume mass
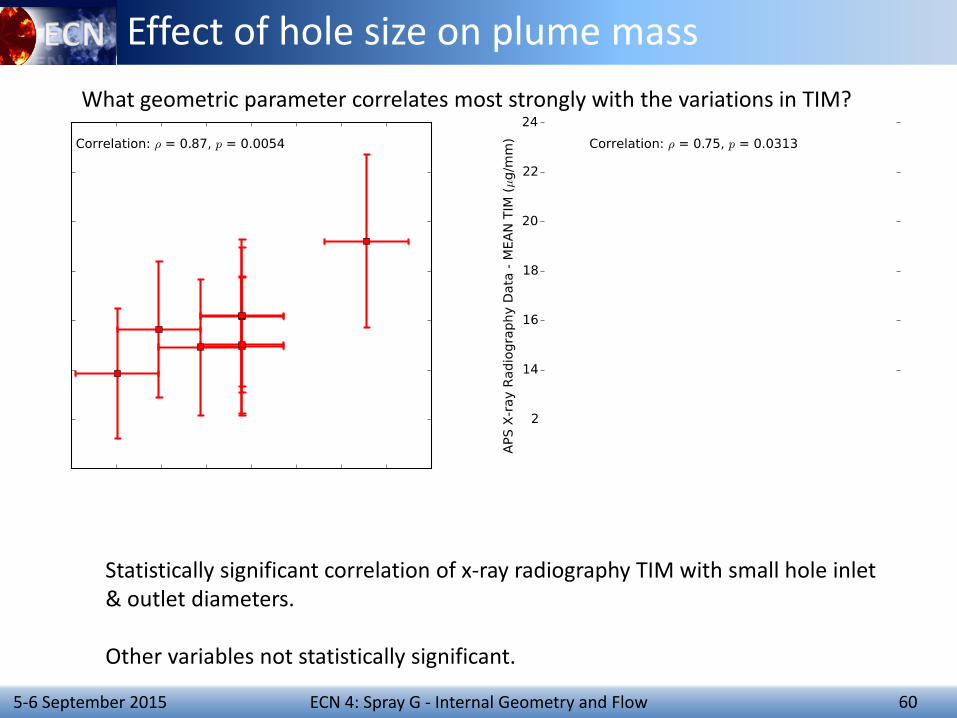
Statistically significant correlation of x-ray radiography TIM with small hole inlet & outlet diameters. Other variables not statistically significant.
What geometric parameter correlates most strongly with the variations in TIM?
61 ECN 4: Spray G - Internal Geometry and Flow 5-6 September 2015
Effect of hole size on plume mass
160 170 180 19010
11
12
13
14
15
16
Diameter [ µm]
% m
ass
in p
lum
e by
pat
tern
atio
n
Similar result found by Sandia.
Minimum diameter inside nozzle measured via x-ray
Optical microscopy
ECN3 2014
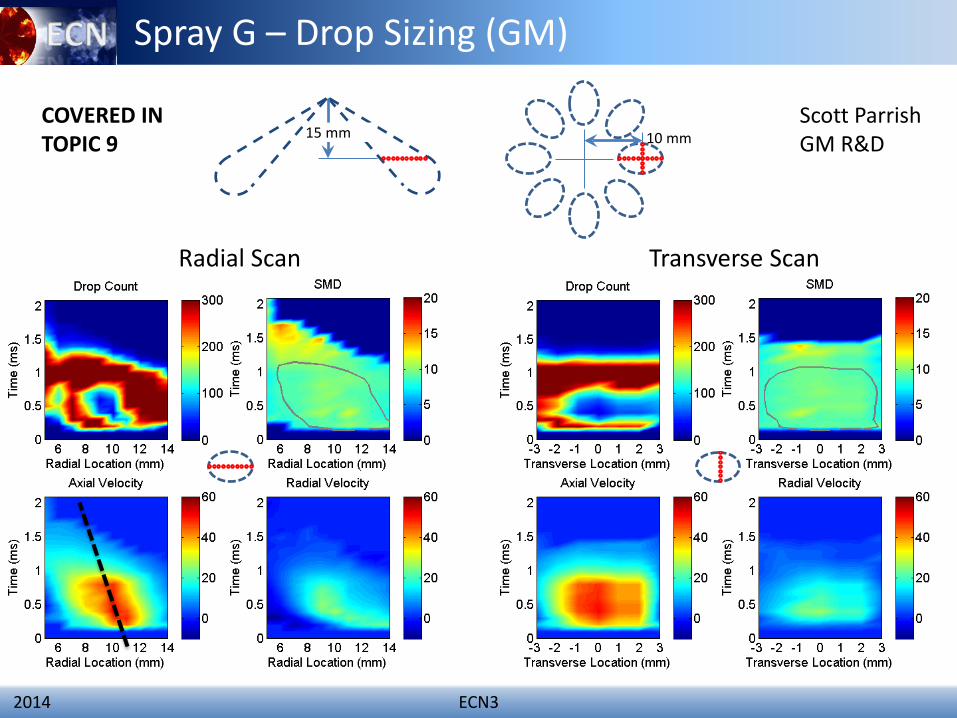
Spray G – Drop Sizing (GM)
Radial Scan
15 mm 10 mm
Transverse Scan
Scott Parrish GM R&D
COVERED IN TOPIC 9
63 ECN 4: Spray G - Internal Geometry and Flow 5-6 September 2015
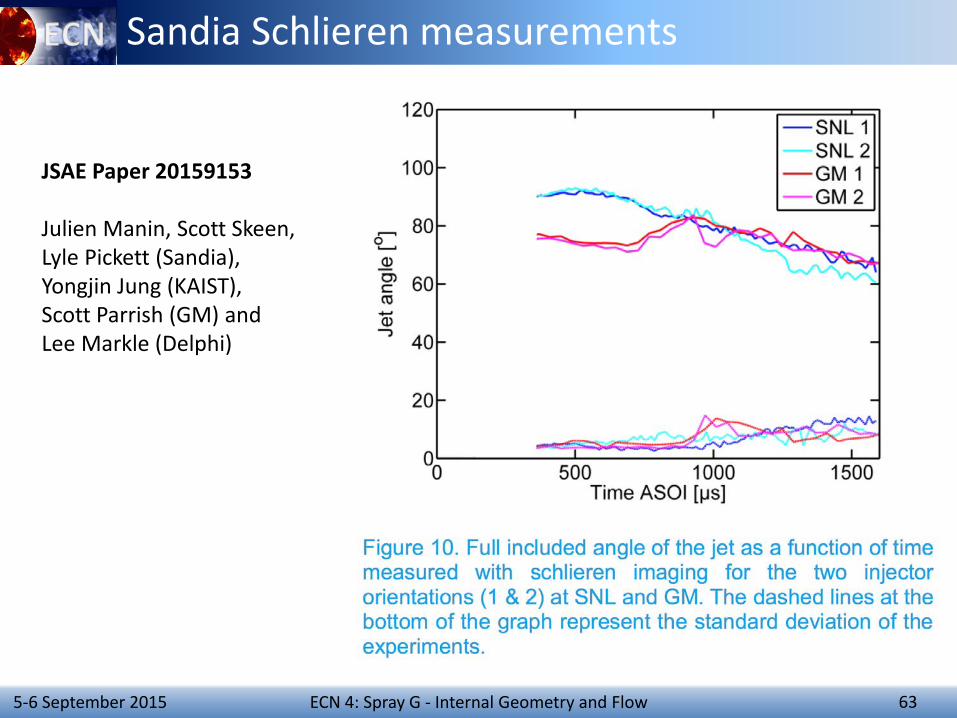
Sandia Schlieren measurements
JSAE Paper 20159153 Julien Manin, Scott Skeen, Lyle Pickett (Sandia), Yongjin Jung (KAIST), Scott Parrish (GM) and Lee Markle (Delphi)
64 ECN 4: Spray G - Internal Geometry and Flow 5-6 September 2015
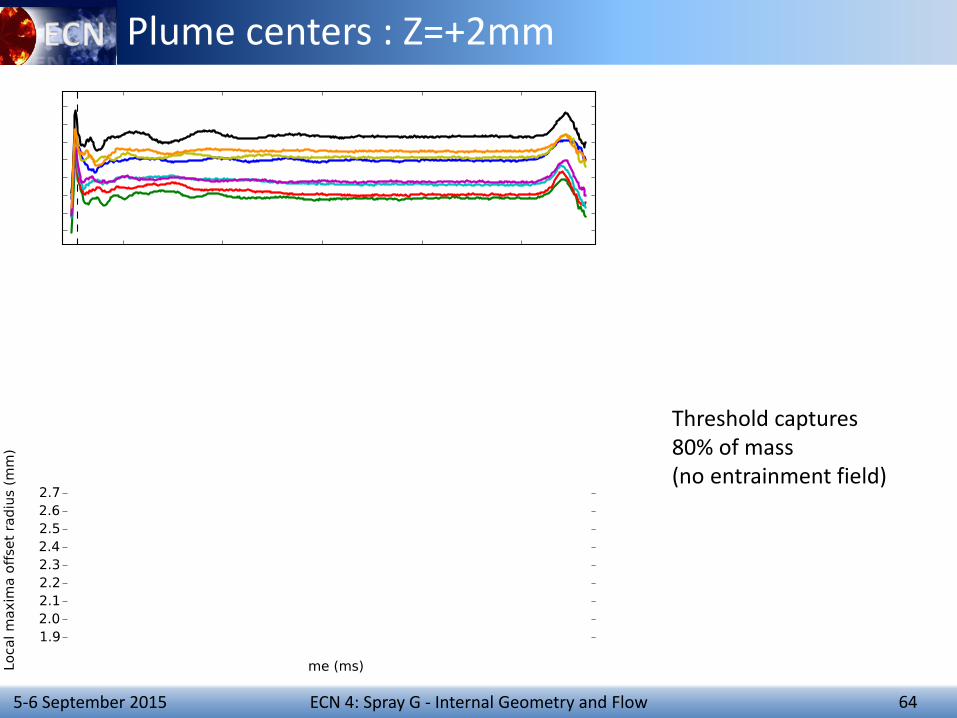
Plume centers : Z=+2mm
Threshold captures 80% of mass (no entrainment field)
65 ECN 4: Spray G - Internal Geometry and Flow 5-6 September 2015
Plume centers : Z=+5mm
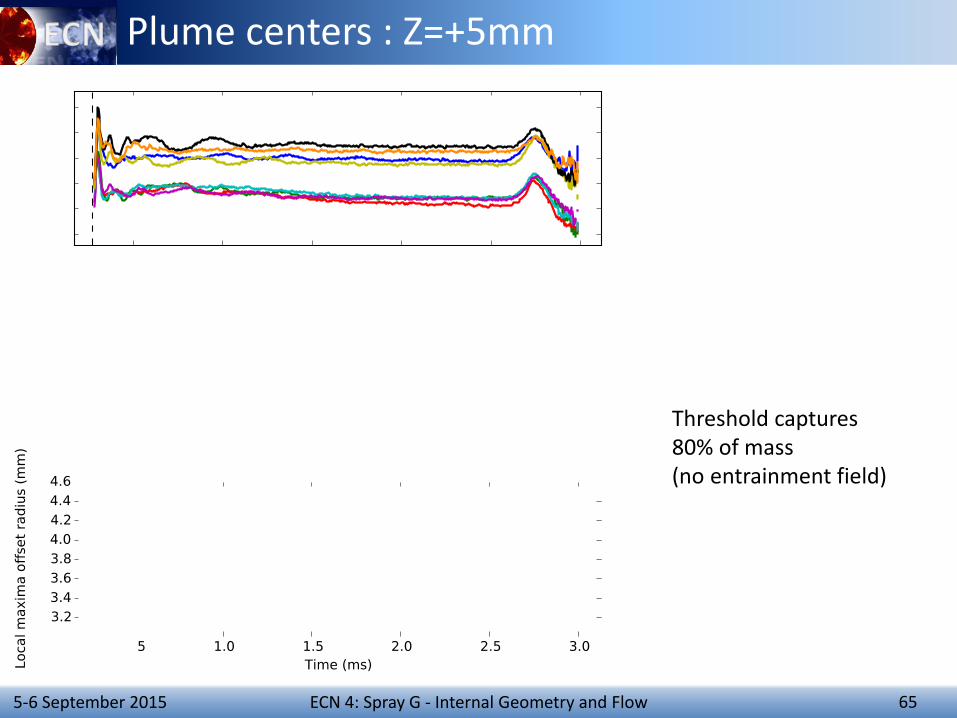
Threshold captures 80% of mass (no entrainment field)
66 ECN 4: Spray G - Internal Geometry and Flow 5-6 September 2015
Plume centers : Z=+10mm
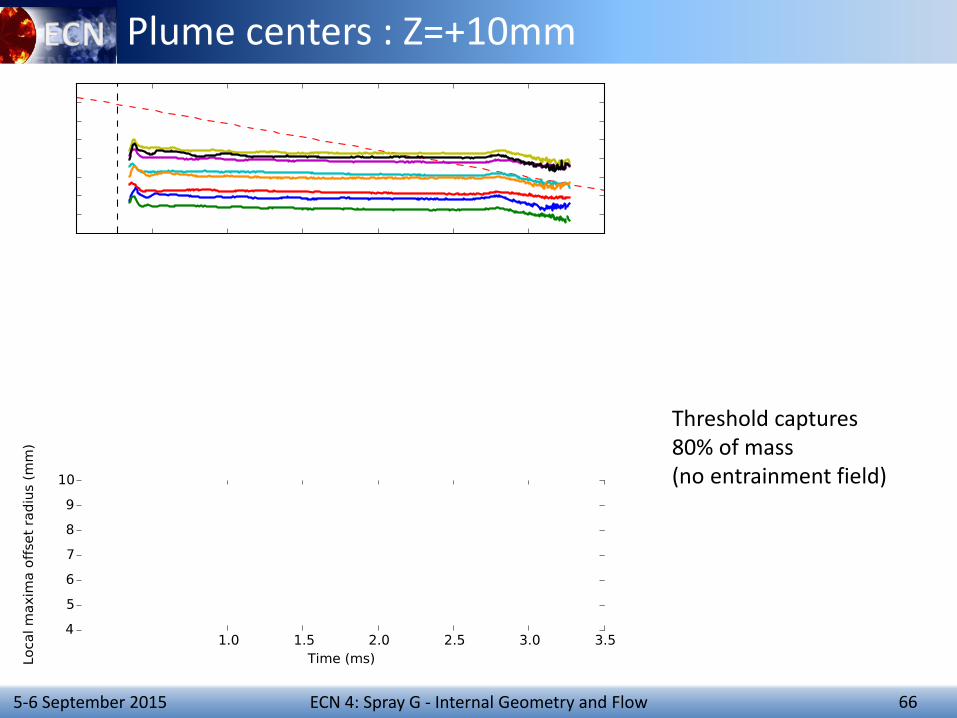
Threshold captures 80% of mass (no entrainment field)
67 ECN 4: Spray G - Internal Geometry and Flow 5-6 September 2015
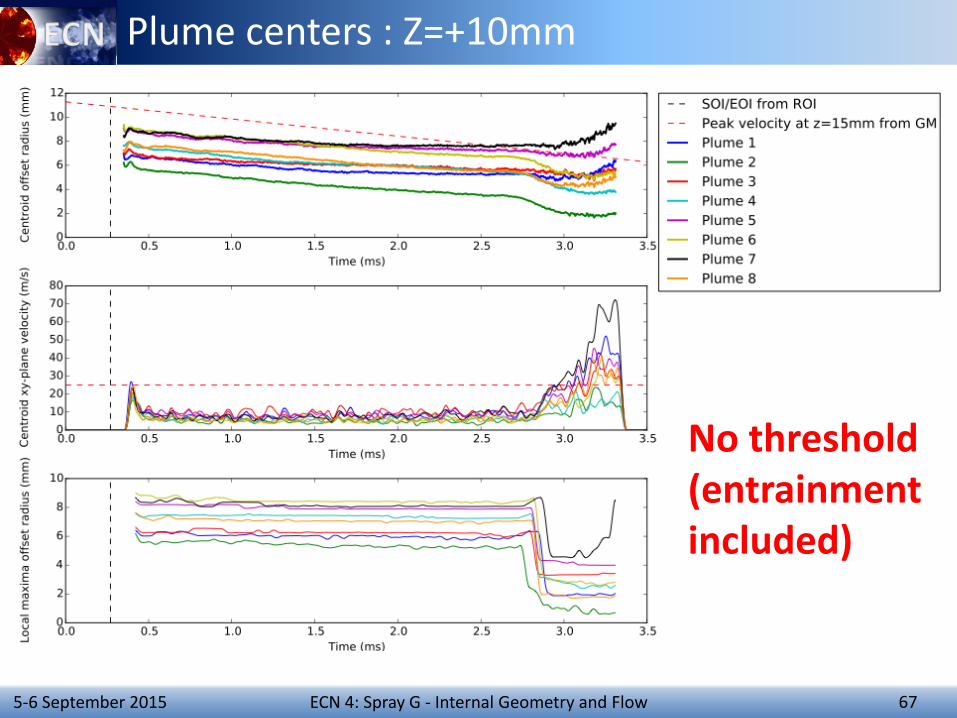
Plume centers : Z=+10mm
No threshold (entrainment included)
68 ECN 4: Spray G - Internal Geometry and Flow 5-6 September 2015
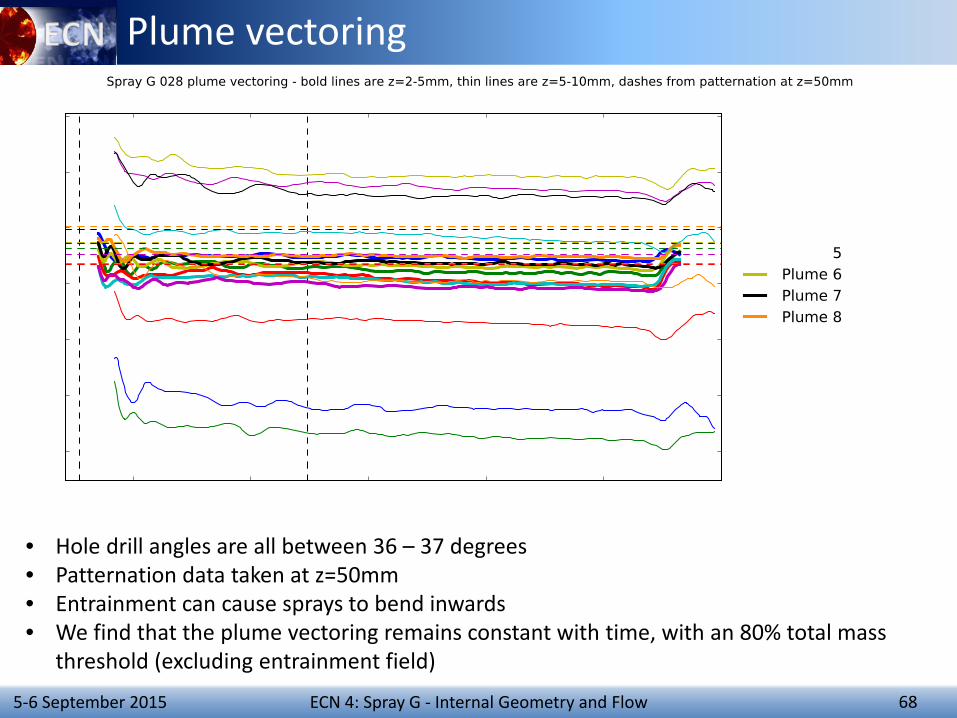
Plume vectoring
• Hole drill angles are all between 36 – 37 degrees • Patternation data taken at z=50mm • Entrainment can cause sprays to bend inwards • We find that the plume vectoring remains constant with time, with an 80% total mass
threshold (excluding entrainment field)
ECN 4: Spray G - Internal Geometry and Flow 69 5-6 September 2015
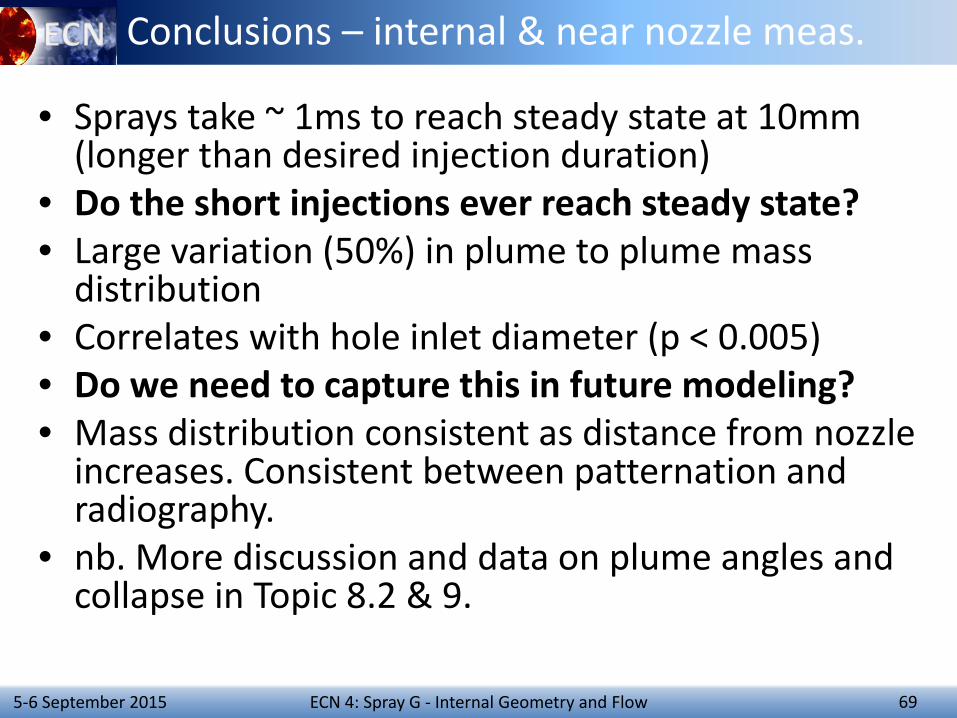
Conclusions – internal & near nozzle meas.
• Sprays take ~ 1ms to reach steady state at 10mm (longer than desired injection duration)
• Do the short injections ever reach steady state? • Large variation (50%) in plume to plume mass
distribution • Correlates with hole inlet diameter (p < 0.005) • Do we need to capture this in future modeling? • Mass distribution consistent as distance from nozzle
increases. Consistent between patternation and radiography.
• nb. More discussion and data on plume angles and collapse in Topic 8.2 & 9.
ECN 4: Spray G - Internal Geometry and Flow 70 5-6 September 2015
Q&A
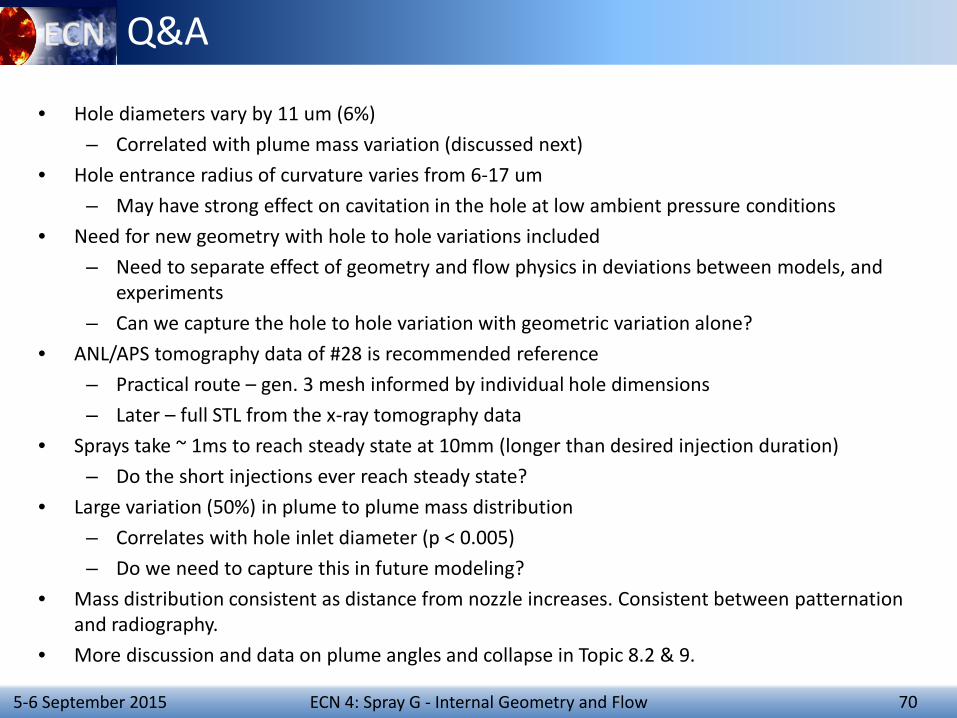
• Hole diameters vary by 11 um (6%) – Correlated with plume mass variation (discussed next)
• Hole entrance radius of curvature varies from 6-17 um – May have strong effect on cavitation in the hole at low ambient pressure conditions
• Need for new geometry with hole to hole variations included – Need to separate effect of geometry and flow physics in deviations between models, and
experiments – Can we capture the hole to hole variation with geometric variation alone?
• ANL/APS tomography data of #28 is recommended reference – Practical route – gen. 3 mesh informed by individual hole dimensions – Later – full STL from the x-ray tomography data
• Sprays take ~ 1ms to reach steady state at 10mm (longer than desired injection duration) – Do the short injections ever reach steady state?
• Large variation (50%) in plume to plume mass distribution – Correlates with hole inlet diameter (p < 0.005) – Do we need to capture this in future modeling?
• Mass distribution consistent as distance from nozzle increases. Consistent between patternation and radiography.
• More discussion and data on plume angles and collapse in Topic 8.2 & 9.