Topic 7 - Hypothesis tests based on a single sample Sampling distribution of the sample mean - pages...
19
Topic 7 - Hypothesis tests based on a single sample • Sampling distribution of the sample mean - pages 187 - 189 • Basics of hypothesis testing - pages 222 - 227 • Hypothesis test for a population mean - pages 229 - 234 • Hypothesis test for a population proportion - pages 283 - 284
-
Upload
elwin-shepherd -
Category
Documents
-
view
217 -
download
0
Transcript of Topic 7 - Hypothesis tests based on a single sample Sampling distribution of the sample mean - pages...

Topic 7 - Hypothesis tests based on a single sample
• Sampling distribution of the sample mean - pages 187 - 189
• Basics of hypothesis testing - pages 222 - 227
• Hypothesis test for a population mean - pages 229 - 234
• Hypothesis test for a population proportion - pages 283 - 284

Hypothesis testing
• We have already discussed how one makes decisions based on data using confidence intervals.
• If someone claims a population parameter has a certain value, we only believe the claim if the value is inside our confidence interval for the parameter.
• Hypothesis testing provides a more formal method for testing claims.

Hypothesis testing
• A hypothesis test checks sample data against a claim or assumption about the population.
• The claim being tested is called the null hypothesis, H0.
• The null hypothesis typically represents the status quo or no change belief.
• The alternative hypothesis, HA, represents what we suspect is true.
• The researcher’s goal is typically to show that the alternative hypothesis is true.

Studying example
• A study reports that the mean time freshmen spend studying is 7.06 hours per week. A TAMU teacher feels that freshmen here spend more time on average studying. What are the appropriate null and alternative hypotheses?

Decision making• We look for evidence in the form of sample data
against the null hypothesis and in favor of the alternative hypothesis.
• We use a test statistic, computed from the data, to make our decision.
• We evaluate the evidence from the sample by computing a p-value, the probability of a more extreme test statistic than the one observed if the null is true.
• A small p-value indicates we should reject the null hypothesis.
• A large p-value means there is not strong evidence against the null.
• At the end of the test, we either reject or fail to reject the null hypothesis based on the p-value.

Studying example• A random sample of 35 freshmen at TAMU
report the hours they spend studying, and the sample mean is 8.43 hours with a sample standard of 4.32 hours.
• What test statistic should we use?• What is the approximate p-value of our test?• Normal calculator
Level of Significance
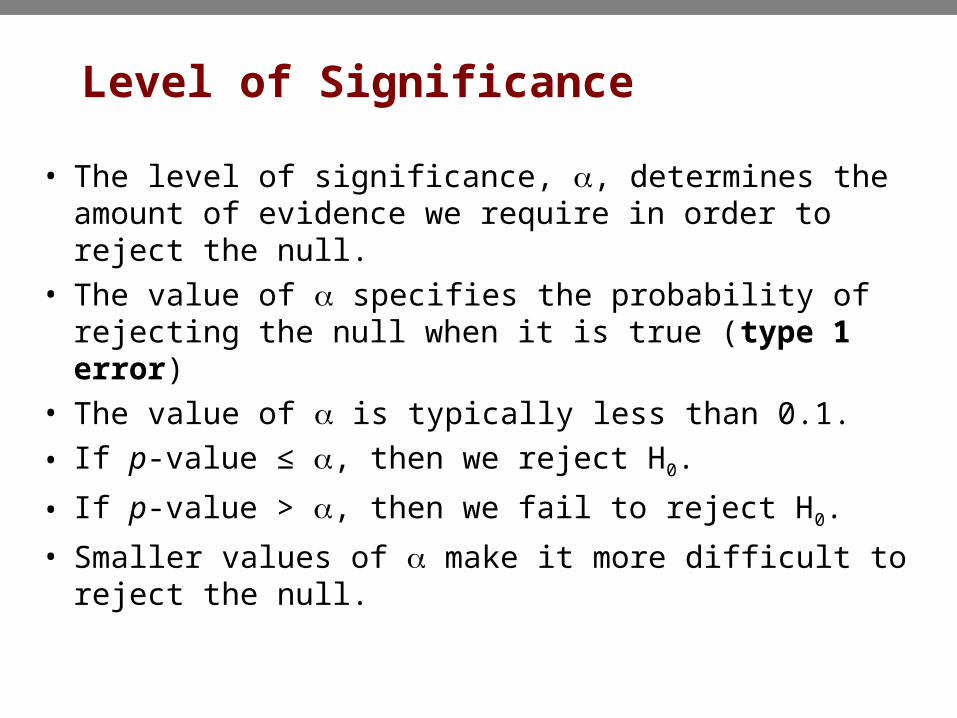
• The level of significance, , determines the amount of evidence we require in order to reject the null.
• The value of specifies the probability of rejecting the null when it is true (type 1 error)
• The value of is typically less than 0.1.
• If p-value ≤ , then we reject H0.
• If p-value > , then we fail to reject H0.
• Smaller values of make it more difficult to reject the null.

Studying example
• What is your decision with = 0.01?
• What is your decision with = 0.05?

Decision rules• The level of significance can be used to
develop decision rules based on the value of your test statistic.
• For example, to test H0: = 0
Test statistic
for large n
HA Reject H0 if
< 0 Z < -z
> 0 Z > z
≠ 0 |Z| > z/2
0XZ
s n
Test statistic
for small n
HA Reject H0 if
< 0 T < -t,n-1
> 0 T > t,n-1
≠ 0 |T| > t/2,n-1
0XT
s n

Studying example
• What is your decision rule with = 0.01?
• What is your decision rule with = 0.05?

Type 2 error• In addition to rejecting the null when it is true,
we can also fail to reject the null when it is false (type 2 error).
• Suppose our decision rule for the studying example is to reject HA if > 7.5?
• Normal Calculator• Using = 4.32,
P(type 1 error) =
If = 8, P(type 2 error) =
X

VHS example• A manufacturer of VHS tapes wants to make sure that the
VHS tapes they sell are 120 minutes long on average. – If they are too short, there is a risk of bad publicity. – If they are too long, then the material cost is increased.
• In a sample of 10 tapes,– the sample average was 120.1 minutes– the sample standard deviation was 0.15 minutes.
• Is there sufficient evidence at = .05 that the true mean length is different from 120?
• T calculator

Acid rain data• The EPA states that any area where the average pH of
rain is less than 5.6 on average has an acid rain problem.
• Test to see if acid rain is a problem with = 0.1.

Tests for population proportions• Consider the nurse employment example.
• What are the appropriate hypotheses?
• If H0 is true, what is the probability that 32 or fewer would be handled timely in a sample of 36?
• Binomial calculator
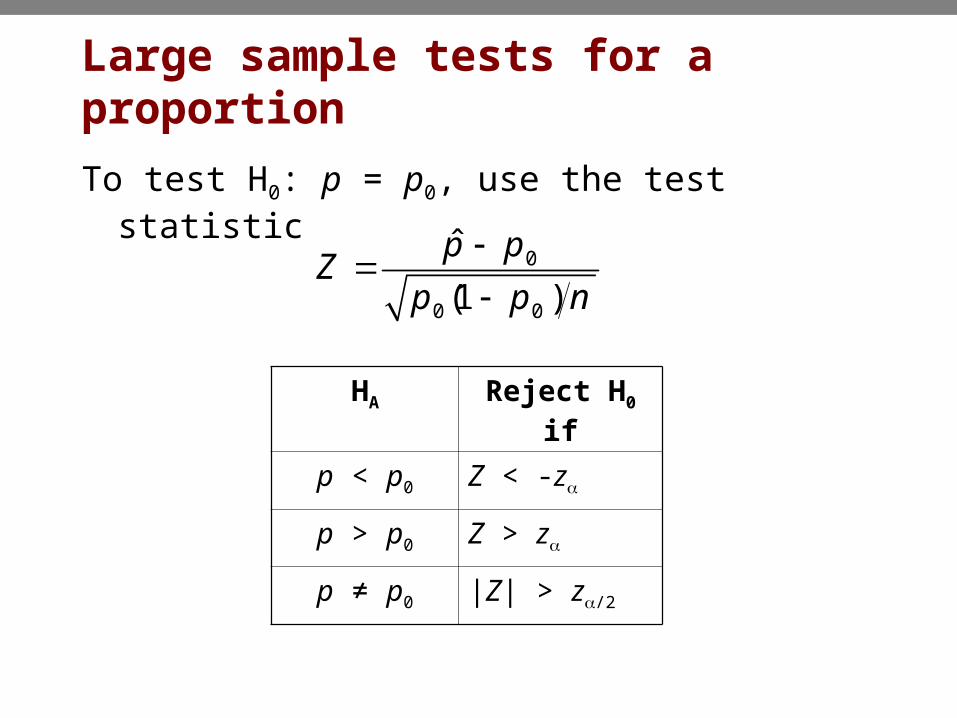
Large sample tests for a proportion
To test H0: p = p0, use the test statistic
0
0 0
ˆ
(1 )
p pZ
p p n
HA Reject H0 if
p < p0 Z < -z
p > p0 Z > z
p ≠ p0 |Z| > z/2

Murder case example• What are the appropriate hypotheses?
• What is the p-value? Normal calculator

Large sample vs. Small sample
• For the nurse employment case, what is the large sample p-value?
• Normal calculator

Type 2 error• For the murder case, what is the
probability of type 2 error if the true proportion of African Americans in the jury pool is 0.10 when =0.05? (n = 295)
• Normal calculator

Sample size determination• For the murder case, what is the sample
size required so that the probability of type 2 error with the true proportion of African Americans in the jury pool being 0.10 is at most 0.02 when = 0.05?
• Normal calculator