TOPIC 6 : Monitoring and R&D programmes after a … · Les leçons techniques de l’Erika et des...
15
TOPIC 6 : Monitoring and R&D programmes after a pollution Mr Jacek Tronczynski Technical lessons learnt from the Erika incident and other oil spills - Brest, 13-16 march 2002 STUDY OF THE CHEMICAL AND WEATHERING FINGERPRINTS OF THE ERIKA OIL AND CHARACTERISATION OF PAH CONTAMINATION IN GASCOGNE GULF Mr Jacek Tronczynski IFREMERr- Rue de l’Ile d’Yeu, B.P. 44311 Nantes Cedex 3, France Tel. + 33 (0) 2 40 37 41 36 - Fax. + 33 (0) 2 40 37 40 75 [email protected] Secondary authors : K. Moisan, C. Munschy, I. Truquet, L. Dugrais and G. Billard ABSTRACT The important oil spill and the grounding of oil or of its derivatives on the coasts, owing to an accident like the Erika wreck, produce an important contamination of all the parts of the marine ecosystems by hydrocarbons. The follow-up of this chemical contamination represents an important and complementary element of the actions of research and monitoring which aim at evaluating sanitary risks, damage and ecological consequences of such an accident. A detailed chemical characterization of the composition of the fuel oil from the Erika and follow-up of the weathering of fuel oil grounded in coastal areas (intertidal rocks) were begun. These studies are the first stage and supply a reference to follow the evolution of the contamination by hydrocarbons of all the biotic and abiotic parts of the coastal areas of the northwestern Atlantic. The analysis results supply fingerprints, features of the Erika fuel oil. These prints were obtained in the 4 chemical cuts of fuel oil of increasing polarity (F1 to F4) made by high resolution gas chromatography connected to low resolution mass spectrometry (CPG-SM). The subtle separation of the complex mixture of compounds, before the analysis CPG-SM (by chromatography of absorption), allows a better identification of the individual compounds. So, we could identify in the cuts 3 and 4 the occurrence of carbazole (nitrogenated aromatic heterocyclic structure) and its alkyl derivatives (methyl, bimethyl, trimethyl) in the Erika fuel oil. Cut 1 mainly contains aromatic aliphatic hydrocarbons of low molecular weight and the cut 2 essentially contains Polycyclic Aromatic Hydrocarbons (PAH). To date, the quantitative analyses of the PAH in the cut 2 of the oil fuel allowed to quantify the concentrations in more than 190 individual compounds. Those represent about a
Transcript of TOPIC 6 : Monitoring and R&D programmes after a … · Les leçons techniques de l’Erika et des...

TOPIC 6 : Monitoring and R&D programmes after apollution
Mr Jacek Tronczynski
Technical lessons learnt from the Erika incident and other oil spills - Brest, 13-16 march 2002
STUDY OF THE CHEMICAL AND WEATHERING FINGERPRINTS OF THEERIKA OIL AND CHARACTERISATION OF PAH CONTAMINATION IN
GASCOGNE GULFMr Jacek Tronczynski
IFREMERr- Rue de l’Ile d’Yeu, B.P. 44311 Nantes Cedex 3, FranceTel. + 33 (0) 2 40 37 41 36 - Fax. + 33 (0) 2 40 37 40 75 [email protected]
Secondary authors : K. Moisan, C. Munschy, I. Truquet, L. Dugrais and G. Billard
ABSTRACT
The important oil spill and the grounding of oil or of its derivatives on the coasts, owing to an accident like the
Erika wreck, produce an important contamination of all the parts of the marine ecosystems by hydrocarbons.
The follow-up of this chemical contamination represents an important and complementary element of the actions
of research and monitoring which aim at evaluating sanitary risks, damage and ecological consequences of such
an accident.
A detailed chemical characterization of the composition of the fuel oil from the Erika and follow-up of the
weathering of fuel oil grounded in coastal areas (intertidal rocks) were begun. These studies are the first stage
and supply a reference to follow the evolution of the contamination by hydrocarbons of all the biotic and abiotic
parts of the coastal areas of the northwestern Atlantic.
The analysis results supply fingerprints, features of the Erika fuel oil. These prints were obtained in the 4
chemical cuts of fuel oil of increasing polarity (F1 to F4) made by high resolution gas chromatography
connected to low resolution mass spectrometry (CPG-SM). The subtle separation of the complex mixture of
compounds, before the analysis CPG-SM (by chromatography of absorption), allows a better identification of the
individual compounds. So, we could identify in the cuts 3 and 4 the occurrence of carbazole (nitrogenated
aromatic heterocyclic structure) and its alkyl derivatives (methyl, bimethyl, trimethyl) in the Erika fuel oil. Cut
1 mainly contains aromatic aliphatic hydrocarbons of low molecular weight and the cut 2 essentially contains
Polycyclic Aromatic Hydrocarbons (PAH). To date, the quantitative analyses of the PAH in the cut 2 of the oil
fuel allowed to quantify the concentrations in more than 190 individual compounds. Those represent about a

TOPIC 6 : Monitoring and R&D programmes after apollution
Mr Jacek Tronczynski
Technical lessons learnt from the Erika incident and other oil spills - Brest, 13-16 march 2002
fraction of 3,3 % of the fuel oil weight. However, the 16 PAH usually analysed represent only 0,3 % of the fuel
oil weight. Besides, it is important to clarify that the formal identification and quantification of PAH require the
use of the standards of the pure compounds. Sometimes, there are not or they are very expensive. For several
compounds, the identification of the PAH in our analyses is made only by the determination of their molecular
weights in CPG-SM. For an important number of compounds, the quantification is relative to the standards of
quantification used.
The follow-up of the weathering of the PAH of the Erika fuel oil was done with sampling frequency of a
sampling per month since December 1999, that is to say since the first oil slicks had grounded on the coasts.
The analytic adjusting was developed to be able to characterize quantitatively the PAH present in the oil fuel on
the rocks. Indeed, the sampled fuel oil contains water and numerous solid debris (particles of rocks, of sand, of
algae, and of sediments). This occurrence can induce an error if the results are expressed in mass weight of fuel
oil. The results show that this residue in the fuel oil samples significantly fluctuates and can reach more than 40
% in the weight of the sampled fuel oil.
The analysis results of the PAH reveal a loss of these compounds in the samples taken in December 1999 on the
rocks or on the beaches when compared to reference fuel oil (sample of Erika oil fuel from the refinery of
Flandres at Dunkerque, sent by the CEDRE). This loss was produced between the moment of the oil spill after
the disaster (December 12th 1999) and the date of the first sample in the oil slick grounded at Batz-sur-Mer
(December 27th 1999). The percentage of loss according to the molecular weight shows a significant linear
regression. We see losses more important for the compounds with a low molecular weight and the reduction of
the loss percentage for the compounds with a high molecular weight. The alkyl compounds have a more
important loss percentage because they are present in a high quantity in the lightest compounds. The main
causes of reduction of the concentrations probably were the solubility and the evaporation of the compounds
during the first hours and days after the wreck. The losses percentages, respect to the reference sample, are on
average at 18 % for the sum Σ16-PAH and 32 % for the sum ΣMe-PAH.
Besides, the results show that the concentrations of the total PAH in the samples of fuel oil taken in the grounded
oil slicks on the rocks between December 1999 and May 2001 fluctuate relatively little. No significant

TOPIC 6 : Monitoring and R&D programmes after apollution
Mr Jacek Tronczynski
Technical lessons learnt from the Erika incident and other oil spills - Brest, 13-16 march 2002
reduction is observed after the grounding of oil on the rocks for the heaviest compounds from fluoranthene. We
probably observe a phenomenon of relative increase for the compounds from 5 aromatic nucleus. The low
evolution of the composition of the PAH of the fuel oil in time is also revealed by the examination of a few
geochemical indicators in the series of samples of the fuel oil. We notice that the geochemical indicators are
constant enough, showing that the relative evolution of the composition fluctuates little and that these indicators
possibly can be used to search Erika fuel oil fingerprints in the contaminated samples.
Finally, we emphasize that the quantitative analyses of fuel oil that we have done are necessary to get a mass
balance of the PAH spilled in the environment. The follow-up of the qualitative and quantitative evolution of
the compounds and the use of geochemical indicators allow to discriminate the chronic contamination of the
coastal environment that existed before the wreck from the new contamination caused by the Erika oil spill.
Finally, the identification and the precise quantification of hydrocarbons contribute to the drawing-up of a
toxicological profile of the fuel oil.
TOPIC 6 : Surveillance et Recherche-Développementaprès pollution
M. Jacek Tronczynski
Les leçons techniques de l’Erika et des autres accidents maritimes - Brest, 13-16 mars 2002
Conférences SaferSeas CEDRE11-16 mars 2002, Brest
Empreintes chimiques du fuel de l ’Erika et lacaractérisation de la contamination par les HAP
dans le Golfe de Gascogne
J. Tronczynski K. Moisan, C.Munschy,
L. Dugrais, N.Guiot, I. Truquet, B. Averty, E. Chartier
IFREMER
DEL/PC
Conférences SaferSeas CEDRE11-16 mars 2002, Brest
1. Suivi d ’altération de la composition en HAP dufuel Erika déposé sur les rochers à Batz sur Mer
2. Étude et suivi de la contamination chimique pardes HAP dans le Golfe de Gascogne
Conférences SaferSeas CEDRE11-16 mars 2002, Brest
Bilans d’apports en Méditerranée HAP (tonnes/an)
Golfe de Lion 11
NW Méditerranée 60
(Tolosa et. al. 1996)
Apports en Méditerranée NW
Naufrage de l ’ERIKA
Bilan de fioul et d’HAP % tonnes
Cargaison 100 30884,471
Déversement 65 ~20000
Carbone aromatique 50 10000
Perte dans l’environnement 10 ~ 1000
HAP dosés 3 30
1. Bilan de la contamination chimiquepar des HAP du milieu marin suite à unmarée noire ?
Contamination chronique
Contamination accidentelle

TOPIC 6 : Surveillance et Recherche-Développementaprès pollution
M. Jacek Tronczynski
Les leçons techniques de l’Erika et des autres accidents maritimes - Brest, 13-16 mars 2002
Conférences SaferSeas CEDRE11-16 mars 2002, Brest
2. Comment identifier et quantifier lacontamination chimique descompartiments biotiques et abiotiquessuite à un marée noire ?
0
50
100
150
200
Nap
htal
ène
C1-
NC
2-N
C3-
NC
4-N
Ace
naph
tylè
neA
cena
phtè
neF
luor
ène
C1-
FC
2-F
Phé
nant
hrèn
eA
nthr
acèn
eC
1-P
C2-
PC
3-P
Flu
oran
thèn
eP
yrèn
eC
1-PY
C2-
PYB
(a)A
nthr
Chr
ysèn
eC
1-CH
RC
2-CH
R
B(b
j)Fl
B(k
)Fl
C1-
BFL
sB
(e)P
yB
(a)P
yP
éryl
ène
Indé
no-P
yr.
DB
AB
(ghi
)Pér
ylèn
e
DB
TC
1-DB
TC
2-DB
TC
3-DB
T
BN
TsC
1-BN
Ts
µg/kg
0
50
100
150
200
Nap
htal
ène
C1-
NC
2-N
C3-
NC
4-N
Ace
naph
tylè
neA
cena
phtè
neF
luor
ène
C1-
FC
2-F
Phé
nant
hrèn
eA
nthr
acèn
eC
1-P
C2-
PC
3-P
Flu
oran
thèn
eP
yrèn
eC
1-PY
C2-
PYB
(a)A
nthr
Tri
phén
ylèn
eC
hrys
ène
C1-
CHR
C2-
CHR
BFL
sC
1-BF
Ls
B(e
)Py
B(a
)Py
Pér
ylèn
eIn
déno
-Pyr
.D
BA
B(g
hi)P
éryl
ène
DB
TC
1-DB
TC
2-DB
TC
3-DB
TB
NTs
C1-
BNTs
HAP
Me-HAP
mg/kg
Contaminationaprès
0
50
100
150
200
Nap
htal
ène
C1-
NC
2-N
C3-
NC
4-N
Ace
naph
tylè
neA
cena
phtè
neF
luor
ène
C1-
FC
2-F
Phé
nant
hrèn
eA
nthr
acèn
eC
1-P
C2-
P
C3-
PF
luor
anth
ène
Pyr
ène
C1-
PYC
2-PY
B(a
)Ant
hrC
hrys
ène
C1-
CHR
C2-
CHR
B(b
j)Fl
B(k
)Fl
C1-
BFL
sB
(e)P
yB
(a)P
y
Pér
ylèn
eIn
déno
-Pyr
.D
BA
B(g
hi)P
éryl
ène
DB
TC
1-DB
TC
2-DB
TC
3-DB
T
BN
TsC
1-BN
Ts
HAP
Me-HAP
µg/kg
Source 2 HAPsed. avant
0
50
100
150
200
Nap
htal
ène
C1-
NC
2-N
C3-
NC
4-N
Ace
naph
tylè
neA
cena
phtè
neF
luor
ène
C1-
FC
2-F
Phé
nant
hrèn
eA
nthr
acèn
e
C1-
PC
2-P
C3-
P
Flu
oran
thèn
eP
yrèn
e
C1-
PYC
2-PY
B(a
)Ant
hrT
riph
ényl
ène
Chr
ysèn
eC
1-CH
RC
2-CH
R
BFL
sC
1-BF
Ls
B(e
)Py
B(a
)Py
Pér
ylèn
eIn
déno
-Pyr
.D
BA
B(g
hi)P
éryl
ène
DB
TC
1-DB
TC
2-DB
TC
3-DB
T
BN
TsC
1-BN
Ts
HAP
Me-HAP
mg/kg
Source 1 HAPFioul Erika Méthodes quantitatives :
- Niveaux
- Models de mélange
- Statistiques multivariées
Méthodes qualitatives :
- Empreintes, ratiosdiagnostiques, traceurs
- Statistiques multivariées
- Manque de références avant
- Sources multiples
- Transferts et évolutiontemporelle
Contraintes :
Conférences SaferSeas CEDRE11-16 mars 2002, Brest
1. Identification et caractérisation des HAP
dans le fuel Erika : source accidentelle
Suivi d ’altération du fuel: rochers Batz s/Mer
décembre 1999 à mai 2001
Empreintes chimiques
Ratios diagnostiques
Référence pour la contamination descompartiments biotiques et abiotiques
Conférences SaferSeas CEDRE11-16 mars 2002, Brest
PrélèvementsPrélèvements du fuel du fuel
Epave del’Erika
Ile deNoirmoutier
Pornic
Nantes
St NazaireBelle Ile
Point de prélèvement
Analyses du fuelAnalyses du fuel
Fuel de référence - Dunkerque
Composition élémentaire
Grandes familles chimiques
Caractérisation moléculaire
Suivi mensuel
Décembre 1999 - mai 2001
HAP CPG - SM
TOPIC 6 : Surveillance et Recherche-Développementaprès pollution
M. Jacek Tronczynski
Les leçons techniques de l’Erika et des autres accidents maritimes - Brest, 13-16 mars 2002
Conférences SaferSeas CEDRE11-16 mars 2002, Brest
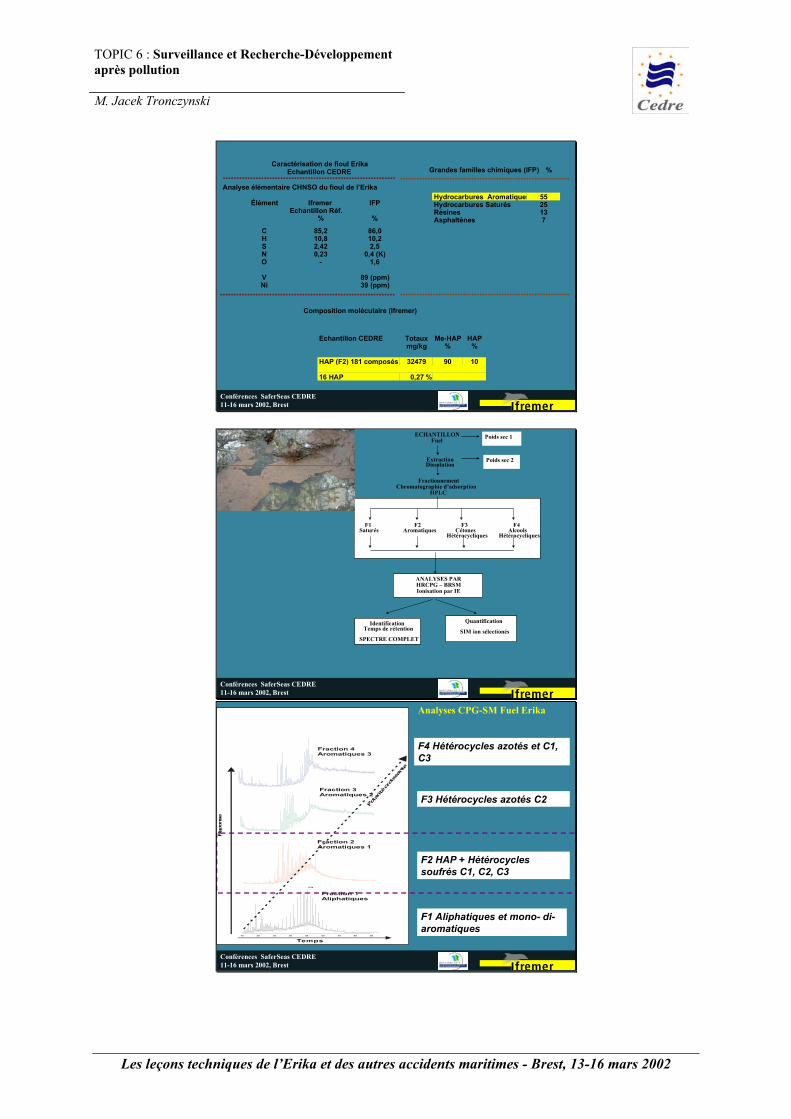
Caractérisation de fioul ErikaEchantillon CEDRE
***************************************************************Analyse élémentaire CHNSO du fioul de l’Erika
Élément IfremerEchantillon Réf.
IFP
% %
C 85,2 86,0H 10,8 10,2S 2,42 2,5N 0,23 0,4 (K)O - 1,6
V 89 (ppm)Ni 39 (ppm)
****************************************************************
Composition moléculaire (Ifremer)
Echantillon CEDRE Totaux Me-HAP HAPmg/kg % %
HAP (F2) 181 composés 32479 90 10
16 HAP 0,27 %
Grandes familles chimiques (IFP) %
Hydrocarbures Aromatiques 55Hydrocarbures Saturés 25Résines 13Asphaltènes 7
**************************************************************
**************************************************************
Conférences SaferSeas CEDRE11-16 mars 2002, Brest
ECHANTILLONFuel
FractionnementChromatographie d’adsorption
HPLC
ExtractionDissolution
F1Saturés
F2Aromatiques
F3Cétones
Hétérocycliques
F4Alcools
Hétérocycliques
ANALYSES PARHRCPG – BRSMIonisation par IE
IdentificationTemps de rétention
SPECTRE COMPLET
Quantification
SIM ion sélectionés
Poids sec 1
Poids sec 2
Conférences SaferSeas CEDRE11-16 mars 2002, Brest
Temps de rétention
10 20 30 40 50 60 70 80 90
C26
Fraction 4Aromatiques 3
Fraction 3Aromatiques 2
Fraction 2Aromatiques 1
Fraction 1Aliphatiques
Polarit
é croiss
ante
Temps
Rep
onse
F4 Hétérocycles azotés et C1,C3
F3 Hétérocycles azotés C2
Analyses CPG-SM Fuel Erika
F2 HAP + Hétérocyclessoufrés C1, C2, C3
F1 Aliphatiques et mono- di-aromatiques

TOPIC 6 : Surveillance et Recherche-Développementaprès pollution
M. Jacek Tronczynski
Les leçons techniques de l’Erika et des autres accidents maritimes - Brest, 13-16 mars 2002
Conférences SaferSeas CEDRE11-16 mars 2002, Brest
Hydrocarbures Aromatiques Polycycliques etHétérocycliques Soufrés recherchés dans les échantillons
Abréviation Masse moléculaireNaphtalène 128C1-N 142C2-N 156C3-N 170C4-N 184Acenaphtylène 152Acenaphtène 154Fluorène 166C1-F 180C2-F 194Phénanthrène 178Anthracène 178C1-P 192C2-P 206C3-P 220Fluoranthène 202Pyrène 202C1-PY 216C2-PY 230B(a)Anthr 228Triphén. 228Chrysène 228C1-CHR 242C2-CHR 242BFLs 252C1-BFls 266B(e)Py 252B(a)Py 252Pérylène 252Indéno-Pyr. 276DBA 278B(ghi)Pérylène 278
DBT 184C1-DBT 198C2-DBT 212C3-DBT 226BNTs 234C1-BNTs 248
Analyse des HAP - échantillon de référence
Fuel Erika - Dunkerque (Cedre)
Fioul de l ’Erika
Hétérocyclesoufrés
Composésalkylés
Conférences SaferSeas CEDRE11-16 mars 2002, Brest
Évolution des concentrations en HAP rochers Batz s/Mer
0
10000
20000
30000
40000
déc-
99
janv
-00
mar
s-00
avr-
00
juin
-00
juil-
00
sept
-00
oct-0
0
nov-
00
janv
-01
févr
-01
DATE
HAP mg/kg fioul
Fioul ERIKA
0
20
40
60
80
100
120
CEDRE PLAGE1 PLAGE2 ROCHER1
(%) ps sec CH2Cl2
déc-99 déc-99 jan-00
Conférences SaferSeas CEDRE11-16 mars 2002, Brest
-20
0
20
40
60
80
100
100 120 140 160 180 200 220 240 260 280 300
Molecular weight
% L
oss
HAPME-HAP
% perte en fonction du poids moléculaire
Erika référence Dunkerque vs échantillons déc-99 et jan-00
TOPIC 6 : Surveillance et Recherche-Développementaprès pollution
M. Jacek Tronczynski
Les leçons techniques de l’Erika et des autres accidents maritimes - Brest, 13-16 mars 2002
Conférences SaferSeas CEDRE11-16 mars 2002, Brest
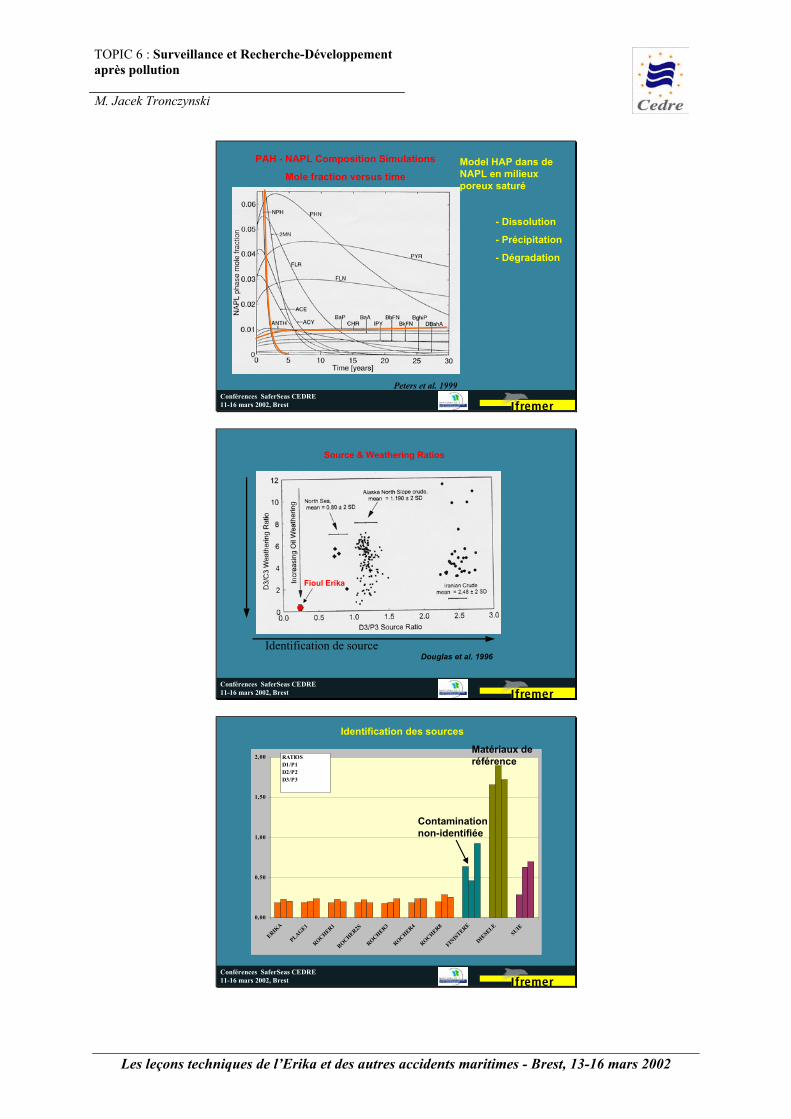
PAH - NAPL Composition Simulations
Mole fraction versus time
Peters et al. 1999
Model HAP dans deNAPL en milieuxporeux saturé
- Dissolution
- Précipitation
- Dégradation
Conférences SaferSeas CEDRE11-16 mars 2002, Brest
Source & Weathering Ratios
Douglas et al. 1996
Fioul Erika
Identification de source
Conférences SaferSeas CEDRE11-16 mars 2002, Brest
0,00
0,50
1,00
1,50
2,00
ERIKA
PLAGE1
ROCHER1
ROCHER2S
ROCHER3
ROCHER4
ROCHER8
FINIS
TERE
DIESELE
SUIE
RATIOSD1/P1D2/P2D3/P3
Identification des sources
Contaminationnon-identifiée
Matériaux deréférence
TOPIC 6 : Surveillance et Recherche-Développementaprès pollution
M. Jacek Tronczynski
Les leçons techniques de l’Erika et des autres accidents maritimes - Brest, 13-16 mars 2002
Conférences SaferSeas CEDRE11-16 mars 2002, Brest
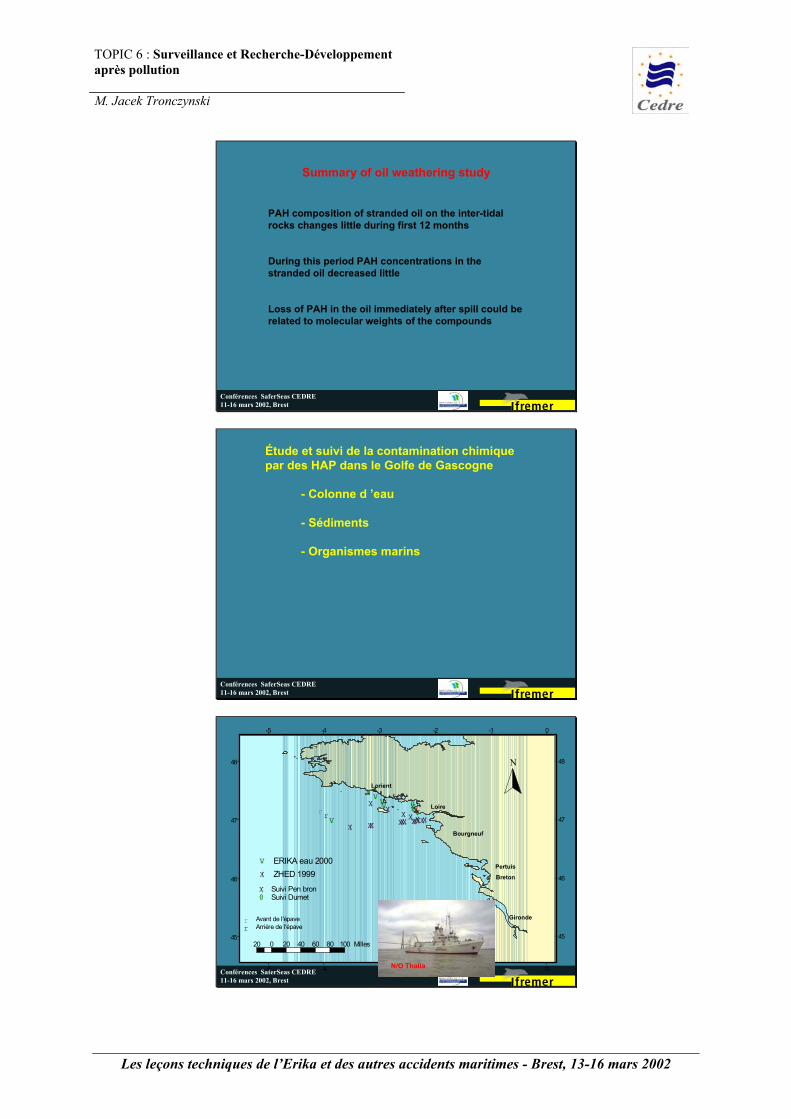
Summary of oil weathering study
PAH composition of stranded oil on the inter-tidalrocks changes little during first 12 months
During this period PAH concentrations in thestranded oil decreased little
Loss of PAH in the oil immediately after spill could berelated to molecular weights of the compounds
Conférences SaferSeas CEDRE11-16 mars 2002, Brest
Étude et suivi de la contamination chimique par des HAP dans le Golfe de Gascogne
- Colonne d ’eau
- Sédiments
- Organismes marins
Conférences SaferSeas CEDRE11-16 mars 2002, Brest
20 0 20 40 60 80 100 Milles
N
rr
-5
-5
-4
-4
-3
-3
-2
-2
-1
-1
0
0
45 45
46 46
47 47
48 48
Lorient
Loire
Bourgneuf
Pertuis
Breton
Gironde
r Arrière de l'épaver Avant de l'épave
&V&V&V&V
&V&V&V&V
&V ERIKA eau 2000
(X(X (X(X (X(X(X (X(X
(X(X
(X (X (X(X(X
(X ZHED 1999
#0(X
#0 Suivi Dumet(X Suivi Pen bron
N/O Thalia
TOPIC 6 : Surveillance et Recherche-Développementaprès pollution
M. Jacek Tronczynski
Les leçons techniques de l’Erika et des autres accidents maritimes - Brest, 13-16 mars 2002
Conférences SaferSeas CEDRE11-16 mars 2002, Brest
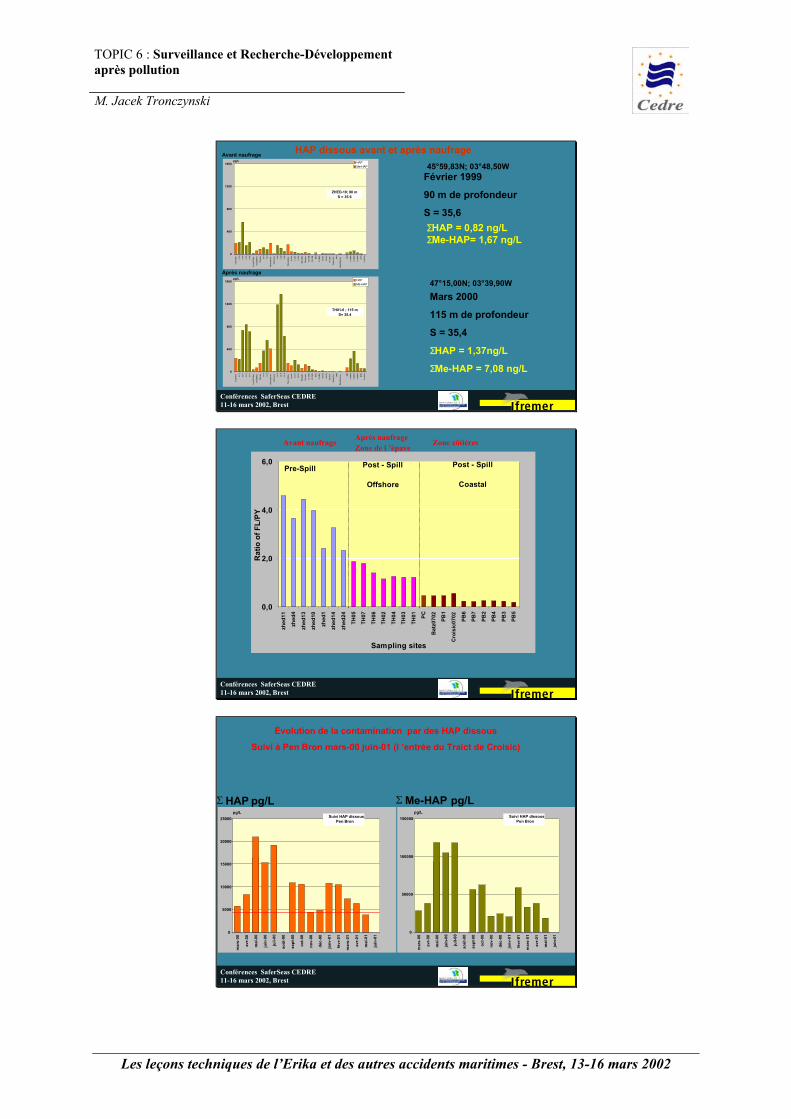
Avant naufrage
0
400
800
1200
1600
Nap
htal
ène
C1-
N
C2-
N
C3-
N
C4-
N
Ace
naph
tylè
ne
Ace
naph
tène
Fluo
rène
C1-
F
C2-
F
Phén
anth
rène
Ant
hrac
ène
C1-
P
C2-
P
C3-
P
Fluo
rant
hène
Pyrè
ne
C1-
PY
C2-
PY
B(a
)Ant
hr
Chr
ysèn
e
C1-
CH
R
C2-
CH
R
BFL
s
C1-
BFl
s
B(e
)Py
B(a
)Py
Péry
lène
Indé
no-P
yr.
DB
A
B(g
hi)P
éryl
ène DB
T
C1-
DB
T
C2-
DB
T
C3-
DB
T
BN
Ts
C1-
BN
Ts
HAPMe-HAP
ZHED-10; 90 mS = 35,6
pg/L
Après naufrage
0
400
800
1200
1600
Nap
htal
ène
C1-
N
C2-
N
C3-
N
C4-
N
Ace
naph
tylè
ne
Ace
naph
tène
Fluo
rène
C1-
F
C2-
F
Phén
anth
rène
Ant
hrac
ène
C1-
P
C2-
P
C3-
P
Fluo
rant
hène
Pyrè
ne
C1-
PY
C2-
PY
B(a
)Ant
hr
Chr
ysèn
e
C1-
CH
R
C2-
CH
R
BFL
s
C1-
BFl
s
B(e
)Py
B(a
)Py
Péry
lène
Indé
no-P
yr.
DB
A
B(g
hi)P
éryl
ène DB
T
C1-
DB
T
C2-
DB
T
C3-
DB
T
BN
Ts
C1-
BN
Ts
HAPMe-HAP
TH01-6 ; 115 mS= 35,4
pg/L
Février 1999
90 m de profondeur
S = 35,6
45°59,83N; 03°48,50W
Mars 2000
115 m de profondeur
S = 35,4
ΣHAP = 1,37ng/L
ΣMe-HAP = 7,08 ng/L
47°15,00N; 03°39,90W
ΣHAP = 0,82 ng/LΣMe-HAP= 1,67 ng/L
HAP dissous avant et après naufrage
Conférences SaferSeas CEDRE11-16 mars 2002, Brest
0,0
2,0
4,0
6,0
zhed
11
zhed
4
zhed
13
zhed
10
zhed
1
zhed
14
zhed
24
TH05
TH07
TH06
TH02
TH04
TH03
TH01 PC
Bat
z070
2
PB1
Cro
isic
0702 PB
6
PB7
PB2
PB4
PB3
PB5
Sampling sites
Rat
io o
f FL/
PY
Pre-Spill Post - Spill
Offshore
Post - Spill
Coastal
Avant naufrage Après naufrageZone de l ’épave
Zone côtières
Conférences SaferSeas CEDRE11-16 mars 2002, Brest
Σ HAP pg/L
0
5000
10000
15000
20000
25000
mar
s-00
avr-
00
mai
-00
juin
-00
juil-
00
août
-00
sept
-00
oct-0
0
nov-
00
déc-
00
janv
-01
févr
-01
mar
s-01
avr-
01
mai
-01
juin
-01
Suivi HAP dissousPen Bron
pg/L
Σ Me-HAP pg/L
0
50000
100000
150000
mar
s-00
avr-
00
mai
-00
juin
-00
juil-
00
août
-00
sept
-00
oct-0
0
nov-
00
déc-
00
janv
-01
févr
-01
mar
s-01
avr-
01
mai
-01
juin
-01
Suivi HAP dissousPen Bron
pg/L
Évolution de la contamination par des HAP dissous
Suivi à Pen Bron mars-00 juin-01 (l ’entrée du Traict de Croisic)
TOPIC 6 : Surveillance et Recherche-Développementaprès pollution
M. Jacek Tronczynski
Les leçons techniques de l’Erika et des autres accidents maritimes - Brest, 13-16 mars 2002
Conférences SaferSeas CEDRE11-16 mars 2002, Brest
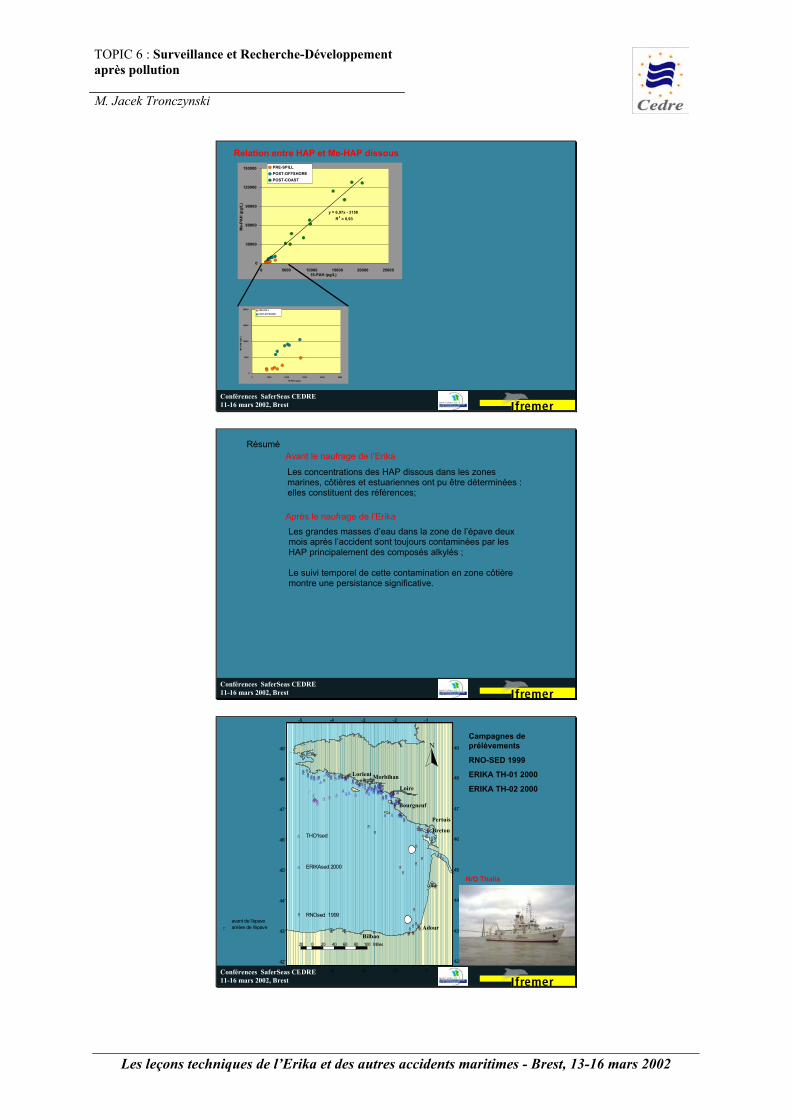
Relation entre HAP et Me-HAP dissous
y = 6,97x - 3158R2 = 0,93
0
30000
60000
90000
120000
150000
0 5000 10000 15000 20000 2500016-PAH (pg/L)
Me-
PAH
(pg/
L)
PRE-SPILLPOST-OFFSHOREPOST-COAST
0
5000
10000
15000
20000
0 1000 2000 3000 4000 5000
16-PAH (pg/L)
Me-
PAH
(pg/
L)
PRE-SPILL
POST-OFFSHORE
Conférences SaferSeas CEDRE11-16 mars 2002, Brest
RésuméAvant le naufrage de l’Erika
Après le naufrage de l’Erika
Les grandes masses d’eau dans la zone de l’épave deuxmois après l’accident sont toujours contaminées par lesHAP principalement des composés alkylés ;
Le suivi temporel de cette contamination en zone côtièremontre une persistance significative.
Les concentrations des HAP dissous dans les zonesmarines, côtières et estuariennes ont pu être déterminées :elles constituent des références;
Conférences SaferSeas CEDRE11-16 mars 2002, Brest
N
20 0 20 40 60 80 100 Milles
-5
-5
-4
-4
-3
-3
-2
-2
-1
-1
42 42
43 43
44 44
45 45
46 46
47 47
48 48
49 49
BilbaoAdour
Lorient
Loire
Bourgneuf
Pertuis
Breton
rr
r arrière de l'épaver avant de l'épave
Morbihan
"8"8"8
"8
"8"8 "8"8"8"8"8"8
"8
"8
"8"8
"8"8 "8"8"8
"8
"8"8
"8"8"8"8"8
"8 "8"8
"8"8"8"8"8"8
"8"8"8"8"8"8"8"8"8"8"8"8"8"8"8
"8"8"8
"8"8"8"8"8"8"8"8"8
"8 "8"8"8"8"8
"8"8"8"8
"8"8
"8
"8
"8"8"8"8"8
"8
"8"8"8"8"8
"8 "8"8"8"8
"8 RNOsed 1999
ââââ
âââââââââââ
âââ
â âââ
ââââ
â
âââ
â
âââ
âââââ
âââ
ââ
ââ
â
â
â
â
â
ââ
ââ
â
â
â
ââ
âââ
â ERIKAsed 2000
ðððððððððð
ð THO1sed
Campagnes deprélèvements
RNO-SED 1999
ERIKA TH-01 2000
ERIKA TH-02 2000
N/O Thalia
TOPIC 6 : Surveillance et Recherche-Développementaprès pollution
M. Jacek Tronczynski
Les leçons techniques de l’Erika et des autres accidents maritimes - Brest, 13-16 mars 2002
Conférences SaferSeas CEDRE11-16 mars 2002, Brest
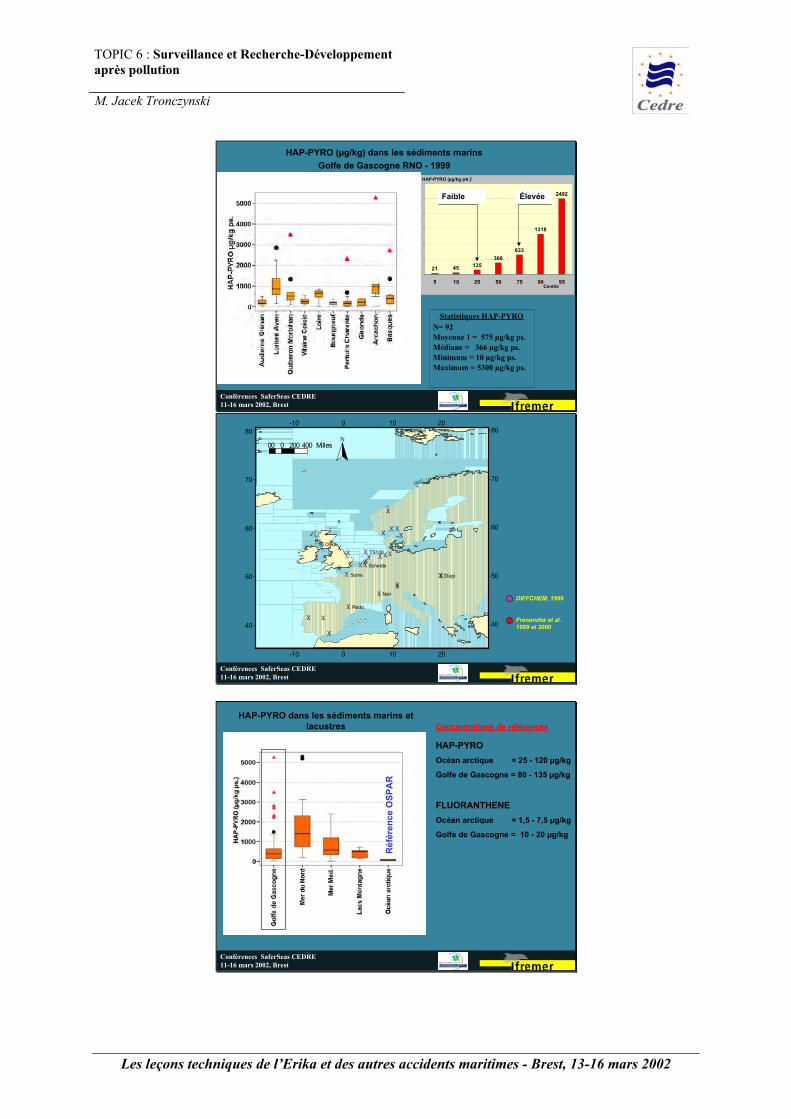
HAP-PYRO (µg/kg) dans les sédiments marinsGolfe de Gascogne RNO - 1999
21 45 135366
633
1318
2492
0
500
1000
1500
2000
2500
3000
5 10 25 50 75 90 95Centile
HAP-PYRO (µg/kg ps.)
Faible Élevée
Statistiques HAP-PYRON= 92Moyenne 1 = 575 µg/kg ps.Médiane = 366 µg/kg ps.Minimum = 10 µg/kg ps.Maximum = 5300 µg/kg ps.
Conférences SaferSeas CEDRE11-16 mars 2002, Brest
(X
(X
(X
(X (X
(X(X
(X
(X(X(X(X(X(X
(X(X(X
(X(X(X
(X
(X
(X (X
(X
(X
(X(X(X
(X(X
(X
(X
(X
Redo
Noir
Dlugi
Spitsbergen
Clyde
Seine
Schelde
TS100
-10
-10
0
0
10
10
20
20
40 40
50 50
60 60
70 70
80 80
00 0 200 400 MillesN
DIFFCHEM, 1996
Frenandez et al.1999 et 2000
Conférences SaferSeas CEDRE11-16 mars 2002, Brest
HAP-PYROOcéan arctique = 25 - 120 µg/kg
Golfe de Gascogne = 80 - 135 µg/kg
HAP-PYRO dans les sédiments marins etlacustres
FLUORANTHENEOcéan arctique = 1,5 - 7,5 µg/kg
Golfe de Gascogne = 10 - 20 µg/kg
Concentrations de références
Réf
éren
ce O
SPA
R
TOPIC 6 : Surveillance et Recherche-Développementaprès pollution
M. Jacek Tronczynski
Les leçons techniques de l’Erika et des autres accidents maritimes - Brest, 13-16 mars 2002
Conférences SaferSeas CEDRE11-16 mars 2002, Brest
0 100 200 300 400 500 600 700 800
HAP1999
1996
1988
1981
1973
1965
1954
MeHAP
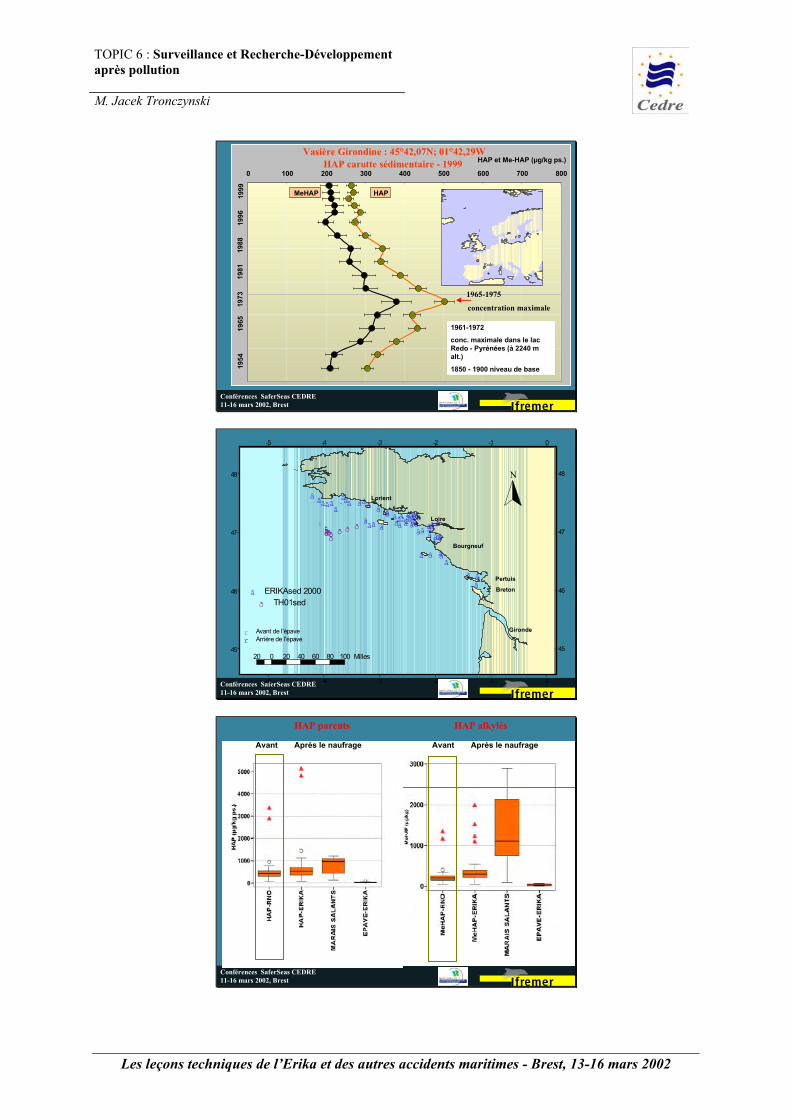
HAP et Me-HAP (µg/kg ps.) Vasière Girondine : 45°42,07N; 01°42,29W
HAP carotte sédimentaire - 1999
0
100
200
300
400
500
600
0 100 200 300 400 500 600
R²= 0,94
1961-1972conc. maximale dans le lacRedo - Pyrénées (à 2240 malt.)
1850 - 1900 niveau de base
0
100
200
300
400
500
600
0 100 200 300 400 500 600
Redo
1965-1975
concentration maximale
Conférences SaferSeas CEDRE11-16 mars 2002, Brest
20 0 20 40 60 80 100 Milles
N
rr
-5
-5
-4
-4
-3
-3
-2
-2
-1
-1
0
0
45 45
46 46
47 47
48 48
r Arrière de l'épaver Avant de l'épave
Lorient
Loire
Bourgneuf
Pertuis
Breton
Gironde
ââââ
ââââââââââââ ââ
â âââ
ââââ
â
âââ
â
ââââââââ
ââââ
â
ââ
â
â
â
â
â
ââ
ââ
â
â
â
ââ
âââ
â ERIKAsed 2000
ððððð
ððððð
ð TH01sed
Conférences SaferSeas CEDRE11-16 mars 2002, Brest
Avant Après le naufrage
HAP parents
Avant Après le naufrage
HAP alkylés

TOPIC 6 : Surveillance et Recherche-Développementaprès pollution
M. Jacek Tronczynski
Les leçons techniques de l’Erika et des autres accidents maritimes - Brest, 13-16 mars 2002
Conférences SaferSeas CEDRE11-16 mars 2002, Brest
0
50
100
150
200
250
Nap
htha
lene
C1-
N
C2-
N
C3-
N
C4-
N
Fluo
rene
C1-
F
C2-
F
Phen
anth
rene
Ant
hrac
ene
C1-
P
C2-
P
C3-
P
Fluo
rant
hene
Pyre
ne
C1-
Py
C2-
Py
B(a
)Ant
hr
Chr
ysen
e/Tr
iph
C1-
CH
R
C2-
CH
R
BFL
s
C1-
BFL
s
B(e
)Py
B(a
)Py
Pery
lene
I(123
cd)P
y
D(a
h)(a
c)A
Pice
ne
B(g
hi)P
DBT
C1-
DB
T
C2-
DB
T
C3-
DB
T
BNT
s
C1-
BN
Ts
µg/kg
0
50
100
150
200
250
Nap
htal
ène
C1-
N
C2-
N
C3-
N
C4-
N
Ace
naph
tylè
ne
Ace
naph
tène
Fluo
rène
C1-
F
C2-
F
Phén
anth
rène
Ant
hrac
ène
C1-
P
C2-
P
C3-
P
Fluo
rant
hène
Pyrè
ne
C1-
PY
C2-
PY
B(a
)Ant
hr
Trip
hény
lène
Chr
ysèn
e
C1-
CH
R
C2-
CH
R
BFL
s
C1-
BFL
s
B(e
)Py
B(a
)Py
Péry
lène
Indé
no-P
yr.
DBA
B(g
hi)P
éryl
ène
DBT
C1-
DB
T
C2-
DB
T
C3-
DB
T
BNT
s
C1-
BN
Ts
µg/kg
HAP
Me-HAP
Baie de Bourgneuf
AVANT
APRES
Conférences SaferSeas CEDRE11-16 mars 2002, Brest
0
700
1400
2100
2800
3500
0 1000 2000 3000 4000 5000 6000
HAP (µg/kg ps.)
Me-
HA
P (µ
g/kg
ps.
)
RNO-1999CAROTTE-10-99ER-2000Marais-2000Epave-2000
Cont
amin
atio
n Er
ika
Contamination chronique
Moules
Conférences SaferSeas CEDRE11-16 mars 2002, Brest
0,00 0,25 0,50 0,75 1,00
0,00
0,25
0,50
0,75
1,00 0,00
0,25
0,50
0,75
1,00
RNO-Me
RNO-
HAP
ERIKA
Audierne Glénan
Rade de Lorient
Baie de Vilaine
Baie de Bourganeuf
Épave Erika
Marais salantsGuérande et Més

TOPIC 6 : Surveillance et Recherche-Développementaprès pollution
M. Jacek Tronczynski
Les leçons techniques de l’Erika et des autres accidents maritimes - Brest, 13-16 mars 2002
Conférences SaferSeas CEDRE11-16 mars 2002, Brest
RésuméAvant le naufrage de l’Erika
Les sédiments superficiels du Golfe de Gascognemontrent une contamination par les HAP liée aux sourcesdes grandes agglomérations urbaines ;
Les HAP portent des signatures chimiques relativementhomogènes ;
Après le naufrage de l’Erika
La contamination importante par les HAP liée au fiould’Erika peut être mise en évidence dans les sédimentsintertidaux plus particulièrement dans la Baie deBourgneuf et dans la zone d’alimentation des maraissalants de Guérande et du Mes ;
On distingue une contamination due au fioul d’Erika dansles sédiments subtidaux ainsi que dans quelqueséchantillons isolés de la Baie de Vilaine et dans le traict duCroisic.