
Appendices Page Appendix 1: Appendix 2: What price for a ...

TOPIC 4:SOLUTIONS
APPENDICES
Appendix 4.1: Polar and Non-polar Substances 3Appendix 4.2: Why Don’t Water and Oil Mix? 7Appendix 4.3: Constructing a Solubility Curve 8Appendix 4.4: Unsaturated, Saturated, and Supersaturated Solutions 13Appendix 4.5: Crystals and Crystal Growing 15Appendix 4.6: Solubility Curve 17Appendix 4.7: The Effects of Salt and Antifreeze on the Melting Point of Ice 18Appendix 4.8: The Effect of Antifreeze on the Boiling Point of Water 19Appendix 4.9: Heat Transfer: I Scream, You Scream, We All Scream for
Ice Cream 20Appendix 4.10: The Effect of Salt on the Melting Point of Ice 22Appendix 4.11: A WebQuest for Solubility Units 25Appendix 4.12: Solutions: A Scavenger Hunt 26


PurposeIn this lab, you will discover which substances, when mixed, will form solutions.You will also create a general rule about solutions created from polar and non-polarsubstances.
Materials • goggles• test tubes • test tube rack• rubber stoppers• graduated cylinder (10 mL)• paper towels• scoopulas• Material Safety Data Sheets (MSDS)
Substances• Polar Substances
— copper(II) sulphate crystals, CuSO4
— water, H2O— vinegar
• Non-polar Substances— solid iodine crystals — vegetable oil— kerosene
Procedure1. Using the following chart as a guide, mix all possible combinations of the
substances above. The teacher will show you how much solid to add.2. If the substance is a liquid, then use 10 mL. 3. If the solution is a solid to be mixed with a liquid, then add the solid first to a
clean, dry test tube. 4. Once the substances are added to the test tubes they should be swirled to mix.5. Dispose of the solutions as directed by the teacher.
GRADE 11 CHEMISTRY • Topic 4 Appendices
Topic 4 Appendices – 3
Appendix 4.1: Polar and Non-polar Substances
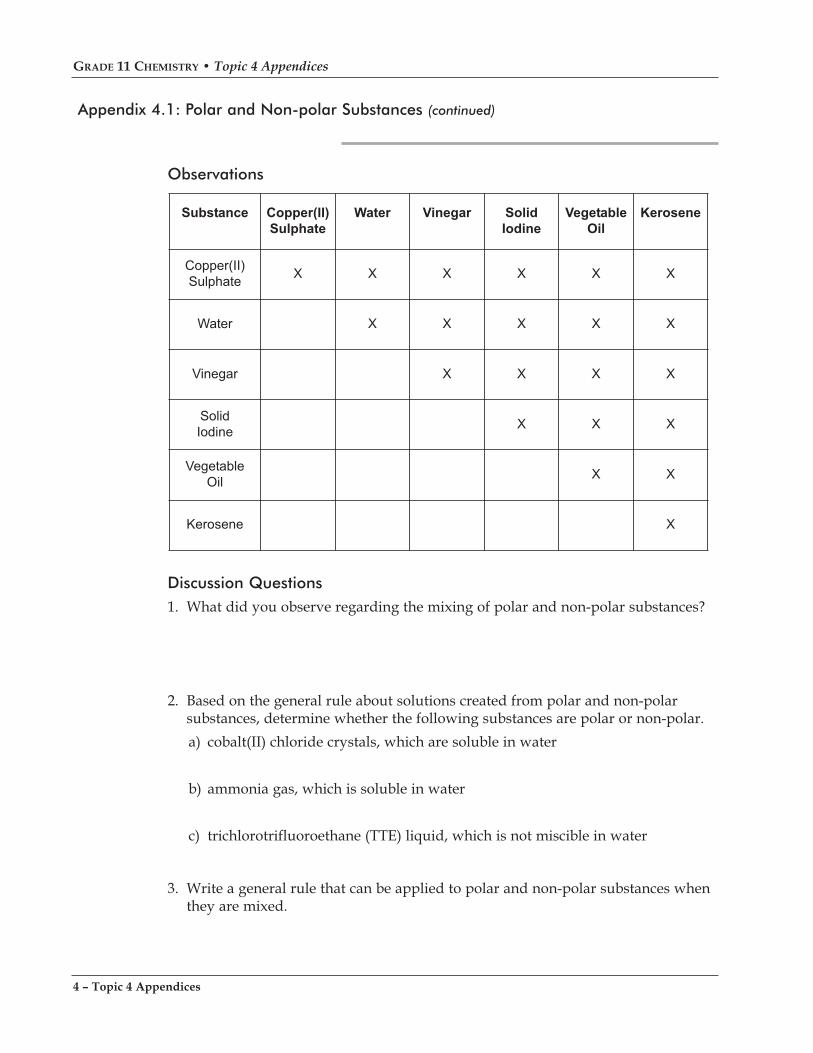
Observations
Discussion Questions1. What did you observe regarding the mixing of polar and non-polar substances?
2. Based on the general rule about solutions created from polar and non-polarsubstances, determine whether the following substances are polar or non-polar.a) cobalt(II) chloride crystals, which are soluble in water
b) ammonia gas, which is soluble in water
c) trichlorotrifluoroethane (TTE) liquid, which is not miscible in water
3. Write a general rule that can be applied to polar and non-polar substances whenthey are mixed.
Substance Copper(II)
Sulphate
Water Vinegar Solid
Iodine
Vegetable
Oil
Kerosene
Copper(II)
SulphateX X X X X X
Water X X X X X
Vinegar X X X X
Solid
IodineX X X
Vegetable
OilX X
Kerosene X
GRADE 11 CHEMISTRY • Topic 4 Appendices
4 – Topic 4 Appendices
Appendix 4.1: Polar and Non-polar Substances (continued)

PurposeThe purpose of this lab is to have students to discover the relationship betweenpolar and non-polar substances when mixed (i.e., “like dissolves like”).
Procedure and PrecautionsReview the current Material Safety Data Sheet (MSDS) for each of the substanceswith students and have the data sheets available during the lab in case of anaccident. First aid treatment instructions are provided on each MSDS.
The approximate amount of solid iodine required for the lab should be placed in abeaker that is, in turn, placed on a clearly labelled paper towel in a fume hood. Anysolid iodine left over after the experiment should be disposed of using WorkplaceHazardous Materials Information System (WHMIS) procedures.
By placing a few crystals of each solid on a watch glass, students will understandhow much to use for each solution. Have students transfer the crystals directly intotheir test tubes at the dispensing site.
Samples of the other substance should also be placed on clearly labelled papertowels. If an automatic dispensing pipette is available, the liquids should bedispensed in this manner with the set screw adjusted to 10 mL. Otherwise, a clean10 mL graduated cylinder should be available for each liquid to be measured bystudents.
Note: Placing food dye into the liquid mixtures will identify the polar solvents.
Answer Key1. Student observations:
• Typical observations for the immiscible liquid combinations will be: — They do not mix.— They separate into layers.— They mix when shaken but gradually separate out into distinct layers.
• Iodine should not dissolve and go into solution with water, as iodine andwater are “unlike” components.
• The same is true for kerosene and copper sulphate.
2. a) Cobalt(II) chloride must be polar, as it dissolves in polar water.b) Ammonia gas must be polar, as it dissolves in water.c) TTE must be non-polar, as it does not dissolve in polar water.
GRADE 11 CHEMISTRY • Topic 4 Appendices
Topic 4 Appendices – 5
Appendix 4.1: Polar and Non-polar Substances (Teacher Notes)
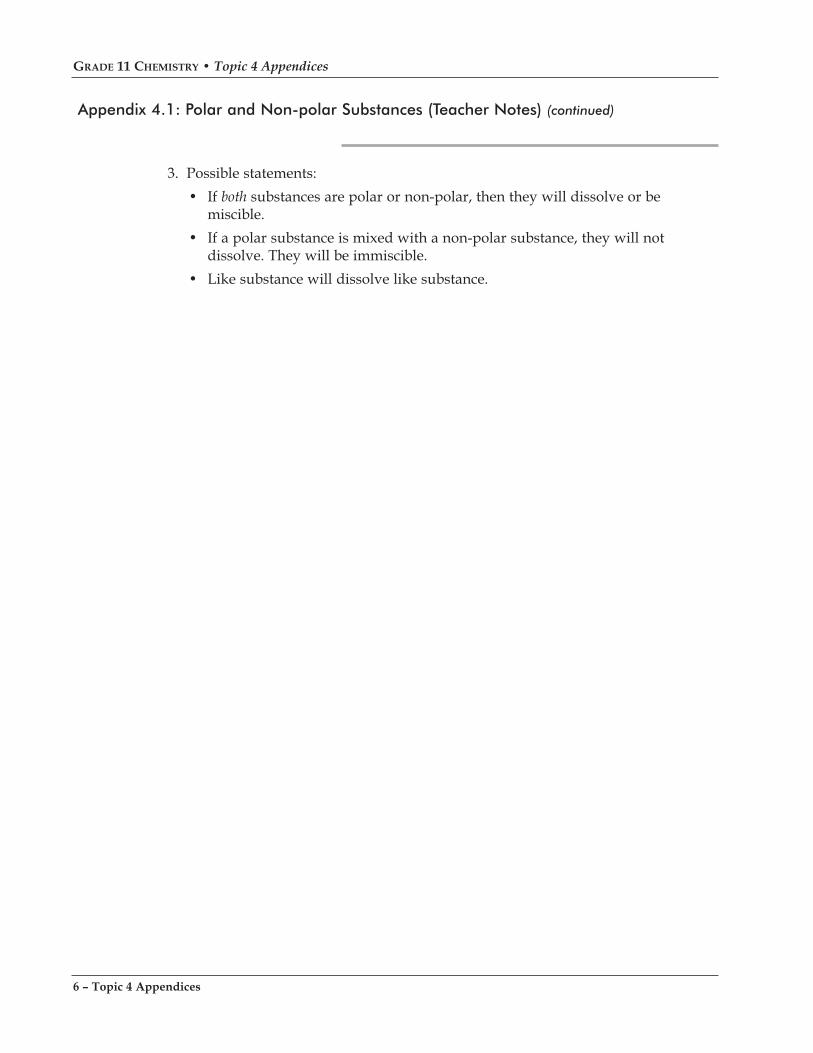
3. Possible statements:• If both substances are polar or non-polar, then they will dissolve or be
miscible.• If a polar substance is mixed with a non-polar substance, they will not
dissolve. They will be immiscible.• Like substance will dissolve like substance.
GRADE 11 CHEMISTRY • Topic 4 Appendices
6 – Topic 4 Appendices
Appendix 4.1: Polar and Non-polar Substances (Teacher Notes) (continued)

Use the following demonstrations to help students develop an understanding of themolecular interactions between polar and non-polar molecules.
Demonstration A1. Cut ovals (2 cm x 3 cm) and rectangles (2 cm x 3 cm) from an acetate sheet.
• Using black markers, label one end of the oval positive (+), and the other endnegative (–). The ovals represent polar water molecules.
• Using a different colour of marker, label the rectangles as neutral. Therectangles represent oil molecules.
2. Place the ovals and rectangles on the overhead projector and ask students topredict what will happen. Students will likely predict that the negative end ofone oval will attract the positive end of another oval. Matching the ovals in thisway results in the expulsion of the rectangles, producing two layers—one layerof polar molecules and a second layer of non-polar molecules.
3. Relate this demonstration to the attraction of water, a polar substance, to anelectrostatically charged comb.
4. Discuss hydrogen bonding and dipole-dipole interactions.
Demonstration B1. Place the magnetic stir bars and clear marbles into a petri dish (see Figure A).
• The stir bars represent polar molecules. • The marbles represent non-polar molecules. Ask students to predict what will happen when the dish is agitated. Shake thepetri dish (see Figure B). This motion results in a separation of the two phases(i.e., the magnets attract each other and exclude the marbles).
2. Add different shaped stir bars (another polar substance) and coloured marbles(another non-polar substance) to the petri dish. Ask students to predict what willhappen when the dish is agitated. Shake the petri dish (see Figure C). Again, thepolar molecules will be attracted to each other and exclude the non-polarmolecules, thus creating two distinct regions.
3. This demonstration illustrates the concept of “like dissolves like.”
����
���
�
����
���
�
���
�
����
����
���
�
����
���
�
����
����
���� ���� ����
����
�������
�
��������
���
���� ��
��� ��
������������������� ����������
������������ ��������������
������ ������ �����
GRADE 11 CHEMISTRY • Topic 4 Appendices
Topic 4 Appendices – 7
Appendix 4.2: Why Don’t Water and Oil Mix? (Demonstrations—Teacher Notes)

Pre-Lab DiscussionThe amount of solute required to achieve a saturated solution in water dependsupon the temperature. Most solid solutes increase in solubility as temperatureincreases in a liquid solution. A solubility curve can be created by varying theamount of solute, keeping the amount of solvent constant, and determining at whattemperature all the solute dissolves (or conversely, we can see when the soluteparticles start to reappear as we slowly cool the solution).
In this experiment, student groups will be assigned a specific amount of solute todissolve. There are two procedures that will introduce a significant error into theresults: the measurement of both the solid and the temperature when precipitationoccurs. The temperature can be checked, whereas the solid measurement can bedone only ONCE. After the graphs have been drawn from the class data, it will bevery obvious whose data are incorrect.
Problem At what temperature does the given amount of solute precipitate?
Materials • ammonium chloride, NH4Cl• distilled water• graduated cylinder• balance• filter paper• scoopula• Bunsen burner• matches• 2 thermometers• thermometer clamps• 30 cm length of 18-gauge copper wire
(Bend the wire into a large loop to go around the thermometer to stir thesolution. The end of the wire should extend well above the top of the test tube.)
• test tubes (20 x 200 mL)• beaker (400 mL)• tap water
Procedure1. Mass out exactly _____ g of NH4Cl.
2. Measure out exactly 20 mL of distilled water in a graduated cylinder.
GRADE 11 CHEMISTRY • Topic 4 Appendices
8 – Topic 4 Appendices
Appendix 4.3: Constructing a Solubility Curve

3. Place both the water and the solute into a large test tube and stir with the copperwire instrument you created. Place one thermometer into the test tube and asecond thermometer into a water bath. Wherever possible, use a specializedthermometer clamp to hold the thermometer off the bottom of the test tube.
4. Use a hot water bath to heat the solution about 10°C higher than the point atwhich the solute looks entirely dissolved.
5. Allow the solution to cool, with constant stirring, and record the temperaturewhen the solute begins to precipitate out. The precipitate may be very obvious,or the solution may just begin to look cloudy.
6. Repeat steps 4 and 5 two more times. Remember, you should heat solutions toabout 10°C higher than the temperature you will actually record each time. Takethe temperature after a cooling period has elapsed and a precipitate just becomesvisible.
7. Record the data in the table provided.8. Examine the temperature data. Discard unreasonable data, and perform steps 4
and 5 until three sets of comparable data are achieved. Average the three besttemperatures used.
Observations
Group Data
Solubility
(g/20 g of Water)
Solubility
(g/100 g of Water)
Temperature
(°C)
Individual Data
Trial # Temperature
(°C)
#1
#2
#3
#4
#5
Average
GRADE 11 CHEMISTRY • Topic 4 Appendices
Topic 4 Appendices – 9
Appendix 4.3: Constructing a Solubility Curve (continued)
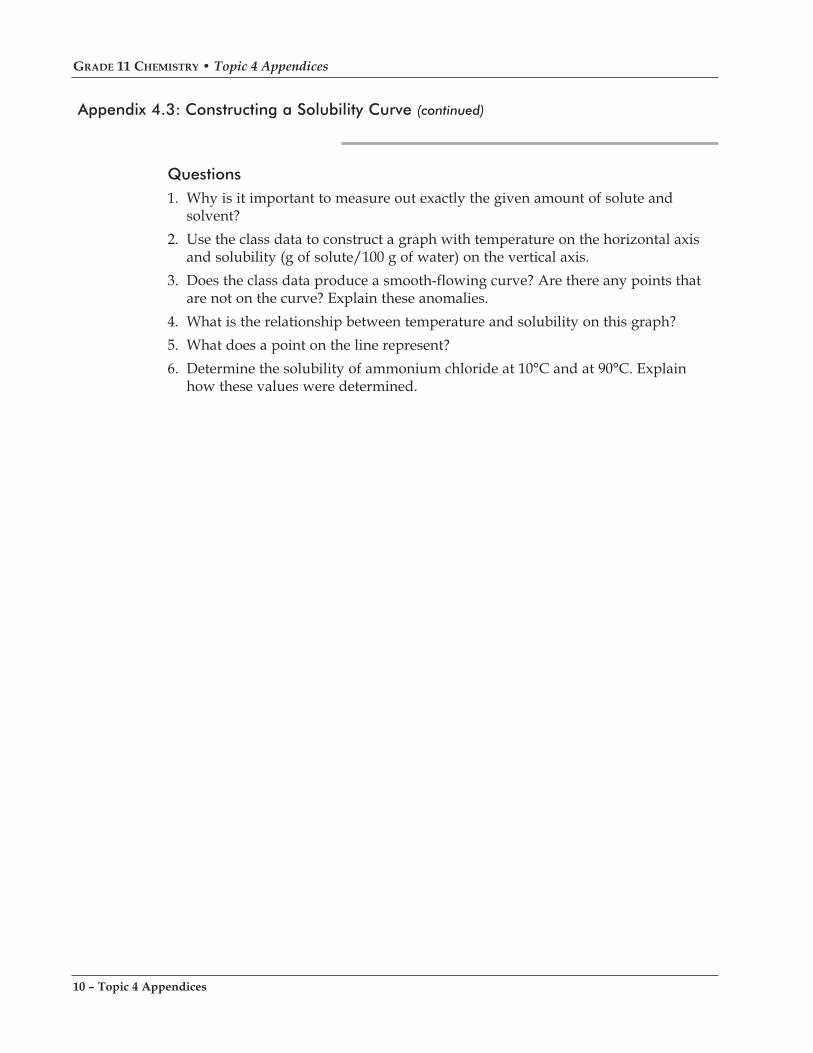
Questions1. Why is it important to measure out exactly the given amount of solute and
solvent?2. Use the class data to construct a graph with temperature on the horizontal axis
and solubility (g of solute/100 g of water) on the vertical axis.3. Does the class data produce a smooth-flowing curve? Are there any points that
are not on the curve? Explain these anomalies. 4. What is the relationship between temperature and solubility on this graph?5. What does a point on the line represent?6. Determine the solubility of ammonium chloride at 10°C and at 90°C. Explain
how these values were determined.
GRADE 11 CHEMISTRY • Topic 4 Appendices
10 – Topic 4 Appendices
Appendix 4.3: Constructing a Solubility Curve (continued)

Having students collect data for all the points on the solubility curve is unnecessary.For this experiment it is suggested that student groups be assigned a specificamount of solute to dissolve. Students can carefully collect data for one of the pointson the curve and still develop the necessary lab skills. Another option would be tohave student groups collect data for more than one point on the curve.
Teachers have the option of providing students with the following information toencourage them to produce their best work and to strive for accuracy and precision.There are, of course, two procedures that will introduce a significant error into theresults: the measurement of the solid and the temperature when precipitationoccurs. The temperature can be checked and averaged, whereas the solidmeasurement can be done only ONCE. After the graphs have been drawn from theclass data, it will be very obvious whose data are incorrect.
Below are the recommended amounts of solute to assign to lab groups to producethe best solubility curve. If there are more than six groups, then multiples of onemass of solute will provide a greater degree of precision. Note that three significantfigures are suggested.
The solubility curve for ammonium chloride, NH4Cl, can be found in mostchemistry texts.
Extensions1. Have students discuss the instances of experimental errors.
2. Students could use Vernier’s Graphical Analysis® software (provided under aprovincial site licensing agreement) to graph the curve and determine amathematical relationship for solubility and temperature.
3. Have one group conduct several trials when stirring and when not stirring thesolution.
Recommended Amounts of Solute to Dissolve
Lab
Group
Grams of NH4Cl/
20 g of Water
Temperature
(°C)
#1
#2
#3
#4
#5
#6
8.00 g
9.00 g
10.00 g
11.00 g
12.00 g
13.00 g
~28°C
~39°C
~50°C
~60°C
~70°C
~78°C
GRADE 11 CHEMISTRY • Topic 4 Appendices
Topic 4 Appendices – 11
Appendix 4.3: Constructing a Solubility Curve (Teacher Notes)

Answers to Questions and Discussion1. If an incorrect amount of solute is measured out, the temperature results will not
produce a point that will fit a smooth-flowing curve. 2. Students draw the graph either manually or by using plotting software.3. Answers will vary. Usually, several points are not close to the best-fit curve due
to carelessness. Students will usually say that either the solid was not massedaccurately or the temperature was incorrect. If students do not stir continuously,super cooling will occur and the solid will not precipitate until the solutionreaches a lower than expected temperature. (See Extensions.)
4. The solubility of ammonium chloride is directly proportional to the temperatureof the solvent.
5. The solubility of ammonium chloride at that temperature.6. The solubility of ammonium chloride at 10°C is approximately 33 g/100g H2O,
and at 90°C it is 73 g/100g H2O. Both values were determined by extrapolationfrom the data.
GRADE 11 CHEMISTRY • Topic 4 Appendices
12 – Topic 4 Appendices
Appendix 4.3: Constructing a Solubility Curve (Teacher Notes) (continued)

ProblemTo distinguish between unsaturated, saturated, and supersaturated solutions.
Materials• sodium thiosulphate pentahydrate, Na2S2O3 • 5H2O, crystals• beaker (400 mL)• 3 test tubes (18 x 150 mm)• hot plate • stirring rod • water
Procedure1. Make a water bath by pouring about 250 mL of water into a 400 mL beaker. Place
the beaker on a hot plate, and heat the water to just boiling.2. Place about 2.5 to 3 g (1.5 to 2 cm) sodium thiosulphate crystals into an 18 x
150 mm test tube. Add 1 mL of water. Heat in the boiling water bath until allcrystals have dissolved.
3. Remove the test tube from the water bath and label it as test tube A.4. Allow test tube A and its contents to cool to room temperature (about half an hour
or overnight).5. Place about 2.5 to 3 g (1.5 to 2 cm) sodium thiosulphate crystals into an 18 x
150 mm test tube. Add 1 mL of water. Shake and stir to dissolve as much of thesolid as possible.
6. Label this test tube as B. Allow test tube B and its contents to settle and come toroom temperature.
7. Place enough sodium thiosulphate crystals into an 18 x 150 mm test tube to coverjust the bottom of the test tube (approximately 0.2 to 0.3 g). Add 3 mL of water.Shake and stir to dissolve as much of the solid as possible.
8. Label this test tube as C. Allow test tube C and its contents to settle and come toroom temperature.
9. When test tube A and its contents are cool, carefully add one small crystal ofsodium thiosulphate to each of test tubes A, B, and C. Describe your observations.
10. Hold the bottom of each test tube in your hand. Describe your observations.
QuestionsAnswer the following questions, based on your observations.1. Identify which solutions are unsaturated, saturated, and supersaturated.2. Describe the differences between unsaturated, saturated, and supersaturated
solutions.
GRADE 11 CHEMISTRY • Topic 4 Appendices
Topic 4 Appendices – 13
Appendix 4.4: Unsaturated, Saturated, and Supersaturated Solutions

The experiment is intended to show the difference between the following solutions:• an unsaturated solution (test tube C)—an added crystal dissolves in this solution• a saturated solution (test tube B)—a solid is present together with the solution, and
adding another crystal has no effect• a supersaturated solution (test tube A)—an added crystal causes the “extra” solute
to crystallize out around the seed
Students should also observe the following:• The test tube and contents become warmer as the solid crystallizes.• When making the saturated solution, dissolving requires energy, as evidenced by
test tube B and its contents becoming colder as solute dissolves.
Variations1. Prepare the three solutions (saturated, unsaturated, and supersaturated) in
advance. Give corked and labelled test tubes to students and ask them to observethe effect of adding one crystal of sodium thiosulphate pentahydrate to each testtube. These solutions can be reused several times.
2. For a microscale version of the experiment, prepare the supersaturated solutionby placing 3 and 4 cm (about a third to half full) of sodium thiosulphate in a 10 x70 mm test tube and adding 5 drops of water. Use a 100 mL beaker and 50 mL ofwater for the water bath. Heat the solution in the boiling water bath to dissolvethe solid, and allow the solution to cool to room temperature before adding asingle crystal of sodium thiosulphate.
Note: Sodium thiosulphate is also known as “hypo,” and should be readilyavailable from camera stores.
Reference: Solubility data from: Seidel, A., ed. Solubilities of Inorganic and Organic Compounds. Vol. 1.New York, NY: D. van Nostrand Co., Inc., New York, 1911.
Solubility of Sodium Thiosulphate Pentahydrate, Na2S2O3 • 5H2O, in Water
Temperature
(°C)
Grams of Na2S2O3 • 5H2O/
100 g Saturated Solution
Grams of Na2S2O3 • 5H2O/
100 g Water
0
10
20
25
30
45
33.40
37.37
41.20
43.15
47.17
55.33
50.15
59.66
70.07
75.90
91.24
123.87
GRADE 11 CHEMISTRY • Topic 4 Appendices
14 – Topic 4 Appendices
Appendix 4.4: Unsaturated, Saturated, and Supersaturated Solutions(Teacher Notes)

A. Rock Candy Sugar CrystalsThis is a popular activity because students can grow large edible sugar crystals.This activity can also be done at home.
Safety Precautions
If crystals are to be eaten, use only clean household equipment. If crystals are tobe observed only, laboratory glassware could be used.
Materials
• ½ cup (125 mL) water• small saucepan• short length of white string• pencil• 1 cup (250 mL) granulated sugar • small nut or paper clip (to act as a weight)• wooden spoon• measuring cup• tall glass• hot plate
Procedure
1. Clean all equipment thoroughly before use. 2. Tie a small nut or paper clip to one end of a clean piece of white string and tie
the other end of the string to a pencil. The string should be just long enoughto touch the bottom of the glass when the pencil is resting across the top ofthe glass.
3. Pour the sugar and water into the saucepan and stir to dissolve as much ofthe sugar as you can at room temperature. Heat the mixture on the hot plate,stirring constantly. Continue heating until all the sugar is dissolved.
4. Pour the hot syrupy solution into the glass. Hang the string, weighted downwith a nut or paper clip, into the solution.
5. Set the glass and contents aside, covered loosely with a piece of paper, in aplace where it won’t be disturbed. Check the solution daily. Break up anycrust that forms on the surface so that water can continue to evaporate ascrystals grow along the string.
GRADE 11 CHEMISTRY • Topic 4 Appendices
Topic 4 Appendices – 15
Appendix 4.5: Crystals and Crystal Growing

B. Crystals on GlassRather than growing large crystals in this activity, students produce smallcrystals rapidly, for observations on shape and form.
Materials
• petri dish, beaker, or drinking glass • magnesium sulphate, MgSO4
• sodium chloride, NaCl• sodium carbonate, Na2CO3
• copper sulphate, CuSO4
• hot plate• stirring rod
Procedure
1. Mix the appropriate amounts of solid compound and boiling water (see tablebelow). Stir to dissolve the solid completely. (If necessary, add more boilingwater. However, if the solution is too diluted it may take much longer forcrystals to appear.)
2. When all the solute has dissolved, pour just enough solution to completelycover the surface of a flat-bottomed glass container (e.g., petri dish, beaker, ordrinking glass). Set the container aside. Do not disturb while the waterevaporates.
3. Check the solution occasionally. Describe the shape of the crystals as theystart to form on the glass. Do they all have the same shape?
Compounds that yield good crystals include the following:
Compounds That Yield Good Crystals
Substance Amount of
Solute (mL)
Amount of
Boiling Water (mL)
Magnesium sulphate, MgSO4
Sodium chloride, NaCl
Sodium carbonate, Na2CO3
Copper sulphate, CuSO4
10
15
15
15
15
30
30
30
GRADE 11 CHEMISTRY • Topic 4 Appendices
16 – Topic 4 Appendices
Appendix 4.5: Crystals and Crystal Growing (continued)

��
�� �� �� �� �� �� � !� "� ���
#������������ $�
��
��
��
��
��
��
�
!�
"�
���
���
���
���
���
���%��� ����&��������'������(������)
�*�
����������� �������������������������������
+�+*�
,+*�
+)�$�+)�
+�$�
,$�*�
$���%*���
GRADE 11 CHEMISTRY • Topic 4 Appendices
Topic 4 Appendices – 17
Appendix 4.6: Solubility Curve

In this investigation you will study the effects of salt and antifreeze on the meltingpoint of ice.
Materials• beaker (250 mL)• thermometer• coarse table salt• 10 mL measure• finely crushed ice (as small as coarse sand)• antifreeze (ethylene glycol)• graduated cylinder (25 mL)• stirring rod
Procedure A: Effect of Salt on the Melting Point of Ice1. Pour crushed ice into the beaker until it is half full.2. Take the temperature of the ice while you are stirring it. Do not stir with the
thermometer. Use the stirring rod.3. When the thermometer reads 0°C, add 1 level measure of salt to the ice. Continue
stirring. Record the temperature after it stops changing.4. Continue adding 1 level measure of salt at a time, with continuous stirring and
temperature readings, until you have added 7 or 8 measures.5. Record your results in a table.6. Empty the beaker and wash it.
Procedure B: Effect of Antifreeze on the Melting Point of IceThe antifreeze used in this investigation is ethylene glycol. It is the permanent typethat comes in new cars. Repeat Procedure A, but use 15 mL of antifreeze each timeinstead of 1 level measure of salt.
Discussion1. What evidence do you have that the ice is at its melting point, even after salt and
antifreeze are added? 2. What effect does salt have on the melting point of ice?3. What effect does antifreeze have on the melting point of ice?4. Explain why salt is added to ice-covered roads.5. Explain why antifreeze is added to the water in the radiators of cars in cold areas
of the country.6. Why is salt not used in the radiators of cars?7. Where did the heat go in this experiment? In other words, how can something
get colder when you add a warmer substance to it in a warm room?_________________The Effects of Salt and Antifreeze on the Melting Point of Ice: Adapted from William A. Andrews,T.J. Elgin Wolfe, and John F. Eix, Physical Science: An Introductory Study (Scarborough, ON: Prentice-Hall of Canada, Ltd., 1978) 79–80. Adapted by permission of Pearson Education Canada.
GRADE 11 CHEMISTRY • Topic 4 Appendices
18 – Topic 4 Appendices
Appendix 4.7: The Effects of Salt and Antifreeze on the Melting Point of Ice

Most vehicle manufacturers recommend leaving the antifreeze in the radiatorduring the summer. Why would one do this?
Materials• round-bottomed flask (250 mL)• thermometer (–10°C to 110°C)• distilled water• boiling chips• Bunsen burner• ring stand• iron ring• wire gauze• 2 adjustable clamps• 50 mL antifreeze (ethylene glycol, undilute)
Safety Precaution Wear safety goggles during this investigation.
Procedure 1. Set up the apparatus as demonstrated by your teacher. Begin with 100 mL of
distilled water in the flask.2. Heat the water until it is boiling. Note the temperature.3. Add 10 mL of antifreeze to the water. Continue heating the mixture. Note the
new boiling point.4. Repeat step 3 until all the antifreeze has been used.
Discussion1. Describe the effect of antifreeze on the boiling point of water.2. Why do car makers recommend leaving the antifreeze in a car radiator during
the summer?3. Compare the effects of antifreeze on the boiling point and freezing point of
water.4. Does antifreeze help or hinder boiling? Does antifreeze help or hinder melting?
_________________The Effect of Antifreeze on the Boiling Point of Water: Adapted from William A. Andrews, T.J.Elgin Wolfe, and John F. Eix, Physical Science: An Introductory Study (Scarborough, ON: Prentice-Hall ofCanada, Ltd., 1978) 85–86.
GRADE 11 CHEMISTRY • Topic 4 Appendices
Topic 4 Appendices – 19
Appendix 4.8: The Effect of Antifreeze on the Boiling Point of Water

PurposeThis lab activity is a practical, real-life application of the principles of calorimetry,heat transfer, heat exchange measurements, heat of fusion, specific heat, andfreezing point depression.
Materials • 2 sandwich-size and 2 large (4 L) resealable plastic bags to make into double-
thickness bags (to prevent leaks)• large bowl• measuring spoons• measuring cup• spoon• egg beater• balance• Celsius thermometer• 3 cups crushed ice • 1/2 cup rock salt
Recipe• 1/2 cup cream (or half-and-half)• 1/4 cup milk• 2 tablespoons sugar• 1/8 teaspoon vanilla• 1 beaten egg
Procedure1. Measure and record the mass of a sandwich-size plastic, zippered bag.2. In the large bowl, mix together the cream, milk, sugar, vanilla, and beaten egg.
Pour this ice cream mixture into a sandwich-size resealable bag.3. Measure and record the mass of the ice cream mixture.4. Measure and record the initial temperature of the ice cream mixture.5. Place the ice cream mixture into the second sandwich-size bag, making sure the
bags are sealed tightly.6. Place the small bag of ice cream mixture inside the large bag of ice and salt,
making sure everything is sealed tightly.7. Gently rock the bag for about five minutes. (Don’t rock too hard, or you’ll end up
with salty ice cream!)8. When the ice cream looks frozen enough, remove the small bag from the ice-salt
mixture and rinse the bag in cold water to remove any salt on the outside.
GRADE 11 CHEMISTRY • Topic 4 Appendices
20 – Topic 4 Appendices
Appendix 4.9: Heat Transfer: I Scream, You Scream, We All Screamfor Ice Cream

9. Measure and record the final temperatures of the ice-salt mixture and the icecream mixture.
10. Eat the ice cream!
Data Table
• Mass of small plastic, zippered bag: __________________
• Mass of ice cream mixture + bag: __________________
• Mass of ice cream mixture: __________________
• Initial temperature of ice cream mixture: __________________
• Final temperature of ice cream mixture: __________________
• Final temperature of ice cream mixture: __________________
GRADE 11 CHEMISTRY • Topic 4 Appendices
Topic 4 Appendices – 21
Appendix 4.9: Heat Transfer: I Scream, You Scream, We All Screamfor Ice Cream (continued)

QuestionWhat is the effect of salt on the melting point of ice?
PredictionPredict how the addition of salt will affect the melting temperature of ice.
Materials• computer system and temperature sensor• beaker (400 mL)• table salt, NaCl (50 g—divided into 10 portions of 5 g each)• finely crushed ice (200 mL)• stirring rod• support stand• utility clamp
Safety Precautions • This experiment must be done carefully to avoid burns and broken glass.• Wear a lab apron and safety goggles.
Procedure1. Set up the computer system with the temperature sensor.2. Display the temperature sensor with a graph so that temperature is along the
vertical axis and time is along the horizontal axis.3. Add the crushed ice to the beaker and set this on the base of the support stand.4. Clamp the thermometer into the utility clamp and attach the clamp to the
support stand.5. Lower the thermometer tip into the middle of the crushed ice.6. Using the stirring rod, stir the ice continuously.7. Start the data collection.8. When the thermometer stabilizes, add 5 g of salt to the ice. Continue stirring.9. Repeat step 8 until you have added 50 g of the salt to the ice.
10. Stop the data recording.11. Clean up the materials as directed by the teacher.
GRADE 11 CHEMISTRY • Topic 4 Appendices
22 – Topic 4 Appendices
Appendix 4.10: The Effect of Salt on the Melting Point of Ice

QuestionsAnalysis1. What evidence do you have that the ice is at its melting point even after the salt
has been added? 2. What appears on the outside of the beaker?3. What minimum temperature was attained?
Conclusion4. What effect does salt have on the melting point of ice?
Applications5. Explain why salt is added to ice-covered roads.6. This experiment can be repeated using ethylene glycol (antifreeze) instead of salt.
GRADE 11 CHEMISTRY • Topic 4 Appendices
Topic 4 Appendices – 23
Appendix 4.10: The Effect of Salt on the Melting Point of Ice (continued)

Sample Data: Answer KeyObservations
Analysis1. Both the solid and the liquid states are present.2. Frost appears on the outside of the beaker.3. The minimum temperature attained was –19°C.
Conclusion4. Salt lowers the melting point of ice.
Applications5. Salt dissolves in the fine layer of water found on the surface of ice. The melting
point of the ice is then lowered. When the melting point of the ice is below thesurrounding temperature, the ice melts.
GRADE 11 CHEMISTRY • Topic 4 Appendices
24 – Topic 4 Appendices
Appendix 4.10: The Effect of Salt on the Melting Point of Ice(Teacher Notes)
��
��
��
�!
���
���
���
���
��!
���
��
��� �� �� !� ��� ��� ��� ��� �!� ��� ��� ��� ��� �!� ��� ��� �����
#����������-�$$�.���/�
#�����
����0�$�
��������������

Work with a partner in the computer lab (or at home) to find answers to thefollowing questions.
1. The strength (or concentration) of a solution can be represented in several forms,dependent upon the intended usage or the nature of the components making upthe solution. Remember, a solution has two components: a solute and a solvent.Therefore, these components are often included in the units to express thestrength of a solution. Complete the following chart.
2. Describe the process of treating a water supply.
3. Identify the allowable concentrations of metallic and organic species in watersuitable for human consumption. (Consider tap water, well water and/or bottledwater.)
Unit to Express the
Strength of a Solution
What the Unit Means in
Long Form
Example of Where You Might
Find This Unit Being Used
Example:g/L
Grams of solute in 1 litre
of solution
Mixing powdered chemicals into
a swimming pool
% w/v
% v/v
ppm
ppb
mol/L
GRADE 11 CHEMISTRY • Topic 4 Appendices
Topic 4 Appendices – 25
Appendix 4.11: A WebQuest for Solubility Units

You and your partner will search through your chemistry textbook to find answersto the following questions. If you cannot find all the answers there, use anothersource that your teacher has supplied for you or recommended to you. You will notfind all the answers in the same section of the textbook, so it is important that youuse the index in the text correctly.
Write a thorough, but precise, answer to each of the following questions. Don’twrite “stuff” you don’t understand or have simply borrowed for the day. Makeevery effort to write in your own words and in a familiar style. This is an importantskill that will help you in any advanced studies.
1. Describe and give examples of various types of solutions. Include all ninepossible types.
Type of Solution Description Example
GRADE 11 CHEMISTRY • Topic 4 Appendices
26 – Topic 4 Appendices
Appendix 4.12: Solutions: A Scavenger Hunt

2. Describe the structure of water in terms of electronegativity and the polarity ofits chemical bonds.
3. Explain the dissolving process (also called dissolution) of simple ionic andcovalent compounds in water. Use diagrams and chemical equations.
4. Explain heat of solution with reference to specific applications. Examples: cold packs, hot packs, dilution of concentrated acids and bases.
GRADE 11 CHEMISTRY • Topic 4 Appendices
Topic 4 Appendices – 27
Appendix 4.12: Solutions: A Scavenger Hunt (continued)


