Top 10 Geographic Characteristics of Oceania (Australia, New Zealand and the Pacific Islands)
Upload
vuongnguyetCategory
view
217download
3
Asia Pacific Equity Research
08 October 2010
Top StoriesFinancials Strategy, Asia Pacific Sunil GargWhere are the revisions? (852) 2800-8518
[email protected](Sunil Garg) Send me your feedback!Earnings revisions are stalling across the Asia banking sector. A volume-led recovery thus far needs incremental support from margin revival to deliver revisions – a tough task without policy rate increases. Focus on banks that can deliver earnings growth. Top picks: HSBC, BOC/BoCom, First FHC, ICICI/BOI, Bursa.
AM perspectiveAdrian Mowat, Chief Equity Strategist Q-Strategy Help in EM
Name Key Trade Overall Q-score Metals & Mining, China
Dongfeng Motor China econ reb 100% Steel and petroleum likely to be in deficit in 2011HTC Corp. OW Tech 99% (Nathan M. Zibilich, CFA)CP ALL PCL Adv ASEAN 99% J.P. Morgan’s analysis shows steel/petroleum needing only 3.4%/1.1% global
demand growth rates in 2011 to balance supply. Accounting for the income elasticity of demand, they are consistent with 2.2% global real GDP growth vs. our economists’ 2.9% projection. So, these commodities appear to have potential upside price risk.
AirAsia Bhd Adv ASEAN 98% UniMicron OW Tech 98%
Source: J.P. Morgan Quant and strategy team, Factset, 28 September 2010.
We combine our macro strategy with a quantitative screening tool to guide stock selection in emerging markets. The quantitative tool uses the J.P. Morgan Q-score developed by Steve Malin and J.P. Morgan’s quant team. The top 5 stocks combining Q-score and top down macro strategy are Dongfeng Motor, HTC, CP ALL, Air Asia and UniMicron Technology. For more please see ‘Q-Strategy Help in EM’, Tavaria et al, 30 September 2010.
Automobile Manufacture, India Passenger Cars: Learning from China, takeaways for India(Aditya Makharia)While Indian passenger car growth rates are likely to be healthy, we expect competition to intensify, given that global OEMs are setting up capacities locally. Realizations and profitability could come under pressure as new OEMs gain market share over the near/medium term. Reiterate cautious stance on Maruti (N).
Ayala Corporation (OW), Philippines Raising PT by Php118; 24% discount to its market-price based NAV attractive(Jeanette Yutan)We believe Ayala provides an attractive proposition given its discount to the sum of the group’s parts, excellent market proxy to major sectors aligned to the cyclical upturn in the economy, and the attractive value of its parent that has a track record in incubating new businesses. Reiterate OW, raise PT to Php518.
Amorepacific Corp (OW), South Korea Raising our PT; the growing importance of China(Jinah Lee)The company expects China to generate 30% of its revenue by 2015 and 50% by 2020, vs. only 10% at present because the China market is growing much more quickly than Korea. Domestic growth will be reinforced through the launch of younger brands. We raise our PT to W1,200,000 (from W1,030,000).
Click below for the: J.P. Morgan Daily ValuationsLatest Weekly AP Banks Analyzer (.xls)Daily Global Economic Briefing
Link to Other FTMs pageLink to Morgan Markets page
See the end pages of each individual note for analyst certification and important disclosures, including non-US analyst disclosures. J.P. Morgan does and seeks to do business with companies covered in its research reports. As a result, investors should be aware that the firm may have a conflict of interest that could affect the objectivity of this report. Investors should consider this report as only a single factor in making their investment decision.
Recommendation and Forecast Changes Economics
• Economy, Taiwan (Grace Ng) • Amorepacific Corp (Overweight), South Korea (Jinah Lee) September exports disappointed, demand weakness
continued across major markets The growing importance of China • Ayala Corporation (Overweight),
TIP Markets (Jeanette Yutan) Results and Company Views • New World Development (Overweight),
Hong Kong (Amy Luk, CFA) A buy case for the whole
• Idea Cellular Limited (Underweight), India (Malvika Gupta)
Acquisition of residential project in urban area - ALERT • Sterlite Industries (Overweight),
India (Pinakin Parekh, CFA) India Telecom: Q2FY11 preview: Bharti, Idea, RCOM, TTSL. Expect a weaker quarter
Update from prod call- As 'power v/s aluminum' clarity emerges, focus on coal issues - ALERT
• New World Development (Overweight), Hong Kong (Amy Luk, CFA) FY10 results review: Strong results, upgrading PT to HK$19.1 Sector Research
• Reliance Communications Limited (Neutral), India (Malvika Gupta)
• Engineering, India (Shilpa Krishnan/ Sumit Kishore) Indian capital goods and E&C: Sep-q earnings preview and order flow tracker India Telecom: Q2FY11 preview: Bharti, Idea, RCOM, TTSL.
Expect a weaker quarter • Insurance - Life, Taiwan (Dexter Hsu)
Strategy Taiwan Life Insurance: Taiwan FSC considers to cut guaranteed return on life insurance policies - Negative
• Market Strategy, Asia Pacific (Gilbert Lopez) • Petrochemicals, Taiwan (Samuel Lee, CFA)
Taiwan Petrochemicals: Formosa group 3Q preliminary results mostly positive - ALERT
• Property, India (Saurabh Kumar) Realty Check India: Recent rally has been sharp, time to take a breather
Equity Strategy: Feedback from Asia Roadshow - ALERT
• Market Strategy, Global (Adrian Mowat) Emerging Markets Strategy Dashboards
• Market Strategy, India (Bijay Kumar, CFA) India Thematic Basket: Indian Health Care Companies: Rx for long hold...

Asia Analyst Focus List Company Name Ticker Analyst Rating
Mkt. Cap (MM)
Mkt. Cap (US$ MM)
Focus List Add Date
Focus List Add Price
Close 10/07/10
Target Price
Date Target Price Set
Australia Aristocrat eisure Limited (A$) LiiNet (A$)
ALL AU Stuart Jackson CFA ,Laurent Horrut
OW 1853 1832 30-Oct-09 4.52 3.47 5.00 15-Sep-10IIN AU OW 415 410 2-Aug-10 2.78 2.73 3.33 2-Aug-10
Intoll Group (A$) ITO AU Kirsty Mackay-Fisher, CFA OW 3381 3343 17-Apr-09 1.35 1.50 1.80 3-Feb-10 Westfi ld Group (A$) e WDC AU R b Stanton o O W 28639 28316 27-Jan-10 12. 1 9 12. 1 4 13. 6 9 18-Aug-10China AAC Acoustic (HK$) 2018 H K
753 HK Charles Guo OW 21981 2835 8-Sep-09 6.91 17.90 18.50
7.8 30-Aug-10
Air China (HK$) Corrine Png OW 154837 19968 27-Aug-08 3.93 10.56 23-May-10Bank of China 'H' (HK$) 3988 HK Sunil Garg OW 1012676 130595 4-Mar-09 2.16 4.25 5.4 27-Aug-10China Citic Bank - H Share (HK$) 998 HK Samuel Chen OW 221633 28582 23-Nov-09 6.73 5.18 7.70 30-Apr-10 China High Speed Transmission (HK$) 658 HK Boris Kan OW 24064 3103 6-May-10 18.42 17.50 24.30 6-May-10 China Merchants Bank Co., Lt - A (HK$) dChina Unicom H Share (HK$)
600036 CH Samuel Chen OW 298324 44669 29-Apr-10 13.82 12.95 20.60 14-Apr-10 762 H KFMCN
Lucy Liu OW 26578 13614
34275 2-Aug-10 10.22 11.28 13.20 2-Aug-10 Focus Media (US$) Dick Wei OW 3614 3-Jun-10 15.44 25.24 28.00 29-Sep-10Industrial and Commercial Bank of China - A (Rmb) 601398 CH Samuel Chen OW 1437364 215223 30-Oct-09 4.95 4.04 6.1 27-Aug-10Shandong Chenming Paper (HK$) 1812.H K
548 HK Leon Chik, CF AKaren Li, CFA
OW 16375 2112 30-Mar-10 5.31 7.36 12 9-Sep-10 Shenzhen Expressway H Share (HK$) OW 11448 1476 8-Sep-10 3.90 4.14 8.1 8-Sep-10 Zhejiang Expressway (HK$) 5 6 HK 7 K ren Li, CFA a O W 31661 4083 20-Apr-10 6. 83 7.29 8. 5 30-Aug-10Hong Kong Cosco Pacific (HK$) 1199 HK Karen Li OW 33352 4301 26-Aug-08 10.64 12.30 15.30 8-Jul-10 HSBC Holdings plc (HK$) 5 HK Sunil Garg OW 1438700 185535 24-May-10 71.65 81.70 115.00 22-Apr-10 K Wah International Holdings (HK$) 1 3 HK 7 A y Luk, CFA m O W 8110 1046 13-Apr-10 2. 98 3.18 3. 8 25-Aug-10India Apollo Hospit ls Enterprise Ltd. (Rs) aDish TV (Rs)
APHS IN Princy Singh OW 63719 1441 5-Oct-10 463.15 515.65 575.0 70.0
5-Oct-10 DITV IN Princy Singh OW 58547 1324 13-Sep-10 56.30 55.05 13-Sep-10
Sintex Industries Limited (Rs) SINT IN Princy Singh OW 58775 1329 2-Sep-10 361.00 430.60 435.00 17-Jun-10 Japan Dainippon Screen Mfg. ¥) (FUJIFILM Holdings (¥)
7735 JT Hisashi Moriyama OW 114035 1385 22-Jun-10 478 449.00 720.00 11-Aug-104901 JT Hisashi Moriyam a
Yoshiharu Izumi OW 1470286 17862 26-Jan-10 2,94 2
293 2857.00 4,500.00
590.00 28-May-10
Hitachi (¥) 6501 JT OW 1608463 19541 29-Jul-09 356.00 23-Apr-10 Honda Motor (¥) 7267 JT Kohei Takahashi OW 5461457 66349 19-Jan-10 3,370 3015.00 3,300.00 30-Aug-10Inpex Corporation (¥) 1605 JT Brynjar Eirik Bustnes OW 1548235 18809 1-Sep-10 389,000 423500.00 630,000.00 31-Aug-10Philippines International Container Terminal Services, Inc. ICT PM Jeanette Yutan OW 77239 1778 8-Sep-10 35.2 39.90 44.00 8-Sep-10 Philippine S ock Exchange Inc (Php) t PSE PM H rsh Wardhan Modi a O W 12876 29 6 9-Oc -07t 82 0 420 .00 605. 0 0 4-Oc -10 tSingapore CapitaLand (S$) CAPL SP Christopher Gee OW 17942 13740 29-Sep-08 3.26 4.21 5.30 18-Jan-10 DBS Group (S$) DBS SP Harsh Wardhan Modi OW 33154 25390 8-Aug-08 14.36 14.42 18.00
1.55 1-Aug-10
Genting Singapore (S$) GENS SP Kenneth Fong OW 24716 18928 10-May-10 0.96 2.03 2.00
13-Aug-10Noble Group Ltd (S$) NOBL SP Ajay Mirchandani OW 11916 9125 12-Nov-09 2.83 1.98 13-Aug-10Olam International (S$) OLAM SP Ajay Mirchandani OW 6732 5156 2-Oct-08 1.80 3.17 3.70 10-Aug-09Singapore Airlines (S$) SIA SP Corrine Png OW 19645 15044 23-May-10 14.60 16.42 17.00 2-Feb-10 Singapore Exchange (S$) SGX SP Harsh Wardhan Modi OW 10144 7768 22-Jul-09 7.62 9.47 9.7 4-Oct-10 Wilmar International Limited (S$) WIL SP Y ng-Jian Chan i O W 38489 29475 25-Jan-10 6. 69 6.02 7.80 6-Oc -10 tSouth Korea LG Display (W) 034220 KS JJ Park OW 14205280 12721 15-Mar-10 35900.00 39700.00 55,000.00 16-Sep-10LG Innotek (W) 011070 KS Marcus Shin OW 2745632 2459 23-Mar-10 115000.00 136500.00 240,000.00 15-Jul-10 Samsung SDI (W) 006400 KS Marcus Shin OW 6765414 6059 23-Jun-09 96100.00 148500.00 240,000.00 20-Jun-10 SK Energy Co Ltd (W) 0 6770 KS 9 B ynjar Eirik Bustnes r O W 14285930 12794 5-Oc -07t 147, 00 5 154500.00 165,000.00 13-Se -10pTaiwan Chinatrust Financial Holdings (NT$) 2891 TT Dexter Hsu OW 214054 6968 24-Aug-09 18.75 19.95 22.00 1-Sep-10 Chimei Innolux Corporation (NT$) 3481 TT JJ Park OW 345870 11259 10-Jan-10 54.1 43.00 63.00 10-Jan-1 0
Aug-10 First Financial Holding Co Ltd (NT$) 2892 TT Dexter Hsu OW 136337 4438 3-Sep-10 18.45 21.05 24.00 Pegatron Corp (NT$) 4938 TT Gokul Hariharan OW 91442 2977 24-Aug-10 40.15 40.00 52.00 24-Aug-10Powertech Technology I c (NT$) nE Ink Holdings Inc (NT$)
6239 TT Cynthia Chou OW 70142 2283 2-Aug-10 101.5 99.60 130.00 85.00
2-Aug-10 8069 TT JJ Park OW 63317 2061 4-Mar-10 63.6 58.90 28-Nov-09
Tripod Technology Corp (NT$) 3044 TT Christopher Ma OW 56349 1834 18-Apr-10 106.0 119.00 160.00 60.00
18-Apr-10 Unimicron Technology Corp. (NT$) 3037 TT Christopher Ma OW 78453 2554 18-Apr-10 40.75 50.70 18-Apr-10 Thailand Major Cineplex Group Plc (Bt) MAJOR TB Maria Lapiz OW 12347 414 15-Jul-10 10.00 14.00 13.80 15-Jul-10 PTT Public Company (Bt) PTT TB Sukit Chawalitakul OW 853745 28601 23-Mar-10 256.00 300.00 395.00 15-Sep-10
Source: Bloomberg, J.P. Morgan estimates. *Under applicable law and/or JPMorgan Chase & Co policy, all J.P. Morgan ratings and estimates for this company have been removed.
For details on the AFL methodology, please see the Asia Cash Equities page on mm.jpmorgan.com or contact your J.P. Morgan salesperson/the covering analyst.
Your feedback can help us to make the FTM better. Please take a moment to tell us what you think. Click here to send comments Click here for the Blackberry version Click here to unsubscribe
Asia Pacific Equity Research 07 October 2010
Asia Financials Strategy
Where are the revisions
Banks
Sunil GargAC
(852) 2800-8518 [email protected]
Joseph Leung (852) 2800-8517 [email protected]
J.P. Morgan Securities (Asia Pacific) Limited
PPP Growth (2011-12 CAGR)
5%5%
10%12%12%12%
16%16%
17%18%
19%21% 23%
0% 5% 10% 15% 20% 25%
AUKR
HSBCSGMYTW
STANPHHKID
THIN
CH
Source: J.P. Morgan estimates.
Model Portfolio Performance
75
85
95
105
115
125
Jan-10 Mar-10 May-10 Jul-10 Sep-10
Portfolio JPMBI MSCI Fin
Source: Bloomberg, J.P. Morgan estimates.
Top picks 6 Oct 10 Price Target PE PB LC LC 11E 11E HSBC 82.1 115 9.7 1.2 BOC-H 4.3 5.4 7.9 1.6 BoComm 8.7 11 8.3 1.9 First FHC 21.2 24 13.2 1.2 ICICI 1149.2 1300 20.5 2.2 BOI 574.8 590 8.7 1.7 Bursa 8.2 10.7 26.5 4.6
Source: Bloomberg and J.P. Morgan estimates.
Summary of financials - Asia 10E 11E 12E NIM 2.3% 2.4% 2.5% Loan Growth 11% 11% 11% NII Growth 16% 16% 15% Fee Growth 13% 16% 17% Non-II Rev Growth 9% 13% 14% Revenue Growth 14% 16% 15% Cost Growth 13% 12% 12% PPOP Growth 15% 18% 17% LLP Growth -24% -8% 8% Pre-Tax Growth 38% 25% 18% EPS Growth 31% 20% 18%
Source: J.P. Morgan estimates.
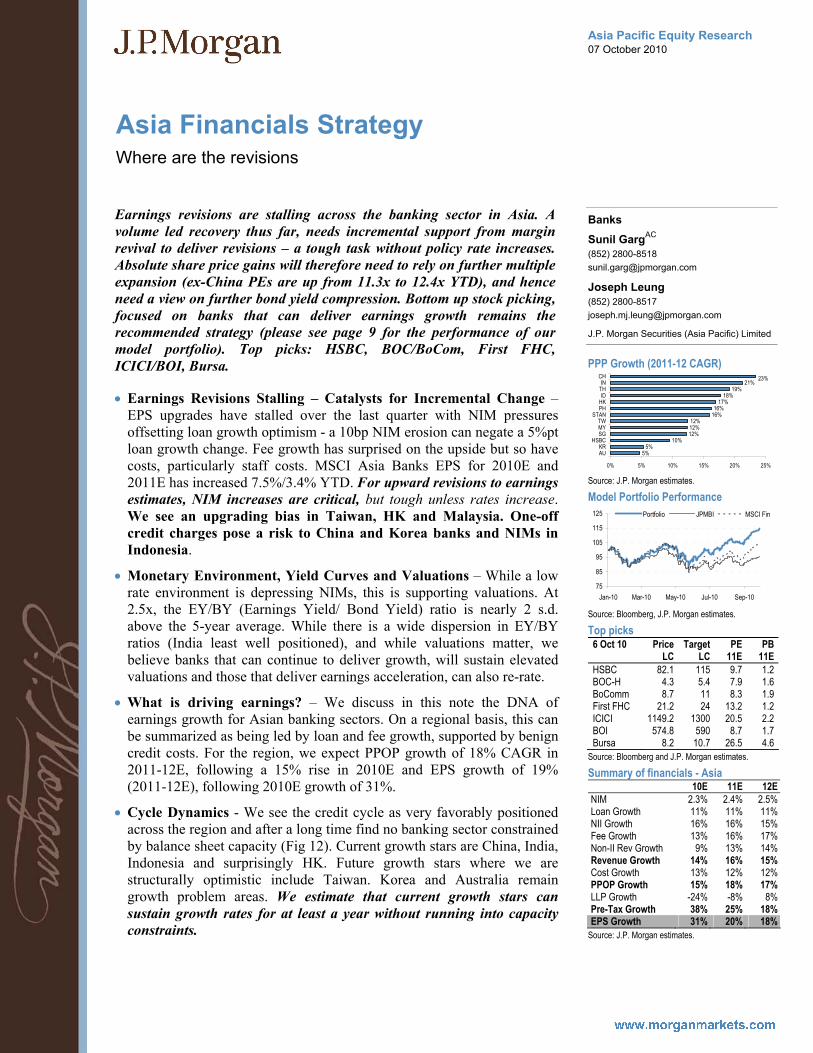
Earnings revisions are stalling across the banking sector in Asia. A volume led recovery thus far, needs incremental support from margin revival to deliver revisions – a tough task without policy rate increases. Absolute share price gains will therefore need to rely on further multiple expansion (ex-China PEs are up from 11.3x to 12.4x YTD), and hence need a view on further bond yield compression. Bottom up stock picking, focused on banks that can deliver earnings growth remains the recommended strategy (please see page 9 for the performance of our model portfolio). Top picks: HSBC, BOC/BoCom, First FHC, ICICI/BOI, Bursa.
• Earnings Revisions Stalling – Catalysts for Incremental Change –EPS upgrades have stalled over the last quarter with NIM pressures offsetting loan growth optimism - a 10bp NIM erosion can negate a 5%pt loan growth change. Fee growth has surprised on the upside but so have costs, particularly staff costs. MSCI Asia Banks EPS for 2010E and 2011E has increased 7.5%/3.4% YTD. For upward revisions to earnings estimates, NIM increases are critical, but tough unless rates increase. We see an upgrading bias in Taiwan, HK and Malaysia. One-off credit charges pose a risk to China and Korea banks and NIMs in Indonesia.
• Monetary Environment, Yield Curves and Valuations – While a low rate environment is depressing NIMs, this is supporting valuations. At 2.5x, the EY/BY (Earnings Yield/ Bond Yield) ratio is nearly 2 s.d. above the 5-year average. While there is a wide dispersion in EY/BY ratios (India least well positioned), and while valuations matter, we believe banks that can continue to deliver growth, will sustain elevated valuations and those that deliver earnings acceleration, can also re-rate.
• What is driving earnings? – We discuss in this note the DNA of earnings growth for Asian banking sectors. On a regional basis, this can be summarized as being led by loan and fee growth, supported by benign credit costs. For the region, we expect PPOP growth of 18% CAGR in 2011-12E, following a 15% rise in 2010E and EPS growth of 19% (2011-12E), following 2010E growth of 31%.
• Cycle Dynamics - We see the credit cycle as very favorably positioned across the region and after a long time find no banking sector constrained by balance sheet capacity (Fig 12). Current growth stars are China, India, Indonesia and surprisingly HK. Future growth stars where we are structurally optimistic include Taiwan. Korea and Australia remain growth problem areas. We estimate that current growth stars can sustain growth rates for at least a year without running into capacity constraints.

Asia Pacific Equity Research 07 October 2010
China Metals & Mining
J.P. Morgan Commodity Markets Outlook & Strategy Call Take-aways
China Metals & Mining
Nathan M. Zibilich, CFAAC *
(852) 2800 8570 [email protected]
Wenwen Wang
J.P. Morgan Securities (Asia Pacific) Limited
* Registered/qualified as a research analyst under NYSE/NASD rules
• Key Conclusions: 1) the current economic expansion is 15 months old, the risk of a double-dip recession is 1 in 5, and we could see more monetary easing which would likely be reflationary, but not necessarily inflationary at the CPI level, 2) consumers of commodities, particularly natural gas and metals, should increase their hedge ratio over the next 1-5 year time period, and 3) the S&P GSCI index is likely to provide a 12 month total return of 17%. Please see full report attached here:
• “Catch Up” + “Catch Down” = reflation: In the US, the FOMC is seen as having ample room to tolerate a significantly higher rate of inflation than normal in order to compensate for the ground lost in the recession relative to the long-run trend price level. Even if actual CPI y/y were 3% today (vs. a little over 1%), the aggregate price level would steel be below the long-term trend line of inflation in the US. This targeting of the forward price level more than the rate of price change in the US is what they have called the “Catch Up” thesis. On the other hand, we have seen the “Catch Down” factor, primarily in China where efforts to meet the 20% power conservation targets of the 11th Five Year Plan, Beijing has aggressively shuttered hundreds of thousands of metric tonnes of industrial metals production capacity, mostly in the steel and aluminum sectors. This has lead to a tightening of the supply of metals.
• Steel and petroleum likely to be in deficit in 2011: JPM did an analysis showing that steel and petroleum require only 3.4% and 1.1% global demand growth rates in 2011 to balance supply. After accounting for the income elasticity of demand, these demand requirements are likely consistent with 2.2% global real GDP growth. Given that our economists are projecting 2.9% global real GDP growth these two commodities appear to have potential upside price risk. Metals such as zinc (10.2%) and aluminum (9.2%) and fared the worst.
• Copper now 95% of its 2008 price high – behaving rationally? On the call and in his report, Mr. Fenton asserts that contrary to popular belief, the empirical evidence from commodity markets unambiguously shows orderly markets that are discounting economic fundamentals, not investment fads or flows. When Mr Fenton’s team regressed the annual average price for the five-year forward LME copper contract against the total liabilities of a group of producers prospecting and developing the highest risk projects, it is immediately apparent that the market is discounting a hurdle rate for capex, as it should be. JPM believes large consumers understand this and in a brilliant display of risk management, China doubled its annual copper imports at the cyclical bottom.

Asia Pacific Equity Research 07 October 2010
India Passenger Cars
Learning's from China
India Automobile Manufacture
Aditya MakhariaAC
(91-22) 6157-3596 [email protected]
J.P. Morgan India Private Limited
Bharat Iyer (91-22) 6157-3600 [email protected]
J.P. Morgan India Private Limited
Frank Li (852) 2800-8511 [email protected]
J.P. Morgan Securities (Asia Pacific) Limited
• As passenger car penetration rates in India (at c.11 cars per '000 persons) are currently at levels where China was in CY02 we analyzed growth rates in China and sector profitability over CY02-07, when passenger car sales grew at 29% CAGR. Our China autos analyst Frank Li highlights that while volume growth was healthy, industry margins were volatile – given sales price erosion during this phase. By our estimate, average car sales prices have dropped by around 15% between CY04 to 08. Thus, sector margins in CY03 were at 9.4%, which declined to 5.8% in CY05 and then stabilized. During this phase, the stock prices of the Chinese OEMs underperformed the broader market.
• Takeaways for India: While growth rates are likely to be healthy in the Indian passenger car market, we expect competition to intensify, given that global OEMs are setting up capacities locally. We expect that realizations and profitability could come under pressure as new OEMs gain market share in the local market over the near / medium term. We reiterate that while Maruti will benefit from robust industry growth, intensifying competition will likely impact market share / profitability.
• China - Volume growth has been robust, but cyclical: While sales growth in China came in at 29% CAGR over CY02-07, growth in the car market was volatile. China’s early auto boom occurred in CY03 when sales were aided by the breakout of demand in tier-one cities. Subsequently, growth rates eased over CY04-05. Also, during this phase, competition increased as global OEMs stepped up their presence here. Subsequently, growth accelerated again in CY06. Industry margins were volatile: Industry margins which were robust at 9% in CY03, declined to c.6% over CY04-CY06, given build up in competition, decline in average realizations as well moderation in industry growth rates.
Figure 1: China Passenger Car Industry Growth Rates and Operating Margin (%) 9.4%
7.5%
5.8%6.2%
6.9%50%
25%21%
30%
22%
0%
2%
4%
6%
8%
10%
CY03 CY04 CY05 CY06 CY07
0%
10%
20%
30%
40%
50%
60%
Operating Margin (%) Passenger car Grow th Rate (%)
Margins declined ov er CY03-05 as competition increased, ASP's declinedand grow th rates moderated.
Source: CEIC, J.P. Morgan

Asia Pacific Equity Research 07 October 2010
Ayala Corporation
Overweight AC.PS, AC PM
A buy case for the whole ▲
Price: Php394.00
Price Target: Php518.00 Previous: Php400.00
Philippines Conglomerates & Multi-industry
Jeanette YutanAC
(63-2) 878-1131 [email protected]
J.P. Morgan Securities Philippines, Inc.
250
350
450
Php
Oct-09 Jan-10 Apr-10 Jul-10 Oct-10
Price Performance
AC.PS share price (Php)PSE (rebased)
YTD 1m 3m 12m Abs 30.2% 3.1% 21.2% 26.1% Rel -8.9% -9.3% -5.5% -17.0%
Ayala Corporation (Reuters: AC.PS, Bloomberg: AC PM) Php in mn, year-end Dec FY08A FY09A FY10E FY11E FY12E Revenue 79,109 76,294 81,551 95,236 109,529 Net Profit 8,108.6 8,154.3 8,494.7 11,397.2 14,860.6 EPS (Php) 16.35 16.44 17.12 22.97 29.96 DPS (Php) 4.00 4.00 4.00 4.00 4.00 Revenue growth (%) 0.4% -3.6% 6.9% 16.8% 15.0% EPS growth (%) -50.0% 0.6% 4.2% 34.2% 30.4% ROCE 12.5% 10.5% 10.4% 12.9% 15.2% ROE 8.8% 8.2% 8.1% 10.3% 12.5% P/E (x) 24.1 24.0 23.0 17.1 13.2 P/BV (x) 2.0 1.9 1.8 1.7 1.6 EV/EBITDA (x) 9.8 10.4 9.6 7.0 5.4 Dividend Yield 1.0% 1.0% 1.0% 1.0% 1.0%
Shares O/S (mn) 486 Market cap (Php mn) 191,493 Market cap ($ mn) 4,402 Price (Php) 394.00 Date Of Price 07 Oct 10 Free float (%) 38.0% 3mth Avg daily volume 350,092.00 3M - Average daily Value (Php mn) 131.11 Average 3m Daily Turnover ($ mn) 3.01 PSE 4,245 Exchange Rate 43.50 Fiscal Year End Dec
Source: Company data, Bloomberg, J.P. Morgan estimates.
• Raise PT to Php518, maintain OW: We reiterate our OW rating and raise our PT by Php118 to Php518 as we roll over our PT to Dec-11, incorporate our ALI and GLO PT changes, and align our conglomerate discount to AC’s five-year historical average of 10%. We believe that AC provides an attractive proposition given its discount to the sum of the group’s parts, excellent market proxy to major sectors aligned to the cyclical upturn in the economy, and the attractive value of its parent company that has a track record in incubating new businesses.
• Discount should narrow as AC is a preferred market proxy: We expect AC’s 24% discount to market-price-based NAV, which is attractive vs its five-year average of 10%, to narrow as AC’s business portfolio is highly leveraged to the economic upturn, via ALI and BPI.
• Value proposition of the parent company: We believe that the current share price does not consider the value proposition of the parent company, which possesses a wealth of business experience, management depth, financial capability, and clout that should allow it to continue its track record of incubating companies into well-managed, market dominant players. We expect AC to leverage on these to secure new investment wins in the infrastructure space.
• Key catalysts: In the near term, we believe the profit delivery of ALI and BPI will be key price catalysts. Over the next 18 months, we expect news flow on the group’s pursuit of new investments to play a major part in narrowing the lingering discount. AC has stated that it is very interested in the government’s public-private partnership (PPP) scheme. AC has narrowed its sights on toll roads, airports, and renewable energy.
• PT & key risks: Our Dec-11 PT of Php518 is based on a 10% discount to our fair value-based sum-of-the-parts NAV estimate of Php576. Key risks to our investment view and PT are: (1) failure of ALI to deliver on its long-term targets; (b) zero new business wins that could act as long-term and value driver for AC; and (c) disappointments in the major units’ performance.

Asia Pacific Equity Research 08 October 2010
Amorepacific Corp
Overweight 090430.KS, 090430 KS
The growing importance of China ▲
Price: W1,074,000
Price Target: W1,200,000 Previous: W1,030,000
South Korea Cosmetics & Household Products
Jinah LeeAC
(82-2) 758-5723 [email protected]
J.P. Morgan Securities (Far East) Ltd, Seoul Branch
700,000
900,000
1,100,000
W
Oct-09 Jan-10 Apr-10 Jul-10 Oct-10
Price Performance
090430.KS share price (WKOSPI (rebased)
YTD 1m 3m 12m Abs 14.0% -3.3% 13.3% 30.2% Rel 1.9% -9.6% -0.1% 11.2%
• China to become the 2nd home market for Amorepacific; The company expects China to generate 30% of its revenue by 2015 and 50% by 2020, compared with only 10% right now, because the China market is growing much more quickly than Korea.
• Margins are likely to remain flat in China while investment continues; Amorepacific plans to spend 35% of sales over the next few years, not cutting into margins although margins are likely to remain flat at 10% according to the company.
• Sulhwasoo is not the growth driver behind China, Mamonde is; there are concerns that a delay in Sulhwasoo’s China launch could affect growth. However, not only does Amorepacific’s 30% revenue growth target exclude the new brand launch, more importantly Sulhwasoo is not intended to become the main brand in China but rather Mamonde is, which is manufactured in China and is expected eventually to account for half of China’s revenue.
• M&A saved for rainy days; Amorepacific believes that M&A should be pursued only when growth in your home market falls to low single digits. In such circumstances it would target a small brand in either US or Europe.
• 3Q could be lower than our estimate, but a decade of growth ahead; we expect growth to slow in the second half from 16% to 10%, and the operating profit margin could be hurt by the calendar year effect of Thanksgiving. However, we do not see this as a reason to sell, given our expectation of a decade of growth ahead.
• Domestic growth reinforced through launch of younger brands; Amorepacific will focus on growing newly launched brands targetting 20- and 30-year olds including Hyosiah, Lirikos and Amorepacific.
• We raise our target price to Won 1,200,000 (from W1,050,000) and extend the timeframe to Dec-11 (from Jun-11) based on 21x 2012E earnings.
Table 1: Bloomberg: 090430 KS REtuers: 090430.KS Won in Bn
FY08 FY09 FY10E FY11E FY12E Sales (Won bn) 1,531 1,769 1,993 2,118 2,226 52-week range W1,223,000-751,000 Operating Profit (Won bn) 255 301 367 401 430 Market cap W6,278B Net Profit (Won bn) 170 226 300 359 406 Market cap US$5,633MM EPS (Won) 24,666 32,728 43,421 52,060 58,767 Shares issued 5.8MM EPS growth (%) -4.3% 32.7% 32.7% 19.9% 12.9% Free float 53.80% P/E (times) 43.4 32.7 24.6 20.6 18.2 Price (W) 1,074,000
Date of Price 7-Oct-10 BVPS (Won) 161,600 188,320 216,153 259,529 279,006 Avg daily value W12.5B P/B (times) 6.6 5.7 5.0 4.1 3.8 Avg daily value US$11.2MM DPS (Won) 4,500 5,000 5,000 6,500 8,900 Avg daily volume 0.01MM shares Dividend yield (%) 0.5% 0.5% 0.5% 0.7% 0.9% KOSPI 1,900.85 ROE (%) 15.9% 13.1% 15.1% 16.7% 18.7% Exchange Rate W1,114.7/US$
Source: Bloomberg, J.P. Morgan estimates, Company data.

Asia Pacific Equity Research 07 October 2010
India Telecom
Q2FY11 preview: Bharti, Idea, RCOM, TTSL. Expect a weaker quarter
India Wireless Services
Malvika GuptaAC
(91-22) 6157 3595 [email protected]
J.P. Morgan India Private Limited
James R. Sullivan, CFA (65) 6882-2374 [email protected]
J.P. Morgan Securities Singapore Private Limited
Price performance % 1M 3M 12M
Absolute performance Bharti 4.1 29.5 (0.3) RCOM 12.1 (1.2) (30.0) Idea 0.1 25.7 15.9 TTSL 7.4 7.2 1.0 Rel performance- Sensex Bharti (5.9) 12.1 (22.4) RCOM 2.0 (18.7) (52.2) Idea (9.9) 8.2 (6.2) TTSL (2.7) (10.3) (21.1) Rel performance-Asia-ex Telco Index Bharti 0.5 19.1 (8.8) RCOM 8.5 (11.7) (38.5) Idea (3.5) 15.3 7.5 TTSL 3.7 (3.2) (7.5)
Source: Bloomberg. Priced on 06Oct, 2010
We expect a weaker Q2FY11 for telecom companies (Bharti, Idea, RCOM) as a result of slower net adds, flattish MOUs, continued ARPM pressure and increases in capex linked network opex. • Weaker volumes in Q2: For Bharti and RCOM, we note that the net add
run rate (through August) has declined Q/Q. Furthermore our checks indicate that usage was at best flat sequentially. We forecast a 1.1%/3.0%/1.2% MOU Q/Q decline for Bharti/RCOM/Idea to 475/286/410.
• ARPM declines to continue at a slower rate. We noted several offers at the circle and segment level from the likes of Tata, MTNL, Loop and other (See Table 7). We believe Bharti and others responded to these putting some pressure on ARPMs. For Bharti/RCOM/Idea we forecast a 1.4/0/1.6 paise Q/Q blended ARPM decline in Q2FY11E vs. 2.1/0/2.6 in Q1. We forecast a 2%/2%/1% Q/Q revenue growth in for Bharti (India & SEA)/RCOM/Idea.
• Bharti Africa: Q2 will have the first full quarter impact from the African operations. We forecast a 1% Q/Q decline in top-line (on Q1 ests) here as believe that tariff cuts off-set any volume growth in markets like Kenya while in other markets competitor moves likely meant little benefit to Bharti. We don’t expect re-branding to have a Q2 margin impact and expect this to be more of a staggered effort but we don’t expect a positive impact from cessation of royalty fee payments either.
• We will be watching network opex: We expect capex spends to have increased slightly in Q2 as the equipment bottleneck opened up and also ahead of expected 3G service launches at year-end. Related to capex, we expect network opex to have increased Q/Q. We forecast a 58bp/44bp/43bp Q/Q decline in EBITDA margin for Bharti (India and SEA)/RCOM/Idea.
• Cautious in the medium term: We expect price competition to continue at the segment/circle level and to increase ahead of MNP (delays beyond Oct 31 expected). We believe regulatory uncertainty remains an overhang.
• For RCOM, we are reducing FY11/FY12 EPS estimates by 5%/8% driven by lower estimates for the wireless business while for Idea we increase estimates by 1%/10% but remain 17%/13% below consensus. This results in a PT change for RCOM and Idea from INR188/57 to INR182/58.
Table 1: Valuation comparison
Current Price Upside / P/E (x) EV/EBITDA (x) Valuation Company name Ticker Rating Price (Rs) Target (Rs) downside FY11E FY12E FY11E FY12E method Bharti Airtel BHARTI IN N 352 360 2% 19.7 16.2 9.4 7.7 SOTP Reliance Communications RCOM IN N 178 182 3% 20.0 16.1 9.1 7.6 SOTP Idea Cellular IDEA IN UW 73 58 -20% 44.0 40.1 10.4 8.7 SOTP Tulip Telecom TTSL IN OW 191 215 12% 9.8 7.9 6.4 5.2 SOTP Source: Bloomberg, J.P. Morgan estimates. Priced as of 06 October, 2010

Asia Pacific Equity Research 07 October 2010
New World Development
Overweight 0017.HK, 17 HK
FY10 results review: Strong results, upgrading PT to HK$19.1 ▲
Price: HK$16.70
Price Target: HK$19.10 Previous: HK$15.50
Hong Kong Property
Amy Luk, CFAAC
(852) 2800 8524 [email protected]
Lucia Kwong, CFA (852) 2800-8526 [email protected]
Suzy Tian (852) 2800 8552 [email protected]
J.P. Morgan Securities (Asia Pacific) Limited
11
14
17HK$
Oct-09 Jan-10 Apr-10 Jul-10 Oct-10
Price Performance
0017.HK share price (HK$HSI (rebased)
YTD 1m 3m 12m Abs 4.6% 26.1% 26.1% 1.5% Rel 0.0% 19.0% 12.2% -8.4%
New World Development (Reuters: 0017.HK, Bloomberg: 17 HK) HK$ in mn, year-end Jun FY08A FY09A FY10A FY11E FY12E Revenue 29,361 24,415 30,219 30,052 31,614 Net Profit 3,772.5 3,527.3 6,081.7 5,857.5 6,136.1 EPS (HK$) 0.95 0.93 1.60 1.50 1.57 DPS (HK$) 0.41 0.31 0.38 0.38 0.38 Revenue growth (%) 26.1% -16.8% 23.8% -0.6% 5.2% EPS growth (%) 6.0% -2.6% 72.4% -6.6% 4.8% ROCE 5.4% 3.5% 6.8% 5.9% 7.1% ROE 5.7% 4.8% 7.6% 6.6% 6.5% P/E (x) 17.5 18.0 10.4 11.2 10.7 P/BV (x) 0.9 0.9 0.7 0.7 0.7 EV/EBITDA (x) 11.8 17.1 8.4 7.9 6.2 Dividend Yield 2.4% 1.8% 2.3% 2.3% 2.3%
Shares O/S (mn) 3,918 Market cap (HK$ mn) 65,430 Market cap ($ mn) 8,436 Price (HK$) 16.70 Date Of Price 06 Oct 10 Free float (%) 3mth Avg daily volume 10,632,450.00 3M - Average daily Value (HK$ mn) 148.21 Average 3m Daily Turnover ($ mn) 19.11 HSI 22,880 Exchange Rate 7.76 Fiscal Year End Jun
Source: Company data, Bloomberg, J.P. Morgan estimates.
• Strong earnings growth from property sales: New World Development reported a solid set of FY10 results. Underlying net profit was up 72% Y/Y to HK$6,082 million, mainly a result of sales of the luxury residential project The Masterpiece. Property sales of New World China Land also grew significantly, with contracted sales booked up over 120% to 1.04 m sq m. Final DPS was raised to HK$0.28 compared with HK$0.21 in FY09, resulting in a payout ratio of 24%.
• Negotiations with Urban Renewal Authority still in progress: In addition to The Masterpiece, the JV with URA consists of hotel and retail properties. According to NWD, as URA has no intention of holding any investment properties for long-term investment, the stake of URA is likely to be acquired by NWD. However, the two parties have not come up with an agreed price for the transaction yet. As a result, sales of The Masterpiece have been put on hold. Management expects the negotiations to conclude in a few months time and we are forecasting the unsold units to be sold evenly in FY11 and FY12.
• Potential NAV accretion from potential asset injection: NWD has been active in land bank replenishment in FY10. Three sites with a total attributable GFA of 1.86 million sq ft were acquired. A potential addition would be the injection of Kei Yuen Lane project in North Point from the parent, which spent 10 years in acquiring old buildings for redevelopment. According to the Hong Kong Economic Times, the project might provide a total GFA of 1.32 million sq ft or 1,338 units upon completion. Given the scarcity of large-scale residential projects on Hong Kong Island, we believe this potential asset injection could be a share price driver.
• New price target, maintain Overweight: We roll over our PT time frame to Jun-11 from Dec-10 and raise our PT from HK$15.5 to HK$19.1, based on a 34% long-term average discount to our Jun-11 NAV estimate of HK$28.96. Risks to our PT include a rise in interest rates, sustainability of economic recovery in Hong Kong and China, and a delay in the negotiation process with the Urban Renewal Authority.
Asia Pacific Equity Research 07 October 2010
Equity Strategy
Feedback from Asia Roadshow - ALERT
Gilbert LopezAC
(63-2) 878-1188 [email protected]
Jeanette Yutan (63-2) 878-1131 [email protected]
J.P. Morgan Securities Philippines, Inc.
• A confirmation of Philippines’ still low foreign ownership: We met a total of 36 funds over the course of five days in Hong Kong, Singapore, and Kuala Lumpur. The key takeaway was majority of the funds have minimal holdings in the Philippines despite the 39% YTD gain of the PSEi. This confirms our Regional Strategy's survey of the country as still being a consensus underweight. This is also in line with the Philippine Stock Exchange (PSE) data that shows foreign flows accounted only 35% of the YTD total turnover, and marginally higher at 40% in September when the market rallied.
• Political stability needs to be translated to good government execution: Clients agreed with our view that the ongoing political stability needs to be translated to good government execution especially in addressing the pertinent fiscal issues and lack of infrastructure investments. Most agree that milestones in the improvement of tax effort and effective mobilization of private sector participation in the infrastructure investments are key tangibles that will be closely monitored. One of the near-term catalysts being closely watched is the ability of the Bureau of Internal Revenue (BIR) in hitting its September revenue collection target.
• Recognition of infrastructure spending: Attracting the most interest was the government’s planned Public-Private Partnership (PPP) scheme to jumpstart the needed infrastructure spending. Set to be unveiled in November, we think that this will help the Philippines achieve a more sustainable long-term growth trajectory and reduce its reliance on consumption to drive GDP growth. Most asked about specific stocks that are potential plays on the infrastructure story like Metro Pacific Investments (MPI, Not Rated) and DMC (DMC, Not Rated).
• Index has greater upside on risk reduction: Our December 2011 PSEi index target of 4,550 provides less than 10% upside potential due to the recent market strength. We note, however, that there is upside risk emanating from further risk reduction. We estimate that a 50bps reduction in our current risk-free rate assumption of 7.0% would translate to a 9% upside to our index target. The scenario is likely especially with the 10-year bond yields falling to a record 6.1%.
• Valuations a concern for the market and key sectors: A main push back from the clients is the Philippine equity market valuations, which have exceeded the historical average because of the recent market rally. The same concern was raised on the Philippine property sector, which we are mostly overweight on and comprised a large part of our top picks.
• Maintain Overweight: We keep our overweight on the Philippines on a strategy standpoint. Our top picks would be Ayala Land, Ayala Corp, PLDT, ICTSI, Filinvest Land, Robinsons Land, EDC, and Manila Water.
Emerging Markets Equity Research 07 October 2010
Emerging Markets Strategy Dashboards
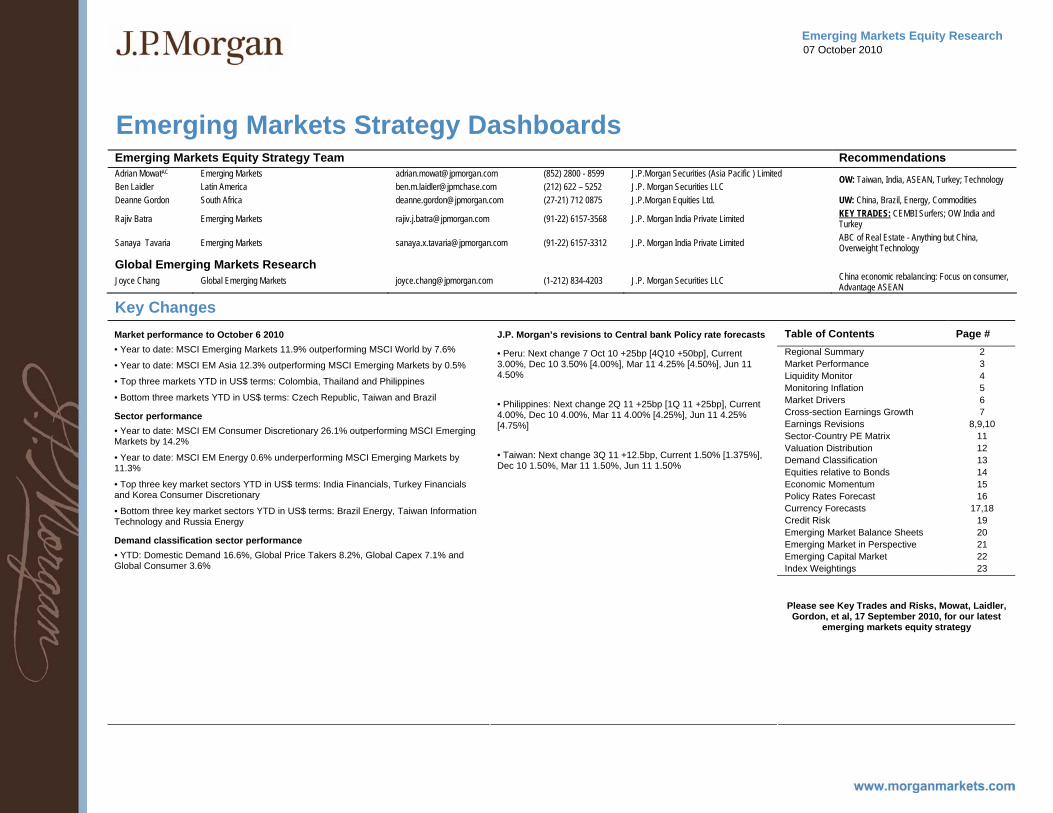
Emerging Markets Equity Strategy Team Recommendations Adrian MowatAC Emerging Markets [email protected] (852) 2800 - 8599 J.P.Morgan Securities (Asia Pacific ) Limited Ben Laidler Latin America [email protected] (212) 622 – 5252 J.P. Morgan Securities LLC
OW: Taiwan, India, ASEAN, Turkey; Technology
Deanne Gordon South Africa [email protected] (27-21) 712 0875 J.P.Morgan Equities Ltd. UW: China, Brazil, Energy, Commodities
Rajiv Batra Emerging Markets [email protected] (91-22) 6157-3568 J.P. Morgan India Private Limited KEY TRADES: CEMBI Surfers; OW India and Turkey
Sanaya Tavaria Emerging Markets [email protected] (91-22) 6157-3312 J.P. Morgan India Private Limited ABC of Real Estate - Anything but China, Overweight Technology
Global Emerging Markets Research
Joyce Chang Global Emerging Markets [email protected] (1-212) 834-4203 J.P. Morgan Securities LLC China economic rebalancing: Focus on consumer, Advantage ASEAN
Key Changes Table of Contents Page # Regional Summary 2 Market Performance 3 Liquidity Monitor 4 Monitoring Inflation 5 Market Drivers 6 Cross-section Earnings Growth 7 Earnings Revisions 8,9,10 Sector-Country PE Matrix 11 Valuation Distribution 12 Demand Classification 13 Equities relative to Bonds 14 Economic Momentum 15 Policy Rates Forecast 16 Currency Forecasts 17,18 Credit Risk 19 Emerging Market Balance Sheets 20 Emerging Market in Perspective 21 Emerging Capital Market 22 Index Weightings 23
Market performance to October 6 2010 • Year to date: MSCI Emerging Markets 11.9% outperforming MSCI World by 7.6%
• Year to date: MSCI EM Asia 12.3% outperforming MSCI Emerging Markets by 0.5%
• Top three markets YTD in US$ terms: Colombia, Thailand and Philippines
• Bottom three markets YTD in US$ terms: Czech Republic, Taiwan and Brazil
Sector performance • Year to date: MSCI EM Consumer Discretionary 26.1% outperforming MSCI Emerging Markets by 14.2%
• Year to date: MSCI EM Energy 0.6% underperforming MSCI Emerging Markets by 11.3%
• Top three key market sectors YTD in US$ terms: India Financials, Turkey Financials and Korea Consumer Discretionary
• Bottom three key market sectors YTD in US$ terms: Brazil Energy, Taiwan Information Technology and Russia Energy
Demand classification sector performance • YTD: Domestic Demand 16.6%, Global Price Takers 8.2%, Global Capex 7.1% and Global Consumer 3.6%
J.P. Morgan’s revisions to Central bank Policy rate forecasts
• Peru: Next change 7 Oct 10 +25bp [4Q10 +50bp], Current 3.00%, Dec 10 3.50% [4.00%], Mar 11 4.25% [4.50%], Jun 11 4.50% • Philippines: Next change 2Q 11 +25bp [1Q 11 +25bp], Current 4.00%, Dec 10 4.00%, Mar 11 4.00% [4.25%], Jun 11 4.25% [4.75%] • Taiwan: Next change 3Q 11 +12.5bp, Current 1.50% [1.375%], Dec 10 1.50%, Mar 11 1.50%, Jun 11 1.50%
Please see Key Trades and Risks, Mowat, Laidler, Gordon, et al, 17 September 2010, for our latest
emerging markets equity strategy
Asia Pacific Equity Research 07 October 2010
India Thematic Basket
Indian Health Care Companies: Rx for long hold...
India Indian Equity Strategy
Bijay Kumar, CFAAC
(91-22) 6157-3586 [email protected]
J.P. Morgan India Private Limited
India Small & Mid Cap Princy Singh (91-22) 6157 3587 [email protected]
J.P. Morgan India Private Limited
Dinesh S. Harchandani, CFA (91-22) 6157-3583 [email protected]
J.P. Morgan India Private Limited
Equity Derivatives and Delta One Strategy Tony SK Lee (852) 2800-8857 [email protected]
J.P. Morgan Securities (Asia Pacific) Limited
Clara CS Law (852) 2800-7736 [email protected]
J.P. Morgan Securities (Asia Pacific) Limited
Sue Lee (852) 2800-7898 [email protected]
J.P. Morgan Securities (Asia Pacific) Limited
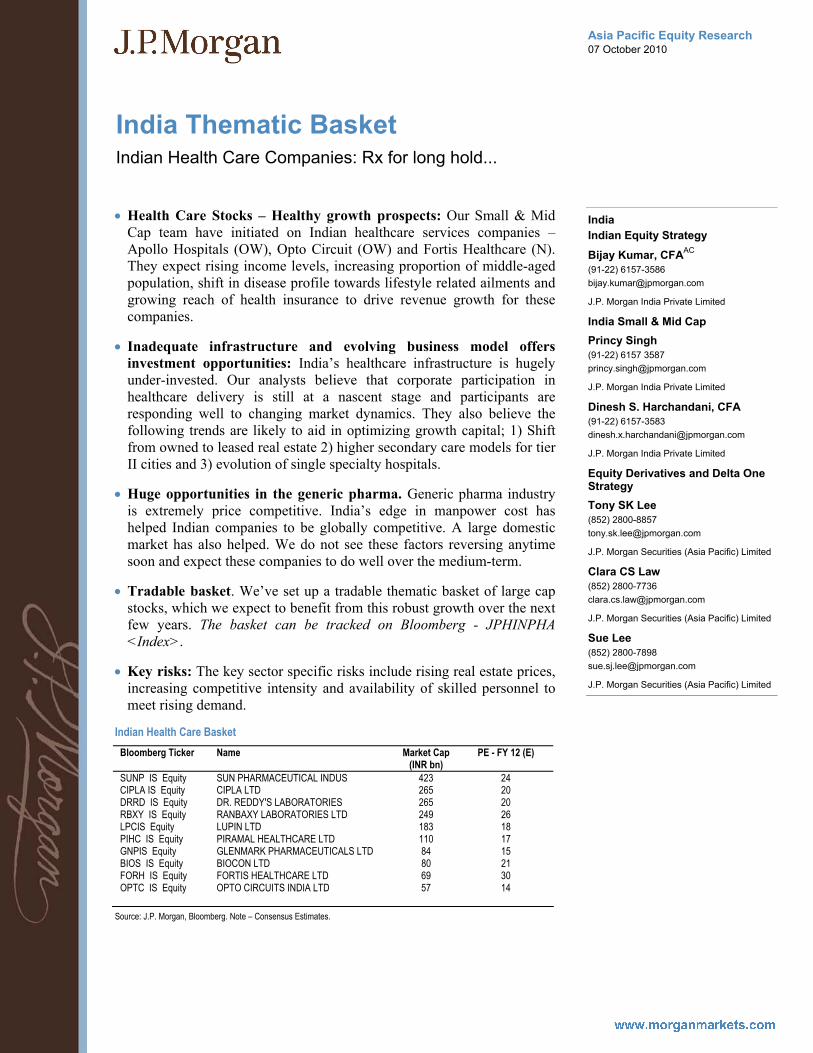
• Health Care Stocks – Healthy growth prospects: Our Small & Mid Cap team have initiated on Indian healthcare services companies – Apollo Hospitals (OW), Opto Circuit (OW) and Fortis Healthcare (N). They expect rising income levels, increasing proportion of middle-aged population, shift in disease profile towards lifestyle related ailments and growing reach of health insurance to drive revenue growth for these companies.
• Inadequate infrastructure and evolving business model offers investment opportunities: India’s healthcare infrastructure is hugely under-invested. Our analysts believe that corporate participation in healthcare delivery is still at a nascent stage and participants are responding well to changing market dynamics. They also believe the following trends are likely to aid in optimizing growth capital; 1) Shift from owned to leased real estate 2) higher secondary care models for tier II cities and 3) evolution of single specialty hospitals.
• Huge opportunities in the generic pharma. Generic pharma industry is extremely price competitive. India’s edge in manpower cost has helped Indian companies to be globally competitive. A large domestic market has also helped. We do not see these factors reversing anytime soon and expect these companies to do well over the medium-term.
• Tradable basket. We’ve set up a tradable thematic basket of large cap stocks, which we expect to benefit from this robust growth over the next few years. The basket can be tracked on Bloomberg - JPHINPHA <Index>.
• Key risks: The key sector specific risks include rising real estate prices, increasing competitive intensity and availability of skilled personnel to meet rising demand.
Indian Health Care Basket Bloomberg Ticker Name Market Cap
(INR bn) PE - FY 12 (E)
SUNP IS Equity SUN PHARMACEUTICAL INDUS 423 24 CIPLA IS Equity CIPLA LTD 265 20 DRRD IS Equity DR. REDDY'S LABORATORIES 265 20 RBXY IS Equity RANBAXY LABORATORIES LTD 249 26 LPCIS Equity LUPIN LTD 183 18 PIHC IS Equity PIRAMAL HEALTHCARE LTD 110 17 GNPIS Equity GLENMARK PHARMACEUTICALS LTD 84 15 BIOS IS Equity BIOCON LTD 80 21 FORH IS Equity FORTIS HEALTHCARE LTD 69 30 OPTC IS Equity OPTO CIRCUITS INDIA LTD 57 14
Source: J.P. Morgan, Bloomberg. Note – Consensus Estimates.

Asia Pacific Equity Research 07 October 2010
New World Development
Overweight 0017.HK, 17 HK
Acquisition of residential project in urban area - ALERT
Price: HK$16.82
07 October 2010
Property
Amy Luk, CFAAC
(852) 2800 8524 [email protected]
Lucia Kwong, CFA (852) 2800-8526 [email protected]
J.P. Morgan Securities (Asia Pacific) Limited
• Acquisition of Kai Yuen Lane project: New World Development announced to acquire a 40% stake in a site located at Kei Yuen Lane, North Point on Hong Kong Island for a consideration of HK$1,865 million from the Cheng family members Mr. Cheng Kam Chiu, Stewart (nephew of Chairman Dr. Cheng Yu Tung) and Mr. Cheng Chi Him (grandson of Chairman). The site was gradually accumulated by the family through old buildings acquisitions for over 10 years. It will be for residential development with a total GFA of 576,000 sf.
• Acquisition cost looks fair, slight NAV accretion: We expect the site to be developed into luxury residential and the land cost at HK$8,095 psf on reported GFA (HK$6,746 psf on marketable GFA) looks fair in view of the scarcity of land supply in urban area, especially on HK Island. We estimate NAV accretion to be less than 1% given the high base. As the company is getting more active in enhancing value through land bank replenishment and redevelopment of commercial properties (e.g. New World Centre in Tsimshatsui), we believe it is fair for the company to trade at historical average discount to NAV. Maintain Overweight.
Summary of Kai Yuen Lane project
Lot number Part of IL 5044 Location Kai Yuen Lane District North Point, Hong Kong Island Type Private residential Site area (sq ft) 72,000 Plot ratio (x) 8.0 Reported residential GFA (sq ft) 576,000 Marketable residential GFA (sq ft) 691,200 Stake 40% Total attributable saleable GFA (sq ft) 276,480 HK$/per sq ft HK$MM Land cost on reported GFA 8,095 1,865 Land cost on marketable GFA 6,746 1,865 Construction cost 2,000 553 Interest cost 394 109 Development costs 9,139 2,527 Estimated ASP 12,000 3,318 Estimated profit margin 23.8% Estimated no. of units 600-700
Source: Company, J.P. Morgan estimates.

Asia Pacific Equity Research 07 October 2010
Sterlite Industries
Overweight STRL.BO, STLT IN
Update from prod call- As 'power v/s aluminum' clarity emerges, focus on coal issues - ALERT
Price: Rs177.50
06 October 2010
Metals
Pinakin Parekh, CFAAC
(91-22) 6157-3588 [email protected]
J.P. Morgan India Private Limited
Key takeaways from Vedanta Resources 2QFY11 production results for Sterlite Industries are: • Aluminum expansion put on hold: Post the Niyamgiri clearance not
going through, the company has temporarily deferred the Phase II alumina, 1.25MT Jharsuguda II smelter (VAL) and 325kt BALCO smelter expansion. The capex impact is likely to be $1.5-2.0bn over the next two years. The output from 2,400MW power plant (excluding the 600MW to be sold to the grid) and 1,200MW BALCO plant will be sold on merchant basis. The existing aluminum operations will produce alumina by using bauxite from BALCO and third party sourcing. The company is still in talks with the Orissa government for allocation of new bauxite deposits.
• Update on power: The company has synchronized the first 600MW unit of the 2,400MW power plant in Aug-10 and the second unit is expected to be synchronized by 3QFY11. As per the management, coal linkage is in place for all the units in the 2,400MW plant and 2 units of the 1200MW BALCO power plant. In our view, the 3 units of the 2,400MW power plant have been issued the LOA based on the recommendation of Standing Linkage Committee. While the LoAs should convert into to linkages, with the increasing coal deficit in the country, sourcing of non-linkage coal by standalone power plants to meet the deficit will determine the cost of power generation and therefore, profitability of the power plant. As highlighted in our recent report (‘India Coal Industry: Demand-supply mismatch positive for miners; domestic pricing trends key to watch’ dated 28th Sept, 2010) Coal India in a letter to the Ministry of Coal in Jan-10 had said that based on the clearances given out till date by the Standing Linkage Committee, Coal India had a negative coal balance over the next few years easily in excess of 100MT.
• Update on Tuticorin copper smelter: The High Court’s order to shut the plant has been appealed at the Supreme Court by the company and the SC will have a detailed hearing on its appeal on Oct 18. While the MoEF clearance is in place for the 400ktpa smelter expansion at Tuticorin, the project is being rescheduled awaiting consent from the State Pollution Control Board.
• 2QFY11 Production update: Strong growth in mine production from HZL with better recoveries from Rampura Agucha mine (which has lower production in 1Q). Refined zinc-lead production in 2QFY11 was slightly below 1Q (-1% q/q). Production increased 26% q/q at VAL with contribution from 500kt Jharsuguda smelter. Copper cathode production was lower due to maintenance shutdown taken during 2QFY11. The power sold increased during the quarter to 968mu mainly due to the power sales from 1,215MW Jharsuguda CPP.

Asia Pacific Equity Research 07 October 2010
Indian capital goods and E&C
Sep-q earnings preview and order flow tracker
Engineering
Shilpa KrishnanAC
(91-22) 6157-3580 [email protected]
Sumit KishoreAC
(91-22) 6157-3581 [email protected]
Deepika Belani (91-22) 6157-3582 [email protected]
J.P. Morgan India Private Limited
Capital goods: Revenue Rs. in millions
Sep-10E Sep-09 % YoY LT 85,741 78,662 9.0 BHEL 81,159 66,252 22.5 Suzlon 28,000 47,930 (41.6) Siemens 31,138 25,180 23.7 ABB 15,628 14,538 7.5 CG 23,883 21,890 9.1 Punj 22,971 29,804 (22.9) Sector 288,521 284,257 1.5 Source: J.P. Morgan estimates, Company data.
Capital goods: Adj. PAT Rs. in millions
Sep-10E Sep-09 % YoY LT 6,518 5,530 17.9 BHEL 10,956 8,579 27.7 Suzlon (4,050) (3,340) 21.2 Siemens 2,385 1,517 57.1 ABB 759 831 (8.6) CG 2,162 1,934 11.8 Punj 280 1,569 (82.1) Sector 19,010 16,619 14.4 Source: J.P. Morgan estimates, Company data.
• Execution disappointments in Sep-q may brew disbelief in the promise of a 2H recovery, especially for L&T, where topline growth expectation has already been tempered down by management (JPMe 9% growth). Implied 2H revenue growth est. is 32%, already challenging. Order inflow expectation of Rs180-200B in Sep-q looks achievable if L&T books captive development projects too. BHEL appears more likely to meet/exceed high growth expectations in our view: Enhanced capacity of 15GW and comfort of order book offers economies of scale and confidence in Sep-q revenue and PAT growth est. of 22.5% and 27.7% respectively. Reported order inflows of Rs89B are a tad low, but realizations are still intact.
• Weak Sep-q for Suzlon: Owing to weak volumes combined with sticky fixed costs, we est. an EBITDA loss of Rs1.46B and PAT loss of Rs4B. Reported inflows from India (~309MW) in Sep-q lend confidence to 1000MW domestic sales est. in FY12, but famine of overseas orders continues (except a ~50MW order from China) which puts FY12 overseas sales est. of 1050MW at risk.
• Potential upside to full year est. for CG, if it maintains 14% margins despite 25-40% YoY hike in transformer input commodity prices, and delivers 9%+ topline growth despite 13% YoY INR appreciation vs. Euro.
• We expect ~20% YoY dip in Punj Lloyd revenues in Sep-q, mainly on account of sharp decline in pipeline segment revenues and weak pick up of revenue booking in long gestation infra projects (Libya, 38% of OB).
• MNC T&D plays: Siemens expected to maintain execution momentum from last quarter, with margin improvement on low base; JPMe healthy PAT growth. Near term pain in ABB expected to continue, expect PAT dip of 8.6%YoY (link to recent ABB report) in Sep-q.
• Stock views in light of Sep-q results: On relative basis we prefer to play BHEL (OW) over L&T (OW), latter is trading at a 18% P/E premium, with higher risk to near-term growth in our view. We are sellers of Suzlon (UW) and cautious on Punj Lloyd (N). We have no absolute buy in T&D, but continue to prefer CG (N), over Siemens (N) over ABB (UW).
Table 1: Capital goods and E&C: Key valuation metrics Year-end March
Company Rating CMP PT Mkt Cap P/E (x) EV/EBITDA (x) Key risk (Rs) (Rs) (US$ bn) FY11E FY12E FY11E FY12E
Suzlon UW 58 41 2.2 NM 15.6 28.2 9.1 Strong order inflows and on time execution Larsen & Toubro OW 2,038 2,050 26.3 26.8 22.6 17.6 14.7 Execution risk Punj Lloyd N 136 116 1.0 15.7 11.4 9.0 7.6 Concentration risk in slow moving orders BHEL OW 2,603 2,770 27.3 23.4 19.2 15.4 12.0 Low realization on new private sector orders ABB UW 934 765 4.2 48.2 33.7 32.2 21.4 Strong execution, order inflows; margin recovery Siemens N 819 695 5.9 31.6 26.8 18.2 15.1 Potential margin risk for shared jobs Crompton Greaves N 334 285 3.9 23.8 21.0 12.2 10.4 Potential margin risk
Source: Bloomberg, J.P. Morgan estimates, Company data. Note: Price on market close of 7 October 2010. ABB (Dec-YE) and Siemens (Sep-YE) numbers have been fiscalized (Mar-YE).
Asia Pacific Equity Research 07 October 2010
Taiwan Life Insurance
Taiwan FSC considers to cut guaranteed return on life insurance policies - Negative
Taiwan Insurance - Life
Dexter HsuAC
(886-2) 2725-9868 [email protected]
J.P. Morgan Securities (Taiwan) Limited.
Penny Lin (886-2) 2725-9870 [email protected]
J.P. Morgan Securities (Taiwan) Limited.
Sunil Garg (852) 2800-8518 [email protected]
J.P. Morgan Securities (Asia Pacific) Limited
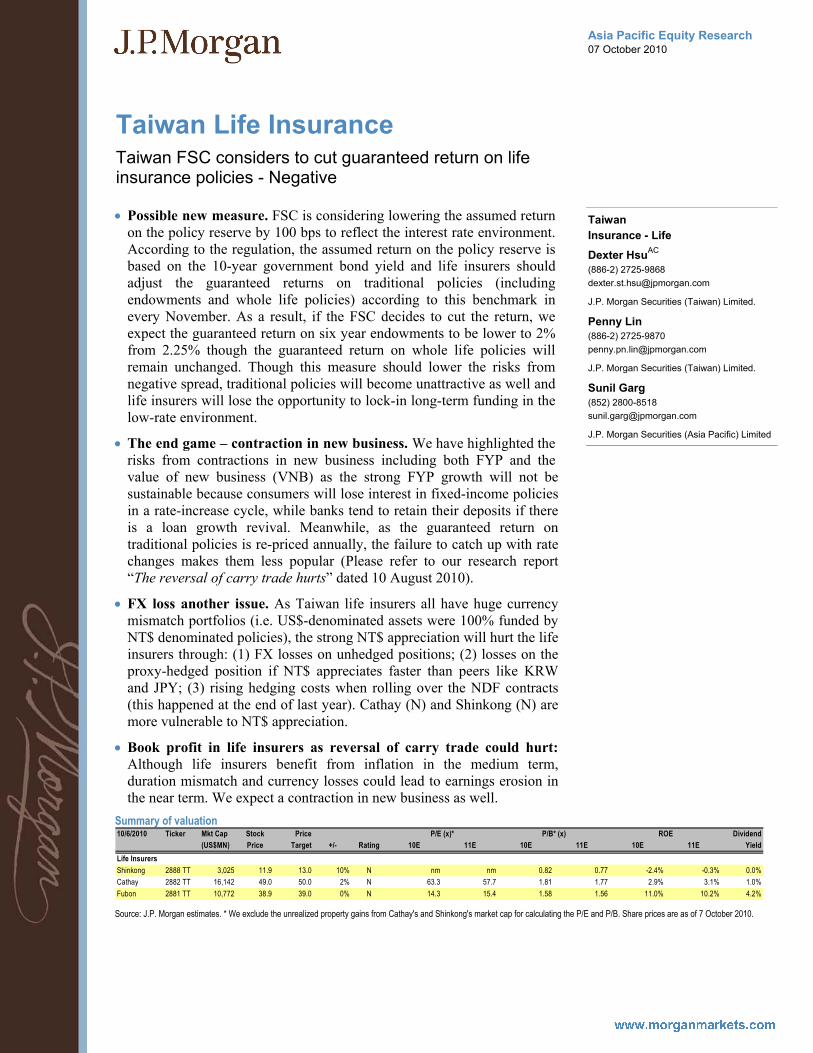
• Possible new measure. FSC is considering lowering the assumed return on the policy reserve by 100 bps to reflect the interest rate environment. According to the regulation, the assumed return on the policy reserve is based on the 10-year government bond yield and life insurers should adjust the guaranteed returns on traditional policies (including endowments and whole life policies) according to this benchmark in every November. As a result, if the FSC decides to cut the return, we expect the guaranteed return on six year endowments to be lower to 2% from 2.25% though the guaranteed return on whole life policies will remain unchanged. Though this measure should lower the risks from negative spread, traditional policies will become unattractive as well and life insurers will lose the opportunity to lock-in long-term funding in the low-rate environment.
• The end game – contraction in new business. We have highlighted the risks from contractions in new business including both FYP and the value of new business (VNB) as the strong FYP growth will not be sustainable because consumers will lose interest in fixed-income policies in a rate-increase cycle, while banks tend to retain their deposits if there is a loan growth revival. Meanwhile, as the guaranteed return on traditional policies is re-priced annually, the failure to catch up with rate changes makes them less popular (Please refer to our research report “The reversal of carry trade hurts” dated 10 August 2010).
• FX loss another issue. As Taiwan life insurers all have huge currency mismatch portfolios (i.e. US$-denominated assets were 100% funded by NT$ denominated policies), the strong NT$ appreciation will hurt the life insurers through: (1) FX losses on unhedged positions; (2) losses on the proxy-hedged position if NT$ appreciates faster than peers like KRW and JPY; (3) rising hedging costs when rolling over the NDF contracts (this happened at the end of last year). Cathay (N) and Shinkong (N) are more vulnerable to NT$ appreciation.
• Book profit in life insurers as reversal of carry trade could hurt: Although life insurers benefit from inflation in the medium term, duration mismatch and currency losses could lead to earnings erosion in the near term. We expect a contraction in new business as well.
Summary of valuation 10/6/2010 Ticker Mkt Cap Stock Price Dividend
(US$MN) Price Target +/- Rating 10E 11E 10E 11E 10E 11E YieldLife InsurersShinkong 2888 TT 3,025 11.9 13.0 10% N nm nm 0.82 0.77 -2.4% -0.3% 0.0%Cathay 2882 TT 16,142 49.0 50.0 2% N 63.3 57.7 1.81 1.77 2.9% 3.1% 1.0%Fubon 2881 TT 10,772 38.9 39.0 0% N 14.3 15.4 1.58 1.56 11.0% 10.2% 4.2%
P/E (x)* P/B* (x) ROE
Source: J.P. Morgan estimates. * We exclude the unrealized property gains from Cathay's and Shinkong's market cap for calculating the P/E and P/B. Share prices are as of 7 October 2010.
Asia Pacific Equity Research 07 October 2010
Taiwan Petrochemicals
Formosa group 3Q preliminary results mostly positive - ALERT
Petrochemicals
Samuel Lee, CFAAC
(852) 2800-8536 [email protected]
Brynjar Eirik Bustnes (852) 2800-8578 [email protected]
J.P. Morgan Securities (Asia Pacific) Limited
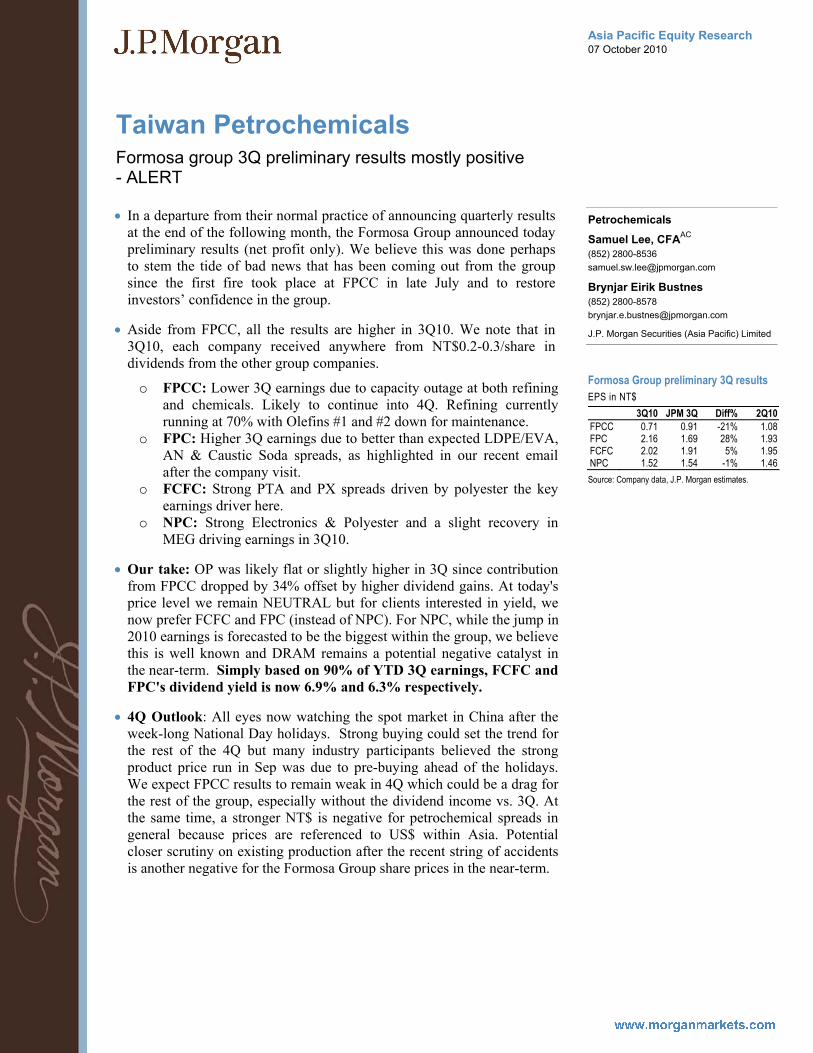
Formosa Group preliminary 3Q results EPS in NT$
3Q10 JPM 3Q Diff% 2Q10 FPCC 0.71 0.91 -21% 1.08 FPC 2.16 1.69 28% 1.93 FCFC 2.02 1.91 5% 1.95 NPC 1.52 1.54 -1% 1.46 Source: Company data, J.P. Morgan estimates.
• In a departure from their normal practice of announcing quarterly results at the end of the following month, the Formosa Group announced today preliminary results (net profit only). We believe this was done perhaps to stem the tide of bad news that has been coming out from the group since the first fire took place at FPCC in late July and to restore investors’ confidence in the group.
• Aside from FPCC, all the results are higher in 3Q10. We note that in 3Q10, each company received anywhere from NT$0.2-0.3/share in dividends from the other group companies.
o FPCC: Lower 3Q earnings due to capacity outage at both refining and chemicals. Likely to continue into 4Q. Refining currently running at 70% with Olefins #1 and #2 down for maintenance.
o FPC: Higher 3Q earnings due to better than expected LDPE/EVA, AN & Caustic Soda spreads, as highlighted in our recent email after the company visit.
o FCFC: Strong PTA and PX spreads driven by polyester the key earnings driver here.
o NPC: Strong Electronics & Polyester and a slight recovery in MEG driving earnings in 3Q10.
• Our take: OP was likely flat or slightly higher in 3Q since contribution from FPCC dropped by 34% offset by higher dividend gains. At today's price level we remain NEUTRAL but for clients interested in yield, we now prefer FCFC and FPC (instead of NPC). For NPC, while the jump in 2010 earnings is forecasted to be the biggest within the group, we believe this is well known and DRAM remains a potential negative catalyst in the near-term. Simply based on 90% of YTD 3Q earnings, FCFC and FPC's dividend yield is now 6.9% and 6.3% respectively.
• 4Q Outlook: All eyes now watching the spot market in China after the week-long National Day holidays. Strong buying could set the trend for the rest of the 4Q but many industry participants believed the strong product price run in Sep was due to pre-buying ahead of the holidays. We expect FPCC results to remain weak in 4Q which could be a drag for the rest of the group, especially without the dividend income vs. 3Q. At the same time, a stronger NT$ is negative for petrochemical spreads in general because prices are referenced to US$ within Asia. Potential closer scrutiny on existing production after the recent string of accidents is another negative for the Formosa Group share prices in the near-term.

Asia Pacific Equity Research 06 October 2010
Realty Check India
Recent rally has been sharp, time to take a breather
India India Property
Saurabh KumarAC
(91-22) 6157-3590 [email protected]
Gunjan Prithyani (91-22) 6157-3593 [email protected]
J.P. Morgan India Private Limited
BSE Realty vs. Sensex
95105115
9/1/20
10
9/8/20
10
9/15/2
010
9/22/2
010
9/29/2
010
10/6/2
010
Source: Bloomberg
• Investment view– Share price rally in the property sector has been sharp off late (+13% M/M). However, incrementally we expect this to moderate given (a) likely muted Sep-Q results given overall sluggish volumes and slow construction progress (b) High relative valuations and (c) Overhang of new paper issuance. Post DLF’s / Sobha’s ~50% rise since June we remove them as our top sector picks as they have largely closed the gap to our Price Targets. We continue to like IBREL given 1.Cheap valuations with it being the only property stock trading below a well defined FY10 book (Rs 235/Share) 2. Improvement in fundamentals given increased sales activity in core Lower Parel asset and 3. Relative underperformance (down 20% YTD) vs. Index (+16%). • Physical market- What’s performing / what’s not: o Bangalore volumes continue steady uptrend; Central Mumbai
perks up after 15% price reduction suggesting base price formation – 3Q absorption run rate in key Indian cities declined by 7% Q/Q primarily led by slowdown in Mumbai/NCR (down 23%/13%) on seasonal weakness. Bangalore/Chennai however stood out registering a 13%/21% Q/Q increase in volumes in 3Q despite July/Aug being a weak months in South India. Unsold inventory in Mumbai/NCR continues to remain low (~7 months); Bangalore has started to see meaningful price increases (10-15%) coming back after a lull of almost one year. IBREL’s new launch in Central Mumbai saw good traction given a ~17% price reduction (via zero financing cost scheme). Stock impact-IBREL, DBRL/Sobha most exposed to Central Mumbai / Bangalore
o Gurgaon leading office recovery – Office absorption continues to improve across most markets with Gurgaon witnessing a meaningful pick up in Jul/Aug (>30% Q/Q). Overall JLL expects the pan India leasing to recover to over 30msf in CY10 vs. 19msf in CY09. Notably rental values too have started to inch up in few micro markets (prime Gurgaon/Mumbai). This then is encouraging though overhang of new supply line (52msf expected in 2010) remains. Stocks- DLF/IBREL has the highest commercial exposure.
o Retail demand showing signs of life, with most retailers reporting positive sales trends and looking favorably at space expansion. However supply remains a challenge. Against total 13.9 msf of expected completions, demand this year is likely to be only 7msf which should keep vacancies high at 24-25% levels. Stocks- Phoenix mills is the only pure play retail mall developer
Indian developer valuations Market Cap P/E P/B ROE US$MM FY11E FY12E FY11E FY12E FY11E FY12E NAV discount DLF 14,162 32.3 24.1 2.4 2.2 8% 10% -7% Unitech 5,325 26.8 16.0 2.0 1.8 8% 12% -21% IBREL 1,664 49.1 17.5 0.8 0.9 2% 5% -29% HDIL 2,482 13.2 8.1 1.3 1.1 11% 15% -26% DB Realty 2,184 19.4 11.5 2.8 2.3 15% 20% -38% Sobha 820 28.7 23.3 2.2 2.0 9% 9% -13% AIT 532 16.7 13.8 1.1 1.2 9% 9% -4%
Source: Company reports and J.P. Morgan estimates. Prices as of Oct 6 (intraday)

20
Asia Pacific Equity Research 08 October 2010
Sunil Garg (852) 2800-8518 [email protected]
Analyst Certification: The research analyst who is primarily responsible for this research and whose name is listed first on the front cover certifies (or in a case where multiple research analysts are primarily responsible for this research, the research analyst named first in each group on the front cover or named within the document individually certifies, with respect to each security or issuer that the research analyst covered in this research) that: (1) all of the views expressed in this research accurately reflect his or her personal views about any and all of the subject securities or issuers; and (2) no part of any of the research analyst’s compensation was, is, or will be directly or indirectly related to the specific recommendations or views expressed by the research analyst in this research.
Important Disclosures
• Market Maker: JPMS makes a market in the stock of Philippine Long Distance Telephone Company. • Lead or Co-manager: J.P. Morgan acted as lead or co-manager in a public offering of equity and/or debt securities for Hitachi
(6501), Honda Motor (7267), Housing Development and Infrastructure Ltd. (HDIL), Inpex Corporation, International Container Terminal Services, Inc., New World Development, Sterlite Industries within the past 12 months.
• Analyst Position: The following analysts (and/or their associates or household members) own a long position in the shares of Bharti Airtel Limited: Bijay Kumar. The following analysts (and/or their associates or household members) own a long position in the shares of Filinvest Land, Inc.: Jeanette Yutan. The following analysts (and/or their associates or household members) own a long position in the shares of Idea Cellular Limited: Bijay Kumar. The following analysts (and/or their associates or household members) own a long position in the shares of Indiabulls Real Estate: Bijay Kumar. The following analysts (and/or their associates or household members) own a long position in the shares of Sobha Developers: Bijay Kumar.
• Beneficial Ownership (1% or more): J.P. Morgan beneficially owns 1% or more of a class of common equity securities of Apollo Hospitals Enterprise Ltd., Housing Development and Infrastructure Ltd. (HDIL), Indiabulls Real Estate.
• Client of the Firm: Amorepacific Corp is or was in the past 12 months a client of JPM. Apollo Hospitals Enterprise Ltd. is or was in the past 12 months a client of JPM. Ascendas India Trust is or was in the past 12 months a client of JPM. Ayala Corporation is or was in the past 12 months a client of JPM; during the past 12 months, JPM provided to the company non-investment banking securities-related service and non-securities-related services. Ayala Land is or was in the past 12 months a client of JPM. Bharti Airtel Limited is or was in the past 12 months a client of JPM; during the past 12 months, JPM provided to the company non-investment banking securities-related service. Brigade Enterprises is or was in the past 12 months a client of JPM. Cathay Financial Holdings is or was in the past 12 months a client of JPM; during the past 12 months, JPM provided to the company investment banking services, non-investment banking securities-related service and non-securities-related services. DLF Limited is or was in the past 12 months a client of JPM; during the past 12 months, JPM provided to the company non-investment banking securities-related service. Energy Development (EDC) Corporation is or was in the past 12 months a client of JPM; during the past 12 months, JPM provided to the company non-securities-related services. Filinvest Land, Inc. is or was in the past 12 months a client of JPM. Formosa Petrochemical Corp is or was in the past 12 months a client of JPM. Formosa Plastics Corp is or was in the past 12 months a client of JPM. Fortis Healthcare Ltd is or was in the past 12 months a client of JPM. Fubon Financial Holdings is or was in the past 12 months a client of JPM; during the past 12 months, JPM provided to the company non-investment banking securities-related service and non-securities-related services. FUJIFILM Holdings (4901) is or was in the past 12 months a client of JPM; during the past 12 months, JPM provided to the company non-investment banking securities-related service and non-securities-related services. Globe Telecom is or was in the past 12 months a client of JPM; during the past 12 months, JPM provided to the company non-investment banking securities-related service and non-securities-related services. Hitachi (6501) is or was in the past 12 months a client of JPM; during the past 12 months, JPM provided to the company investment banking services, non-investment banking securities-related service and non-securities-related services. Honda Motor (7267) is or was in the past 12 months a client of JPM; during the past 12 months, JPM provided to the company investment banking services, non-investment banking securities-related service and non-securities-related services. Housing Development and Infrastructure Ltd. (HDIL) is or was in the past 12 months a client of JPM; during the past 12 months, JPM provided to the company investment banking services. Idea Cellular Limited is or was in the past 12 months a client of JPM. Inpex Corporation is or was in the past 12 months a client of JPM; during the past 12 months, JPM provided to the company investment banking services and non-investment banking securities-related service. International Container Terminal Services, Inc. is or was in the past 12 months a client of JPM; during the past 12 months, JPM provided to the company investment banking services and non-investment banking securities-related service. Korea Exchange Bank is or was in the past 12 months a client of JPM; during the past 12 months, JPM provided to the company non-investment banking securities-related service and non-securities-related services. LG Display is or was in the past 12 months a client of JPM; during the past 12 months, JPM provided to the company investment banking services and non-investment banking securities-related service. Manila Water Company Inc is or was in the past 12 months a client of JPM. New World Development is or was in the past 12 months a client of JPM; during the past 12 months, JPM provided to the company investment banking services. Philippine Long Distance Telephone Company is or was in the past 12 months a client of JPM; during the past 12 months, JPM provided to the company non-investment banking securities-related service and non-securities-related services. Reliance Communications Limited is or was in the past 12 months a client of JPM; during the past 12 months, JPM provided to the company non-investment banking securities-related service. Robinsons Land Corp is or was in the past 12 months a client of JPM. Samsung SDI is or was in the past 12 months a client of JPM; during the past 12 months, JPM provided to the company non-investment banking securities-related service. Shin Kong Financial Holdings is or was in the past 12 months a client of JPM; during the past 12 months, JPM provided to the company non-investment

21
Asia Pacific Equity Research 08 October 2010
Sunil Garg (852) 2800-8518 [email protected]
banking securities-related service and non-securities-related services. Shinhan Financial Group is or was in the past 12 months a client of JPM; during the past 12 months, JPM provided to the company investment banking services, non-investment banking securities-related service and non-securities-related services. SK Energy Co Ltd is or was in the past 12 months a client of JPM; during the past 12 months, JPM provided to the company non-investment banking securities-related service and non-securities-related services. Sterlite Industries is or was in the past 12 months a client of JPM; during the past 12 months, JPM provided to the company investment banking services and non-investment banking securities-related service. Unitech Ltd is or was in the past 12 months a client of JPM.
• Investment Banking (past 12 months): J.P. Morgan received, in the past 12 months, compensation for investment banking services from Cathay Financial Holdings, Hitachi (6501), Honda Motor (7267), Housing Development and Infrastructure Ltd. (HDIL), Inpex Corporation, International Container Terminal Services, Inc., LG Display, New World Development, Shinhan Financial Group, Sterlite Industries.
• Investment Banking (next 3 months): J.P. Morgan expects to receive, or intends to seek, compensation for investment banking services in the next three months from Ayala Corporation, Bharti Airtel Limited, Cathay Financial Holdings, FUJIFILM Holdings (4901), Hitachi (6501), Honda Motor (7267), Housing Development and Infrastructure Ltd. (HDIL), Inpex Corporation, International Container Terminal Services, Inc., LG Display, New World Development, Philippine Long Distance Telephone Company, Reliance Communications Limited, Shinhan Financial Group, Sterlite Industries.
• Non-Investment Banking Compensation: JPMS has received compensation in the past 12 months for products or services other than investment banking from Ayala Corporation, Bharti Airtel Limited, Cathay Financial Holdings, DLF Limited, Fubon Financial Holdings, FUJIFILM Holdings (4901), Globe Telecom, Hitachi (6501), Honda Motor (7267), Inpex Corporation, International Container Terminal Services, Inc., Korea Exchange Bank, LG Display, Philippine Long Distance Telephone Company, Reliance Communications Limited, Samsung SDI, Shin Kong Financial Holdings, Shinhan Financial Group, SK Energy Co Ltd, Sterlite Industries. An affiliate of JPMS has received compensation in the past 12 months for products or services other than investment banking from Ayala Corporation, Ayala Land, Cathay Financial Holdings, Energy Development (EDC) Corporation, Fubon Financial Holdings, FUJIFILM Holdings (4901), Globe Telecom, Hitachi (6501), Honda Motor (7267), Inpex Corporation, International Container Terminal Services, Inc., Korea Exchange Bank, LG Display, Philippine Long Distance Telephone Company, Reliance Communications Limited, Robinsons Land Corp, Shin Kong Financial Holdings, Shinhan Financial Group, SK Energy Co Ltd, Sterlite Industries.
• J.P. Morgan Securities (Far East) Ltd, Seoul branch is acting as a Market Maker (Liquidity Provider) for the Equity Linked Warrants of LG Display and owns 13,968,830 as of 07-Oct-10.
• J.P. Morgan Securities (Far East) Ltd, Seoul branch is acting as a Market Maker (Liquidity Provider) for the Equity Linked Warrants of Samsung SDI and owns 11,474,240 as of 07-Oct-10.
• J.P. Morgan Securities (Far East) Ltd, Seoul branch is acting as a Market Maker (Liquidity Provider) for the Equity Linked Warrants of Shinhan Financial Group and owns 3,593,090 as of 07-Oct-10.
• J.P. Morgan Securities (Far East) Ltd, Seoul branch is acting as a Market Maker (Liquidity Provider) for the Equity Linked Warrants of SK Energy Co Ltd and owns 5,946,400 as of 07-Oct-10.
• MSCI: The MSCI sourced information is the exclusive property of Morgan Stanley Capital International Inc. (MSCI). Without prior written permission of MSCI, this information and any other MSCI intellectual property may not be reproduced, redisseminated or used to create any financial products, including any indices. This information is provided on an 'as is' basis. The user assumes the entire risk of any use made of this information. MSCI, its affiliates and any third party involved in, or related to, computing or compiling the information hereby expressly disclaim all warranties of originality, accuracy, completeness, merchantability or fitness for a particular purpose with respect to any of this information. Without limiting any of the foregoing, in no event shall MSCI, any of its affiliates or any third party involved in, or related to, computing or compiling the information have any liability for any damages of any kind. MSCI, Morgan Stanley Capital International and the MSCI indexes are services marks of MSCI and its affiliates.
Important Disclosures for Equity Research Compendium Reports: Important disclosures, including price charts for all companies under coverage for at least one year, are available through the search function on J.P. Morgan’s website https://mm.jpmorgan.com/disclosures/company or by calling this U.S. toll-free number (1-800-477-0406)
Explanation of Equity Research Ratings and Analyst(s) Coverage Universe: J.P. Morgan uses the following rating system: Overweight [Over the next six to twelve months, we expect this stock will outperform the average total return of the stocks in the analyst’s (or the analyst’s team’s) coverage universe.] Neutral [Over the next six to twelve months, we expect this stock will perform in line with the average total return of the stocks in the analyst’s (or the analyst’s team’s) coverage universe.] Underweight [Over the next six to twelve months, we expect this stock will underperform the average total return of the stocks in the analyst’s (or the analyst’s team’s) coverage universe.] J.P. Morgan Cazenove’s UK Small/Mid-Cap dedicated research analysts use the same rating categories; however, each stock’s expected total return is compared to the expected total return of the FTSE All Share Index, not to those analysts’ coverage universe. A list of these analysts is available on request. The analyst or analyst’s team’s coverage universe is the sector and/or country shown on the cover of each publication. See below for the specific stocks in the certifying analyst(s) coverage universe.

22
Asia Pacific Equity Research 08 October 2010
Sunil Garg (852) 2800-8518 [email protected]
J.P. Morgan Equity Research Ratings Distribution, as of September 30, 2010
Overweight (buy)
Neutral (hold)
Underweight (sell)
J.P. Morgan Global Equity Research Coverage
46% 43% 12%
IB clients* 49% 45% 33% JPMS Equity Research Coverage 43% 48% 8% IB clients* 69% 60% 50%
*Percentage of investment banking clients in each rating category. For purposes only of FINRA/NYSE ratings distribution rules, our Overweight rating falls into a buy rating category; our Neutral rating falls into a hold rating category; and our Underweight rating falls into a sell rating category.
Valuation and Risks: Please see the most recent company-specific research report for an analysis of valuation methodology and risks on any securities recommended herein. Research is available at http://www.morganmarkets.com , or you can contact the analyst named on the front of this note or your J.P. Morgan representative.
Analysts’ Compensation: The equity research analysts responsible for the preparation of this report receive compensation based upon various factors, including the quality and accuracy of research, client feedback, competitive factors, and overall firm revenues, which include revenues from, among other business units, Institutional Equities and Investment Banking.
Registration of non-US Analysts: Unless otherwise noted, the non-US analysts listed on the front of this report are employees of non-US affiliates of JPMS, are not registered/qualified as research analysts under FINRA/NYSE rules, may not be associated persons of JPMS, and may not be subject to FINRA Rule 2711 and NYSE Rule 472 restrictions on communications with covered companies, public appearances, and trading securities held by a research analyst account.
Other Disclosures
J.P. Morgan ("JPM") is the global brand name for J.P. Morgan Securities LLC ("JPMS") and its affiliates worldwide. J.P. Morgan Cazenove is a marketing name for the U.K. investment banking businesses and EMEA cash equities and equity research businesses of JPMorgan Chase & Co. and its subsidiaries.
Options related research: If the information contained herein regards options related research, such information is available only to persons who have received the proper option risk disclosure documents. For a copy of the Option Clearing Corporation’s Characteristics and Risks of Standardized Options, please contact your J.P. Morgan Representative or visit the OCC’s website at http://www.optionsclearing.com/publications/risks/riskstoc.pdf.
Legal Entities Disclosures U.S.: JPMS is a member of NYSE, FINRA and SIPC. J.P. Morgan Futures Inc. is a member of the NFA. JPMorgan Chase Bank, N.A. is a member of FDIC and is authorized and regulated in the UK by the Financial Services Authority. U.K.: J.P. Morgan Securities Ltd. (JPMSL) is a member of the London Stock Exchange and is authorized and regulated by the Financial Services Authority. Registered in England & Wales No. 2711006. Registered Office 125 London Wall, London EC2Y 5AJ. South Africa: J.P. Morgan Equities Limited is a member of the Johannesburg Securities Exchange and is regulated by the FSB. Hong Kong: J.P. Morgan Securities (Asia Pacific) Limited (CE number AAJ321) is regulated by the Hong Kong Monetary Authority and the Securities and Futures Commission in Hong Kong. Korea: J.P. Morgan Securities (Far East) Ltd, Seoul Branch, is regulated by the Korea Financial Supervisory Service. Australia: J.P. Morgan Australia Limited (ABN 52 002 888 011/AFS Licence No: 238188) is regulated by ASIC and J.P. Morgan Securities Australia Limited (ABN 61 003 245 234/AFS Licence No: 238066) is a Market Participant with the ASX and regulated by ASIC. Taiwan: J.P.Morgan Securities (Taiwan) Limited is a participant of the Taiwan Stock Exchange (company-type) and regulated by the Taiwan Securities and Futures Bureau. India: J.P. Morgan India Private Limited is a member of the National Stock Exchange of India Limited and Bombay Stock Exchange Limited and is regulated by the Securities and Exchange Board of India. Thailand: JPMorgan Securities (Thailand) Limited is a member of the Stock Exchange of Thailand and is regulated by the Ministry of Finance and the Securities and Exchange Commission. Indonesia: PT J.P. Morgan Securities Indonesia is a member of the Indonesia Stock Exchange and is regulated by the BAPEPAM LK. Philippines: J.P. Morgan Securities Philippines Inc. is a member of the Philippine Stock Exchange and is regulated by the Securities and Exchange Commission. Brazil: Banco J.P. Morgan S.A. is regulated by the Comissao de Valores Mobiliarios (CVM) and by the Central Bank of Brazil. Mexico: J.P. Morgan Casa de Bolsa, S.A. de C.V., J.P. Morgan Grupo Financiero is a member of the Mexican Stock Exchange and authorized to act as a broker dealer by the National Banking and Securities Exchange Commission. Singapore: This material is issued and distributed in Singapore by J.P. Morgan Securities Singapore Private Limited (JPMSS) [MICA (P) 020/01/2010 and Co. Reg. No.: 199405335R] which is a member of the Singapore Exchange Securities Trading Limited and is regulated by the Monetary Authority of Singapore (MAS) and/or JPMorgan Chase Bank, N.A., Singapore branch (JPMCB Singapore) which is regulated by the MAS. Malaysia: This material is issued and distributed in Malaysia by JPMorgan Securities (Malaysia) Sdn Bhd (18146-X) which is a Participating Organization of Bursa Malaysia Berhad and a holder of Capital Markets Services License issued by the Securities Commission in Malaysia. Pakistan: J. P. Morgan Pakistan Broking (Pvt.) Ltd is a member of the Karachi Stock Exchange and regulated by the Securities and Exchange Commission of Pakistan. Saudi Arabia: J.P. Morgan Saudi Arabia Ltd. is authorized by the Capital Market Authority of the Kingdom of Saudi Arabia (CMA) to carry out dealing as an agent, arranging, advising and custody, with respect to securities business under licence number 35-07079 and its registered address is at 8th Floor, Al-Faisaliyah Tower, King Fahad Road, P.O. Box 51907, Riyadh 11553, Kingdom of Saudi Arabia. Dubai: JPMorgan Chase Bank, N.A., Dubai Branch is regulated by the Dubai Financial Services Authority (DFSA) and its registered address is Dubai International Financial Centre - Building 3, Level 7, PO Box 506551, Dubai, UAE.

23
Asia Pacific Equity Research 08 October 2010
Sunil Garg (852) 2800-8518 [email protected]
Country and Region Specific Disclosures U.K. and European Economic Area (EEA): Unless specified to the contrary, issued and approved for distribution in the U.K. and the EEA by JPMSL. Investment research issued by JPMSL has been prepared in accordance with JPMSL's policies for managing conflicts of interest arising as a result of publication and distribution of investment research. Many European regulators require a firm to establish, implement and maintain such a policy. This report has been issued in the U.K. only to persons of a kind described in Article 19 (5), 38, 47 and 49 of the Financial Services and Markets Act 2000 (Financial Promotion) Order 2005 (all such persons being referred to as "relevant persons"). This document must not be acted on or relied on by persons who are not relevant persons. Any investment or investment activity to which this document relates is only available to relevant persons and will be engaged in only with relevant persons. In other EEA countries, the report has been issued to persons regarded as professional investors (or equivalent) in their home jurisdiction. Australia: This material is issued and distributed by JPMSAL in Australia to “wholesale clients” only. JPMSAL does not issue or distribute this material to “retail clients.” The recipient of this material must not distribute it to any third party or outside Australia without the prior written consent of JPMSAL. For the purposes of this paragraph the terms “wholesale client” and “retail client” have the meanings given to them in section 761G of the Corporations Act 2001. Germany: This material is distributed in Germany by J.P. Morgan Securities Ltd., Frankfurt Branch and J.P.Morgan Chase Bank, N.A., Frankfurt Branch which are regulated by the Bundesanstalt für Finanzdienstleistungsaufsicht. Hong Kong: The 1% ownership disclosure as of the previous month end satisfies the requirements under Paragraph 16.5(a) of the Hong Kong Code of Conduct for Persons Licensed by or Registered with the Securities and Futures Commission. (For research published within the first ten days of the month, the disclosure may be based on the month end data from two months’ prior.) J.P. Morgan Broking (Hong Kong) Limited is the liquidity provider for derivative warrants issued by J.P. Morgan Structured Products B.V. and listed on the Stock Exchange of Hong Kong Limited. An updated list can be found on HKEx website: http://www.hkex.com.hk/prod/dw/Lp.htm. Japan: There is a risk that a loss may occur due to a change in the price of the shares in the case of share trading, and that a loss may occur due to the exchange rate in the case of foreign share trading. In the case of share trading, JPMorgan Securities Japan Co., Ltd., will be receiving a brokerage fee and consumption tax (shouhizei) calculated by multiplying the executed price by the commission rate which was individually agreed between JPMorgan Securities Japan Co., Ltd., and the customer in advance. Financial Instruments Firms: JPMorgan Securities Japan Co., Ltd., Kanto Local Finance Bureau (kinsho) No. 82 Participating Association / Japan Securities Dealers Association, The Financial Futures Association of Japan. Korea: This report may have been edited or contributed to from time to time by affiliates of J.P. Morgan Securities (Far East) Ltd, Seoul Branch. Singapore: JPMSS and/or its affiliates may have a holding in any of the securities discussed in this report; for securities where the holding is 1% or greater, the specific holding is disclosed in the Important Disclosures section above. India: For private circulation only, not for sale. Pakistan: For private circulation only, not for sale. New Zealand: This material is issued and distributed by JPMSAL in New Zealand only to persons whose principal business is the investment of money or who, in the course of and for the purposes of their business, habitually invest money. JPMSAL does not issue or distribute this material to members of "the public" as determined in accordance with section 3 of the Securities Act 1978. The recipient of this material must not distribute it to any third party or outside New Zealand without the prior written consent of JPMSAL. Canada: The information contained herein is not, and under no circumstances is to be construed as, a prospectus, an advertisement, a public offering, an offer to sell securities described herein, or solicitation of an offer to buy securities described herein, in Canada or any province or territory thereof. Any offer or sale of the securities described herein in Canada will be made only under an exemption from the requirements to file a prospectus with the relevant Canadian securities regulators and only by a dealer properly registered under applicable securities laws or, alternatively, pursuant to an exemption from the dealer registration requirement in the relevant province or territory of Canada in which such offer or sale is made. The information contained herein is under no circumstances to be construed as investment advice in any province or territory of Canada and is not tailored to the needs of the recipient. To the extent that the information contained herein references securities of an issuer incorporated, formed or created under the laws of Canada or a province or territory of Canada, any trades in such securities must be conducted through a dealer registered in Canada. No securities commission or similar regulatory authority in Canada has reviewed or in any way passed judgment upon these materials, the information contained herein or the merits of the securities described herein, and any representation to the contrary is an offence. Dubai: This report has been issued to persons regarded as professional clients as defined under the DFSA rules.
General: Additional information is available upon request. Information has been obtained from sources believed to be reliable but JPMorgan Chase & Co. or its affiliates and/or subsidiaries (collectively J.P. Morgan) do not warrant its completeness or accuracy except with respect to any disclosures relative to JPMS and/or its affiliates and the analyst’s involvement with the issuer that is the subject of the research. All pricing is as of the close of market for the securities discussed, unless otherwise stated. Opinions and estimates constitute our judgment as of the date of this material and are subject to change without notice. Past performance is not indicative of future results. This material is not intended as an offer or solicitation for the purchase or sale of any financial instrument. The opinions and recommendations herein do not take into account individual client circumstances, objectives, or needs and are not intended as recommendations of particular securities, financial instruments or strategies to particular clients. The recipient of this report must make its own independent decisions regarding any securities or financial instruments mentioned herein. JPMS distributes in the U.S. research published by non-U.S. affiliates and accepts responsibility for its contents. Periodic updates may be provided on companies/industries based on company specific developments or announcements, market conditions or any other publicly available information. Clients should contact analysts and execute transactions through a J.P. Morgan subsidiary or affiliate in their home jurisdiction unless governing law permits otherwise.
“Other Disclosures” last revised September 1, 2010.
Copyright 2010 JPMorgan Chase & Co. All rights reserved. This report or any portion hereof may not be reprinted, sold or redistributed without the written consent of J.P. Morgan.#$J&098$#*P