TOP MALAYSIAN SMALL CAP COMPANIES - listed...
128
TOP MALAYSIAN SMALL CAP COMPANIES 50 JEWELS 2010 Edition
Transcript of TOP MALAYSIAN SMALL CAP COMPANIES - listed...

TOP MALAYSIAN
SMALL CAP COMPANIES
50 JEWELS
2010 Edition

The OSK Top Malaysian Small Cap Companies is published by OSK Research Sdn. Bhd (OSKRSB)., a wholly-owned subsidiary of OSK Investment Bank Berhad (OSKIB). The research contained in the book is based on information obtained from sources believed to be reliable, but we do not make any representation or warranty as to its accuracy, completeness or correctness. Opinions expressed are subject to change without notice. This publication is prepared for internal circulation. Any recommendation contained in this report does not have regard to the specific investment objectives, financial situation and the particular needs of any specific addressee. This publication is for the information of addresses only and is not to be taken in substitution for the exercise of judgement by addressees, who should obtain separate legal or financial advice. OSKRSB and OSKIB accept no liability whatsoever for any direct or consequential loss arising from any use of this publication or further communication given in relation to this report. This publication is not to be construed as an offer or a solicitation of an offer to buy or sell any securities. OSKRSB, OSKIB and their associates, their directors, and/or employees may have positions in, and may effect transactions in securities mentioned herein and may also perform or seek to perform broking, investment banking and other services for the companies covered in this report.
Distribution in Singapore
This research report produced by OSK Research Sdn Bhd is distributed in Singapore only to “Institutional Investors”, “Expert Investors” or “Accredited Investors” as defined in the Securities and Futures Act, CAP. 289 of Singapore. If you are not an “Institutional Investor”, “Expert Investor” or “Accredited Investor”, this research report is not intended for you and you should disregard this research report in its entirety. In respect of any matters arising from, or in connection with, this research report, you are to contact our Singapore Office, DMG & Partners Securities Pte Ltd (“DMG”).
All Rights Reserved. No part of this publication may be used or re-produced in any manner without the expressed and written permission from OSK Research. The publication is printed on 15 April 2010.
OSK RESEARCH SDN. BHD. (206591-V)(A wholly-owned subsidiary of OSK Investment Bank Berhad)
Kuala Lumpur Hong Kong Singapore Jakarta Shanghai
Malaysia Research OfficeOSK Research Sdn. Bhd.
6th Floor, Plaza OSKJalan Ampang
50450 Kuala LumpurMalaysia
Tel : +(60) 3 9207 7688Fax : +(60) 3 2175 3202
Hong Kong OfficeOSK Securities Hong Kong Ltd.
12th Floor,World-Wide House
19 Des Voeux RoadCentral, Hong Kong
Tel : + (852) 2525 1118Fax : + (852) 2810 0908
Singapore OfficeDMG & Partners
Securities Pte. Ltd.#22-01 Ocean Towers
Singapore 048620Tel : +(65) 6533 1818Fax : +(65) 6532 6211
Jakarta OfficePT OSK Nusadana Securities Indonesia
Plaza Lippo, 14th Floor,Jln. Jend. Sudirman
Kav. 25,Jakarta 12920
IndonesiaTel : + (6221) 520 4599Fax : + (6221) 520 4598
Shanghai OfficeOSK (China) Investment
Advisory Co. Ltd.Room 6506, Plaza 66
No. 1266 West Nan Jing Road200040, Shanghai
China Tel: +(8621) 6288 9611Fax: +(8621) 6288 9633
The Small Cap Research Team
Jeffrey Tan ([email protected])Ng Sem Guan ([email protected])Jason Yap ([email protected])Mervin Chow ([email protected])Jeremy Goh ([email protected])Lim Vi Ming ([email protected])Ahmad Maghfur Usman ([email protected])Norfauzi Nason ([email protected])Law Mei Chi ([email protected])Eing Kar Mei ([email protected])Lim Mei Ching ([email protected])
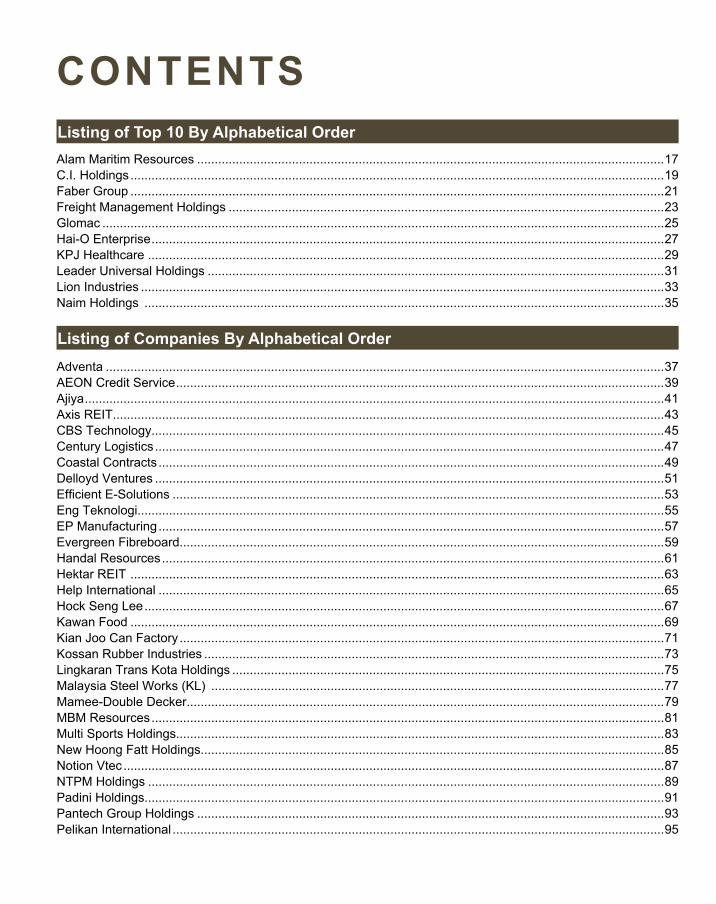
CONTENTSListing of Top 10 By Alphabetical Order
Listing of Companies By Alphabetical Order
Alam Maritim Resources .....................................................................................................................................17C.I. Holdings ........................................................................................................................................................19Faber Group ........................................................................................................................................................21Freight Management Holdings ............................................................................................................................23Glomac ................................................................................................................................................................25Hai-O Enterprise ..................................................................................................................................................27KPJ Healthcare ...................................................................................................................................................29Leader Universal Holdings ..................................................................................................................................31Lion Industries .....................................................................................................................................................33Naim Holdings ....................................................................................................................................................35
Adventa ...............................................................................................................................................................37AEON Credit Service ...........................................................................................................................................39Ajiya .....................................................................................................................................................................41Axis REIT .............................................................................................................................................................43CBS Technology..................................................................................................................................................45Century Logistics .................................................................................................................................................47Coastal Contracts ................................................................................................................................................49Delloyd Ventures .................................................................................................................................................51Efficient E-Solutions ............................................................................................................................................53Eng Teknologi......................................................................................................................................................55EP Manufacturing ................................................................................................................................................57Evergreen Fibreboard..........................................................................................................................................59Handal Resources ...............................................................................................................................................61Hektar REIT ........................................................................................................................................................63Help International ................................................................................................................................................65Hock Seng Lee ....................................................................................................................................................67Kawan Food ........................................................................................................................................................69Kian Joo Can Factory ..........................................................................................................................................71Kossan Rubber Industries ...................................................................................................................................73Lingkaran Trans Kota Holdings ...........................................................................................................................75Malaysia Steel Works (KL) .................................................................................................................................77Mamee-Double Decker........................................................................................................................................79MBM Resources ..................................................................................................................................................81Multi Sports Holdings...........................................................................................................................................83New Hoong Fatt Holdings....................................................................................................................................85Notion Vtec ..........................................................................................................................................................87NTPM Holdings ...................................................................................................................................................89Padini Holdings....................................................................................................................................................91Pantech Group Holdings .....................................................................................................................................93Pelikan International ............................................................................................................................................95

Listing of Companies By Industry Classification
Plenitude..............................................................................................................................................................97Protasco ..............................................................................................................................................................99QL Resources....................................................................................................................................................101Salcon................................................................................................................................................................103Signature International ......................................................................................................................................105Southern Steel ..................................................................................................................................................107Sunway Holdings ...............................................................................................................................................109Trans-Asia Shipping ..........................................................................................................................................111Yi Lai Holdings...................................................................................................................................................113Zhulian ...............................................................................................................................................................115
Automotive Delloyd Ventures .............................................................................................................................................51 EP Manufacturing .............................................................................................................................................57 MBM Resources ...............................................................................................................................................81 New Hoong Fatt Holdings ...............................................................................................................................85
Building Materials Ajiya..................................................................................................................................................................41 Evergreen Fibreboard ......................................................................................................................................59 Yi-Lai ..............................................................................................................................................................113 Signature International ..................................................................................................................................105
Conglomerate Faber Group .....................................................................................................................................................21
Construction Hock Seng Lee .................................................................................................................................................67 Naim Holdings ..................................................................................................................................................35 Protasco ...........................................................................................................................................................99 Sunway Holdings............................................................................................................................................109
Consumer C.I. Holdings .....................................................................................................................................................19 Hai-O Enterprise ..............................................................................................................................................27 Kawan Food ....................................................................................................................................................69 Kian Joo Can Factory ......................................................................................................................................71 Mamee-Double Decker ....................................................................................................................................79 Multi Sports Holdings .......................................................................................................................................83 NTPM Holdings ...............................................................................................................................................89 Padini Holdings ...............................................................................................................................................91 Pelikan International ........................................................................................................................................95 QL Resources ................................................................................................................................................101 Zhulian............................................................................................................................................................115
Education HELP International ...........................................................................................................................................65

Financial Services AEON Credit Service........................................................................................................................................39
Healthcare / Bio-Technology KPJ Healthcare ...............................................................................................................................................29
Industrial Products Leader Universal Holdings ...............................................................................................................................31
Logistics Century Logistics Holdings ...............................................................................................................................47 Freight Management Holdings .........................................................................................................................23 Trans-Asia Shipping Corp ..............................................................................................................................111
Oil and Gas Alam Maritim Resources .................................................................................................................................17 Coastal Contracts ............................................................................................................................................49 Handal Resources ............................................................................................................................................61
Others Salcon ............................................................................................................................................................103
Property Glomac .............................................................................................................................................................25 Plenitude .........................................................................................................................................................97
REIT Axis REIT .........................................................................................................................................................43 Hektar REIT .....................................................................................................................................................63
Rubber Gloves Adventa ............................................................................................................................................................37 Kossan Rubber Industries ................................................................................................................................73
Steel Lion Industries Corp ........................................................................................................................................33 Malaysia Steel Works (KL) ...............................................................................................................................77 Pantech Group Holdings .................................................................................................................................93 Southern Steel................................................................................................................................................107
Technology CBS Technology ..............................................................................................................................................45 Efficient E-Solutions .........................................................................................................................................53 Eng Teknologi ..................................................................................................................................................55 Notion Vtec ......................................................................................................................................................87
Toll Concession Lingkaran Trans Kota Holdings .......................................................................................................................75

< This page has been left blank intentionally >

FOREWORDThe OSK Top Malaysian Small Cap Companies (50 jewels) has come a long way from its humble
beginnings in 2005 as a reference material showcasing good small cap companies that are under-researched and little known to the investment community. The publication has since evolved into the leading small cap investment compendium in Malaysia helping investors make better and more informed investment decisions. The latest publication marks its 6th edition.
Over the years, the contents of the book have been refreshed to reflect changes within the Malaysian capital market landscape and in meeting the rising demands for value investing by the more sophisticated investors. New themes have been progressively introduced in support of the government’s efforts to make Malaysia a preferred investment destination and to attract the listing of more foreign companies. The number of small caps companies listed on Bursa Malaysia continues to increase and with the added breadth and scope comes the greater challenge of uncovering true jewels. The book captures the spirit of investing in smaller caps with fundamental reviews on the leading names that are under-appreciated.
At the core of this annual publication is a passionate team of small cap research analysts and the unequivocal support of our esteemed clients and readers, now spanning the breadth of our regional network of offices. We are especially grateful to our partners being the management of the companies featured herein for providing valuable updates and a peek into the future prospects of the companies.
As the research arm of OSK Investment Bank, a regional financial services provider, we remain committed to taking client relationships to a higher level via equity research that offers unparalleled insight, leveraging on the virtues of integrity and independence. We are humbled by our leading position in the small cap space, a testament of our widest coverage of the small cap companies in Malaysia. In recognition of our efforts, we have been voted the leading research house by Asiamoney for Small Cap Research since 2006.
Happy Investing!
The Malaysian Small Caps Research Team
OSK Research Sdn. Bhd.Level 6, Plaza OSKJalan Ampang50450 Kuala LumpurMalaysia
27th April 2010
Research

1
Introduction
For the 2010 edition, the market capitalisation threshold has been raised to RM1.5bn (USD 440m) from RM1bn previously as to maintain the breadth of coverage and to ensure that the better small cap companies are represented. This indirectly reflects the increased optimism on the market against the backdrop of the global economic recovery and rotational themes prevalent within the small cap space. The selection process has never been made more difficult with many jewels having already been uncovered in the past and their share prices approaching intrinsic values. The fact that our 2009 picks have performed remarkably challenges the team to be more vigilant when pitching for new ideas and winners. On the other hand, stocks that remain under-appreciated were not left out and continue to be promoted. On this basis, 31 companies from the previous edition have been retained as their fundamentals remain strong. As before, the individual stock reports are preceded by a section detailing our headline views on key sectors which we believe would provide investors with a more holistic view on the prospects of the respective industries.
OSK Research does not in any way warrant that the share prices will adjust to the levels as depicted by the target prices determined by our analysts. It is hoped that with the improved profiling via primary research, the market prices of these companies would reflect their intrinsic values over time.
A Review
Our 2009 edition saw all but 4 stocks recording positive absolute share price returns, marking a hit rate of 92%. 32 of the 50 companies featured posted absolute returns of 50%-375%, outperforming the FBM KLCI and FBM EMAS. Most of our Top 10 picks fared well, with notable winners being Mudajaya, our top construction pick which rallied 347%, while O&G player Alam Maritim surged 201%. In all, half of our Top 10 picks posted an average return of 211%. The glove makers were the runaway sector winners, racking up an average return of 253%, courtesy of the strong YTD gains by Adventa and Hartalega of 375% and 288% respectively. This was followed by the steel sector, where share prices doubled on average while the O&G sector posted a mean return of 97%. We see the party on small caps spilling into the 3Q10 with the key catalysts coming from their still attractive valuations vis-a-vis their forward earnings growth (our Top 50 small cap earnings universe show a forward PER 9.1x), thematic interests as well as the extension of the rotational play on sectors deemed cyclical. Our house view is to trade small caps into the 3Q10 where we see stocks that are exposed to the following sectors gaining most- healthcare, rubber gloves, technology, construction, steel and oil& gas. By way of their lower foreign ownership levels, smaller cap stocks are also fairly insulated from a sell-down or a major correction in the market and hence should remain an inherent part of investors’ portfolio given the expected volatility in the market.
The 2010 edition sees the addition of 19 new companies from a cross-section of industries and sectors. 2 new categories were added, namely financial services and conglomerate. The stocks (in no particular order) are CI Holdings, Delloyd Ventures, Signature International, Axis REIT, EP Manufacturing (EPMB), Notion VTec, Glomac, Sunway Group, Mamee-Double Decker, Multi Sports, Salcon, Faber, AEON Credit, Protasco, Zhulian, Handal, Engtek, Southern Steel and Evergreen Fibreboard. The research team has handpicked the stocks for their positive share price catalysts moving forward, undemanding valuations and strong/improving fundamentals, having met the internal thresholds/benchmarks for inclusion in the book. Among the notable mentions are Multi Sports- China’s first shoe sole manufacturer to be listed on Bursa, C.I. Holdings-the maker and distributor of carbonated and non-carbonated beverages in Malaysia, AEON Credit- the micro-credit financier, Zhulian- Malaysia’s largest producer of gold plated jewellery for the direct selling market and Signature International- the award winning kitchen cabinet specialist that has made significant strides overseas. 3 of the newly added stocks are in our Top 10 list, namely Faber, C.I. Holdings and Glomac with C.I. Holdings making it into the Top 5.

2
Figure 1: % distribution of the Top 50 companies for the 2010 Edition
Automotive8%
Building Materials8%
Conglomerate2%
Construction8%
Consumer22%
Education 2%
Finance 2% Healthcare
2%
Industrial Products2%
Logistics 6%
Oil and Gas6%
Others 2%
Property 4%
REIT 4%
Rubber Gloves4%
Steel8%
Technology8%
Figure 2: Top 10 stocks (2009 Edition) performance in ascending order of absolute share price returns for 2009
0% 50% 100% 150% 200% 250% 300% 350% 400%
Mudajaya
Alam Maritim
KPJ Healthcare
Hai-O Resources
Wah Seong Corporation
Kossan
QL Resources
Hektar REIT
Malaysian Steel Works
New Hoong Fatt
Figure 3: Market capitalisation distribution for the 2010 Edition
10%
46%32%
8%4%
0 -100m
100m - 500m
500m - 1000m
1000m - 1500m
1500m - 2000m
Table 1: Number of stocks listed by sector in the 2009 and 2010 Editions
Sector classification 2010 2009Automotive 4 2Building Materials 4 2Conglomerate^ 1 0Construction 4 4Consumer 11 11Education* 1 1Financial Services^ 1 0Healthcare 1 3Industrial Products 1 3Logistics 3 3Oil and Gas 3 3Others 1 3Property 4 1Rubber Gloves 2 3Steel 4 4Technology 4 3Toll Concession 1 1
^ new categories in 2010 edition* reclassification from “others”
46 of the 50 companies featured in the 2009 edition recorded positive returns with 64% of the stocks outperforming the FBM KLCI and FBM Emas. Our top 10 picks (Fig. 2) recorded commendable absolute share price returns of 52-347% in 2009.

3
Market Capitalisation of the Top 50 (RMm)
0 400 800 1,200 1,600
Handal ResourcesEP ManufacturingCBS Technology
Trans-Asia ShippingFreight Management
Signature InternationalYi-Lai
Efficient E-SolutionsCentury Logistics
AjiyaKawan Food
New Hoong FattMulti Sports
HELP InternationalMalaysia Steel Works
Delloyd VenturesC.I. Holdings
ProtascoEng Teknologi
SalconPantech Group
Hektar REITPlenitude
GlomacLeader Universal
Mamee-Double DeckerAEON Credit
PadiniNotion Vtec
Kian Joo Can FactoryAdventa
Axis REITNTPM
MBM ResourcesPelikan International
ZhulianNaim
Evergreen FibreboardHai-O Enterprise
Coastal ContractsHock Seng Lee
Faber GroupSunway
Alam MaritimSouthern SteelKossan RubberQL ResourcesLion Industries
Lingkaran Trans KotaKPJ Healthcare
Return on Equity (ROE) of the Top 50 (%)
0% 10% 20% 30% 40%
EP ManufacturingYi-Lai
Kian Joo Can FactoryGlomac
Trans-Asia ShippingPlenitudeAxis REIT
SalconHektar REIT
MBM ResourcesLion Industries
Malaysia Steel WorksPelikan International
Leader UniversalProtasco
Delloyd VenturesNew Hoong Fatt
AjiyaNaim
SunwayCentury Logistics
Evergreen FibreboardKawan Food
Efficient E-SolutionsFreight Management
KPJ HealthcareHELP International
Alam MaritimSouthern SteelEng Teknologi
Lingkaran Trans KotaFaber Group
QL ResourcesC.I. Holdings
PadiniMamee-Double Decker
Hock Seng LeeAEON Credit
CBS TechnologyHandal Resources
NTPMCoastal Contracts
Notion VtecKossan Rubber
ZhulianSignature International
AdventaMulti Sports
Pantech GroupHai-O Enterprise

4
FY10 PER of the Top 50 (x) FY10 Dividend Yields of the Top 50 (%)
0 5 10 15 20
Lingkaran Trans KotaQL Resources
KPJ HealthcareNTPM
Hock Seng LeeHai-O Enterprise
Axis REITSalcon
Kossan RubberHektar REIT
HELP InternationalGlomac
C.I. HoldingsYi-LaiPadini
Kawan FoodNotion Vtec
Faber GroupAdventa
AEON CreditNaim
Kian Joo Can FactoryAlam Maritim
ZhulianMamee-Double DeckerEvergreen Fibreboard
Pelikan InternationalSunway
EP ManufacturingMBM Resources
Pantech GroupEfficient E-Solutions
CBS TechnologyDelloyd Ventures
PlenitudeProtasco
Leader UniversalSignature International
Southern SteelFreight Management
Eng TeknologiTrans-Asia Shipping
Coastal ContractsNew Hoong Fatt
AjiyaCentury Logistics
Malaysia Steel WorksLion Industries
Handal ResourcesMulti Sports
0% 5% 10% 15%
CBS TechnologyEp Manufacturing
Lion IndustriesSunway
Coastal ContractsAlam Maritim
SalconHELP International
Kossan RubberAdventa
Signature InternationalNaim
Kawan FoodDelloyd Ventures
Hock Seng LeeEfficient E-Solutions
Pantech GroupFaber Group
Handal ResourcesAjiya
QL ResourcesMalaysia Steel Works
KPJ HealthcareMBM Resources
Evergreen FibreboardNotion Vtec
Leader UniversalPelikan International
PlenitudePadini
Southern SteelGlomac
Century LogisticsNTPM
Hai-O EnterpriseAEON Credit Service
Eng TeknologiLingkaran Trans Kota Kian Joo Can Factory
C.I. HoldingsProtasco
New Hoong Fat Freight ManagementTrans-Asia Shipping
ZhulianAxis REIT
Yi-LaiHektar REITMulti Sports
Mamee-Double Decker

5
The Screening Methodology
The 50 companies are selected based on the following measures and scorecards.
• Market Capitalization* (<= RM1.5bn) • Profit track record• Price earnings ratio (PER) • Price to NTA (P/NTA)• Net gearing • Return on Equity (ROE)• Compounded Annual Growth Rate (CAGR) in earnings • Dividend outlook • Management track record
* note that the actual market capitalisation may differ slightly from the cut-off date used for the publication
The companies are then ranked based on the following parameters
• Lowest FY10 PER• Lowest FY10 Price/Book Value• Highest FY10 Dividend Yield• Highest FY10 ROE• Highest 3 year EPS CAGR • Lowest Price/Earnings Growth (PEG)• Lowest Relative Sector PER
The sectors and/or industries that the companies in the 2010 edition represent are:
• Automotive• Building Materials• Consumer• Conglomerate • Construction • Education • Financial Services• Healthcare/Bio-Technology• Industrial Products• Logistics• Oil & Gas• Property • Rubber Gloves• Steel • Technology • Toll Concession • Real Estate Investment Trust (REIT)

6
Ranking Based on Forward FY10 PER (x)
Stock (X)
1 Multi Sports Holdings Ltd 2.2 2 Handal Resources 4.1 3 Lion Industries Corporation 4.5 4 Malaysia Steel Works (KL) 4.7 5 Century Logistics Holdings 5.0 6 Ajiya 5.5 7 New Hoong Fatt Holdings 5.5 8 Coastal Contracts 5.6 9 Trans-Asia Shipping Corporation 5.7 10 Eng Teknologi Holdings 6.0
Ranking Based on Forward FY10 P/BV (x)
Stock (X)
1 EP Manufacturing 0.42 Trans-Asia Shipping Corporation 0.43 Lion Industries Corporation 0.54 Malaysia Steel Works (KL) 0.55 Plenitude 0.66 Multi Sports Holdings Ltd 0.67 Yi-Lai 0.68 Kian Joo Can Factory 0.69 New Hoong Fatt Holdings 0.710 MBM Resources 0.7

7
Ranking Based on Highest FY10 Gross Dividend Yield (%)
Stock (%)
1 Mamee-Double Decker 12.42 Multi Sports Holdings Ltd 9.53 Hektar REIT 8.94 Yi-Lai 8.35 Axis REIT 8.16 Zhulian 7.77 Trans-Asia Shipping Corporation 7.48 Freight Management Holdings 6.89 New Hoong Fatt Holdings 6.610 Protasco 6.3
Ranking Based on Highest FY10 ROE (%)
Stock (%)
1 Hai-O Enterprise 33.72 Pantech Group Holdings 31.43 Multi Sports Holdings Ltd 31.04 Adventa 27.75 Zhulian 26.66 Signature International 26.67 Kossan Rubber Industries 26.08 Notion Vtec 25.99 Coastal Contracts 25.810 NTPM Holdings 24.6

8
Ranking Based on Highest 3-Year CAGR (FY07-FY10) (%)
Stock (%)
1 Salcon 83.92 Mamee-Double Decker 59.13 Adventa 57.34 Eng Teknologi 54.85 C.I. Holdings 52.76 Hai-O Enterprise 50.37 Delloyd Ventures 45.78 AEON Credit Service 39.39 Alam Maritim Resources 34.010 Coastal Contracts 32.1
Ranking Based on Lowest PEG (x)
Stock (%)
1 Multi Sports Holdings Ltd 0.12 2 C.I. Holdings 0.12 3 Eng Teknologi 0.14 4 Mamee-Double Decker 0.17 5 Coastal Contracts 0.17 6 Delloyd Ventures 0.18 7 Salcon 0.19 8 Adventa 0.20 9 Pantech Group Holdings 0.25 10 AEON Credit Service 0.26
9
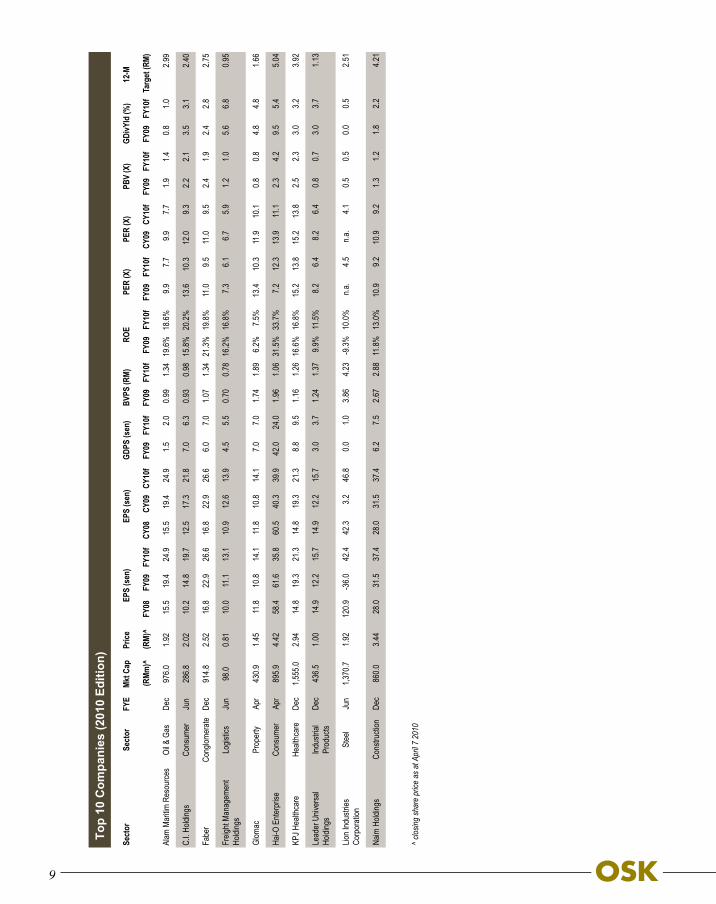
Top
10 C
ompa
nies
(201
0 Ed
ition
)
Sect
orSe
ctor
FYE
Mkt C
apPr
iceEP
S (s
en)
EPS
(sen
)GD
PS (s
en)
BVPS
(RM)
RO
E PE
R (X
)PE
R (X
)PB
V (X
)GD
ivYld
(%)
12-M
(RMm
)^ (R
M)^
FY08
FY09
FY10
fCY
08CY
09CY
10f
FY09
FY10
fFY
09FY
10f
FY09
FY10
fFY
09FY
10f
CY09
CY10
fFY
09FY
10f
FY09
FY10
fTa
rget
(RM)
Alam
Mar
itim R
esou
rces
Oil &
Gas
Dec
976.0
1.9
2 15
.5 19
.4 24
.9 15
.5 19
.4 24
.9 1.5
2.0
0.99
1.34
19.6%
18.6%
9.9
7.7
9.9
7.7
1.9
1.4
0.81.0
2.99
C.I. H
olding
sCo
nsum
erJu
n28
6.8
2.02
10.2
14.8
19.7
12.5
17.3
21.8
7.0 6.
3 0.9
3 0.9
8 15
.8%20
.2%13
.6 10
.3 12
.0 9.3
2.2
2.1
3.53.1
2.40
Fabe
rCo
nglom
erate
Dec
914.8
2.5
2 16
.8 22
.9 26
.6 16
.8 22
.9 26
.6 6.0
7.0
1.07
1.34
21.3%
19.8%
11.0
9.5
11.0
9.5
2.4
1.9
2.42.8
2.75
Freig
ht Ma
nage
ment
Holdi
ngs
Logis
tics
Jun
98.0
0.81
10.0
11.1
13.1
10.9
12.6
13.9
4.5 5.
5 0.7
0 0.7
8 16
.2%16
.8%7.3
6.1
6.7
5.9
1.2
1.0
5.6
6.8 0.
95
Glom
ac
Prop
erty
Apr
430.9
1.4
5 11
.8 10
.8 14
.1 11
.8 10
.8 14
.1 7.0
7.0
1.74
1.89
6.2%
7.5%
13.4
10.3
11.9
10.1
0.8
0.8
4.84.8
1.66
Hai-O
Ente
rpris
eCo
nsum
erAp
r89
5.9
4.42
58.4
61.6
35.8
60.5
40.3
39.9
42.0
24.0
1.96
1.06
31.5%
33.7%
7.2
12.3
13.9
11.1
2.3
4.2
9.55.4
5.04
KPJ H
ealth
care
Healt
hcar
eDe
c1,5
55.0
2.94
14.8
19.3
21.3
14.8
19.3
21.3
8.8 9.
5 1.1
6 1.2
6 16
.6%16
.8%15
.2 13
.8 15
.2 13
.8 2.5
2.3
3.0
3.2 3.
92
Lead
er U
niver
sal
Holdi
ngs
Indus
trial
Prod
ucts
Dec
436.5
1.0
0 14
.9 12
.2 15
.7 14
.9 12
.2 15
.7 3.0
3.7
1.24
1.37
9.9%
11.5%
8.2
6.4
8.2
6.4
0.8
0.7
3.03.7
1.13
Lion I
ndus
tries
Corp
orati
onSt
eel
Jun
1,370
.7 1.9
2 12
0.9
-36.0
42.4
42.3
3.2
46.8
0.0 1.
0 3.8
6 4.2
3 -9
.3%10
.0%n.a
.4.5
n.a
. 4.1
0.5
0.5
0.0
0.5 2.
51
Naim
Hold
ings
Cons
tructi
onDe
c86
0.0
3.44
28.0
31.5
37.4
28.0
31.5
37.4
6.2 7.
5 2.6
7 2.8
8 11
.8%13
.0%10
.9 9.2
10
.9 9.2
1.3
1.2
1.8
2.2 4.
21
^ clos
ing sh
are
price
as a
t Apr
il 7 2
010

10
Top
Sect
or P
icks
(201
0 Ed
ition
)
Sect
orCo
mpa
nies
FY
EMk
t Cap
Price
EPS
(sen
)EP
S (s
en)
GDPS
(sen
) BV
PS (R
M)
ROE
(%)
PER
(X)
PER
(X)
PBV
(X)
GDivY
ld (%
) 12
-M (R
Mm)^
(RM)
^FY
08FY
09FY
10f
CY08
CY09
CY10
fFY
09FY
10f
FY09
FY10
fFY
09FY
10f
FY09
FY10
fCY
09CY
10f
FY09
FY10
fFY
09FY
10f
Targ
et (R
M)
Autom
otive
EP M
anufa
cturin
gDe
c84
.6 0.5
1 4.6
4.3
7.3
4.6
4.3
7.3
0.0
0.0
1.3
4 1.4
1 3.2
5.211
.97.0
11.9
7.0
0.4
0.4
0.00.0
0.59
Cons
umer
C.I. H
olding
sJu
n28
6.8
2.02
10.2
14.8
19.7
12.5
17.3
21.8
7.0
6.3
0.93
0.98
15.8
20.2
13.6
10.3
12.0
9.3
2.2
2.1
3.53.1
2.40
Cons
tructi
onNa
im H
olding
sDe
c86
0.0
3.44
28.0
31.5
37.4
28.0
31.5
37.4
6.2
7.5
2.67
2.88
11.7
13.0
10.9
9.210
.9 9.2
1.3
1.2
1.8
2.24.2
1
Healt
hcar
eKP
J De
c1,5
55.0
2.94
14.8
19.3
21.3
14.8
19.3
21.3
8.8
9.5
1.16
1.26
16.6
16.8
15.2
13.8
15.2
13.8
2.5
2.3
3.03.2
3.92
Logis
tics
Freig
ht Ma
nage
ment
Jun
98.0
0.81
10.0
11.1
13.1
10.9
12.6
13.9
4.5
5.5
0.70
0.78
16.2
16.8
7.36.1
6.7
5.91.2
1.0
5.6
6.80.9
5
Oil &
Gas
Alam
Mar
itimDe
c97
6.0
1.92
15.5
19.4
24.9
15.5
19.4
24.9
1.5
2.0
0.99
1.34
19.6
18.6
9.97.7
9.9
7.7
1.9
1.4
0.81.0
2.99
Prop
erty
Glom
acAp
r43
0.9
1.45
11.8
10.8
14.1
11.8
10.8
14.1
7.0
7.0
1.74
1.89
6.27.5
13.4
10.3
11.9
10.1
0.8
0.8
4.84.8
1.66
REIT
Hekta
r REI
TDe
c39
0.4
1.22
18.9
11.6
11.5
18.9
11.6
11.5
10.3
10.8
1.27
1.28
9.19.0
10.5
10.6
10.5
10.6
1.0
1.0
8.48.9
1.29
Rubb
er G
loves
Koss
an R
ubbe
r Ind
ustrie
sDe
c1,3
18.9
8.25
37.1
41.8
74.5
37.1
41.8
74.5
12.0
13.0
2.24
2.87
18.7
26.0
19.7
11.1
19.7
11.1
3.7
2.9
1.51.6
11.30
Stee
lLio
n Ind
ustrie
sJu
n1,3
70.7
1.92
120.9
-3
6.042
.4 42
.3 3.2
46
.8 0.0
1.0
3.8
6 4.2
3 -9
.310
.0n.a
.4.5
n.a.
4.1
0.5
0.5
0.00.5
2.51
Tech
nolog
yCB
S Te
chno
logy
Dec
87.5
0.37
3.8
6.9
8.0
3.8
6.9
8.0
0.0
0.0
0.27
0.35
25.4
23.3
5.44.6
5.4
4.6
1.4
1.1
0.00.0
0.48
Build
ing M
ateria
lsEv
ergr
een
Fibre
boar
dDe
c88
2.4
1.72
15.0
17.0
23.1
15.0
17.0
23.1
5.3
7.5
1.38
1.55
13.3
15.8
10.1
7.410
.1 7.4
1.2
1.1
3.1
4.42.0
8
^ clos
ing sh
are
price
as a
t Apr
il 7 2
010

11
INVESTMENT MERITS
Strong outstanding orderbook of RM1.2bn to last for the next 3 years Profound reputation, strong management team and balance sheet.
ABC stands out as one of the most competitive contenders for more infrastructure works to be rolled out from the 9MP
Strong balance sheet. Sitting on a huge cash pile of RM146.2m (net cash of RM78.5m or RM1.18/share)
Upcoming oil palm plantation (20,500ha) by 2010 will contribute significantly to ABC’s earnings post 9MP
COMPANY PROFILE
KEY HIGHLIGHTS
ABC Berhad“A” Class Contractor
Share Profile/Statistics Bloomberg Ticker ABC MKIssued Share Capital (m) 66.76Market Capitalisation (RMm) 169.5652 week H | L Price (RM) 2.85 | 1.803m Average Volume (’000) 77.23YTD Returns (%) 0.32Net gearing (x) 1.74Altman Z-Score 1.75ROCE/WACC 1.64Beta (x) 0.87Book Value/share (RM) 1.76
Major Shareholders (%)Zaki Holdings (M) SB 60.35Employees Provident Fund 2.97HSBC Nominees (T) SB 2.01
Share Performance (%)Month Absolute Relative1m 2.01 -1.14 3m 14.41 0.59 6m 20.95 -6.82 12m 46.27 2.03
CONSUMER
Target : RM1.28Price : RM0.955
Share Price Performance
2.00
2.20
2.40
2.60
2.80
3.00
3.20
3.40
Oct-08 Oct-08 Nov-08 Dec-08 Jan-09 Feb-09 Mar-09
ABCABC Berhad
ABC Berhad, with its history dating back to 1982, was listed on the Second Board in 1999 and subsequently transferred to the Main Board in 2003. The Group is involved in civil and structural construction works, property develop-ment, supply of marine fuels and lubricants at Kemaman Port. Recently the Group also ventured into oil palm plantations in Indonesia as part of its diversification strategy. The actual field planting for the oil palm commenced in October 2006 and expected to be completed by year 2009/10. The construction division makes up about 87.4% of revenue in 2006, followed by 12.1% in the oil & gas division. The oil palm division measuring about 20,500ha, however, is expected to generate revenue for the Group in year 2010 and onwards.
Strong outstanding orderbook. Comfortably sitting on a strong outstand-ing orderbook of RM1.2bn on the back of RM1.7bn orderbook, ABC is poised to register double-digit growth for at least the next 2 years. Such strong outstanding orderbook will keep the Group busy over the next 3 years.
9MP will continue to underpin ABC’s earnings. It is no secret that ABC will be one of the prime beneficiaries of the 9MP. Having already secured two prime projects worth RM499m in the East Coast in mid-2006, the next immediate target is that of the East Coast Expressway Phase 2 (ECE2). Currently with a balance of about RM2.0bn to be awarded.
Guide To Report Format - Page 1Target Price
Intrinsic valuation of the stock based on various methodologies
Share Price Market price as at cut-off date
of April 07, 2010
Investment Merits Key attractions and selling
points of the stock including but not limited to growth prospects, earnings drivers and valuation fundamentals
Company Profile Principal activities Brief history of the company’s development Revenue contributors Location of operations
Key Highlights Existing and potential contracts/
orders New ventures Strategic alliance Expansion plan
Share Profile / Statistics Key stock data including
cash f low and e f f i c iency measures such as Altman Z-score* and ROC/WACC*
Major Shareholders Top shareholders o f the
company based on latest available data
Share Performance Shows the absolute and relative
performance vs. underlying benchmark index of the stock over a period of time

12
Income Statement (RMm)
FYE 31 Dec FY07 FY08 FY09 FY10fTurnover 257.9 243.7 432.2 669.7 Growth (%) -15.7 -5.5 77.3 55.0 EBITDA 24.5 30.1 41.3 50.4 Pretax -4.1 27.5 36.3 46.5 Net Earnings -11.7 18.2 23.7 30.0 EPS (sen) -17.6 27.3 35.6 45.0 Growth (%) -190.5 n.m. 30.5 26.4 NTA/Share (RM) 1.53 1.75 2.01 2.35 Gross Div (sen) 7.0 15.0 15.0 15.0 Div Yield (%) 2.8 5.9 5.9 5.9 PER (x) -14.4 9.3 7.1 5.6 P/NTA (x) 1.7 1.5 1.3 1.1 Net Cash/Share 1.46 1.52 1.18 1.94 Balance Sheet (RMm) FYE 31 Dec Fixed Assets 21.7 25.2 35.4 47.4 Current Assets 229.8 241.8 327.9 414.9 Current Liabilities -149.7 -152.7 -193.4 -283.3Others 28.9 28.0 34.4 18.4 Total 130.7 142.3 204.3 197.4 Share capital 66.3 66.7 66.7 66.7 Reserves 55.8 38.7 53.6 71.1 Shareholder Funds 122.1 105.4 120.3 137.8 LT Liabilities 7.1 35.2 82.5 56.9 Others 1.5 1.6 1.5 2.7 Total 130.7 142.1 204.2 197.3 Gross Debt 5.5 11.8 52.7 67.7 Net Cash/ (Debt) 95.2 97.7 101.4 78.5 Cash Flow Statement (RMm) FYE 31 Dec FY07 FY08 FY09Cash Flow from Ops 8.0 21.2 16.5 Cash Flow from Investing 1.0 -12.0 -21.8Cash Flow from Financing -6.2 37.6 -1.2Net Increase in Cash 2.9 46.9 -6.5Cash at Beginning of Year 99.0 101.9 148.7 Other Changes -0.0 -0.0 0.2 Cash at End of Year 101.9 148.7 142.5
COMPANY REPORT CARD
ROE. Registering a 16.7% and 18.9% ROE in FY05 and FY06 respectively, we expect the Group to post a strong ROE of 20.6% and 21.0% in FY07 and FY08 respectively.
Management. Strong fundamentals are not the only selling points of the Group. Its determined and experienced management team has been the key driving force.
Dividend. The Group has been declaring a gross dividend of 15sen for the past few years. Going forward, management has indicated that it would at least maintain the dividend payout level.
RECOMMENDATION
The illiquidity of the stock has been one of the prime reasons why its price is still a laggard compared to its peers. Given its current strong fundamentals and capacity, ABC may switch its attention soon to address the issue of its stock liquidity via a capital management exercise. Trading at a forward PER of only 5.6x and 4.7x in FY07 and FY08, ABC offers investors a great bargain for enhanced exposure to the 9MP boom.
speed diesel to marine and offshore vessels, ABC has the mandate to be the only sole supplier of that product in Port Kemaman. With a total capacity of 400m litres and utilisation rate of 50% only, the division will poise to contribute to the Group’s top and bottom line going forward given the recent increased offshore activities in Port Kemaman. All the division’s assets have been fully depreciated. The division will continue to act as a cash cow for the Group to fund its plantation activities in Kalimantan (still at its infancy).
Oil palm plantation to be one of the prime catalysts post year 2010. Located in the town of Ngabang, West Kalimantan, ABC owns the rights to cultivate palm oil on 20,500ha land. Acquired at a cost of only RM7m, the plantable area has well exceeded 85%, above industry average. The Group has already commenced field planting operations. Earnings contribution from this division is expected to kick-in in year 2010 onwards.
ABC Company
FY06 FY0 7 FY08 FY09
*DefinitionofAltmanZ-score A predictive model created by Edward Altman in the 1960s. This model combines five different financial ratios to determine the likelihood of bankruptcy
amongst companies. The general rule of thumb is that the lower the score, the higher the odds of bankruptcy. Companies with Z-Scores above 3 are considered to be healthy and, therefore, unlikely to enter bankruptcy. Scores in between 1.8 and 3 lie in a grey area. This is a relatively accurate model -real world application of the Z-Score successfully predicted 72% of corporate bankruptcies two years prior to these companies filing for bankruptcies.
*DefinitionofROC/WACC A calculation used to assess a company’s potential to be a quality investment by determining how well (i.e. profitably) a company’s management is able to
allocate capital into its operations. Comparing a company’s ROC with its cost of capital (WACC) reveals whether invested capital was used effectively.
WACC is a calculation of a firm’s cost of capital in which each category of capital is proportionately weighted. All capital sources - common stock, preferred stock, bonds and any other long-term debt - are included in a WACC calculation. WACC is calculated by multiplying the cost of each capital component by its proportional weight and then summing it up. A firm’s WACC is the overall required return on the firm as a whole and, as such, it is often used internally by company directors to determine the economic feasibility of expansionary opportunities and mergers. It is the appropriate discount rate to use for cash flows with risk that is similar to that of the overall firm.
Guide To Report Format - Page 2
Company Report Card Fair value, historical and
forward PER and sector PER Historical and forward ROE
perspective Management profile and
experience
Dividend policy
Recommendation Fundamental valuation of the
stock based on various valua-tion methodologies
Includes target price, dividend yield and total holding period returns where necessary over a
12 month period
Key Statistics The financial statements –
income statement and balance sheet
Various financial ratios for horizontal statement analysis

13
Sector Sector Snapshot Featured Stocks
Automotive We see 2010 as a good year for the automotive sector, spurred by strong vehicle sales amid an improving economic landscape and a favourable ringgit. We see value in our small cap coverage as most are still trading at attractive valuations. We expect the higher TIV momentum, which will hit a new record high, as a boon for auto part players overall as they essentially command better margins than the auto manufacturers themselves. In the long run, auto parts suppliers will further benefit as the industry shapes up to cater to global OEMs by establishing manufacturing hubs given the sector's accomodating policy, which is packaged with favorable incentives such as tax holidays and export tax exemptions. We remain OVERWEIGHT on the automotive sector.
Delloyd VenturesEP ManufacturingMBM ResourcesNew Hoong Fatt Holdings
Building Materials 2010 will be a turnaround year for most companies in the building material sector as both domestic and offshore orders increase. Net earnings projections are expected to jump from 15%-35% across our coverage. We are proud to point out that both Ajiya and Yi-lai continue to be in our list of top small caps. Ajiya still sees positive prospects going forward, with new development projects auguring well for its niche energy saving building materials segment while Yi-lai continues to be the most efficient tile manufacturer that also happens to pay attractive dividend. We also introduce Malaysia's top medium-density fibreboard manufacturer, Evergreen Fibreboard, which is our latest inclusion among the ranks of the building materials. With the sector riding on the global stimulus packages, we reckon that the worse is over for the sector and that earnings should recover strongly this year. We remain OVERWEIGHT on the building materials sector.
AjiyaEvergreen FibreboardSignature InternationalYi Lai Holdings
Consumer While retail players generally fared better than expected during the economic crisis, mainly driven by heavy promotions and discounting activities, with only slight margin compression, the luxury retailers generally experienced a more severe bottom line contraction compared to the high street brand retailers that are involved in the sale of necessities, which outperformed the rest as expected. Although we expect sales growth to slow and margins to normalize given the fewer discounts and buying activities as consumers would have stocked up during the previous sales season, companies would still report decent sales growth driven by a recovering economy, improving consumer sentiments and higher tourist arrivals. Apart from the more favourable macro outlook, most retail companies also offer decent dividend yields, which is a boon given expectations of a less sanguine 2H outlook. We are OVERWEIGHT on consumer retail. The food sector, on the other hand, is expected to peform better this year, particularly from impulse buying of products such as snacks, soft drinks and confectionary as the economy gains pace. Aggressive new product launches and marketing campaigns were evident in a bid to capture market share, which should prop up earnings going forward. Food companies involved in basic agrifood will continue to be profitable and we expect stronger demand coming from exports. Nonetheless, we are still concerned over rising raw material prices although most of the raw materials prices have remained flattish over the last few months. We like C.I. Holdings for exposure to the F&B segment and Hai-O for exposure to the consumer retail space.
C.I. HoldingsHai-O EnterpriseKawan FoodKian Joo Can FactoryMamee-Double Decker Multi Sports Holdings LtdNTPM HoldingsPadini HoldingsPelikan InternationalQL ResourcesZhulian
Construction One of our sector themes for 2010 is that most domestic contracts are likely to be mid and small sized in nature. As for the larger projects, small cap contractors will also have a participating chance as (i) these jobs are likely to be broken into smaller packages, and (ii) there will be subcontracting roles available. Small cap contractors are the key beneficiaries of such jobs given the stronger incremental earnings impact vs larger contractors. The Sarawak construction play is another theme we are bullish on, fuelled by the upcoming state election slated for early-mid 2011. Based on forward CY10 earnings, small cap contractors on average are trading at a 30%-40% discount to their larger cap peers. We have an OVERWEIGHT rating on the sector but favour the mid-small cap names.
Hock Seng LeeNaim HoldingsProtascoSunway Holdings
Sector Snapshots

14
Sector SnapshotsSector Sector Snapshot Featured Stocks
Healthcare The growing demand for private healthcare services will continue to sustain the growth momentum for private healthcare providers. The sector will remain as an excellent long term and portfolio balancing investment due to its steady dividend payout as well as growth potential in a defensive sector. Our top pick remains KPJ.
KPJ
Logistics The positive economic landscape will prove favorable for the logistic players on better volumes churned in tandem with the improvement in the manufacturing sector. This also jives in with the heightening economic activities across the globe as trade volume gains momentum. We see this benefiting logistics players that are exposed to both domestic and export markets. Also, an uptick in margins across our sector coverage will be evident as the cost-cutting initiatives implemented in the last few years bear fruit on the back of the higher turnover. We expect a strong rebound in profits across our logistics coverage. Our top pick is Freight Management.
Century LogisticsFreight ManagementTrans-Asia Shipping Corp
Oil & Gas The local O&G sector has been quite quiet since the crash in oil prices and global economic recession. Nevertheless, we expect Petronas and its PSC contractors to start awarding new contracts starting from 2H10 as job replenishment would be needed to sustain the existing oil fields as well as to discover new oil fields so that our reserve replacement ratio continues to be strong. Maintain OVERWEIGHT rating on the sector. We continue to like Alam Maritim for exposure to the sector.
Alam Maritim ResourcesCoastal ContractsHandal Resources
Property As we have predicted based on our Property Cycle Model, the downcycle since late 2008 may likely bottom only in mid-2010. The Malaysian real estate sector will warm up in 2H10 before ushering in a brief upcycle in 2011. During this period, especially in 2011, demand will return more convincingly and most developers will be able to make brisk sales on generally rising property prices even without the generous discounts and easy financing schemes. The upcycle in 2011, albeit brief, would again be led by high-end properties, supported by a favourable demographic landscape, recovering economy and the lack of incoming supply in 2010. As we believe that most mid-to-large cap stocks have already (at least almost) fully priced in such rebound, we think that values can now only be found in smaller cap property stocks, which are now merely trading at 0.6x CY10 P/NTA versus the mid-cap average of 0.85x CY10 P/NTA. If the rebound in the real estate sector becomes more evident and given the abundance of liquidity in the system, interest in certain quality smaller cap property stocks will likely return soon, with their current valuations potentially catching up with the mid-cap property stocks. Having said that, we are only upgrading our small cap property stocks to Trading Buys (instead of an outright buy) because we believe that there is risk that the impending rebound in the real property sector may not last beyond year 2011. As property stocks tend to react 9-12 months ahead of a change in the property cycle, this means that the valuation of the Malaysian property stocks will likely to also peak sometime in mid-to-late 2010.
GlomacPlenitude
REIT M-REITs certainly survived the global financial crisis very well in 2009, given the healthy domestic economy, resilient banking system, healthy balance sheet of the M-REITs as well as the defensive nature of their respective business models. Surviving the crisis means that M-REITs have now proven to be very resilient and investment-worthy, especially in an adverse environment. In addition, given the fact that most are still offering an attractive yield exceeding 8.0% amid an improvement in the economy, value can therefore still be found in M-REITs.
Axis REITHektar REIT
Sector Sector Snapshot Featured Stocks
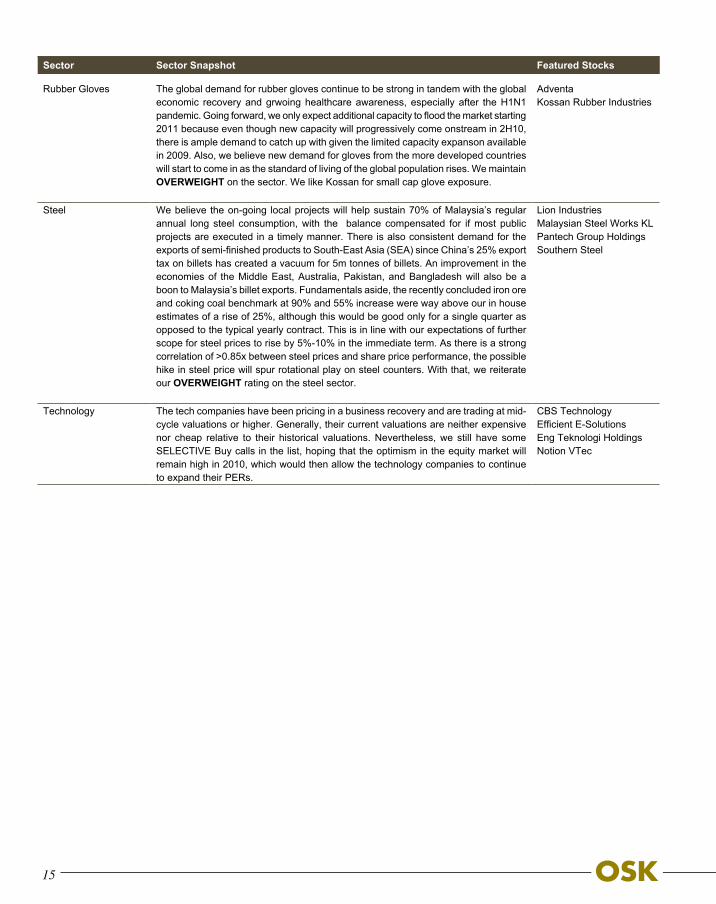
Rubber Gloves The global demand for rubber gloves continue to be strong in tandem with the global economic recovery and grwoing healthcare awareness, especially after the H1N1 pandemic. Going forward, we only expect additional capacity to flood the market starting 2011 because even though new capacity will progressively come onstream in 2H10, there is ample demand to catch up with given the limited capacity expanson available in 2009. Also, we believe new demand for gloves from the more developed countries will start to come in as the standard of living of the global population rises. We maintain OVERWEIGHT on the sector. We like Kossan for small cap glove exposure.
AdventaKossan Rubber Industries
Steel We believe the on-going local projects will help sustain 70% of Malaysia’s regular annual long steel consumption, with the balance compensated for if most public projects are executed in a timely manner. There is also consistent demand for the exports of semi-finished products to South-East Asia (SEA) since China’s 25% export tax on billets has created a vacuum for 5m tonnes of billets. An improvement in the economies of the Middle East, Australia, Pakistan, and Bangladesh will also be a boon to Malaysia’s billet exports. Fundamentals aside, the recently concluded iron ore and coking coal benchmark at 90% and 55% increase were way above our in house estimates of a rise of 25%, although this would be good only for a single quarter as opposed to the typical yearly contract. This is in line with our expectations of further scope for steel prices to rise by 5%-10% in the immediate term. As there is a strong correlation of >0.85x between steel prices and share price performance, the possible hike in steel price will spur rotational play on steel counters. With that, we reiterate our OVERWEIGHT rating on the steel sector.
Lion IndustriesMalaysian Steel Works KLPantech Group HoldingsSouthern Steel
Technology The tech companies have been pricing in a business recovery and are trading at mid-cycle valuations or higher. Generally, their current valuations are neither expensive nor cheap relative to their historical valuations. Nevertheless, we still have some SELECTIVE Buy calls in the list, hoping that the optimism in the equity market will remain high in 2010, which would then allow the technology companies to continue to expand their PERs.
CBS TechnologyEfficient E-SolutionsEng Teknologi HoldingsNotion VTec
15

< This page has been left blank intentionally >

17
INVESTMENT MERITS
Market leader for young 5,000bhp vessels Has a high number of LT contracts with Petronas and its PSC
contractors Earns attractive GP margins of 30%-50% despite lower charter
rates Moving into provision of 1-stop offshore marine support
services Buy with TP of RM2.99 based on PER of 12x FY10 earnings
COMPANY PROFILE
Alam Maritim (Alam) is one of the largest and established offshore marine support vessel providers in Malaysia. The company was listed on the Bursa Malaysia Main Board in July 2006. It commenced operation in 1998 as a third party vessel operator. Today, besides providing vessel services, Alam is also involved in offshore facilities construction and installation as well as underwater services. It holds a licence that qualifies it to directly bid for contracts from Petronas and its PSC contractors.
KEY HIGHLIGHTS
Largest fleet of young 5,000bhp vessels. These vessels are suitable for both shallow and deepwater use, which gives Alam wider market diversity compared to companies with vessels of higher horsepower which are mainly for the deepwater market. Also, demand for this category of vessels continues to be robust since they are easier and cheaper to operate and their specifications are adequate for most South-East Asia waters. Currently, of its fleet of 34 vessels, some 70% is of 5,000bhp ones.
Possibly holds one of the highest number of LT contracts from Petronas and its PSC contractors. Alam has employed the right strategy by locking in long-term contracts with its customers. Although charter rates are not as attractive as that for spot charter, its long-term contracts provide Alam with stable and recurring income. Of course, its success in securing these contracts also depends on its performance and track record in consistently meeting customer expectations. In addition, not only does Alam hold a vessel licence from Petronas, but all of its vessels are also Malaysian flagged, which qualifies the company to bid for new jobs on technical specifications
Attractive GP margin of 30%-50%. Although charter rates for 5,000bhp vessels have come down to a low of USD1.70-USD2.00/bhp, Alam has managed to carve out attractive GP margins of 30%-50%. However, the lower rate is only applicable to its vessels that are due for renewal and not those that are not yet due, some of which were locked in earlier at a higher rate of USD2.20-USD2.50/bhp.
Alam MaritimMoving Into 1-Stop Marine Solutions
Target : RM2.99Price : RM1.92
OIL & GAS
Stock Profile/StatisticsBloomberg Ticker AMRB MKIssued Share Capital (m) 508.3Market Capitalisation (RMm) 976.052 week H | L Price (RM) 2.02 | 0.83 Average Volume (3m) ‘000 270.6YTD Returns (%) 2.1Net gearing (x) 0.9Altman Z-Score 1.62ROCE/WACC 0.8Beta (x) 1.2Book Value/share (RM) 0.94
Major Shareholders (%)Sar Venture Holdings 50.1LTH 9.5
Share Performance (%)Month Absolute Relative1m 8.8 2.5 3m 1.5 -5.0 6m 3.7 -9.9 12m 138.0 51.8
6-month Share Price Performance
2.1
2.0
1.9
1.8
1.7Oct-09 Nov-09 Dec-09 Jan-10 Feb-10 Mar-10 Apr-10

18
Becoming a one-stop marine solution provider. Although vessel chartering is Alam’s core business, the company has taken the initiative to diversify its income stream to enhance shareholder value by venturing into the provision of underwater services, vessels repair and pipe-laying. Of these 3 services, only pipe-laying is new to Alam. Although still “green” in this area, Alam has partnered with Swiber to own a 300-man accommodation pipelay work barge, which is expected to be delivered in 2QFY10.
COMPANY REPORT CARD
ROE. Alam has been consistently delivering an average ROE of 20% since 2005. This was mainly contributed by its LT contracts with Petronas and its PSC contractors, which have provided stable charter rates for its vessel fleet.
Management. Alam is managed by an experienced management team comprising Dato’ Captain Ahmad Sufian (Chairman), and En. Azmi (MD). Dato’ Capt Ahmad Suffian has over 36 years’ experience in the international maritime industry, having worked with a British shipping company and MISC. En Azmi, the co-founder, has shipping experience from Nepline Bhd.
Dividend. In general, the dividend yield of most O&G companies (including Alam) is less than attractive because these are high growth companies. Hence, we believe Alam would rather retain the cash generated from its business to expand its fleet, which would bring in higher future earnings, than to make a big payout to shareholders.
RECOMMENDATION
Maintain Buy. Our target price for Alam is RM2.99 based on a PER of 12x FY10 earnings. We like the company’s sound strategy in penetrating new businesses (such as its pipelay barge) and new geographical markets such as Middle East and India, and solid financial strategy (as in using the JV option to finance its new vessels), to not only safeguard its gearing but also to instill investor confidence in the company.
Income Statement (RMm)
FYE 31 Dec FY07 FY08 FY09 FY10fTurnover 249.9 356.7 347.4 410.4Growth (%) 65.3 42.7 -2.6 18.1EBIT 86.2 136.6 116.9 158.3Pretax 68.8 107.1 117.7 158.8Net Earnings 51.0 76.4 95.8 122.7FD EPS (sen) 10.3 15.5 19.4 24.9Growth (%) 62.2 49.8 25.4 28.1NTA/Share (RM) 0.59 0.76 0.97 1.33Div (Gross) (sen) 0.5 1.0 1.0 1.0Div (Yield) (%) 0.3 0.5 0.5 0.5PER (x) 18.6 12.4 9.9 7.7P/NTA (x) 3.3 2.5 2.0 1.4
Balance Sheet (RMm)
FYE 31 Dec FY07 FY08 FY09Fixed Assets 735.4 866.9 860.1Current Assets 251.5 390.4 518.9Current Liabilities -240.1 -302.7 -328.1Others - - -Total 746.9 954.6 1050.8Share capital 121.3 123.2 126.7Reserves 167.9 251.7 353.8Shareholders’ Fund 289.2 374.9 480.6LT Liabilities 444.0 574.4 562.7Others 13.6 5.3 7.6Total 746.9 954.6 1050.8Gross Debt 574.9 635.1 641.8Net Cash/ (Debt) -456.8 -513.5 -438.7
Cash Flow Statement (RMm)
FYE 31 Dec FY07 FY08 FY09Cash Flow from Ops 63.9 2.5 71.9Cash Flow from Investing -311.8 -33.9 -8.5Cash Flow from Financing 348.3 36.1 19.8Net Increase in Cash 100.4 4.6 83.1Cash at Beginning of Year 3.4 103.8 105.7Other Changes 0.0 0.0 0.0Cash at End of Year 103.8 108.4 188.9
Alam Maritim

19
INVESTMENT MERITS
Has a long-term relationship with Pepsico Strong presence in Malaysia and overseas Sizeable and expanding product lines Extensive distribution channel
COMPANY PROFILE
The company was incorporated on 28 Feb 1978 as a private limited company under the name C.I. Holdings SB. It converted into a public company and assumed its present name C.I. Holdings Bhd on 10 Dec 1982. The company, listed on the Main Board of Bursa Malaysia on 18 Feb 1983, started as a tap ware and sanitary ware manufacturer of brand names such as Doe and Potex. In 2004, it acquired Permanis Group and evolved into a manufacturer and distributor of beverages, tap ware and ceramic sanitary ware. Under Permanis, it has an exclusive bottling appointment with Pepsico to bottle, market, sell and distribute the soft drinks under this brand. Apart from manufacturing and distributing Pepsico beverage brands, C.I. Holdings has also sells peripheral brands such as Excel, Frost and others.
KEY HIGHLIGHTS
Bottler for global soft drink brand, PepsiCo. C.I. Holdings holds the exclusive rights from PepsiCo and Seven-Up International to bottle, market, sell and distribute soft drinks under PepsiCo such as Gatorade, Tropicana, Lipton and Kickapoo as well as brands like Boss coffee, Frost and others. With a long-standing 37-year relationship with PepsiCo, we believe C.I. Holdings would be able to keep ties warm because unlike the F&N and Coca-Cola agreements, its strategy is to focus on the PepsiCo product lines while its own brands complement PepsiCo’s.
Advertising for success. For soft drinks companies, advertising is an important element driving sales. However, under the PepsiCo agreement, C.I. Holdings pays a yearly “concentrate’’ which includes “above the line” advertising that allows it to leverage on PepsiCo’s impactful advertising campaigns. For instance, its 2007 launch of the Tropicana Twister orange juice was an astounding success, boosting its fruit juice market share from 0% to 30% in Malaysia.
C.I. HoldingsThe Momentum Builds Up
Target : RM2.40Price : RM2.02
CONSUMER
Stock Profile/StatisticsBloomberg Ticker CIH MKIssued Share Capital (m) 142.0Market Capitalisation (RMm) 286.852 week H | L Price (RM) 2.23 | 0.86Average Volume (3m) ‘000 47.1YTD Returns (%) 18.1Net gearing (x) 0.3Altman Z-Score 3.20ROCE/WACC 2.0Beta (x) 0.7Book Value/share (RM) 0.27
Major Shareholders (%)Johari bin Abdul Ghani 25.4Continental Theme SB 10.4Permodalan Nasional Berhad 8.2
Share Performance (%)Month Absolute Relative1m 11.1 7.8 3m 18.8 12.1 6m 44.6 26.2 12m 110.9 38.1
6-month Share Price Performance
2.5
2.3
2.1
1.9
1.7
1.5
1.3Oct-09 Nov-09 Dec-09 Jan-10 Feb-10 Mar-10 Apr-10

20
Sizeable and expanding product lines. Continuous improvements are being made to C.I. Holdings’ products across all brands, particularly those in its fruit juice segment. New flavours will be added to its Tropicana Twister line to further penetrate the chilled ready-to-drink juice market. Currently, it produces orange and apple juices under the brand. The company also does not restrict itself to certain types of beverages. It is instead open to exploring new opportunities and products that complement PepsiCo brands, to meet changing demand.
Extensive distribution network. Currently, C.I. Holdings distributes its beverages to about 40,000 licensed outlets out of a beverage distribution channel of 80,000 to 90,000 outlets throughout Malaysia. The company is the exclusive beverage supplier to fast food restaurants like KFC and Pizza Hut. It is targeting to distribute to at least 42,000 outlets by end-2010.
COMPANY REPORT CARD
ROE. C.I. Holdings’ ROE has consistently remained above 14% level over the last two years. Going forward, we expect stronger ROE on the back of new product launches to capture a larger market share.
Management. C.I. Holdings is led by a strong management team. Recently, it recruited new talent from the industry, which we believe will lead C.I.Holdings to greater heights
Dividend. The company has a dividend payout policy of 30%-35%, which translates into a dividend yield of 2%-3% p.a. Management expects to maintain this going forward.
RECOMMENDATION
We are ascribing a higher target price of RM2.40 by using the composite of 12x PER over FY10 EPS. We see potential growth in its beverages segment.
Income Statement (RMm)
FYE 30 Jun FY08 FY09 FY10f FY11fTurnover 290.5 363.0 379.3 468.0Growth (%) 9.3 25.0 4.5 23.4EBIT 20.4 32.8 38.5 46.1Pretax 15.5 28.0 35.8 43.1Net Earnings 14.5 21.0 28.0 33.8FD EPS (sen) 10.2 14.8 19.7 23.8Growth (%) 84.9 44.2 33.6 20.6NTA/Share (RM) 0.71 0.92 0.95 0.87Div (Gross) (sen) 4.1 7.0 6.3 7.6Div (Yield) (%) 2.0 3.5 3.1 3.8PER (x) 19.7 13.7 10.2 8.5P/NTA (x) 2.8 2.2 2.1 2.3
Balance Sheet (RMm)
FYE 30 Jun FY07 FY08 FY09Fixed Assets 125.4 146.5 139.3Current Assets 100.2 118.0 155.6Current Liabilities -113.5 -122.3 -120.9Others 0.0 0.0 0.0Total 112.1 142.2 174.0Share capital 129.6 129.6 142.0Reserves -39.9 -25.4 -9.2Shareholders’ Fund 89.7 104.2 132.8LT Liabilities 21.4 36.7 40.1Others 1.0 1.3 1.1Total 112.1 142.2 174.0Gross Debt 74.0 83.6 78.4Net Cash/ (Debt) -65.3 -66.5 -38.5
Cash Flow Statement (RMm)
FYE 30 Jun FY07 FY08 FY09Cash Flow from Ops 29.3 -8.6 2.3Cash Flow from Investing -8.8 -4.6 -9.4Cash Flow from Financing -17.3 -11.1 -3.2Net Increase in Cash 3.2 -2.1 -10.3Cash at Beginning of Year 3.6 12.4 37.6Other Changes 0.0 0.0 0.0Cash at End of Year 6.7 10.3 27.2
C.I. Holdings

21
INVESTMENT MERITS
A good balance of defensive and high growth businesses Potential M&A to boost earnings Sizeable growth potential overseas Potential upside on dividend Attractive and cheap valuation
COMPANY PROFILE
Faber holds a 15-year concession to provide healthcare facilities management services to 78 government hospitals in the northern (Perlis, Kedah, Penang and Perak) and East Malaysia (Sabah and Sarawak) regions. The concession expires in 2011. The services are facilities engineering maintenance, bio-medical facilities engineering maintenance, clinical waste management, linen & laundry services and cleansing services. Faber also provides facilities management services to non-healthcare operations locally and overseas, where it has secured several contracts totaling RM200m p.a. over the next few years. Faber is also an established property developer and has successfully developed Taman Desa and its surrounding areas. The Group is currently developing a 100-acre township in Kepong called Laman Rimbunan.
KEY HIGHLIGHTS
More growth in UAE and India. Its FY09 earnings were significantly boosted by the Integrated Facilities Management (IFM) business in UAE, particularly from low-cost housing and infrastructure facilities contracts which started contributing in 2H09. With about RM110m out of the RM220m in indicative annual contract value billed and recognized, work on the remaining contracts should be completed in FY10, with a further RM30m already billed in January this year alone. As expected, we gather that the “low cost housing” contract has been extended for another year, and anticipate the same for the infrastructure facilities contract in due course. Although Faber’s India IFM business contributed only RM20m in revenue in FY09, the earnings outlook is favorable given the substantial growth potential both in the country’s healthcare and non-healthcare segments.
Better year for property division. After a weak performance by its property division, mainly attributed to the economic slowdown and anaemic property market, Faber’s property division is expected to perform better from FY10 onwards attributed to its upcoming launches and a recovery in the property market. Faber currently has unbilled sales of RM30m in the property segment and is expected to launch three projects this year with an estimated GDV of RM495m, with the first expected to be launched by 2QFY10. Currently Faber has 43 acres of landbank in the Klang Valley and Sabah, and is in talks to acquire several parcels of land. The company is also likely to participate in the tender for Government land, either on its own or through joint ventures.
Faber GroupStriking a Good Balance
Target : RM2.75Price : RM2.52
CONGLOMERATE
Stock Profile/StatisticsBloomberg Ticker FAB MKIssued Share Capital (m) 363.0Market Capitalisation (RMm) 914.852 week H | L Price (RM) 2.57 | 0.75Average Volume (3m) ‘000 1652.4YTD Returns (%) 56.5Net gearing (x) Net CashAltman Z-Score 2.81ROCE/WACC 1.2Beta (x) 1.7Book Value/share (RM) 0.97
Major Shareholders (%)Khazanah Nasional 34.3Universal Trustee 23.42
Share Performance (%)Month Absolute Relative1m 31.9 27.5 3m 55.6 52.2 6m 147.1 117.4 12m 236.1 120.9
6-month Share Price Performance
2.8
2.5
2.2
1.9
1.6
1.3
1.0Oct-09 Nov-09 Dec-09 Jan-10 Feb-10 Mar-10 Apr-10

22
Potential M&A to boost earnings. Since news on the potential sale of Pantai Medivest and Pantai Fomema emerged, Faber has been rumoured to be the likely buyer. Although Faber’s management neither denied nor confirmed the rumors, we believe the purchase of the Pantai companies is relevant to its business model, as they can potentially create synergy. This acquisition could boost Faber’s profits, depending on the pricing. There might be some concerns that the deal could cause Faber’s gearing to shoot up if it decides to finance the deal via borrowings. However, we strongly believe that Faber has the financial muscle to undertake the deal without straining its balance sheet, given that its current balance sheet is relatively under-leveraged, and it had net cash of RM125m as at FY09.
Concession should be renewed. Its 15-year concession to provide health support services in government hospitals will expire in 2011. We believe it is unlikely that the concession will not be renewed given that Faber has poured in substantial investments since the concession began, and the fact that Faber has the expertise and track record in providing health support services. The concession renewal should be earnings accretive given that there has been no tariff review since it began.
Attractive valuation. Although Faber’s share price has appreciated by more than 100% since we re-initiated coverage in August 2009, the stock is trading at only 9.5x PER on FY10 EPS, which we deem attractive and cheap compared to the market. On top of this is the potential upside in dividend payout given that currently the payout is less than 30% of PATAMI. We believe Faber is a strong candidate for the potential consolidation of the healthcare sector, which would be the stock’s rerating catalyst.
COMPANY REPORT CARD
ROE. Over the last few years, Faber has significantly improved its ROE from less than 15% in FY05 to more than 20% in FY09, which reflects its growing profitability over the years.
Management. Managing Director Encik Adnan Mohammad has been with UEM Group since 2000. Faber’s other management teams have vast experience in their respective fields.
Dividend. Faber paid a 6 sen dividend in FY09, which was 25% higher than the 4 sen paid for FY08. In line with the earnings growth, we expect Faber to pay a dividend of 7 sen for FY10.
RECOMMENDATION
We value Faber based on SOP valuation and derive a TP of RM2.75. With the potential acquisition of Medivest and Fomema remaining speculation for now, regardless of whether it materializes, we remain optimistic on the company’s outlook. We believe Faber offers a good balance of a defensive business via the concession, and sizeable growth potential through its overseas expansion as well as exposure in the property sector.
Income Statement (RMm)
FYE 31 Dec FY07 FY08 FY09 FY10fTurnover 669.7 668.5 805.3 935.5Growth (%) 13.3 -0.2 20.5 16.2EBIT 107.3 119.6 148.0 169.2Pretax 99.4 111.5 141.2 162.2Net Earnings 52.0 62.5 83.0 96.6FD EPS (sen) 10.9 17.2 22.9 26.6Growth (%) 41.7 20.2 32.8 16.5NTA/Share (RM) 0.62 0.88 1.07 1.34Div (Gross) (sen) 3.0 4.0 6.0 7.0Div (Yield) (%) 1.2 1.6 2.4 2.8PER (x) 23.2 14.6 11.0 9.5P/NTA (x) 4.1 2.9 2.4 1.9
Balance Sheet (RMm)
FYE 31 Dec FY07 FY08 FY09Fixed Assets 158.7 172.5 189.9Current Assets 519.8 586.9 700.5Current Liabilities 211.8 188.7 250.8Others 0.0 0.0 0.0Total 918.4 977.0 639.6Share capital 363.0 363.0 363.0Reserves -66.7 -44.9 26.2Shareholders’ Fund 296.3 318.1 389.2LT Liabilities 208.4 193.5 183.3Others 77.4 48.3 0.0Total 918.4 977.0 639.6Gross Debt 191.2 190.2 179.5Net Cash/ (Debt) 27.3 122.2 125.1
Cash Flow Statement (RMm)
FYE 31 Dec FY07 FY08 FY09Cash Flow from Ops 129.3 122.0 63.8Cash Flow from Investing -31.7 105.0 -30.3Cash Flow from Financing -44.7 -142.4 -38.7Net Increase in Cash 52.9 84.6 -5.3Cash at Beginning of Year 174.6 227.0 312.0Other Changes -0.5 0.3 -2.2Cash at End of Year 227.0 312.0 304.6
Faber Group
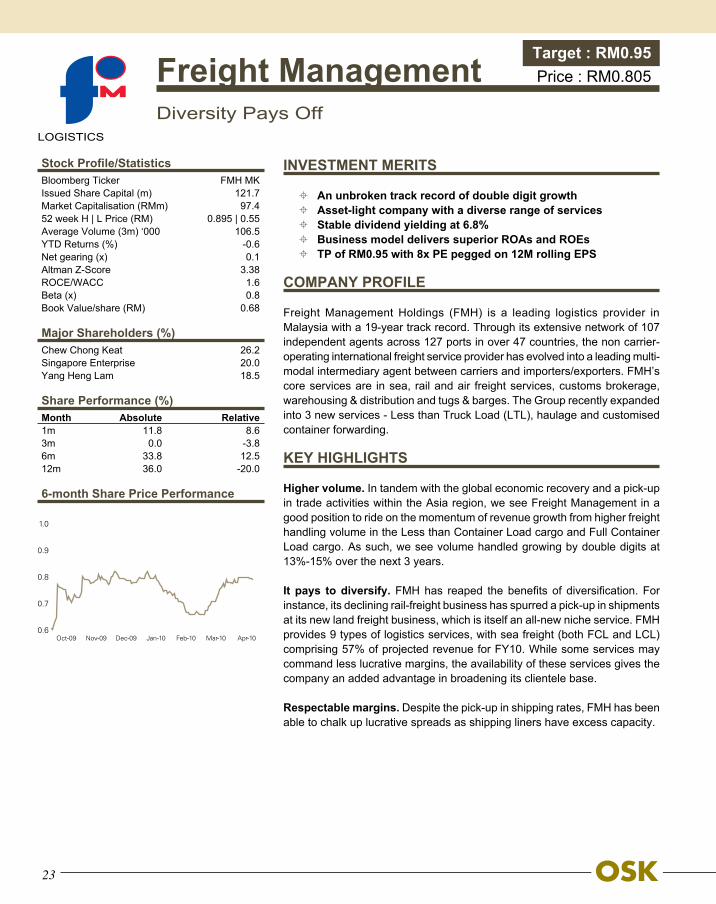
23
INVESTMENT MERITS
An unbroken track record of double digit growth Asset-light company with a diverse range of services Stable dividend yielding at 6.8% Business model delivers superior ROAs and ROEs TP of RM0.95 with 8x PE pegged on 12M rolling EPS
COMPANY PROFILE
Freight Management Holdings (FMH) is a leading logistics provider in Malaysia with a 19-year track record. Through its extensive network of 107 independent agents across 127 ports in over 47 countries, the non carrier-operating international freight service provider has evolved into a leading multi-modal intermediary agent between carriers and importers/exporters. FMH’s core services are in sea, rail and air freight services, customs brokerage, warehousing & distribution and tugs & barges. The Group recently expanded into 3 new services - Less than Truck Load (LTL), haulage and customised container forwarding.
KEY HIGHLIGHTS
Higher volume. In tandem with the global economic recovery and a pick-up in trade activities within the Asia region, we see Freight Management in a good position to ride on the momentum of revenue growth from higher freight handling volume in the Less than Container Load cargo and Full Container Load cargo. As such, we see volume handled growing by double digits at 13%-15% over the next 3 years.
It pays to diversify. FMH has reaped the benefits of diversification. For instance, its declining rail-freight business has spurred a pick-up in shipments at its new land freight business, which is itself an all-new niche service. FMH provides 9 types of logistics services, with sea freight (both FCL and LCL) comprising 57% of projected revenue for FY10. While some services may command less lucrative margins, the availability of these services gives the company an added advantage in broadening its clientele base.
Respectable margins. Despite the pick-up in shipping rates, FMH has been able to chalk up lucrative spreads as shipping liners have excess capacity.
Freight ManagementDiversity Pays Off
Target : RM0.95Price : RM0.805
LOGISTICS
Stock Profile/StatisticsBloomberg Ticker FMH MKIssued Share Capital (m) 121.7Market Capitalisation (RMm) 97.452 week H | L Price (RM) 0.895 | 0.55Average Volume (3m) ‘000 106.5YTD Returns (%) -0.6Net gearing (x) 0.1Altman Z-Score 3.38ROCE/WACC 1.6Beta (x) 0.8Book Value/share (RM) 0.68
Major Shareholders (%)Chew Chong Keat 26.2Singapore Enterprise 20.0Yang Heng Lam 18.5
Share Performance (%)Month Absolute Relative1m 11.8 8.6 3m 0.0 -3.8 6m 33.8 12.5 12m 36.0 -20.0
6-month Share Price Performance
1.0
0.9
0.8
0.7
0.6Oct-09 Nov-09 Dec-09 Jan-10 Feb-10 Mar-10 Apr-10

24
Going to Vietnam. FMH recently announced the signing of a memorandum of understanding with a local partner to develop a JV to operate a freight forwarding business in Vietnam. We view this move positively for the long term as expansion of the freight forwarding business to Vietnam gives wider accessibility to FMH’s customers. Like its foray into Indonesia, the contribution to its bottom-line will be insignificant in the near term. However, we caution that the devaluation of the Vietnamese dong is a concern, noting that that country’s high inflation of 9.5% may creep up further, especially given that Vietnam’s Central Bank is reluctant to raise interest rates.
Venturing into distribution. Going forward, Management is considering the possibility of venturing into the distribution of pharmaceutical products to hospitals and clinics. Although no firm decision has been reached on the venture, we concur with Management that such a move constitutes good diversification in that it should help FMH to sustain relatively stable growth given the defensiveness of the healthcare industry.
Solid balance sheet. FMH’s balance sheet remains strong although its net gearing increased slightly to 7% from 6% due to its application to restructure its loans for re-investment allowance. Nonetheless, we expect the company to be in a net cash position by year-end. We like the steady growth in FMH’s cash flow.
COMPANY REPORT CARD
ROE. FMH’s business model has been generating double digit ROEs of about 16% since FY08. We expect ROEs going forward to remain within this range given its light asset business model. Its ROE is among the highest compared with its regional peers.
Management. With founders Mr. Yang Heng Lam and the husband and wife team of Mr. Chew Chong Keat and Ms. Gan Siew Yong, FMH is backed by a solid management with vast experience in freight forwarding.
Dividend. On anticipation of its strong cash position, we expect the company to reward investors with a higher payout ratio of 42% for FY10 (40% for FY09). This translates into a dividend of 5.5 sen per share, giving a gross dividend yield of 6.8%.
RECOMMENDATION
We like FMH’s defensive earnings and the fact that it has done relatively well amid a shaky economy, chalking up earnings growth of 11.5% last year. Freight earns lucrative margins during bad times on the higher profit spreads from container shipment as volume is cushioned by a strong clientele and its exposure is predominantly centered on the Asian region. We peg FMH’s 12-month rolling EPS at 7x PE, in line with the sector PE, and derive a TP of RM0.950 with a BUY recommendation
Income Statement (RMm)
FYE 31 Dec FY07 FY08 FY09 FY10fTurnover 188.1 222.0 229.4 259.0Growth (%) 16.9 18.0 3.3 12.9EBIT 14.6 17.9 20.6 23.0Pretax 13.7 16.5 19.3 21.5Net Earnings 9.7 12.2 13.6 16.0FD EPS (sen) 8.0 10.0 11.1 13.1Growth (%) 25.2 25.6 11.5 17.6NTA/Share (RM) 0.43 0.51 0.58 0.67Div (Gross) (sen) 3.4 4.5 4.5 5.5Div (Yield) (%) 4.2 5.6 5.6 6.8PER (x) 10.1 8.1 7.2 6.1P/NTA (x) 1.9 1.6 1.4 1.2
Balance Sheet (RMm)
FYE 31 Dec FY07 FY08 FY09Fixed Assets 57.7 72.6 85.6Current Assets 59.7 68.1 62.5Current Liabilities -28.9 -36.3 -30.6Others 0.0 0.0 0.0Total 88.6 104.4 117.5Share capital 42.6 60.9 60.9Reserves 23.1 13.6 23.1Shareholders’ Fund 70.1 80.4 92.2LT Liabilities 18.5 24.0 25.3Others 0.0 0.0 0.0Total 88.6 104.4 117.5Gross Debt 22.3 31.8 29.9Net Cash/ (Debt) -6.8 -13.4 -2.6
Cash Flow Statement (RMm)
FYE 31 Dec FY07 FY08 FY09Cash Flow from Ops 11.2 13.1 29.8Cash Flow from Investing -10.7 -5.1 -2.1Cash Flow from Financing 9.8 -5.0 -16.6Net Increase in Cash 10.3 2.9 11.2Cash at Beginning of Year -1.4 8.9 11.9Other Changes 6.6 6.6 4.3Cash at End of Year 15.5 18.4 27.3
Freight Management

25
INVESTMENT MERITS
Niche commercial projects in prime locations to underpin future earnings
Good track record in securing en bloc sales of its commercial properties
Involved in JVs with landowners in good ‘cash flow’ developments
Strong unbilled sales almost equivalent to ≈2 years of FY09 turnover
Strong balance sheet Merely trading at 0.7x CY10 P/NTA vs. peers’ average of ≈0.85x
COMPANY PROFILE
Glomac is a Malaysian developer with prime foothold in the Klang Valley for over 20 years with principal activities in property development, property investment, construction and property management. Listed on the Main Board of Bursa Malaysia on 13 June 2000, the company began in 1988 when Tan Sri Dato’ FD Mansor (Executive Chairman) and Datuk Richard Fong (Executive Vice Chairman), joined forces to form Glomac. Its first project was a phase of single story terrace houses in Taman Jasa Utama in Selayang. Glomac’s turning point came when it entered Kelana Jaya and transformed the area from swampland into a bustling satellite city. Here it also began to develop a 6-8 storey business centre followed by its first high-end condominium, Prima 16. Glomac ventured into its first township project in 1997, via Bandar Saujana Utama in Sungai Buloh. Post listing in 2000, Glomac now manages 13 on-going projects from just 3 projects a year, including townships in Kota Tinggi (Johor Bahru) and Rawang (Selangor) and various commercial developments. It then moved into the development of gated and guarded community with Aman Suria Damansara (PJ), which soon led to similar developments such as the Lakeside Residences (Puchong) and Suria Residen (Cheras). In 2007, Glomac moved a notch up by venturing into KLCC with the development of Glomac Tower, which has since been sold en bloc to Kuwait Finance House at a record-high price.
KEY HIGHLIGHTS
High unbilled sales to underpin near-term earnings growth. Armed with an unbilled sales of RM554.7m (including the recent RM170.7m en bloc sale of an office tower in Glomac Damansara to Tabung Haji), which is equivalent to 1.5x its FY09 total turnover, Glomac’s near-term commendable earnings growth appears secure, even assuming there are limited new launches over the next 12 months. The unbilled sales comprise primarily projects in Glomac Damansara, Glomac Tower, Glomac Galleria and Glomac Cyberjaya. Even assuming limited launches for the next 12 months, this amount of unbilled sales due to be realised over the course of one to two years alone can largely sustain its commendable earnings growth into FY11.
GlomacStill Undervalued
Target : RM1.66Price : RM1.45
PROPERTY
Stock Profile/StatisticsBloomberg Ticker GLMC MKIssued Share Capital (m) 297.2Market Capitalisation (RMm) 430.952 week H | L Price (RM) 1.57 | 0.49Average Volume (3m) ‘000 346.3YTD Returns (%) 7.4Net gearing (x) 0.6Altman Z-Score 1.35ROCE/WACC 0.4Beta (x) 1.6Book Value/share (RM) 1.85
Major Shareholders (%)Tan Sri Dato’ Mohamed Mansor bin Fateh Din 23.9Datuk Fong Loong Tuck 17.4Dato’ Fateh Iskandar bin Tan SriDato’ Mohamed Mansor 10.9
Share Performance (%)Month Absolute Relative1m 9.8 5.4 3m 5.0 -4.6 6m 25.1 4.9 12m 195.8 88.2
6-month Share Price Performance1.6
1.5
1.4
1.3
1.2
1.1Oct-09 Nov-09 Dec-09 Jan-10 Feb-10 Mar-10 Apr-10
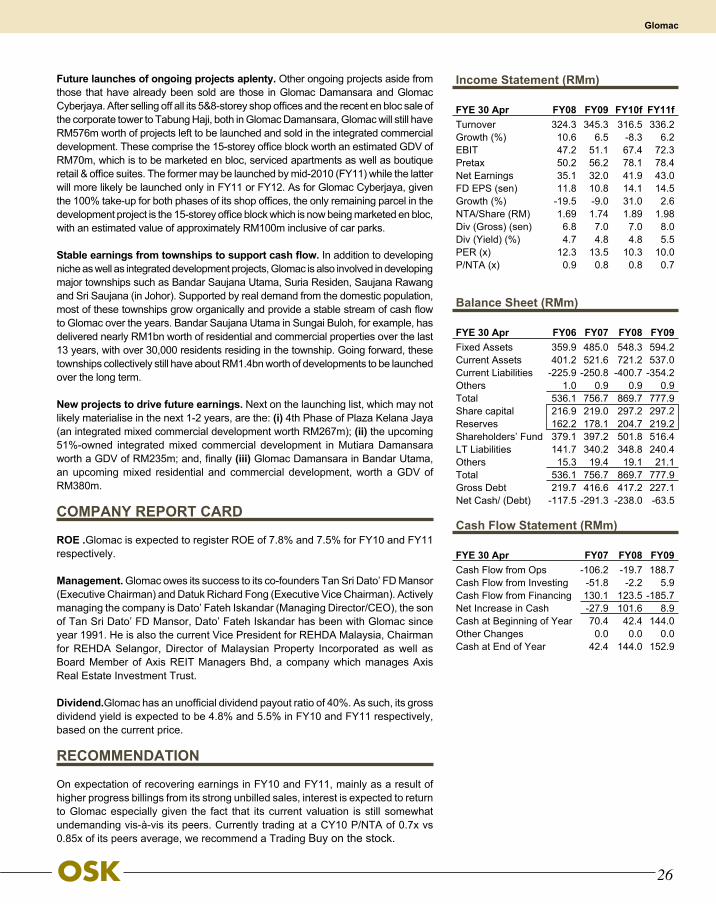
26
Future launches of ongoing projects aplenty. Other ongoing projects aside from those that have already been sold are those in Glomac Damansara and Glomac Cyberjaya. After selling off all its 5&8-storey shop offices and the recent en bloc sale of the corporate tower to Tabung Haji, both in Glomac Damansara, Glomac will still have RM576m worth of projects left to be launched and sold in the integrated commercial development. These comprise the 15-storey office block worth an estimated GDV of RM70m, which is to be marketed en bloc, serviced apartments as well as boutique retail & office suites. The former may be launched by mid-2010 (FY11) while the latter will more likely be launched only in FY11 or FY12. As for Glomac Cyberjaya, given the 100% take-up for both phases of its shop offices, the only remaining parcel in the development project is the 15-storey office block which is now being marketed en bloc, with an estimated value of approximately RM100m inclusive of car parks.
Stable earnings from townships to support cash flow. In addition to developing niche as well as integrated development projects, Glomac is also involved in developing major townships such as Bandar Saujana Utama, Suria Residen, Saujana Rawang and Sri Saujana (in Johor). Supported by real demand from the domestic population, most of these townships grow organically and provide a stable stream of cash flow to Glomac over the years. Bandar Saujana Utama in Sungai Buloh, for example, has delivered nearly RM1bn worth of residential and commercial properties over the last 13 years, with over 30,000 residents residing in the township. Going forward, these townships collectively still have about RM1.4bn worth of developments to be launched over the long term.
New projects to drive future earnings. Next on the launching list, which may not likely materialise in the next 1-2 years, are the: (i) 4th Phase of Plaza Kelana Jaya (an integrated mixed commercial development worth RM267m); (ii) the upcoming 51%-owned integrated mixed commercial development in Mutiara Damansara worth a GDV of RM235m; and, finally (iii) Glomac Damansara in Bandar Utama, an upcoming mixed residential and commercial development, worth a GDV of RM380m.
COMPANY REPORT CARD
ROE .Glomac is expected to register ROE of 7.8% and 7.5% for FY10 and FY11 respectively.
Management. Glomac owes its success to its co-founders Tan Sri Dato’ FD Mansor (Executive Chairman) and Datuk Richard Fong (Executive Vice Chairman). Actively managing the company is Dato’ Fateh Iskandar (Managing Director/CEO), the son of Tan Sri Dato’ FD Mansor, Dato’ Fateh Iskandar has been with Glomac since year 1991. He is also the current Vice President for REHDA Malaysia, Chairman for REHDA Selangor, Director of Malaysian Property Incorporated as well as Board Member of Axis REIT Managers Bhd, a company which manages Axis Real Estate Investment Trust.
Dividend.Glomac has an unofficial dividend payout ratio of 40%. As such, its gross dividend yield is expected to be 4.8% and 5.5% in FY10 and FY11 respectively, based on the current price.
RECOMMENDATION
On expectation of recovering earnings in FY10 and FY11, mainly as a result of higher progress billings from its strong unbilled sales, interest is expected to return to Glomac especially given the fact that its current valuation is still somewhat undemanding vis-à-vis its peers. Currently trading at a CY10 P/NTA of 0.7x vs 0.85x of its peers average, we recommend a Trading Buy on the stock.
Income Statement (RMm)
FYE 30 Apr FY08 FY09 FY10f FY11fTurnover 324.3 345.3 316.5 336.2Growth (%) 10.6 6.5 -8.3 6.2EBIT 47.2 51.1 67.4 72.3Pretax 50.2 56.2 78.1 78.4Net Earnings 35.1 32.0 41.9 43.0FD EPS (sen) 11.8 10.8 14.1 14.5Growth (%) -19.5 -9.0 31.0 2.6NTA/Share (RM) 1.69 1.74 1.89 1.98Div (Gross) (sen) 6.8 7.0 7.0 8.0Div (Yield) (%) 4.7 4.8 4.8 5.5PER (x) 12.3 13.5 10.3 10.0P/NTA (x) 0.9 0.8 0.8 0.7
Balance Sheet (RMm)
FYE 30 Apr FY06 FY07 FY08 FY09Fixed Assets 359.9 485.0 548.3 594.2Current Assets 401.2 521.6 721.2 537.0Current Liabilities -225.9 -250.8 -400.7 -354.2Others 1.0 0.9 0.9 0.9Total 536.1 756.7 869.7 777.9Share capital 216.9 219.0 297.2 297.2Reserves 162.2 178.1 204.7 219.2Shareholders’ Fund 379.1 397.2 501.8 516.4LT Liabilities 141.7 340.2 348.8 240.4Others 15.3 19.4 19.1 21.1Total 536.1 756.7 869.7 777.9Gross Debt 219.7 416.6 417.2 227.1Net Cash/ (Debt) -117.5 -291.3 -238.0 -63.5
Cash Flow Statement (RMm)
FYE 30 Apr FY07 FY08 FY09Cash Flow from Ops -106.2 -19.7 188.7Cash Flow from Investing -51.8 -2.2 5.9Cash Flow from Financing 130.1 123.5 -185.7Net Increase in Cash -27.9 101.6 8.9Cash at Beginning of Year 70.4 42.4 144.0Other Changes 0.0 0.0 0.0Cash at End of Year 42.4 144.0 152.9
Glomac
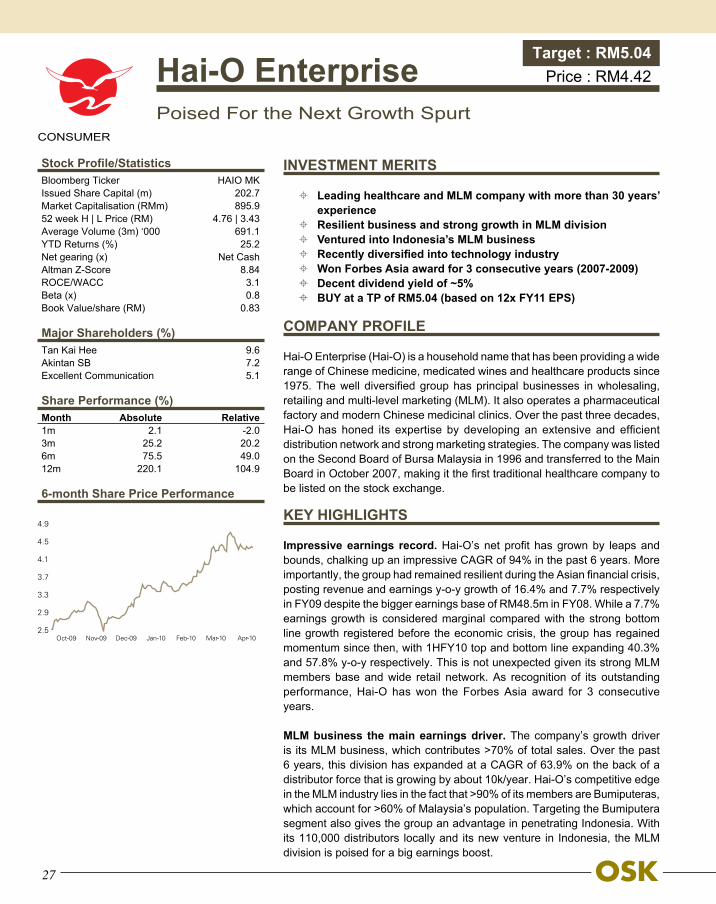
27
INVESTMENT MERITS
Leading healthcare and MLM company with more than 30 years’ experience
Resilient business and strong growth in MLM division Ventured into Indonesia’s MLM business Recently diversified into technology industry Won Forbes Asia award for 3 consecutive years (2007-2009)Decent dividend yield of ~5% BUY at a TP of RM5.04 (based on 12x FY11 EPS)
COMPANY PROFILE
Hai-O Enterprise (Hai-O) is a household name that has been providing a wide range of Chinese medicine, medicated wines and healthcare products since 1975. The well diversified group has principal businesses in wholesaling, retailing and multi-level marketing (MLM). It also operates a pharmaceutical factory and modern Chinese medicinal clinics. Over the past three decades, Hai-O has honed its expertise by developing an extensive and efficient distribution network and strong marketing strategies. The company was listed on the Second Board of Bursa Malaysia in 1996 and transferred to the Main Board in October 2007, making it the first traditional healthcare company to be listed on the stock exchange.
KEY HIGHLIGHTS
Impressive earnings record. Hai-O’s net profit has grown by leaps and bounds, chalking up an impressive CAGR of 94% in the past 6 years. More importantly, the group had remained resilient during the Asian financial crisis, posting revenue and earnings y-o-y growth of 16.4% and 7.7% respectively in FY09 despite the bigger earnings base of RM48.5m in FY08. While a 7.7% earnings growth is considered marginal compared with the strong bottom line growth registered before the economic crisis, the group has regained momentum since then, with 1HFY10 top and bottom line expanding 40.3% and 57.8% y-o-y respectively. This is not unexpected given its strong MLM members base and wide retail network. As recognition of its outstanding performance, Hai-O has won the Forbes Asia award for 3 consecutive years.
MLM business the main earnings driver. The company’s growth driver is its MLM business, which contributes >70% of total sales. Over the past 6 years, this division has expanded at a CAGR of 63.9% on the back of a distributor force that is growing by about 10k/year. Hai-O’s competitive edge in the MLM industry lies in the fact that >90% of its members are Bumiputeras, which account for >60% of Malaysia’s population. Targeting the Bumiputera segment also gives the group an advantage in penetrating Indonesia. With its 110,000 distributors locally and its new venture in Indonesia, the MLM division is poised for a big earnings boost.
Hai-O EnterprisePoised For the Next Growth Spurt
Target : RM5.04Price : RM4.42
CONSUMER
Stock Profile/StatisticsBloomberg Ticker HAIO MK Issued Share Capital (m) 202.7Market Capitalisation (RMm) 895.952 week H | L Price (RM) 4.76 | 3.43Average Volume (3m) ‘000 691.1YTD Returns (%) 25.2Net gearing (x) Net CashAltman Z-Score 8.84ROCE/WACC 3.1Beta (x) 0.8Book Value/share (RM) 0.83
Major Shareholders (%)Tan Kai Hee 9.6Akintan SB 7.2Excellent Communication 5.1
Share Performance (%)Month Absolute Relative1m 2.1 -2.0 3m 25.2 20.2 6m 75.5 49.0 12m 220.1 104.9
6-month Share Price Performance
4.9
4.5
4.1
3.7
3.3
2.9
2.5Oct-09 Nov-09 Dec-09 Jan-10 Feb-10 Mar-10 Apr-10

28
Resilient retail business. Hai-O has 65 outlets, including 10 franchise stores with a cumulative floor space of 68,000 sq ft in Malaysia. Its target is to open 3-5 new outlets a year and increase the number of house brands - contributing >40% of retail sales - which command higher margins. The introduction of house brands in 2007 has helped to boost EBITDA margin from 12.2% in 2006 to 18.5% in 2009. Given that consumers do not usually cut down on healthcare food expenses, this division would provide some support to earnings during difficult times. While consumers may down-trade to cheaper products, we believe that there is a certain brand loyalty for its products, as seen from the ever growing membership of its Hai-O Raya Customer Loyalty programme, which boasts of 120,000 members and contributes to more than 50% of total retail sales.
Another new business to propel earnings. Hai-O had recently invented a new technology called “high intensity heat transfer technology”, which can be used in applications where heat is exchanged, transferred or dissipated and can also be used in the conversion of heat to electricity. The group has presented its research at international conferences and is applying to patent the technology. In December 2009, the group signed an agreement with Beijing Co-Chance Co Ltd, a company under China Aero Space Corporation (CAST), to develop a high efficiency system to harness solar energy and is also talking to other parties on more joint ventures. A few trial applications in China and Malaysia are proceeding as planned. Given its wide application and low initial investment cost of ~RM3m, we believe this venture is a potential earnings booster. Aside from that, should this business make good progress, this division together with the retail division should provide strong earnings support during an economic downturn, which may render the group more resilient than other MLM players.
COMPANY REPORT CARD
ROE. Hai-O’s ROE has escalated from 5% in FY04 to 32% in FY09, which is the highest among its listed peers in Malaysia. Going forward, we expect ROEs to be at around 30%, backed by the company’s strong local MLM operation, new venture into Indonesia and new technology.
Management. Managing Director Mr. Tan Kai Hee has over 30 years’ experience in the industry. Under his leadership, Hai-O has won numerous awards, with the main awards being the Forbes Asia 2009 Under A Billion List for consistent growth in sales and profits over 3 years.
Dividend. Hai-O is committed to a 50% payout ratio and has in fact been paying more than 50% of its net profit as dividend over the last 2 years. Management said the group does not see any reason to reduce the payout going forward unless capital needs for expansion arise.
RECOMMENDATION
Hai-O’s share price has outperformed the KLCI by more than 100% in the past 12 months. We value the stock at RM5.04, pegged at 12x FY11 EPS.
Income Statement (RMm)
FYE 30 Apr FY08 FY09 FY10f FY11fTurnover 373.8 435.2 569.6 679.0Growth (%) 97.4 16.4 30.9 19.2EBIT 67.2 76.1 107.4 125.4Pretax 67.7 75.9 106.4 124.4Net Earnings 48.5 52.3 72.6 85.2FD EPS (sen) 23.9 25.8 35.8 42.0Growth (%) 97.4 16.4 30.9 19.2NTA/Share (RM) 0.59 0.68 0.94 1.17Div (Gross) (sen) 16.7 17.5 24.0 28.0Div (Yield) (%) 3.8 4.0 5.4 6.3PER (x) 18.5 17.1 12.3 10.5P/NTA (x) 7.5 6.5 4.7 3.8
Balance Sheet (RMm)
FYE 30 Apr FY07 FY08 FY09Fixed Assets 53.8 50.2 94.0Current Assets 95.1 154.0 154.4Current Liabilities -38.0 -58.0 -61.2Others 0.0 0.0 0.0Total 110.9 146.1 187.2Share capital 68.8 83.1 84.5Reserves 36.9 57.5 81.0Shareholders’ Fund 105.7 140.6 165.4LT Liabilities 0.1 0.1 15.7Others 5.2 5.5 6.0Total 110.9 146.1 187.2Gross Debt 7.4 5.2 19.5Net Cash/ (Debt) 20.3 68.1 31.3
Cash Flow Statement (RMm)
FYE 30 Apr FY07 FY08 FY09Cash Flow from Ops 27.8 53.8 53.4Cash Flow from Investing -11.0 9.2 -41.8Cash Flow from Financing -2.7 -17.4 -34.3Net Increase in Cash 14.0 45.6 -22.6Cash at Beginning of Year 13.6 27.7 73.3Other Changes 0.0 0.0 0.0Cash at End of Year 27.7 73.3 50.7
Hai-O Enterprise

29
INVESTMENT MERITS
The largest and leading private hospital group in Malaysia Steady and attractive dividend payout of 50% of PATAMI On-going expansion strategy to add at least two hospitals a year Resilient earnings and immense growth potential Attractive valuation compared with its regional peers
COMPANY PROFILE
KPJ Healthcare (KPJ) is the healthcare arm of Johor Corporation and the largest private hospital group in Malaysia. Johor Corp holds an equity stake of about 50% in KPJ. In Malaysia alone, KPJ operates 20 specialist hospitals and manages several hospitals in Indonesia, Saudi Arabia and Bangladesh. The company was listed on the Main Board of Bursa Malaysia in 1994. The group’s subsidiaries are involved in the provision of medical treatment, consultation, pathology and laboratory services as well as the trading of pharmaceutical and consumer healthcare products. KPJ also operates a private nursing college, Puteri Nursing International College. To ease its balance sheet, the group had in the last few years been progressively injecting its hospital buildings into Al-Aqar REIT, in which it owns slightly less than 50% equity interest.
KEY HIGHLIGHTS
Ongoing expansion. Backed by 20 hospitals across the country, KPJ has Malaysia’s largest private hospital network and looks set to defend its leading position in the sector. The group aims to expand its network by adding at least two new hospitals a year, focusing on areas where there is growing demand for private healthcare. We believe that government regulations making it tougher for small stand-alone private hospitals to operate will open up more M&A opportunities for KPJ group. In the last year alone, it has announced that 4 new hospitals would be operational by end-2011 and 2012. Its 4th injection of hospital buildings into Al-Aqar REIT will enable KPJ to expand its hospital network without stretching its balance sheet. Given its wide hospitals network nationwide catering to different consumer segments, KPJ can achieve economies of scale and is poised to benefit from its vast network of clients nationwide.
Resilient earnings. Given the nature of its services, which are deemed necessities, we believe that the scarcity of medical services and the fact that public hospitals are experiencing long queues will hold KPJ in good stead to weather an economic downturn. We believe KPJ will be able to sustain its growth momentum given its strong client base comprising diverse market segments and reputable brand name. Its limited exposure to medical tourism, which accounts for less than 2% of its topline, will shield it from a potential slump in medical tourism arising from the economic slowdown. Hence, given its exposure in Malaysia’s fast growing private healthcare sector, we believe KPJ would have the most defensive earnings compared with its regional peers.
KPJ HealthcareProviding Consistent Care
Target : RM3.92Price : RM2.94
HEALTHCARE
Stock Profile/StatisticsBloomberg Ticker KPJ MKIssued Share Capital (m) 528.9Market Capitalisation (RMm) 1,555.052 week H | L Price (RM) 3.10 | 1.041Average Volume (3m) ‘000 1531.2YTD Returns (%) 12.9Net gearing (x) 0.3Altman Z-Score 3.39ROCE/WACC 1.2Beta (x) 0.8Book Value/share (RM) 0.96
Major Shareholders (%)Johor Corp 50.1Kumpulan Waqaf 8.79EPF 6.69
Share Performance (%)Month Absolute Relative1m 14.8 10.5 3m 13.3 8.4 6m 67.6 45.7 12m 183.5 84.6
6-month Share Price Performance
3.2
3.0
2.8
2.6
2.4
2.2
2.0
1.8
1.6Oct-09 Nov-09 Dec-09 Jan-10 Feb-10 Mar-10 Apr-10

30
Greater exposure to medical tourism. Despite KPJ’s limited exposure to medical tourism, we believe this segment may be the next growth catalyst for the group and the industry in general. Private healthcare players such as KPJ are set to benefit from the New Economy Model, which has identified medical tourism as a future source of income for the country. The bigger capacity coming onstream over the next few years will allow KPJ to increase its exposure in medical tourism given that its present limited capacity and high demand from the domestic market has prevented it from doing so. Nevertheless, the domestic market will remain KPJ’s key focus, with medical tourism expected to contribute about 10%-15% to group topline in the future.
Cautious with overseas expansion. At present, the group does not plan to deploy large investments to set up overseas hospitals although it has been invited to do so as it believes there are untapped opportunities in the local healthcare market, judging by the growing number of players venturing into the sector. KPJ views such investments as risky and intends to further concentrate on providing hospital management services to its overseas operations. Nevertheless KPJ believes there is sizeable potential abroad, particularly Indonesia, where it is willing to expand its operations provided that it found the right partners. In December last year, KPJ opened its first owned hospital near Jakarta.
Higher corporate profile. Year 2009 has proven to be a very good one for KPJ in terms of operation and corporate profile. For the first time, KPJ reported a net profit of above RM100m for FY09 and also ended the year as one of the biggest gainers in terms of share price. At present, with a market capitalization of about RM1.3bn, KPJ has earned its place among the Top 100 biggest companies listed on Bursa Malaysia and has been included as a member of FBM KLCI 100 Index. These milestones have raised the company’s corporate profile. We believe the achievements are partly attributed to significant improvements in its share liquidity following the recent bonus issue and share split exercise.
COMPANY REPORT CARD
ROE. KPJ chalked up ROE of nearly 20% for both FY08 and FY09. We expect the group to register an ROE of above 20% for FY10 and FY11 respectively.
Management. The group is currently led by Datin Paduka Siti Sa’diah Sheikh Bakir, who has been Managing Director for the last 17 years. She is backed by a strong management team that strives to sustain the group’s growth momentum.
Dividend. Over the last few years, KPJ has been distributing around 50% of PATAMI as dividend and we expect it to continue to do so in the next few years.
RECOMMENDATION
We value KPJ at 18.5x PER on FY10 EPS and arrive at a TP of RM3.92, which is based on its regional peer average as we believe KPJ deserves higher valuation. This is because its shares have been undervalued for years despite the fact that the group offers comparable earnings performance and balance sheet strength as well as growth potential. The improved liquidity should also justify the stock’s higher valuation. Although the potential price upside is smaller than previously, we reiterate our view that KPJ is an excellent choice for long term investment and portfolio balancing given its resilient business, steady dividend payout and growth potential in a defensive sector.
Income Statement (RMm)
FYE 31 Dec FY07 FY08 FY09 FY10fTurnover 1108.0 1270.2 1446.4 1600.5Growth (%) 33.3 14.6 13.9 10.7EBIT 93.1 113.2 138.5 160.9Pretax 85.2 114.1 142.0 159.9Net Earnings 74.2 85.6 101.9 112.4FD EPS (sen) 14.0 16.2 19.3 21.2Growth (%) 79.8 15.4 18.9 10.3NTA/Share (RM) 0.77 0.87 0.96 1.04Div (Gross) (sen) 17.0 28.2 3.0 3.4Div (Yield) (%) 1.84 3.06 3.06 4.34PER (x) 20.9 18.2 15.3 13.8P/NTA (x) 3.8 3.4 3.1 2.8
Balance Sheet (RMm)
FYE 31 Dec FY07 FY08 FY09Fixed Assets 771.6 676.2 835.0Current Assets 433.1 586.7 501.6Current Liabilities 286.3 285.9 329.7Others 0.0 0.0 0.0Total 918.4 977.0 1007.0Share capital 207.7 209.5 211.1Reserves 301.1 359.9 411.8Shareholders’ Fund 508.8 569.3 622.8LT Liabilities 332.2 359.4 333.1Others 77.4 48.3 51.0Total 918.4 977.0 956.0Gross Debt 362.3 365.8 362.8Net Cash/ (Debt) -262.2 -274.2 -224.8
Cash Flow Statement (RMm)
FYE 31 Dec FY07 FY08 FY09Cash Flow from Ops 93.0 124.0 95.6Cash Flow from Investing -39.8 -61.3 -28.5Cash Flow from Financing 4.2 -52.3 -33.4Net Increase in Cash 57.4 10.4 33.7Cash at Beginning of Year 33.5 90.9 101.3Other Changes 0.0 0.0 0.0Cash at End of Year 90.9 101.3 135.0
KPJ Healthcare

31
INVESTMENT MERITS
Direct and indirect beneficiary of government spending in SCORE
Increasing exposure in Cambodia’s power sector Good returns from new Cambodian power transmission lines Impending listing of Sarawak Cable Berhad Fair value of RM1.13, based on SOP valuation
COMPANY PROFILE
Leader Universal Holdings (Leader) is the investment holding company of Leader group. The company was established in 1988 as part of a merger involving Leader Cable Industry Bhd and Universal Cable (M) Bhd, two of the largest cable companies in Malaysia. The union of these two giants, which made Leader group the largest wire and cable producer in Asean, enabled the group to reap significant benefits in terms of production capacity, manufacturing technology and product research. In 1995, Leader diversified from its traditional cable and wire manufacturing business in partnership with two other Malaysian companies to develop the first Malaysian-owned 35MW fuel oil fired Independent Power Plant (IPP) in Phnom Penh, Cambodia. Riding on the experience and expertise culled over the years, Leader recently won the job to develop a 200MW power plant in Cambodia via a 50:50 JV with Cambodia-based MKCSS Holdings. The new IPP was recently split into two equal parts, which gave Leader the full concession rights to develop 100MW.
KEY HIGHLIGHTS
Scoring with SCORE. The demand for cables and wires in the SCORE region has been picking up as the Government’s stimulus packages gather pace with the construction of hydroelectric dams in Sarawak state. Besides directly supplying to the site itself, Leader’s has a 17% stake in, Sarawak Cable Berhad (SCB), which would be Leader’s indirect supplier to the state. SCB is principally involved in manufacturing electrical wires and cables as well as sub-contract power and transmission related works.
Leader UniversalElectric Dreams
Target : RM1.13Price : RM1.00
INDUSTRIAL PRODUCTS
Stock Profile/StatisticsBloomberg Ticker LUH MKIssued Share Capital (m) 436.5Market Capitalisation (RMm) 436.552 week H | L Price (RM) 1.05 | 0.45Average Volume (3m) ‘000 2386.1YTD Returns (%) 28.2Net gearing (x) 0.1Altman Z-Score 2.55ROCE/WACC 0.9Beta (x) 1.6Book Value/share (RM) 1.24
Major Shareholders (%)Zun Holdings SB 13.5LTH 6.4Gold Connection Assets Ltd 6.4
Share Performance (%)Month Absolute Relative1m 9.8 5.0 3m 25.5 21.5 6m 34.6 17.7 12m 123.3 47.1
6-month Share Price Performance
1.2
1.1
1.0
0.9
0.8
0.7Oct-09 Nov-09 Dec-09 Jan-10 Feb-10 Mar-10 Apr-10

32
Powering up Cambodia. Leader’s exposure in the Cambodian power sector has been growing in the past few years. Currently it operates a 35MW coal-fired power plant in Phnom Penh and recently secured a new 100MW coal-fired power plant in Sihanoukville and a 230kV power transmission line concession. These concessions are for 30 years upon commencement. In fact, they are also lucrative, with the 100MW power plant providing an estimated IRR in the low teens while the 230kV transmission lines will produce an IRR in the high teens. Leader is in the midst of discussing and conducting feasibility studies with the Cambodian authorities with regard to constructing a 700MW coal-fired power plant, also in Sihanoukville. The salient terms of this power concession are, however, still preliminary.
Upside to valuation. SCB is slated to be listed on Bursa Malaysia in May. This should give Leader a valuation premium, especially if the IPO shares list at a higher valuation. SCB, in which Leader has a 17% stake, is believed to be the main supplier of cables and wires in Sarawak given that one of its major shareholders is Sarawak Energy (SE), which is tipped to be the main operator of all the power utilities in Sarawak state.
COMPANY REPORT CARD
ROE. Higher orders in the upcoming quarters will translate into better earnings for Leader. We see ROEs in double-digits at 12% and 12.2% for FY10 and FY11 respectively.
Management. Having weathered a difficult environment last year, we reckon management will be able to capitalize on more opportunities arising from its domestic and offshore operations.
Dividend. Despite a tough operating environment last year, Leader declared a gross dividend of 3 sen per share. Now that its business is faring better, we estimate that Leader will pay a dividend of 3.7 sen per share in FY10, premised on a payout level similar to last year’s 17%.
RECOMMENDATION
We derive a 12-month SOP target price of RM1.13 for Leader premised on its FY10 numbers. Its upside does not stop here as growing visibility on its Cambodian power ventures will shed more light on its concession earnings, and hence justify an upgrading in our valuation. We maintain our BUY recommendation on the stock, premised on its gross dividend estimates, as we believe the stock will provide a gross yield of 3.7% for the full year.
Income Statement (RMm)
FYE 31 Dec FY07 FY08 FY09 FY10fTurnover 2821.7 2540.8 1949.8 2131.9Growth (%) 19.3 -10.0 -23.3 9.3EBIT 121.0 130.9 93.7 101.5Pretax 94.5 102.0 76.8 88.7Net Earnings 66.0 64.9 53.4 68.5FD EPS (sen) 15.1 14.9 12.2 15.7Growth (%) 86.8 -1.6 -17.7 28.1NTA/Share (RM) 0.99 1.15 1.24 1.37Div (Gross) (sen) 3.0 3.0 3.0 3.7Div (Yield) (%) 3.0 3.0 3.0 3.7PER (x) 6.6 6.7 8.2 6.4P/NTA (x) 1.0 0.9 0.8 0.7
Balance Sheet (RMm)
FYE 31 Dec FY07 FY08 FY09Fixed Assets 389.9 423.0 463.8Current Assets 955.8 864.4 793.7Current Liabilities -649.9 -542.6 -489.4Others 0.0 0.0 0.0Total 695.8 744.8 768.1Share capital 436.5 436.5 436.5Reserves -3.1 63.4 104.9Shareholders’ Fund 433.4 499.8 541.4LT Liabilities 163.9 139.7 97.7Others 98.5 105.3 129.0Total 695.8 744.8 768.1Gross Debt 516.6 427.4 273.2Net Cash/ (Debt) -284.0 -216.5 -45.0
Cash Flow Statement (RMm)
FYE 31 Dec FY07 FY08 FY09Cash Flow from Ops 183.8 137.0 277.3Cash Flow from Investing -40.7 -22.2 -65.2Cash Flow from Financing -72.0 -147.8 -175.3Net Increase in Cash 71.1 -33.0 36.8Cash at Beginning of Year 144.3 208.2 178.3Other Changes -2.4 3.0 -1.2Cash at End of Year 213.0 178.3 213.9
Leader Universal

33
INVESTMENT MERITS
The leading manufacturer of integrated long steel in Malaysia Solid asset backing with NTA of RM3.79 per share Market cap of listed subsidiaries and associates worth RM2.00
per LICB share Direct beneficiary of higher steel demand and prices Fair value RM2.51, based on blended valuation of 6x FY10 EPS
and 0.61x FY10 NTA/share
COMPANY PROFILE
Lion Industries Corporation (LICB) is the largest integrated long steel manufacturer in Malaysia whose steel business can be traced back more than half a century. The first rolling mill, under Amsteel Mills SB (AMSB) (99% owned), was commissioned in 1978 in Klang, Selangor. AMSB is now one of the largest and most modern steel mills in the country, with two steel making plants - one in Klang and one in Banting, Selangor - producing billets, steel bars and wire rods. The Banting mill, which commenced operation in June 2001, makes special grade bars and wire rods for specialty use products. Another mill operated by the Group is Antara Steel Mills SB (ASMSB) in Pasir Gudang, Johor. The mill, acquired in September 2002 from Johor Corporation, produces billets and bars, including angle bars and U-channels. ASMSB currently operates a hot briquetted iron (HBI) plant in Labuan using Midrex Direct Reduction technology. LICB is also involved in manufacturing tyres under the Silverstone brand in China via 73% owned listed subsidiary, Lion Forest (LFB). It also owns two other listed associates, Lion Diversified (21%) and Parkson Holdings (18%).
KEY HIGHLIGHTS
The “Lion King”. LICB, the largest fully integrated long steel producer in Malaysia, is sitting on solid assets worth RM1.7bn in its books. The company’s NTA stood at RM3.79/share as at 31 Dec, 2009, which translates into an unrealistic P/NTA of below 0.5x. Also, the market has not attached any value to its core steel business as its 18% equity interest in Parkson Holdings, 21% Lion Diversified and 73% of Lion Forest give a total market capitalisation of nearly RM2.00/share. Being the main integrated steel plant in the Klang Valley, the company also benefits from the construction boom in Malaysia. It also has the sole steel mill in the southern region that enjoys easy access to Singapore.
Lion Industries CorpTime to Roar Again
Target : RM2.51Price : RM1.92
STEEL
Stock Profile/StatisticsBloomberg Ticker LLB MKIssued Share Capital (m) 713.9Market Capitalisation (RMm) 1,370.752 week H | L Price (RM) 2.00 | 0.70Average Volume (3m) ‘000 3370.6YTD Returns (%) 40.1Net gearing (x) 0.2Altman Z-Score 1.46ROCE/WACC -0.6Beta (x) 2.5Book Value/share (RM) 3.60
Major Shareholders (%)Lion Corporation 25.6Megasteel 14.4
Share Performance (%)Month Absolute Relative1m 7.3 3.3 3m 17.1 9.9 6m 27.3 15.5 12m 163.2 83.8
6-month Share Price Performance
2.1
1.9
1.7
1.5
1.3
1.1Oct-09 Nov-09 Dec-09 Jan-10 Feb-10 Mar-10 Apr-10

34
All set for the next surge. After a period of slumber, LICB is now back on investors’ radar screens. Prices of all major raw materials have been on an uptrend, with the iron ore and coking coal settling recently at 90% and 55% higher - and way above our original estimates of 25% - although the new benchmark is only valid for one quarter instead of being a traditional yearly contract price. We see room for steel prices to go up by another 5% to 10% given the sharp spike in raw material prices in anticipation of a price increase. There is also consistent demand for exports of semi-finished products to South-East Asia (SEA) since the imposition of China’s 25% export tax on billets gave rise to a vacuum of 5m tonnes of billets. Already, most of the world’s major millers have announced higher average selling prices (ASP) for next the two months.
Iron making a new sweet spot. Escalating prices are always music to steel millers’ ears as this spurs buying momentum in the physical steel market. With raw material prices escalating, including that of scrap metal, it is certainly time to cheer for iron makers as their selling prices are perfectly correlated. We expect margin expansion at least for 1HCY10 given that the existing benchmark pricing for iron ore pellets will be in force up to end-March, plus a regular two to three-month stockpile. We also believe this business segment will continue to enjoy fairly reasonable margins as it will benefit from the regular spread plus cheap natural gas that is currently capped at USD3 per mmBtu as the contract only matures at end-2012 .
COMPANY REPORT CARD
ROE. After making a huge impairment in FY09, LICB is expected to make a comeback with ROE returning to a double digit 10.5%. Coupled with a good income mix, the company expects to maintain attractive ROE going forward.
Management. The company is headed by Managing Director Tan Sri Albert Cheng Yong Kim, who has more than 30 years of experience in Lion Group. Its management also comprises dedicated and hands-on senior staff who have been with the group for years.
Dividend. A condition in a bond covenant prohibits LICB’s main profit-making subsidiaries from channelling their cash back to the holding company until the bonds or long-term borrowings are fully redeemed by FY11. This limits its dividend to 1 sen per share. Nonetheless, with LICB being a thematic high beta stock, investors should look at its capital return potential rather than dividend.
RECOMMENDATION
Being the largest long steel player in the country, LICB is trading at an unrealistic PER and P/NTA of below 5x and 0.5x FY10 respectively. That said, the company is well positioned to benefit from the potential surge in steel prices and demand following the implementation of stimulus packages around the world. Iron making is also expected to contribute good earnings as a result of cheap natural gas and regular conversion margin. With that, we reiterate our BUY recommendation. Our target price of RM2.51 is derived from a blended valuation of 6x FY10 EPS and 0.61x FY10 NTA/share.
Income Statement (RMm)
FYE 30 June FY08 FY09 FY10f FY11fTurnover 6940.2 4572.0 5940.5 6378.7Growth (%) 52.7 -34.1 29.9 7.4EBIT 1003.4 -345.6 477.5 511.0Pretax 893.6 -364.3 371.5 442.3Net Earnings 844.2 -276.9 303.3 365.7FD EPS (sen) 118.5 -38.8 42.5 51.3Growth (%) 292.9 -132.8 -209.5 20.6NTA/Share (RM) 4.05 3.64 4.06 4.57Div (Gross) (sen) 1.0 1.0 1.0 1.0Div (Yield) (%) 0.5 0.5 0.5 0.5PER (x) 1.6 -4.9 4.5 3.7P/NTA (x) 0.5 0.5 0.5 0.4
Balance Sheet (RMm)
FYE 30 June FY07 FY08 FY09Fixed Assets 2522.1 2507.9 2971.1Current Assets 2999.7 3081.9 2331.3Current Liabilities -1810.0 -1430.0 -1640.4Others 131.0 130.8 130.4Total 3842.9 4290.6 3792.5Share capital 705.6 712.7 713.0Reserves 1436.7 2306.9 2015.5Shareholders’ Fund 2142.2 3019.6 2728.4LT Liabilities 1504.7 1075.7 730.4Others 196.0 195.2 333.7Total 3842.9 4290.6 3792.5Gross Debt 2188.6 1403.5 1319.0Net Cash/ (Debt) -1477.1 -766.8 -585.6
Cash Flow Statement (RMm)
FYE 30 June FY07 FY08 FY09Cash Flow from Ops 450.3 502.1 501.6Cash Flow from Investing 312.4 277.7 -63.5Cash Flow from Financing -663.8 -675.4 -508.6Net Increase in Cash 98.9 104.4 -70.5Cash at Beginning of Year 134.0 233.2 335.2Other Changes 0.2 -2.4 1.7Cash at End of Year 233.2 335.2 266.3
Lion Industries Corporation
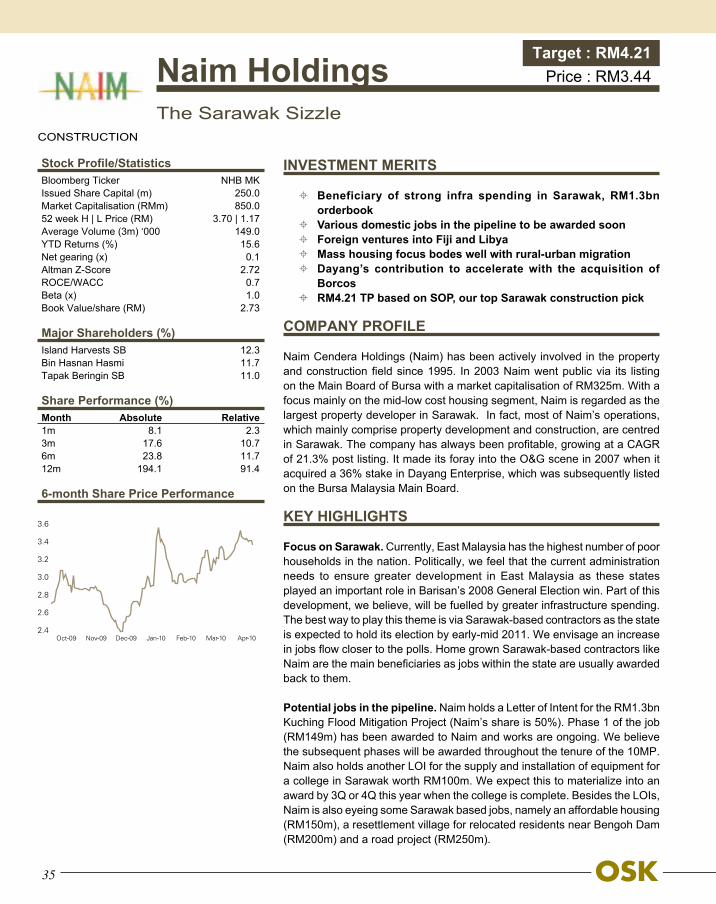
35
INVESTMENT MERITS
Beneficiary of strong infra spending in Sarawak, RM1.3bn orderbook
Various domestic jobs in the pipeline to be awarded soon Foreign ventures into Fiji and Libya Mass housing focus bodes well with rural-urban migration Dayang’s contribution to accelerate with the acquisition of
Borcos RM4.21 TP based on SOP, our top Sarawak construction pick
COMPANY PROFILE
Naim Cendera Holdings (Naim) has been actively involved in the property and construction field since 1995. In 2003 Naim went public via its listing on the Main Board of Bursa with a market capitalisation of RM325m. With a focus mainly on the mid-low cost housing segment, Naim is regarded as the largest property developer in Sarawak. In fact, most of Naim’s operations, which mainly comprise property development and construction, are centred in Sarawak. The company has always been profitable, growing at a CAGR of 21.3% post listing. It made its foray into the O&G scene in 2007 when it acquired a 36% stake in Dayang Enterprise, which was subsequently listed on the Bursa Malaysia Main Board.
KEY HIGHLIGHTS
Focus on Sarawak. Currently, East Malaysia has the highest number of poor households in the nation. Politically, we feel that the current administration needs to ensure greater development in East Malaysia as these states played an important role in Barisan’s 2008 General Election win. Part of this development, we believe, will be fuelled by greater infrastructure spending. The best way to play this theme is via Sarawak-based contractors as the state is expected to hold its election by early-mid 2011. We envisage an increase in jobs flow closer to the polls. Home grown Sarawak-based contractors like Naim are the main beneficiaries as jobs within the state are usually awarded back to them.
Potential jobs in the pipeline. Naim holds a Letter of Intent for the RM1.3bn Kuching Flood Mitigation Project (Naim’s share is 50%). Phase 1 of the job (RM149m) has been awarded to Naim and works are ongoing. We believe the subsequent phases will be awarded throughout the tenure of the 10MP. Naim also holds another LOI for the supply and installation of equipment for a college in Sarawak worth RM100m. We expect this to materialize into an award by 3Q or 4Q this year when the college is complete. Besides the LOIs, Naim is also eyeing some Sarawak based jobs, namely an affordable housing (RM150m), a resettlement village for relocated residents near Bengoh Dam (RM200m) and a road project (RM250m).
Naim Holdings The Sarawak Sizzle
Target : RM4.21Price : RM3.44
CONSTRUCTION
Stock Profile/StatisticsBloomberg Ticker NHB MKIssued Share Capital (m) 250.0Market Capitalisation (RMm) 850.052 week H | L Price (RM) 3.70 | 1.17Average Volume (3m) ‘000 149.0YTD Returns (%) 15.6Net gearing (x) 0.1Altman Z-Score 2.72ROCE/WACC 0.7Beta (x) 1.0Book Value/share (RM) 2.73
Major Shareholders (%)Island Harvests SB 12.3Bin Hasnan Hasmi 11.7Tapak Beringin SB 11.0
Share Performance (%)Month Absolute Relative1m 8.1 2.3 3m 17.6 10.7 6m 23.8 11.7 12m 194.1 91.4
6-month Share Price Performance
3.6
3.4
3.2
3.0
2.8
2.6
2.4Oct-09 Nov-09 Dec-09 Jan-10 Feb-10 Mar-10 Apr-10

36
Venturing overseas. In efforts to diversify geographically, Naim managed to secure the King’s Road upgrade in Fiji (RM65.5m). It was subsequently offered a FJD100m (~RM165.9m) contract by the Fijian government to rehabilitate its national highway. We gather that Phase 1 (RM37.9m) has been awarded to Naim and that subsequent phases will be dished out progressively. Recently, Naim also signed a MOU with the Libyan government to jointly design a development plan for a parcel of land 30km from Tripoli City Centre, Libya. Although there are no firm details as yet, we do not discount the possibility of Naim participating in the construction works for the development.
Focus on affordable housing. Naim’s property division will remain focused on the mid-low cost housing segment (70% of its houses command prices < RM180,000). We reckon that Naim’s mass housing segment focus augurs well given Sarawak’s rural-urban migration theme and rising middle income households. Its current developments have an estimated GDV balance of RM5.9bn, which will be launched progressively over the next 15 years. For FY10, Naim is targeting RM200m in sales. Last year, the company recorded RM152m in sales.
Contributions from Dayang. Naim’s 36% associate Dayang Enterprise has an estimated orderbook balance of RM708m. We expect contributions from Dayang to accelerate in FY10 driven mainly by contracts secured last year. The company is tendering for RM2bn worth of contracts currently. Also, Dayang recently acquired a 40% stake in Syarikat Borcos Shipping (Borcos), which is the 2nd largest domestic vessel operator after Bumi Armada and has a stable of 33 vessels.
COMPANY REPORT CARD
ROE. Naim posted ROE of 12.3% for FY09. We project ROE of 13.5% for FY10.
Management. Naim is primarily driven by Datuk Hasmi Bin Hassan, its founder and Managing Director who holds a 29.4% stake. The company is perceived to be politically linked to the Chief Minister of Sarawak.
Dividend. There is no formal dividend policy but Naim has been consistently paying out dividends.
RECOMMENDATION
Our RM4.21 TP is based on a 2-stage Sum of Parts methodology. We value Naim’s core earnings (ex Dayang contribution) at 12x and its share of Dayang’s profits at 9x. Naim remains our top pick for Sarawak construction play. Its P/BV continues to remain below its long term average of 1.6x.
Income Statement (RMm)
FYE 31 Dec FY07 FY08 FY09 FY10fTurnover 646.0 523.7 527.0 647.6Growth (%) 22.8 -18.9 0.6 22.9EBIT 116.3 85.4 94.0 96.0Pretax 126.3 104.3 110.0 122.0Net Earnings 76.3 80.7 78.7 93.5FD EPS (sen) 30.5 32.3 31.5 37.4Growth (%) 15.2 5.9 -2.5 20.7NTA/Share (RM) 2.23 2.44 2.67 2.88Div (Gross) (sen) 10.7 6.1 6.2 7.5Div (Yield) (%) 3.1 1.8 1.8 2.2PER (x) 11.3 10.7 11.1 9.2P/NTA (x) 1.5 1.4 1.3 1.2
Balance Sheet (RMm)
FYE 31 Dec FY07 FY08 FY09Fixed Assets 288.9 340.3 357.9Current Assets 618.0 615.7 695.7Current Liabilities -291.0 -286.9 -322.7Others 0.0 0.0 0.0Total 615.9 669.1 730.9Share capital 250.0 250.0 250.0Reserves 308.3 361.9 418.3Shareholders’ Fund 558.3 611.9 668.3LT Liabilities 57.7 57.2 62.5Others 0.0 0.0 0.0Total 615.9 669.1 730.9Gross Debt 50.5 57.5 141.1Net Cash/ (Debt) 42.6 -0.4 -48.5
Cash Flow Statement (RMm)
FYE 31 Dec FY07 FY08 FY09Cash Flow from Ops 63.8 8.9 -49.3Cash Flow from Investing -88.8 -14.6 26.3Cash Flow from Financing -3.9 -28.6 58.3Net Increase in Cash -28.9 -34.3 35.3Cash at Beginning of Year 120.4 91.4 57.1Other Changes 0.0 0.0 0.2Cash at End of Year 91.4 57.1 92.6
Naim Holdings

37
INVESTMENT MERITS
A leader for surgical gloves Capacity expansion to 6bn pieces of gloves by 2012 A good product mix of OEM and OBM brands Well diversified geographical presence Buy with TP of RM5.37 based on PER of 15x FY11 earnings
COMPANY PROFILE
Adventa was listed in the Main Board of Bursa Malaysia in June 2004. Prior to its listing, the company started in 1988 in a small factory in Kuala Lumpur making examination gloves. Later, it relocated to Kota Bharu after taking over a glove company which manufactures surgical gloves. Today, its principal activities are in the manufacture of surgical and examination gloves.
KEY HIGHLIGHTS
Market leader for surgical gloves. Other than being the largest surgical glove manufacturer in Malaysia, Adventa is also the third largest in the world after Cardinal and Ansell. Surgical gloves fetch the highest selling prices and margins since they are the highest grade gloves in the industry due to the stringent quality required by pharmaceutical customers. We believe that the demand in this product segment will grow in tandem with the opening of more healthcare centers to cater for the growing global population.
Focus back on capacity expansion. Adventa’s total production capacity is currently close to 4bn pieces of gloves a year, which it expects to ramp up to more than 6bn pieces by 2012. Although the additional capacity will be undertaken across its entire range of gloves, the bulk of this expansion will be concentrated on nitrile glove production.
Balanced mix of OEM and OBM brands. Adventa not only manufactures gloves for established multinational OEM pharmaceutical companies but also makes gloves in its own brand names such as Maxitex, Sensiflex, Fusion, Nuzone and NuGard. The product mix between OEM and OBM gloves was about 46:54 as at 2009 and management does not expect a drastic change in the mix this year. Also, its gloves are mostly powder free natural rubber gloves, while only a small portion of synthetic gloves complements its product range.
Diversified geographical presence. The bulk of Adventa’s gloves is exported overseas to markets in Europe (39%), US (35%), Asia Pacific (15%), South America (6%) and Middle East (5%). Having such geographical diversity enables the company to capture new customers and also reduce its reliance on a particular region.
AdventaLeader in Surgical Gloves
Target : RM5.37Price : RM3.72
RUBBER GLOVES
Stock Profile/StatisticsBloomberg Ticker ADV MKIssued Share Capital (m) 149.3Market Capitalisation (RMm) 555.352 week H | L Price (RM) 4.35 | 0.84Average Volume (3m) ‘000 2276.2YTD Returns (%) 17.4Net gearing (x) 0.4Altman Z-Score 3.70ROCE/WACC 1.2Beta (x) 1.0Book Value/share (RM) 1.25
Major Shareholders (%)Low Chin Guan 48.3Wong Koon Mei 5.5
Share Performance (%)Month Absolute Relative1m 5.0 3.3 3m 5.0 2.0 6m 117.4 90.4 12m 335.8 195.8
6-month Share Price Performance
4.5
4.1
3.7
3.3
2.9
2.5
2.1
1.7Oct-09 Nov-09 Dec-09 Jan-10 Feb-10 Mar-10 Apr-10
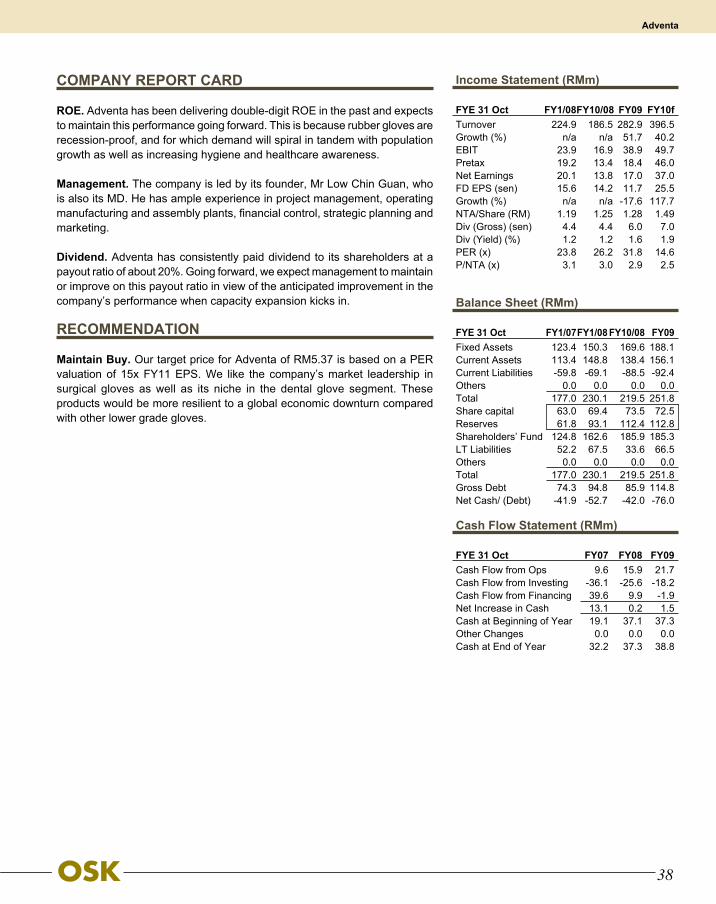
38
COMPANY REPORT CARD
ROE. Adventa has been delivering double-digit ROE in the past and expects to maintain this performance going forward. This is because rubber gloves are recession-proof, and for which demand will spiral in tandem with population growth as well as increasing hygiene and healthcare awareness.
Management. The company is led by its founder, Mr Low Chin Guan, who is also its MD. He has ample experience in project management, operating manufacturing and assembly plants, financial control, strategic planning and marketing.
Dividend. Adventa has consistently paid dividend to its shareholders at a payout ratio of about 20%. Going forward, we expect management to maintain or improve on this payout ratio in view of the anticipated improvement in the company’s performance when capacity expansion kicks in.
RECOMMENDATION
Maintain Buy. Our target price for Adventa of RM5.37 is based on a PER valuation of 15x FY11 EPS. We like the company’s market leadership in surgical gloves as well as its niche in the dental glove segment. These products would be more resilient to a global economic downturn compared with other lower grade gloves.
Income Statement (RMm)
FYE 31 Oct FY1/08 FY10/08 FY09 FY10fTurnover 224.9 186.5 282.9 396.5Growth (%) n/a n/a 51.7 40.2EBIT 23.9 16.9 38.9 49.7Pretax 19.2 13.4 18.4 46.0Net Earnings 20.1 13.8 17.0 37.0FD EPS (sen) 15.6 14.2 11.7 25.5Growth (%) n/a n/a -17.6 117.7NTA/Share (RM) 1.19 1.25 1.28 1.49Div (Gross) (sen) 4.4 4.4 6.0 7.0Div (Yield) (%) 1.2 1.2 1.6 1.9PER (x) 23.8 26.2 31.8 14.6P/NTA (x) 3.1 3.0 2.9 2.5
Balance Sheet (RMm)
FYE 31 Oct FY1/07 FY1/08 FY10/08 FY09Fixed Assets 123.4 150.3 169.6 188.1Current Assets 113.4 148.8 138.4 156.1Current Liabilities -59.8 -69.1 -88.5 -92.4Others 0.0 0.0 0.0 0.0Total 177.0 230.1 219.5 251.8Share capital 63.0 69.4 73.5 72.5Reserves 61.8 93.1 112.4 112.8Shareholders’ Fund 124.8 162.6 185.9 185.3LT Liabilities 52.2 67.5 33.6 66.5Others 0.0 0.0 0.0 0.0Total 177.0 230.1 219.5 251.8Gross Debt 74.3 94.8 85.9 114.8Net Cash/ (Debt) -41.9 -52.7 -42.0 -76.0
Cash Flow Statement (RMm)
FYE 31 Oct FY07 FY08 FY09Cash Flow from Ops 9.6 15.9 21.7Cash Flow from Investing -36.1 -25.6 -18.2Cash Flow from Financing 39.6 9.9 -1.9Net Increase in Cash 13.1 0.2 1.5Cash at Beginning of Year 19.1 37.1 37.3Other Changes 0.0 0.0 0.0Cash at End of Year 32.2 37.3 38.8
Adventa

39
INVESTMENT MERITS
Attractive easy repayment scheme for small ticket items Benefit from synergy with JUSCO stores Expanding its merchant network for easy payment Personal financing still an untapped market High PBT margin Low levels of non-performing loans BUY with a TP of RM4.95 based on a PER of 8.5x FY11 earnings
COMPANY PROFILE
Incorporated on 6 Dec 1996, AEON Credit is a subsidiary of AEON Credit Japan, which is part of AEON Japan Group. AEON Japan Group is a global retail and financial services group which operates in Japan, South-East Asia, China and North America with more than 150 subsidiaries. AEON Credit Japan, listed on the First Section of the Tokyo Stock Exchange, is one of Japan’s biggest credit card issuers and a leading consumer credit provider.
KEY HIGHLIGHTS
Attractive easy repayment for small ticket items. Under this scheme where no collateral is required and there is 0% down-payment for motorcycles, clients make minimal monthly repayments to finance household/consumer products. On average, the monthly instalments for consumer durables and motorcycle financing may range from RM80 to RM150 per month. Since the monthly payments are for small-ticket items and are stretched over a period of time, the company’s clients usually have no problems repaying.
Deriving synergy from JUSCO department stores. In collaboration with AEON Co. (M) Bhd, better known for its JUSCO department stores, the group recently launched the NEW AEON credit card which combines the JUSCO credit card (issued by AEON Credit) and J Card (issued by AEON Co) as a “2-in 1” card. The NEW AEON Credit Card gives cardholders exclusive offers from JUSCO stores nationwide, thus providing more convenience and payment flexibility.
Expanding its merchant network for easy payment. The company’s more than 5,300 merchant outlets nationwide is expected to increase to over 6,000 to cater to a wider range of customers in the smaller towns and cities.
Personal financing an untapped market. Although companies such as RCE Capital, Singer and Courts Mammoth also offer personal financing schemes, we believe it is still a relatively untapped market as there are only a few market players catering to consumers earning an annual income of RM10,000 or more.
AEON Credit In Step With Changing Lifestyles
Target : RM4.95Price : RM4.12
FINANCIAL SERVICES
Stock Profile/StatisticsBloomberg Ticker ACSM MKIssued Share Capital (m) 120.0Market Capitalisation (RMm) 494.452 week H | L Price (RM) 4.40 | 2.49Average Volume (3m) ‘000 61.9YTD Returns (%) 5.6Net gearing (x) 2.9Altman Z-Score -ROCE/WACC 0.9Beta (x) 0.8Book Value/share (RM) 1.80
Major Shareholders (%)AEON Credit Service Co Ltd 59.7LTAT 5.1Pacific Mutual Fund 1.2
Share Performance (%)Month Absolute Relative1m 1.0 2.3 3m -0.8 0.1 6m -4.1 -8.3 12m 63.9 13.2
6-month Share Price Performance
4.5
4.4
4.3
4.2
4.1
4.0
3.9
3.8Oct-09 Nov-09 Dec-09 Jan-10 Feb-10 Mar-10 Apr-10

40
Opening more marketing offices. In striving to give better customer service, the group recently opened 6 new marketing offices nationwide to enhance customer satisfaction. It is envisaged that this would help retain existing customers and get new customers to turn to AEON Credit for micro-financing purposes.
High PBT margin. In the past 2 years, the group has been consistently registering relatively high profit before tax margin of 23% to 35% owing to its relatively high net interest margin of above 19%.
Low NPLs. Having been in consumer financing for more than 13 years in Malaysia, AEON Credit prides itself for its good monitoring controls comprising credit card assessment modules and a good credit management system. Due to the Group’s prudent lending policy and effective credit management, it has managed to keep non-performing loans at around 2%.
COMPANY REPORT CARD
ROE. AEON Credit has been consistently delivering double digit ROE of above 18%. This trend is expected to continue as net profit is expected to increase on its growing customer base.
Management. Effective 20 April 2010, Mr. Yusuhiro Kasai will replace Mr. Naruhito Kuroda as Managing Director. Mr. Kuroda will move to a new assignment in Tokyo, Japan. Mr. Kasai has been in AEON Credit Service (M) Bhd since 1997 and has held various senior management positions before being promoted to Head of Operating Managing Division. He is well-versed with the company’s operations and is capable of taking AEON Credit to greater heights.
Dividend. As part of the group’s endeavour to reward shareholders, the group has maintained a high net dividend payout ratio. Going forward, its net dividend payout for FY11 is expected to improve to 37%.
RECOMMENDATION
Given its solid track record, a sound management team, a low non-performing loans ratio, a growing customer base and attractive dividends, we are initiating coverage on AEON Credit with a BUY recommendation. Since the Government announced a service tax on credit cards on 23 Oct 2009, the stock’s performance had been lackluster. Although its credit card services contributed about 11% of total operating income since the AEON Credit Card was launched in 2005, it has never been profitable at the bottom line level. AEON Credit has been striving to break even since then and the losses incurred have been on the decline. As the credit card business is still struggling, we believe concerns over AEON Credit’s share price performance have been overdone. Applying a historical 2-year PE band of 8.5x over FY11 EPS, we derive a target price of RM4.95.
Income Statement (RMm)
FYE 20 Feb FY08 FY09 FY10f FY11fTurnover 151.8 186.9 209.3 292.8Growth (%) 30.8 23.1 12.0 39.9EBIT 68.9 92.3 101.5 137.5Pretax 45.8 65.9 71.4 93.1Net Earnings 33.4 48.8 53.3 69.8FD EPS (sen) 27.8 40.6 44.4 58.2Growth (%) 38.4 46.0 9.3 31.1NTA/Share (RM) 1.51 1.80 1.97 2.55Div (Gross) (sen) 12.8 20.1 22.5 29.5Div (Yield) (%) 3.1 4.9 5.5 7.2PER (x) 14.8 10.1 9.3 7.1P/NTA (x) 2.7 2.3 2.1 1.6
Balance Sheet (RMm)
FYE 20 Feb FY07 FY08 FY09Fixed Assets 192.9 278.8 349.9Current Assets 378.6 452.5 560.2Current Liabilities -196.9 -235.8 -333.4Others 0 0 0Total 374.6 495.5 576.8Share capital 49.0 60.0 60.0Reserves 55.2 121.6 155.8Shareholders’ Fund 104.2 181.6 215.8LT Liabilities 270.4 313.9 360.9Others 0.0 0.0 0.0Total 374.6 495.5 576.8Gross Debt 422.8 499.6 634.8Net Cash/ (Debt) -420.7 -497.2 -632.3
Cash Flow Statement (RMm)
FYE 20 Feb FY07 FY08 FY09Cash Flow from Ops -180.8 -112.3 -106.5Cash Flow from Investing -14.3 -8.2 -14.2Cash Flow from Financing 196.5 120.6 121.0Net Increase in Cash 1.5 0.1 0.3Cash at Beginning of Year 0.6 2.1 2.2Other Changes 0.0 0.0 0.0Cash at End of Year 2.1 2.2 2.5
AEON Credit
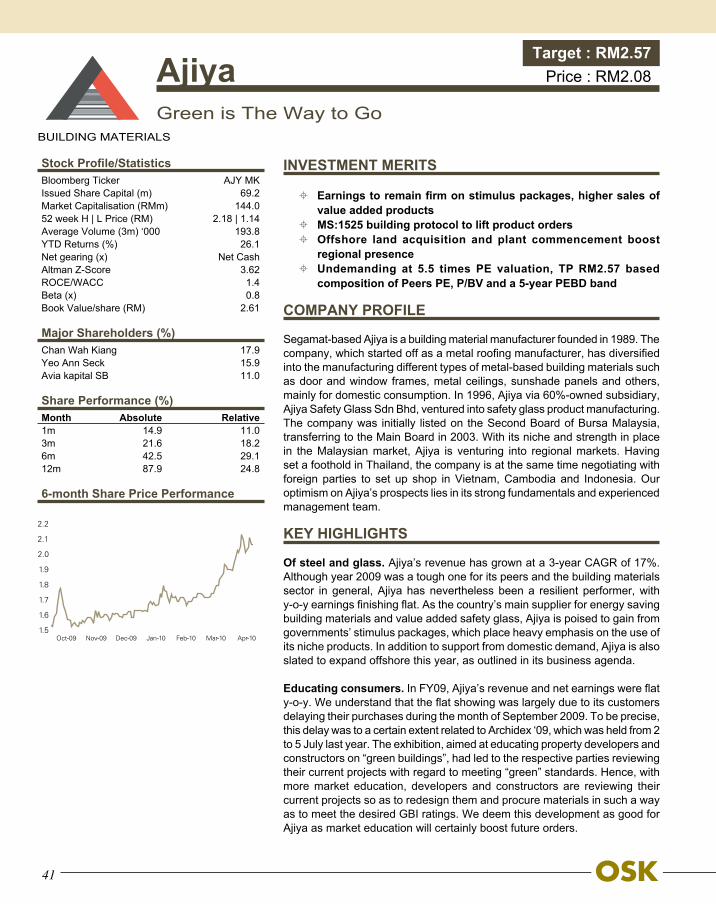
41
INVESTMENT MERITS
Earnings to remain firm on stimulus packages, higher sales of value added products
MS:1525 building protocol to lift product orders Offshore land acquisition and plant commencement boost
regional presence Undemanding at 5.5 times PE valuation, TP RM2.57 based
composition of Peers PE, P/BV and a 5-year PEBD band
COMPANY PROFILE
Segamat-based Ajiya is a building material manufacturer founded in 1989. The company, which started off as a metal roofing manufacturer, has diversified into the manufacturing different types of metal-based building materials such as door and window frames, metal ceilings, sunshade panels and others, mainly for domestic consumption. In 1996, Ajiya via 60%-owned subsidiary, Ajiya Safety Glass Sdn Bhd, ventured into safety glass product manufacturing. The company was initially listed on the Second Board of Bursa Malaysia, transferring to the Main Board in 2003. With its niche and strength in place in the Malaysian market, Ajiya is venturing into regional markets. Having set a foothold in Thailand, the company is at the same time negotiating with foreign parties to set up shop in Vietnam, Cambodia and Indonesia. Our optimism on Ajiya’s prospects lies in its strong fundamentals and experienced management team.
KEY HIGHLIGHTS
Of steel and glass. Ajiya’s revenue has grown at a 3-year CAGR of 17%. Although year 2009 was a tough one for its peers and the building materials sector in general, Ajiya has nevertheless been a resilient performer, with y-o-y earnings finishing flat. As the country’s main supplier for energy saving building materials and value added safety glass, Ajiya is poised to gain from governments’ stimulus packages, which place heavy emphasis on the use of its niche products. In addition to support from domestic demand, Ajiya is also slated to expand offshore this year, as outlined in its business agenda.
Educating consumers. In FY09, Ajiya’s revenue and net earnings were flat y-o-y. We understand that the flat showing was largely due to its customers delaying their purchases during the month of September 2009. To be precise, this delay was to a certain extent related to Archidex ‘09, which was held from 2 to 5 July last year. The exhibition, aimed at educating property developers and constructors on “green buildings”, had led to the respective parties reviewing their current projects with regard to meeting “green” standards. Hence, with more market education, developers and constructors are reviewing their current projects so as to redesign them and procure materials in such a way as to meet the desired GBI ratings. We deem this development as good for Ajiya as market education will certainly boost future orders.
AjiyaGreen is The Way to Go
Target : RM2.57Price : RM2.08
BUILDING MATERIALS
Stock Profile/StatisticsBloomberg Ticker AJY MKIssued Share Capital (m) 69.2Market Capitalisation (RMm) 144.052 week H | L Price (RM) 2.18 | 1.14Average Volume (3m) ‘000 193.8YTD Returns (%) 26.1Net gearing (x) Net CashAltman Z-Score 3.62ROCE/WACC 1.4Beta (x) 0.8Book Value/share (RM) 2.61
Major Shareholders (%)Chan Wah Kiang 17.9Yeo Ann Seck 15.9Avia kapital SB 11.0
Share Performance (%)Month Absolute Relative1m 14.9 11.0 3m 21.6 18.2 6m 42.5 29.1 12m 87.9 24.8
6-month Share Price Performance
2.2
2.1
2.0
1.9
1.8
1.7
1.6
1.5Oct-09 Nov-09 Dec-09 Jan-10 Feb-10 Mar-10 Apr-10

42
Margins stay lucrative.Although the building material segment is competitive, Ajiya’s continuous efforts to expand its product range have held its earnings firmly, even in troubled times. By expanding its value added product types, particularly its safety glass division, the group has kept operating margins strong, with net profit coming in at 7% in FY09. We expect sales of Ajiya’s value added products to improve in the following quarters, which will push up net margin to 7.6% for FY10.
MS:1525 in place. We think the key catalyst driving Ajiya’s earnings is its MS:1525 building protocol. Malaysian Standard MS:1525 “Code of Practice on Energy Efficiency and Renewable Energy for Non-Residential Buildings” is a construction protocol which stipulates that non-residential buildings must be constructed in such a way that they consume as much as 10% less energy. Ajiya is the sole supplier of energy-saving building materials for buildings that adhere to the protocol, which applies to all new Government offices which are part of the previous and current Malaysia Plan.
COMPANY REPORT CARD
ROE. We expect Ajiya’s earnings to grow marginally, and its ROE to be in the low teens.
Management. Ajiya’s management team has more than 20 years’ experience in the building materials sectors. We reckon its team of management shall propel its growth while weathering through tough times with ease.
Dividend. Ajiya has been paying dividends amounting to 6 sen per share since 2005. Management is committed to ensuring stable payments and depending on future profits, may increase its benchmark payments.
RECOMMENDATION
Based on a combination of Peer PE, Peer P/BV and 5-years PEBD band, we derive a target price of RM2.57 for Ajiya. Our TP includes a 10% discount to factor in the stock’s illiquid nature. We re-iterate our BUY recommendation.
Income Statement (RMm)
FYE 30 Nov FY07 FY08 FY09 FY10fTurnover 274.5 318.6 313.1 348.4Growth (%) 40.2 16.1 -1.7 11.3EBIT 28.7 37.0 36.8 41.4Pretax 29.2 37.5 37.3 42.0Net Earnings 17.4 22.4 22.0 26.4FD EPS (sen) 25.2 32.3 31.8 38.1Growth (%) 45.3 28.2 -1.4 19.6NTA/Share (RM) 2.07 2.35 2.62 2.96Div (Gross) (sen) 6.0 6.0 6.0 6.0Div (Yield) (%) 2.9 2.9 2.9 2.9PER (x) 8.3 6.4 6.5 5.5P/NTA (x) 1.0 0.9 0.8 0.7
Balance Sheet (RMm)
FYE 30 Nov FY07 FY08 FY09Fixed Assets 76.6 94.9 110.5Current Assets 146.7 171.8 176.3Current Liabilities -44.4 -61.2 -55.8Others 0.0 0.0 0.0Total 178.9 205.5 231.0Share capital 69.2 69.2 69.2Reserves 74.1 93.2 112.1Shareholders’ Fund 143.3 162.4 181.4LT Liabilities 9.1 7.3 5.2Others 26.6 35.8 44.5Total 178.9 205.5 231.0Gross Debt 14.6 20.1 15.6Net Cash/ (Debt) 5.9 8.8 21.7
Cash Flow Statement (RMm)
FYE 30 Nov FY07 FY08 FY09Cash Flow from Ops 13.7 30.7 38.2Cash Flow from Investing -10.2 -24.8 -21.2Cash Flow from Financing 4.0 2.8 -8.6Net Increase in Cash 7.6 8.7 8.4Cash at Beginning of Year 12.5 20.1 28.8Other Changes 0.0 0.0 0.0Cash at End of Year 20.1 28.8 37.2
Ajiya

43
INVESTMENT MERITS
A proactive management which seeks to enhance earnings growth
A list of yield-accretive properties identified to be acquired Improved valuation opens door to acquire more yield-accretive
assets Downside risks well-mitigated for the short term Still trading at attractive dividend yield of 8.1%
COMPANY PROFILE
Axis Real Estate Investment Trust (Axis REIT), listed on 3 Aug, 2005, was the first REIT to list on Bursa Malaysia. Axis REIT owns a diversified portfolio of properties in the Klang Valley, Johor and Kedah comprising commercial offices, office/industrial buildings, warehouses and logistics centres. These properties house many multinational companies who have been tenants of the Axis Group for many years. They are in the food & beverage, education, medical, home appliances, automotive, pharmaceutical, insurance, and fitness industries. Starting with only 5 properties, the trust has been aggressively acquiring quality and yield-accretive assets and now holds a total of 21 properties in its portfolio. On 11 Dec, 2009, Axis REIT became the world’s first Islamic office/industrial REIT, which would give the trust the opportunity to tap interest from domestic and Middle Eastern Shariah-based funds.
KEY HIGHLIGHTS
A growth story. Axis is a growth story given its proactive and market-savvy management team. Going forward, the following catalysts will continue to underpin the trust’s ability of furthering its growth plans:
• Somewhat accommodative valuation. Axis’ valuations have improved substantially from the March 2009 lows. With yield having improved substantially to an estimated 8.1% currently (from 12-13% at the height of the global financial crisis in early 2009), this gives it more viable opportunities to acquire yield-accretive properties via equity funding;
• More acquisitions in the pipeline. Axis has identified 4 properties from 3rd parties as potential acquisition targets, collectively valued at about RM180m. These are the two units of brand new logistic warehouses in Johor (each with long lease agreements and step-ups), a factory/warehouse in Penang, and an office building in Cyberjaya. In addition, Axis has 4 more properties from the private equity side worth about RM200m, all of which are located in the Klang Valley and are mainly office/warehouse properties; and
Axis REITGood Yield, Savvy Management
Target : RM1.91Price : RM2.00
REIT ESTATE INVESTMENT TRUST
Stock Profile/StatisticsBloomberg Ticker AXRB MKIssued Share Capital (m) 307.1Market Capitalisation (RMm) 614.252 week H | L Price (RM) 2.07 | 1.34Average Volume (3m) ‘000 280.5YTD Returns (%) 3.6Net gearing (x) 0.5Altman Z-Score n.a.ROCE/WACC 0.6Beta (x) 0.7Book Value/share (RM) 1.79
Major Shareholders (%)Baiduri Kemas Sdn Bhd 11.0Tew Peng Hwee 5.1Alex Lee Lao 4.1
Share Performance (%)Month Absolute Relative1m 1.0 -2.9 3m 5.8 -1.5 6m 11.5 -0.4 12m 61.7 -0.2
6-month Share Price Performance
2.2
2.1
2.0
1.9
1.8
1.7Oct-09 Nov-09 Dec-09 Jan-10 Feb-10 Mar-10 Apr-10

44
• Organic growth. The management is also proactive in enhancing the trust’s current existing properties to maintain their market relevance and competitiveness. Currently, one of such properties is Nestle House (renamed ‘Quattro West), which has undergone a major refurbishment since Nestle, which occupied 100% of the building, moved out in late 2009. To date, a new anchor tenant has been found for 50% of Quattro West at substantially higher rental rates (approximately +30%) vs prior to the refurbishment. Another major upgrade is also currently being undertaken at Crystal Plaza (PJ).
Downside risks largely mitigated for the short-term. The apparent risks faced by the trust include rising competition in the PJ office space and the uncertainty over sustainability of the global economic recovery. However, we believe such downside risk, if any, has been largely mitigated at least for the short-term, based on:
• Competitive rentals and well-distributed tenancy expiry dates. Rental rates for the trust’s properties are relatively more competitive vis-à-vis the asking rates of many new office buildings that are coming up in PJ. Its tenancy expiry dates are also well-distributed with 25% of rental income due for lease expiry in 2010, 16% in 2011 and 9% in 2012. This is mainly due to the fact that as the trust diversifies more into industrial/warehousing properties, more of the lease agreements now comprise long-term leases; and
• More diversification into other sub-segments other than PJ office. The management has perhaps understood the long-term risk of fast rising competition in the PJ office space market. This can be seen in some of its most recent new property acquisitions as well as those in the pipeline which primarily comprise industrial/warehouse properties.
Wary of mid-to-long term risks. Although measures are in place to counter competition in the PJ office market, we are unsure whether they measures will be sufficient/effective to withstand another tide of office space supply in PJ commencing early next decade. As PJ office properties still contribute significantly to Axis’ annual topline income, estimated at 32% in CY09 (annualised), it is inevitable that the trust will feel competitive pressure in a few years’ time.
COMPANY REPORT CARD
ROE. ROE is expected to be 8.9% and 9.3% in FY10 and FY11 respectively.
Management. The team comprises of people who are independent, professional and experienced in the real estate industry. In addition, since the directors/managers of the trust are also the main sponsors, there is greater incentive to expand its earnings base through yield-accretive acquisitions, value enhancement and efficient capital management. The team has proven to be astute in managing risks, spotting trends and acquiring quality properties.
Dividend. Dividend yield is still attractive at 8.1%, in line with the sector average of 8.4%.
RECOMMENDATION
Our target price is derived from pegging Axis’ FY10 dividend against M-REIT’s forecast average dividend yield of 8.4%. As total expected return (dividend yield + upside potential to unit price) is <10%, we maintain our Neutral call on Axis. A prime catalyst for upgrade is another positive re-rating on M-REITs.
Income Statement (RMm)
FYE 31 Dec FY07 FY08 FY09 FY10fTurnover 46.8 63.3 71.9 83.8Growth (%) 14.4 35.3 13.5 16.6EBIT 34.0 47.5 54.1 62.3Pretax 68.6 63.4 62.0 49.8Net Earnings 68.6 63.4 62.0 49.8FD EPS (sen) 33.3 24.8 20.2 16.2Growth (%) 59.8 -25.6 -18.6 -19.7NTA/Share (RM) 1.63 1.75 1.82 1.82Div (Gross) (sen) 13.6 15.3 15.8 16.3Div (Yield) (%) 6.8 7.6 7.9 8.1PER (x) 6.0 8.1 9.9 12.3P/NTA (x) 1.2 1.1 1.1 1.1
Balance Sheet (RMm)
FYE 31 Dec FY06 FY07 FY08 FY09Fixed Assets 408.3 570.4 723.1 893.1Current Assets 3.5 11.5 3.3 22.8Current Liabilities -108.3 -233.7 -258.8 -193.5Others 0.0 0.0 0.0 0.0Total 303.5 348.2 467.5 722.4Share capital 205.9 205.9 255.9 307.1Reserves 88.2 128.8 191.9 251.4Shareholders’ Fund 294.1 334.7 447.8 558.5LT Liabilities 9.4 13.5 19.7 163.9Others 0.0 0.0 0.0 0.0Total 303.5 348.2 467.5 722.4Gross Debt 88.1 209.8 230.5 308.9Net Cash/ (Debt) -88.0 -200.5 -229.2 -293.1
Cash Flow Statement (RMm)
FYE 31 Dec FY07 FY08 FY09Cash Flow from Ops 32.3 61.2 54.2Cash Flow from Investing -122.1 -127.8 -142.5Cash Flow from Financing 103.1 71.0 134.1Net Increase in Cash 13.3 4.3 45.9Cash at Beginning of Year -48.0 -34.7 -30.4Other Changes 0.0 0.0 0.0Cash at End of Year -34.7 -30.4 15.5
Axis REIT

45
INVESTMENT MERITS
Its CEO named Entrepreneur of the Year (Silver Award) by MCBC Among Deloitte Touche Tohmatsu’s Top 500 Technology
companies in Asia-Pacific A RM20m in orderbook as at February 2010 FY10 backed by profit guarantee Trading at about 5x FY10 PER
COMPANY PROFILE
CBS Technology (CBS Tech), founded in 2001, has core businesses in RFID, e-security and enterprise management solutions. In April 2004, CBS Tech was listed on Bursa Malaysia’s MESDAQ, as business gained ground with its proprietary RFID solution, SolmateTM, and its e-security software, PaymateTM. The company owns IP rights to SolmateTM and PaymateTM Suites. It recently completed the acquisition of Infodata Media SB (IMSB), which owns Super Pages and Malaysia’s No.1 B2B Biz Trade Portal.
KEY HIGHLIGHTS
Stable revenue and earnings trend.CBS Tech’s revenue and net profit have grown steadily every year from FY02 to FY07. In FY08, despite posting revenue growth, earnings fell for the first time since FY02 on lower gross margins, lower other income and higher depreciation, and ESOS expenses incurred in line with FRS2. However, in FY09, CBS Tech achieved record revenue and earnings in FY09 despite the global recession. Apart from the recovery in the company’s traditional software business, its recent acquisition of Infodata Media (IMSB) and IMSB’s wholly-owned subsidiary, Super Pages Media (SPMSB), also boosted its FY09 performance. Revenue and earnings for its software business surged 50% and 10.5% respectively in FY09.
IMSB operates Malaysia’s leading B2B Biz trade portal.IMSB operates Malaysia’s leading B2B Business Trade Portal, www.aseansources.com, which is a Global B2B e-Marketplace & Trade Lead for suppliers, manufacturers, exporters and importers. www.aseansources.com also provides database as a Malaysian B2B search engine. On the other hand, IMSB’s only and sole subsidiary, Super Pages Media SB (SPMSB), has more than 20 years’ experience in the publication and advertising industry. SPMSB publishes business directory journals and operates online directories at www.superpages.com.my, which provides trade information for B2B transactions. IMSB is an MSC status company.
CBS TechnologyEmerging Stronger From the Recession
Target : RM0.48Price : RM0.37
TECHNOLOGY
Stock Profile/StatisticsBloomberg Ticker CBS MKIssued Share Capital (m) 151.8Market Capitalisation (RMm) 41.852 week H | L Price (RM) 0.567 | 0.25Average Volume (3m) ‘000 36.8YTD Returns (%) -21.4Net gearing (x) Net CashAltman Z-Score 3.82ROCE/WACC 1.4Beta (x) 1.1Book Value/share (RM) 0.19
Major Shareholders (%)Sun Chee Kong 12.3Tan Tian Sin 6.5Tan Ying Ying 4.3
Share Performance (%)Month Absolute Relative1m -8.3 -5.4 3m -11.3 -14.4 6m -31.3 -15.3 12m -39.8 -10.0
6-month Share Price Performance
0.5
0.4
0.3Oct-09 Nov-09 Dec-09 Jan-10 Feb-10 Mar-10 Apr-10

46
Expansion into Supply Chain Managament Solutions. The acquisition of IMSB will enable CBS Tech to introduce the company’s technology and solutions into the business of IMSB. The key reason for the acquisition is to enable CBS Tech to expand its suite of supply chain management solutions to build a supply chain community in Malaysia and make it more agile and appealing to its customers. The company plans to offer such solutions through the Software as a Service (Saas) business model and through the development of business hub platforms. Although Super Pages is currently an online business directory, CBS Tech will value add to the business directory by bundling new services such as on-line transactions, demand management, sourcing of suppliers, inventory management, logistic, customer services, and so on.
High free cash flow. As CBS Tech’s software business requires low capex and generates strong free cash flow, as at 31 Dec 2009 - even after the completion of the RM29m acquisition - CBS Tech had RM4m in net cash. Due to the company’s high free cash flow business model, its net cash is expected to increase steadily going forward.
FY10 backed by profit guarantee. An estimated RM4m profit guarantee from IMSB was recognised in FY09, and we expect the remaining RM5.5m profit guarantee to be recognized in FY10. This means that 43% of our FY10 earnings forecast has been secured by the profit guarantee. In the event of a shortfall or deficiency in the profit guarantee, IMSB’s vendor and managing director would have to jointly pay CBS Tech the shortfall. Mr. Tan Tian Sin, the vendor of IMSB, has bought 6.5% equity interest in CBS Tech from the open market, thereby becoming its second largest shareholder.
COMPANY REPORT CARD
ROE. Despite having close to zero or no borrowings over the years, CBS has been able to generate an ROE of at least 19% since its IPO in 2004 and is expected to record 22.8% ROE this year. Its high free cash flow business model has enabled the company to achieve commendable ROE.
Management. Mr. Sun Chee Kong, CEO of CBS Tech, was awarded the Silver Award of Entrepreneur of the Year presented by Malaysia Canada Business Council at the 4th MCBC Business Excellence Awards 2006. CBS Tech is spearheaded by Mr. Sun and a team of technical specialists from diverse technology backgrounds.
Dividend. In FY07, the company declared a first-ever dividend of 9 sen tax-exempt and 1.35 sen less 26% tax, which is equivalent to 103.5% of the company’s 10 sen par value. The company paid close to RM10m cash to its shareholders after having retained all its profits for many years. As CBS Tech is a growing technology company, the board currently does not intend to declare a dividend for FY10 or even FY11.
RECOMMENDATION
Buy. We like the company’s long-term prospects given the following reasons:- (i) strong free cash flow generating generation; (iii) in a net cash position and no borrowings; (iv) acquisition of IMSB to expand business opportunities; (vi) pays little income tax as its wholly owned subsidiary is an MSC status company; (vii) has a strong business track record, with revenue increasing since FY02 while earnings rose from FY02 to FY07, before its winning stretch was interrupted in FY08, and resumed growth in FY09; and (viii) net profit margin has consistently stayed above 20% since FY03. We are maintaining our fair value because CBS Tech is currently trading at about 5x FY10 PER, which is even below its 6-year average PER.
Income Statement (RMm)
FYE 31 Dec FY07 FY08 FY09 FY10fTurnover 20.9 23.0 44.3 65.0 Growth (%) 31.2 10.5 92.1 46.8 EBIT 6.3 6.2 11.3 14.3 Pretax 6.9 6.6 11.7 14.8 Net Earnings 6.4 5.7 11.0 12.8 EPS (sen) 4.2 3.7 6.9 8.0 Growth (%) 25.4 -11.6 83.9 16.6 NTA/Share (RM) 0.15 0.19 0.08 0.17 Gross Div (sen) 0.0 0.0 0.0 0.0 Div Yield (%) 0.0 0.0 0.0 0.0 PER (x) 13.1 9.9 5.4 4.6P/NTA (x) 3.6 1.9 4.5 2.2
Balance Sheet (RMm)
FYE 31 Dec FY07 FY08 FY09Fixed Assets 5.0 11.3 39.6 Current Assets 45.2 31.4 22.3 Current Liabilities -24.9 -11.7 -18.4Others 0.0 0.0 0.0 Total 25.3 31.0 43.6 Share Capital 10.1 15.2 15.7 Reserves 15.1 15.8 27.6 Shareholder Fund 25.2 31.0 43.2LT Liabilities 0.0 0.0 0.1Others 0.1 0.0 0.0Total 25.3 31.0 43.6Gross Debt 0.0 0.0 1.5Net Cash/ (Debt) 39.3 19.5 3.9
Cash Flow Statement (RMm)
FYE 31 Dec FY07 FY08 FY09Cash Flow from Ops 13.6 -12.6 13.1Cash Flow from Investing -13.0 13.1 -26.3Cash Flow from Financing 0.7 0.0 1.2Net Increase in Cash 1.3 0.5 -12.0Cash at Beginning of Year 1.4 2.7 16.0Other Changes 0.0 0.0 0.0Cash at end of Year 2.7 3.2 4.0
CBS Technology
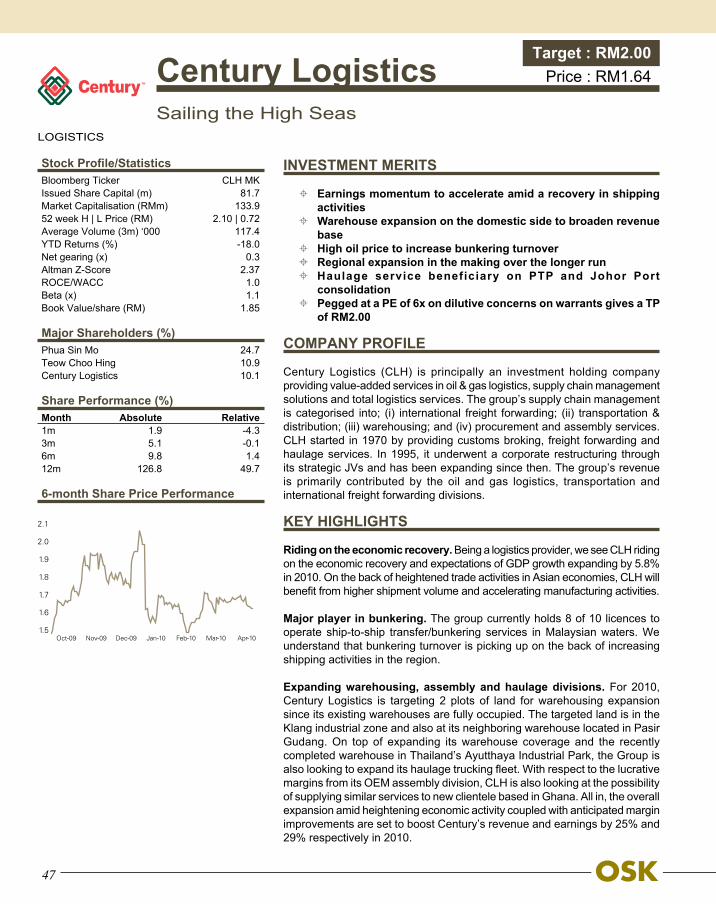
47
INVESTMENT MERITS
Earnings momentum to accelerate amid a recovery in shipping activities
Warehouse expansion on the domestic side to broaden revenue base
High oil price to increase bunkering turnover Regional expansion in the making over the longer run Haulage service beneficiary on PTP and Johor Port
consolidation Pegged at a PE of 6x on dilutive concerns on warrants gives a TP
of RM2.00
COMPANY PROFILE
Century Logistics (CLH) is principally an investment holding company providing value-added services in oil & gas logistics, supply chain management solutions and total logistics services. The group’s supply chain management is categorised into; (i) international freight forwarding; (ii) transportation & distribution; (iii) warehousing; and (iv) procurement and assembly services. CLH started in 1970 by providing customs broking, freight forwarding and haulage services. In 1995, it underwent a corporate restructuring through its strategic JVs and has been expanding since then. The group’s revenue is primarily contributed by the oil and gas logistics, transportation and international freight forwarding divisions.
KEY HIGHLIGHTS
Riding on the economic recovery. Being a logistics provider, we see CLH riding on the economic recovery and expectations of GDP growth expanding by 5.8% in 2010. On the back of heightened trade activities in Asian economies, CLH will benefit from higher shipment volume and accelerating manufacturing activities.
Major player in bunkering. The group currently holds 8 of 10 licences to operate ship-to-ship transfer/bunkering services in Malaysian waters. We understand that bunkering turnover is picking up on the back of increasing shipping activities in the region.
Expanding warehousing, assembly and haulage divisions. For 2010, Century Logistics is targeting 2 plots of land for warehousing expansion since its existing warehouses are fully occupied. The targeted land is in the Klang industrial zone and also at its neighboring warehouse located in Pasir Gudang. On top of expanding its warehouse coverage and the recently completed warehouse in Thailand’s Ayutthaya Industrial Park, the Group is also looking to expand its haulage trucking fleet. With respect to the lucrative margins from its OEM assembly division, CLH is also looking at the possibility of supplying similar services to new clientele based in Ghana. All in, the overall expansion amid heightening economic activity coupled with anticipated margin improvements are set to boost Century’s revenue and earnings by 25% and 29% respectively in 2010.
Century LogisticsSailing the High Seas
Target : RM2.00Price : RM1.64
LOGISTICS
Stock Profile/StatisticsBloomberg Ticker CLH MKIssued Share Capital (m) 81.7Market Capitalisation (RMm) 133.952 week H | L Price (RM) 2.10 | 0.72Average Volume (3m) ‘000 117.4YTD Returns (%) -18.0Net gearing (x) 0.3Altman Z-Score 2.37ROCE/WACC 1.0Beta (x) 1.1Book Value/share (RM) 1.85
Major Shareholders (%)Phua Sin Mo 24.7Teow Choo Hing 10.9Century Logistics 10.1
Share Performance (%)Month Absolute Relative1m 1.9 -4.3 3m 5.1 -0.1 6m 9.8 1.4 12m 126.8 49.7
6-month Share Price Performance
2.1
2.0
1.9
1.8
1.7
1.6
1.5Oct-09 Nov-09 Dec-09 Jan-10 Feb-10 Mar-10 Apr-10

48
Long term beneficiary from the consolidation of Johor Port to PTP. Being a major haulage provider in PTP, CLH stands to gain in the long term as a haulage provider in the event Johor Port’s container handling operation shifts to PTP.
Capex needs. CLH’s net gearing has risen from 15.4% to 31.1% in FY09 on capex for the construction of its new warehouse in Thailand. However, we are not overly concerned as we anticipate the pick-up in overall economic activity to bolster its revenue stream, which would effectively improve its cash flow. As there are more capex allocations in the pipeline given the addition of 2 new warehouses for FY10, we only expect CLH’s net gearing to ease from FY11 onwards.
Acquisition in the cards? It is understood that CLH is looking into diversifying its business by acquiring a company with air and freight operations in the region as part of its growth plan over the longer term. Since these are still at the early stage, we are not including any incremental earnings in our forecast at this juncture.
COMPANY REPORT CARD
ROE. CLH’s ROE has been in the double digit range since FY07 given the success of its venture into the bunkering business. With the positive earnings momentum in 2010, during which we anticipate a strong 28.7% growth, we see ROE continuing to scale up. We expect CLH to achieve an ROE of 15.4% in FY10, higher from the 13.5% registered in FY09.
Management. With founder Mr. Phua Sin Mo as chairman, Mr. Steven Teow as Managing Director, and his deputy Dr. Mohamed Amin, CLH boasts of a solid management with vast experience in the logistics services industry. Mr. Phua and Mr. Teow have 38 years and 17 years of experience respectively. Dr. Mohamed Amin, who is Chartered Transport Institute-qualified and a co-writer for the logistics chapter in the Malaysian Industrial Master Plan 3, has 22 years’ industry experience.
Dividend. We expect CLH to maintain its dividend payout at 20%-25% over the next 3 years in view of its high net gearing. At the current price, this translates into a single tier dividend yield of 4.9%.
RECOMMENDATION
Our TP is premised on 6x PER versus the industry average mid-cycle valuation of 7x. We have pegged the stock at a lower PE owing to the existence of its warrants, which create a dilutive impact although this is currently minimal. Pegging 6x PE to its FY10 EPS, we derive a TP of RM2.00 with a BUY recommendation. This price gives an upside of 22%.
Income Statement (RMm)
FYE 31 Dec FY07 FY08 FY09 FY10fTurnover 163.0 163.9 210.9 263.6Growth (%) 30.9 0.5 28.7 25.0EBIT 29.7 19.8 28.5 36.8Pretax 24.6 19.1 24.8 32.3Net Earnings 20.8 12.1 20.9 26.9FD EPS (sen) 25.5 14.8 25.6 33.0Growth (%) 306.1 -41.8 72.5 28.7NTA/Share (RM) 1.05 1.32 1.49 1.70Div (Gross) (sen) 10.0 5.0 6.0 8.0Div (Yield) (%) 6.1 3.0 3.7 4.9PER (x) 6.4 11.1 6.4 5.0P/NTA (x) 1.6 1.2 1.1 1.0
Balance Sheet (RMm)
FYE 31 Dec FY07 FY08 FY09Fixed Assets 131.3 157.7 184.2Current Assets 81.9 69.1 106.7Current Liabilities -38.9 -38.2 -53.2Others 0.0 0.0 0.0Total 174.3 188.5 237.6Share capital 49.7 71.3 82.8Reserves 57.0 67.5 73.5Shareholders’ Fund 106.8 138.8 156.3LT Liabilities 67.5 49.8 81.3Others 0.0 0.0 0.0Total 174.3 188.5 237.6Gross Debt 67.2 39.0 81.7Net Cash/ (Debt) -58.1 -21.2 -48.2
Cash Flow Statement (RMm)
FYE 31 Dec FY07 FY08 FY09Cash Flow from Ops 39.9 26.2 23.3Cash Flow from Investing -34.6 3.2 -32.2Cash Flow from Financing 10.0 -18.7 25.2Net Increase in Cash 15.3 10.7 16.2Cash at Beginning of Year -8.7 6.6 17.3Other Changes 0.0 0.0 0.0Cash at End of Year 6.6 17.3 33.5
Century Logistics

49
INVESTMENT MERITS
Shipbuilding business backed by a RM1.3bn-strong orderbook New orders to gradually come in as the global economy
recovers Potentially diversifying into O&G fabrication business via
partnerships Maintain Buy with TP of RM3.63 based on PER of 8x FY10
earnings
COMPANY PROFILE
Coastal Contract (Coastal), founded in 1980, was listed on the Bursa Malaysia Main Board in August 2003. The company is principally engaged in shipbuilding, which makes up about 90% of its revenue, while the balance 10% comprises vessel chartering and vessel repair and maintenance. Its shipbuilding business builds offshore support vessels (OSV), tugboats and barges, with existing orders in hand for 50 ships to be built at its Sandakan shipyard while some are outsourced to China.
KEY HIGHLIGHTS
Strong orderbook keeps the shine on Coastal. Currently, its orderbook stands at about RM1.3bn, which is enough to keep the company busy over the next 2-3 years. This orderbook comprises a mix of OSVs, tugboats and barges, for which Coastal has received about 20%-30% of the deposit from its customers. This strong orderbook has kept up Coastal’s performance quarter after quarter throughout 2009 when new jobs in the O&G sector had been the worst affected by the global economic recession.
Recovery in new orders soon. With the global economy on the mend, we see more new jobs in the O&G sector being spurred by increasing energy demand. We believe it would only be a matter of time before our local supporting O&G companies like Coastal receive newbuild orders as it takes 1-2 years before its customers take delivery of an order. Furthermore, as the price of steel has been rising gradually, it would hence make economic sense to lock in the price now before the global commodities prices recover further. As for O&G vessels for the local market, we believe there is still lack of Malaysian flagged vessels, which currently comprises only about 50% of the total number of vessels in operation here. Also, there are insufficient new vessels in the market as the global fleet, which is less than 20 years old, only represents about 1/3 of the total.
Coastal ContractIntegrating Vertically
Target : RM3.63Price : RM2.48
OIL & GAS
Stock Profile/StatisticsBloomberg Ticker COCO MKIssued Share Capital (m) 362.5Market Capitalisation (RMm) 898.952 week H | L Price (RM) 2.65 | 0.99Average Volume (3m) ‘000 463.3YTD Returns (%) 27.2Net gearing (x) 0.0Altman Z-Score 2.35ROCE/WACC 1.9Beta (x) 1.7Book Value/share (RM) 1.25
Major Shareholders (%)Ivory Asia Sdn Bhd 31.3Ng Chin Heng 26.8LTH 10.1
Share Performance (%)Month Absolute Relative1m 0.8 -2.2 3m 26.0 13.9 6m 31.4 19.5 12m 136.6 60.5
6-month Share Price Performance
2.8
2.6
2.4
2.2
2.0
1.8
1.6Oct-09 Nov-09 Dec-09 Jan-10 Feb-10 Mar-10 Apr-10

50
Potential diversification into O&G fabrication. In January 2010, Coastal signed a MOU with Ramunia to collaborate on the fabrication of O&G structures. Ramunia, which currently holds 1 of the 7 fabricators licences awarded by Petronas but no longer owns a yard after having disposed of it to Sime Darby Engineering SB, will use Coastal’s 52.37-acre yard in Sandakan to fabricate O&G structures. This partnership will open up new fabrication jobs opportunities for Coastal.
COMPANY REPORT CARD
ROE. Coastal has been consistently delivering ROE of above 20%. Going forward, we expect this trend to continue given that its strong orderbook which is enough to keep the company busy over the next 2-3 years.
Management. Coastal is led by founder Mr Ng Chin Heng, who is now the Executive Chairman. He gained knowledge in the maritime business when he ventured into vessel chartering back in 1982. Since then, he has acquired the technical and management skills in tugboats, barges and even operating shipyards.
Dividend. As Coastal’s management prefers to set aside spare cash for its vessel fleet and shipyard expansion, we do not expect the company to offer a good dividend yield. As such, we are only factoring in a 2 sen dividend.
RECOMMENDATION
Maintain Buy. Our target price for Coastal of RM3.63 is based on a PER of 8x FY10 earnings. Going forward, we believe new orders will flow once again as we head towards 2H10. We like the company’s robust orderbook, which has shielded it from the adverse effects of the global economic recession.
Income Statement (RMm)
FYE 31 Dec FY07 FY08 FY09 FY10fTurnover 290.4 347.1 466.1 447.0Growth (%) 82.3 19.5 34.3 -4.1EBIT 74.1 102.4 167.1 193.5Pretax 71.0 96.3 163.4 185.9Net Earnings 69.3 96.7 162.7 159.9FD EPS (sen) 19.6 27.4 46.1 45.3Growth (%) 102.5 39.5 68.3 -1.7NTA/Share (RM) 0.60 0.86 1.29 1.75Div (Gross) (sen) 2.0 2.0 2.0 2.0Div (Yield) (%) 0.8 0.8 0.8 0.8PER (x) 12.6 9.1 5.4 5.5P/NTA (x) 4.1 2.9 1.9 1.4
Balance Sheet (RMm)
FYE 31 Dec FY07 FY08 FY09Fixed Assets 76.0 115.3 113.5Current Assets 470.1 747.0 1029.8Current Liabilities -315.3 -529.9 -661.1Others 0.0 0.0 0.0Total 230.8 332.4 482.1Share capital 70.0 70.6 72.2Reserves 144.9 237.5 386.1Shareholders’ Fund 214.9 308.0 458.3LT Liabilities 15.9 24.4 23.9Others 0.0 0.0 0.0Total 230.8 332.4 482.1Gross Debt 107.9 90.6 103.2Net Cash/ (Debt) -37.9 -17.8 -0.3
Cash Flow Statement (RMm)
FYE 31 Dec FY07 FY08 FY09Cash Flow from Ops -28.9 74.4 36.1Cash Flow from Investing -5.4 -29.0 -6.4Cash Flow from Financing 78.8 -45.3 6.4Net Increase in Cash 44.5 0.1 36.1Cash at Beginning of Year 28.1 69.1 72.7Other Changes -3.6 3.5 -6.0Cash at End of Year 69.1 72.7 102.8
Coastal Contract

51
INVESTMENT MERITS
Vehicle sales to achieve record high Plantation has a lot of yield upside Possible share distribution in the pipeline Decent net dividend yield of 3% TP of RM3.30 pegged at 7x
COMPANY PROFILE
Delloyd is a tier one manufacturer of automotive parts and components that has in the past few years made a foray into palm oil plantation with a total planted area of 12,300 ha. Delloyd’s auto segment also manufactures bus chassis in Indonesia through a JV with an Indonesia partner, in addition to owning an exclusive distributorship for Beiqi Foton to import buses and bus chassis. On the local front, it also owns several dealerships in Malaysia selling a variety of marques. Its core activity is the manufacturing of door mirrors and window regulators to a wide range of automotive manufacturers.
KEY HIGHLIGHTS
A recovery play on TIV volume. We see Delloyd Ventures well-positioned in the domestic automotive market given its status as a tier-1 supplier to the two national automakers. This bodes well for Delloyd as TIV is expected to touch a new high this year. The company has been able to nurture long term relationships by offering workable product designs from the conceptual stage to the prototype stage, and subsequently to the end product itself. The recovery in volume augurs well for Delloyd’s car dealership business as the company trims down the number of branches from 7 to 4 to improve productivity.
Venturing into bus chassis in Indonesia. Delloyd’s venture into the commercial vehicle manufacturing segment following a 51% stake acquisition of PT Asian Auto International will broaden its future overseas revenue base as more orders of its CNG buses are delivered. Delloyd expects to clinch 29 additional buses sometime within the next 2 months. The CNG buses, named KOMODO, will be supplied to the Indonesian government to cater for the growing needs for public transportation in Jakarta. We understand that PT Asian Auto International stands is the strongest bidder, noting that it has already supplied 13 CNG buses and has received satisfactory feedback on the stability of the buses as the bus platforms had to be elevated to enable them to park into the high platforms at bus stations.
Delloyd VenturesA Budding Conglomerate
Target : RM3.30Price : RM3.05
AUTOMOTIVE
Stock Profile/StatisticsBloomberg Ticker DV MKIssued Share Capital (m) 90.9Market Capitalisation (RMm) 275.452 week H | L Price (RM) 3.17 | 1.43Average Volume (3m) ‘000 76.3YTD Returns (%) 21.2Net gearing (x) 0.1Altman Z-Score 2.37ROCE/WACC 1.0Beta (x) 0.6Book Value/share (RM) 3.37
Major Shareholders (%)Chung & Tee Ventures 41.3Noor Azmi Jaafar 12.1Tee Boon Kee 2.5
Share Performance (%)Month Absolute Relative1m 0.0 -1.1 3m 20.1 15.5 6m 59.7 46.2 12m 109.0 37.4
6-month Share Price Performance
3.3
3.1
2.9
2.7
2.5
2.3
2.1
1.9Oct-09 Nov-09 Dec-09 Jan-10 Feb-10 Mar-10 Apr-10

52
Plantation a new engine of growth. Delloyd currently owns two palm oil estate with a total area of 14422 ha and 1449 ha in Belitung (in Kalimantan) and Malaysia respectively. We see more room for growth on the Indonesia side as its immature and unplanted area represents 60% of the estate. Yield there has also improved drastically from 3 tonne/ha to 12.96 tonne/ha at a total FFB production of 75,408 tonnes last year. The company also began constructing its first palm oil mill in May 2008 with an initial capacity of processing 60 tonnes FFB / hour. This mill, which was completed in early 2010, will serve all its estates in Belitung and accept FFB from surrounding smallholder plantations. With the existence of its mill, Delloyd expects to improve revenue and margins from selling CPO rather than non processed FFB.
Strong balance sheet. Compared with its local auto peers, Delloyd has a sound balance sheet backed by a low gearing, which is a rarity among its peers. Historically, Delloyd has been known for its sound net cash position. We understand that the venture into plantations has required substantial capex, thus raising its net gearing to 6% as of end-FY09.
COMPANY REPORT CARD
ROE. With a stronger balance sheet and in light of its bottom-line growth, we see Delloyd’s ROE revving up to 12% over the next 3 years from 11% in FY09.
Management. Delloyd is founded by its Managing Director Dato’ Tee Boon Kee, who has experience in auto distributorship, imports of auto parts, replacement equipment manufacturer and his venture into manufacturing OEM has been successful in clinching long term tier 1 status relationships with the two national automakers.
Dividend. Since last year, Management has been actively buying back its shares. To date, it is estimated that the company has accumulated 1.711m shares. A share distribution could be possible on top of its dividend, which we estimate at 9 sen per share for FY10. This gives a yield of 3%
RECOMMENDATION
We value Delloyd at 7x PE, which is on the low side compared to its other liquid peers such as EP Manufacturing. With its earnings momentum continuing, we expect Delloyd to chart earnings growth of 22.3% for 2010 as higher margins will be contributed by the plantation segment and production efficiencies achieved on the auto side. Based on FY10 EPS, this gives a target price of RM3.30 with a BUY call.
Income Statement (RMm)
FYE 31 Dec FY07 FY08 FY09 FY10fTurnover 215.5 290.2 286.4 360.8Growth (%) 13.4 34.7 -1.3 26.0EBIT 15.2 28.2 36.7 46.9Pretax 15.4 23.7 44.4 56.6Net Earnings 13.4 20.6 33.9 41.5FD EPS (sen) 15.3 23.4 38.6 47.2Growth (%) 19.4 53.2 65.0 22.3NTA/Share (RM) 2.84 3.08 3.31 3.69Div (Gross) (sen) 6.0 5.0 6.0 9.0Div (Yield) (%) 2.0 1.6 2.0 3.0PER (x) 20.0 13.0 7.9 6.5P/NTA (x) 1.1 1.0 0.9 0.8
Balance Sheet (RMm)
FYE 31 Dec FY07 FY08 FY09Fixed Assets 272.8 290.6 326.6Current Assets 146.0 158.0 178.5Current Liabilities -70.0 -81.1 -93.2Others 0.0 0.0 0.0Total 348.9 367.5 411.9Share capital 88.9 88.9 88.9Reserves 177.5 198.4 218.9Shareholders’ Fund 266.4 287.2 307.8LT Liabilities 70.8 70.9 90.4Others 11.7 9.3 13.8Total 348.9 367.5 411.9Gross Debt 53.1 52.5 87.1Net Cash/ (Debt) -45.2 -40.8 -62.2
Cash Flow Statement (RMm)
FYE 31 Dec FY07 FY08 FY09Cash Flow from Ops -5.0 39.6 44.2Cash Flow from Investing 0.0 -17.5 -48.7Cash Flow from Financing -2.2 -4.8 30.5Net Increase in Cash -7.2 17.3 26.0Cash at Beginning of Year 33.2 25.9 43.3Other Changes 0.0 0.0 0.0Cash at End of Year 25.9 43.3 69.3
Delloyd Ventures

53
INVESTMENT MERITS
One of the largest players in the local DDP industry Top customers are big local and foreign banks PBT margin at above 25% since FY04 Revenue and earnings grew for 9 consecutive years Trading at below average 5-year high PER
COMPANY PROFILE
Efficient E-Solutions (Efficient) is mainly involved in the provision of integrated outsourcing solutions in data and document processing (DDP), ranging from data extraction to conversion, formatting of documents, to data printing, as well as the preparation of printed documents for distribution via post to banks, stockbroking companies, insurance companies and telecommunications operators. The company also provides electronic bill presentment (EBP) services. Efficient’s market share is the second biggest in the local data and document processing (DDP) industry, dominating the banking, stockbroking and life insurance industries. Its banking customers are Public Bank, Affin Bank, Alliance Bank, Citibank and HSBC while its major clients from the insurance industry are Prudential, ING and Great Eastern.
KEY HIGHLIGHTS
Strong customer base. Efficient has a strong customer base and we see revenue growth driven by processing a greater volume of documents. In addition, sales of the company’s software solutions are also expected to improve as its clients opt for computerization to deliver better and more efficient services.
Clear earnings visibility. Efficient’s revenue is derived from long-term business relationships with its key customers. Due to the high switching costs and long migration process, all existing customers are expected to renew their contracts.
Good cost control. The quarterly ratio of operating expenses/revenue ranged from 12% to 23% from 1QFY04 to 3QFY09. This means that Efficient has been commanding good PBT margins of 28% to 32% since FY05.
High free cash flow. Efficient’s business requires very little capex. The company has spent less than RM1m every year since FY06 on capex. With little pricing pressure in the industry, the low income tax due to its subsidiary’s MSC status and tight cost control, Efficient has been generating strong free cash flow.
Efficient E-SolutionsEyeing 10 Straight Years of Growth
Target : RM0.29Price : RM0.20
TECHNOLOGY
Stock Profile/StatisticsBloomberg Ticker EES MKIssued Share Capital (m) 658.1Market Capitalisation (RMm) 69.152 week H | L Price (RM) 0.22 | 0.08Average Volume (3m) ‘000 120.5YTD Returns (%) 5.0Net gearing (x) 2.0Altman Z-Score 8.58ROCE/WACC 2.0Beta (x) 1.0Book Value/share (RM) 0.10
Major Shareholders (%)Cheah Swee Sin SB 20.2Cheah Chee Kong 15.2Asian New Century Capital 8.7
Share Performance (%)Month Absolute Relative1m 0.0 3.2 3m 10.5 6.6 6m -19.2 -0.5 12m -46.3 -16.3
6-month Share Price Performance
0.4
0.3
0.2
0.1Oct-09 Nov-09 Dec-09 Jan-10 Feb-10 Mar-10 Apr-10
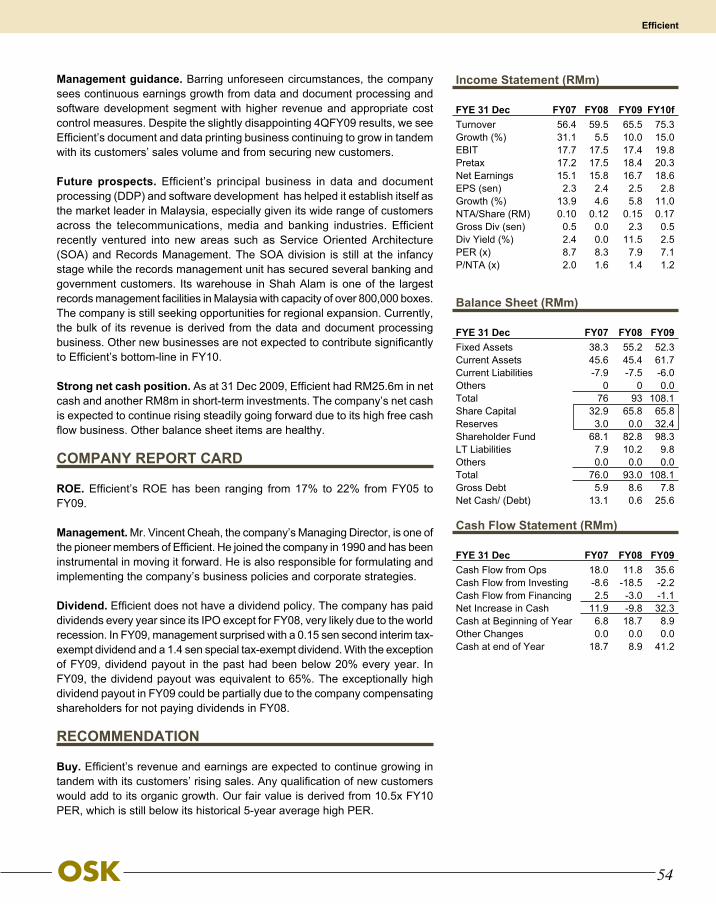
54
Management guidance. Barring unforeseen circumstances, the company sees continuous earnings growth from data and document processing and software development segment with higher revenue and appropriate cost control measures. Despite the slightly disappointing 4QFY09 results, we see Efficient’s document and data printing business continuing to grow in tandem with its customers’ sales volume and from securing new customers.
Future prospects. Efficient’s principal business in data and document processing (DDP) and software development has helped it establish itself as the market leader in Malaysia, especially given its wide range of customers across the telecommunications, media and banking industries. Efficient recently ventured into new areas such as Service Oriented Architecture (SOA) and Records Management. The SOA division is still at the infancy stage while the records management unit has secured several banking and government customers. Its warehouse in Shah Alam is one of the largest records management facilities in Malaysia with capacity of over 800,000 boxes. The company is still seeking opportunities for regional expansion. Currently, the bulk of its revenue is derived from the data and document processing business. Other new businesses are not expected to contribute significantly to Efficient’s bottom-line in FY10.
Strong net cash position. As at 31 Dec 2009, Efficient had RM25.6m in net cash and another RM8m in short-term investments. The company’s net cash is expected to continue rising steadily going forward due to its high free cash flow business. Other balance sheet items are healthy.
COMPANY REPORT CARD
ROE. Efficient’s ROE has been ranging from 17% to 22% from FY05 to FY09.
Management. Mr. Vincent Cheah, the company’s Managing Director, is one of the pioneer members of Efficient. He joined the company in 1990 and has been instrumental in moving it forward. He is also responsible for formulating and implementing the company’s business policies and corporate strategies.
Dividend. Efficient does not have a dividend policy. The company has paid dividends every year since its IPO except for FY08, very likely due to the world recession. In FY09, management surprised with a 0.15 sen second interim tax-exempt dividend and a 1.4 sen special tax-exempt dividend. With the exception of FY09, dividend payout in the past had been below 20% every year. In FY09, the dividend payout was equivalent to 65%. The exceptionally high dividend payout in FY09 could be partially due to the company compensating shareholders for not paying dividends in FY08.
RECOMMENDATION
Buy. Efficient’s revenue and earnings are expected to continue growing in tandem with its customers’ rising sales. Any qualification of new customers would add to its organic growth. Our fair value is derived from 10.5x FY10 PER, which is still below its historical 5-year average high PER.
Income Statement (RMm)
FYE 31 Dec FY07 FY08 FY09 FY10fTurnover 56.4 59.5 65.5 75.3 Growth (%) 31.1 5.5 10.0 15.0 EBIT 17.7 17.5 17.4 19.8 Pretax 17.2 17.5 18.4 20.3 Net Earnings 15.1 15.8 16.7 18.6 EPS (sen) 2.3 2.4 2.5 2.8 Growth (%) 13.9 4.6 5.8 11.0 NTA/Share (RM) 0.10 0.12 0.15 0.17 Gross Div (sen) 0.5 0.0 2.3 0.5 Div Yield (%) 2.4 0.0 11.5 2.5 PER (x) 8.7 8.3 7.9 7.1 P/NTA (x) 2.0 1.6 1.4 1.2
Balance Sheet (RMm)
FYE 31 Dec FY07 FY08 FY09Fixed Assets 38.3 55.2 52.3Current Assets 45.6 45.4 61.7Current Liabilities -7.9 -7.5 -6.0Others 0 0 0.0Total 76 93 108.1Share Capital 32.9 65.8 65.8Reserves 3.0 0.0 32.4Shareholder Fund 68.1 82.8 98.3LT Liabilities 7.9 10.2 9.8Others 0.0 0.0 0.0Total 76.0 93.0 108.1Gross Debt 5.9 8.6 7.8Net Cash/ (Debt) 13.1 0.6 25.6
Cash Flow Statement (RMm)
FYE 31 Dec FY07 FY08 FY09Cash Flow from Ops 18.0 11.8 35.6Cash Flow from Investing -8.6 -18.5 -2.2Cash Flow from Financing 2.5 -3.0 -1.1Net Increase in Cash 11.9 -9.8 32.3Cash at Beginning of Year 6.8 18.7 8.9Other Changes 0.0 0.0 0.0Cash at end of Year 18.7 8.9 41.2
Efficient

55
INVESTMENT MERITS
Management guiding for record sales in FY10 Riding on big customers such as Western Digital and Seagate Worldwide HDD shipment expected to grow 12.5% this year 25%-50% dividend payout Trading at a historical 11-year average PER of 7.1x
COMPANY PROFILE
Engtek has been in the industry for more than 30 years and has manufacturing facilities of more than 450,000 sq ft across Malaysia, China, Thailand and the Philippines.
Its core operations are in precision components manufacturing and assembly, and precision die casting and machining. The company is a leading strategic vendor for the hard disk drive (HDD) and industrial products (IPG) industry. It manufactures HDD actuators, HDD base plates, other HDD components and industrial product & components.
The world’s top two HDD makers, namely Seagate and Western Digital, are Engtek’s main customers. Its other customers are Hitachi GST, Fujitsu and Emerson.
KEY HIGHLIGHTS
Record quarterly, yearly earnings. Engtek’s net profit has been improving since 4QFY08 in tandem with the recovering world economy. In 4QFY09, the company registered its highest quarterly earnings. Its FY09 earnings were also the highest ever recorded, even excluding the recognition of RM4.6m in negative goodwill which arose from its acquisition of the remaining 25% equity interest in a subsidiary. Although FY09 revenue fell 14.4%, earnings surged 78%, mainly due to the company’s success in lowering operating costs in tandem with the drop in its business in FY09.
Management guidance for FY10. Management maintains an optimistic business outlook based on strong demand forecast from its customers. Plans are underway to expand capacity to cater for increased demand, which would correspondingly bolster revenue and earnings. Barring unforeseen circumstances, the company is poised to enhance revenue and earnings in FY10. Management said that the global economic recovery since early 2009 gave impetus to demand for data storage devices. It said Engtek had benefited from the dropping out of two competitors, which led to the company enlarging its market share. It does not expect forex and raw material prices to fluctuate significantly in 2010. However, management added that Engtek is watchful of the global economy and will tread carefully going into 2H10.
Eng TeknologiHeading for Record FY10 Sales
Target : RM3.25Price : RM2.74
TECHNOLOGY
Stock Profile/StatisticsBloomberg Ticker ENG MKIssued Share Capital (m) 120.0Market Capitalisation (RMm) 328.952 week H | L Price (RM) 2.98 | 0.54Average Volume (3m) ‘000 757.3YTD Returns (%) 71.3Net gearing (x) 0.04Altman Z-Score 3.35ROCE/WACC 1.9Beta (x) 1.0Book Value/share (RM) 1.77
Major Shareholders (%)PNB 14.8Low Yeoh Siang 12.9Teh Eong Liang 9.8
Share Performance (%)Month Absolute Relative1m 34.7 35.1 3m 52.6 44.5 6m 111.2 98.6 12m 401.9 247.0
6-month Share Price Performance
3.3
3.0
2.7
2.4
2.1
1.8
1.5
1.2Oct-09 Nov-09 Dec-09 Jan-10 Feb-10 Mar-10 Apr-10

56
A growing industry. In 4Q08, the HDD industry was hit hard by the deteriorating global economy. In early 2009, market research consultancy TRENDFOCUS forecast that worldwide HDD shipments in 2009 could potentially fall 12% compared to 2008 as corporates and consumers tighten spending on PCs and consumer electronics. Nevertheless, as the world economy gradually improved in the first three quarters of 2009, demand for HDDs actually expanded, with TRENDFOCUS expecting 4Q09 shipments to trend even higher. The organization said an increase in PC demand, especially for mobile computing solutions, was the key driver and 2009 shipments are expected to rise by a slight 2.8%. TRENDFOCUS has projected a 12.5% growth in worldwide HDD shipments in 2010, and another 11% for 2011 and 2012.
Western Digital guides for lower 1Q10 shipment. Western Digital believes that the continued demand for storage of digital content will drive growth for the digital storage industry despite challenging global economic conditions. Historically, demand in the March quarter was down sequentially by 5%-7% but management believes the demand in the December quarter was not entirely satisfied and on anticipation of continuing strong demand for digital storage, industry unit shipments are expected to drop by only 1%-5% q-o-q. Pricing will be flat to lower but would be rational due to the balance between supply and demand. Western Digital expects the March quarter’s sequential revenue growth to range from -5.8% to 0%.
Possibly weaker 1Q sales. Although Engtek’s management did not provide specific guidance on 1QFY10, there is a possibility of revenue dipping q-o-q or finishing flat at best as Western Digital contributed 52% of the company’s FY09 revenue. However on a y-o-y basis, as Engtek was still in the red in 1QFY09, it should therefore see a strong y-o-y jump in its 1QFY10 net profit.
COMPANY REPORT CARD
ROE. We expect an ROE of 21.2% for FY10 compared with 19.9% in FY09, mainly due to better economies of scale.
Management. Dato’ Teh Yong Khoon was appointed to the Board in 1992 and was responsible for the overall operations of the group. He also held the position of COO. On 1 Jan 2006, Dato’ Teh succeeded Dato’ Teh Eong Liang as company CEO.
Dividend. A 6 sen tax-exempt final dividend has been declared. This is on top of the 3 sen tax-exempt interim dividend declared for 2QFY09. The FY09 dividend payout is equivalent to 25%. Management maintains an internal dividend payout of 25%-50%. For FY10, we expect a dividend payout of about 25% due to Engtek’s rather high capex of RM40m this year.
RECOMMENDATION
Engtek’s share price has appreciated towards its historical 11-year average PER of 7.1x and is closing the valuation gap with its peers Notion VTec and JCY. However, we would still apply a slight discount to Engtek compared to the other 2 listed Malaysian HDD manufacturers because Notion VTec commanded a far higher PBT margin of 25% in FY09 compared with Engtek’s 4QFY09 PBT margin of 16%. Notion VTec has maintained a PBT margin of at least 25% over the last six years while Engtek’s margins had fluctuated widely over the same period. We value Notion VTec at 9x FY10 PER. JCY is far bigger than Engtek and is, according to TRENDFOCUS, a Tier-1 or Tier-2 supplier of a number of components to Western Digital and Seagate, which Engtek is unable to match. Pegging a fair 7.5x FY10 PER, Engtek’s fair value is RM3.25.
Income Statement (RMm)
FYE 31 Dec FY07 FY08 FY09 FY10fTurnover 500.6 554.9 474.9 541.4 Growth (%) 10.8 10.8 -14.4 14.0 EBIT 10.4 42.9 43.7 59.4 Pretax 12.6 41.7 49.2 64.4 Net Earnings 14.8 24.5 43.5 54.9 FD EPS (sen) 12.4 19.3 34.4 43.4 Growth (%) -14.0 55.5 77.6 26.3 NTA/Share (RM) 1.33 1.36 1.66 1.98 Div (Gross) (sen) 12.5 8.1 12.0 15.0 Div (Yield) (%) 4.6 3.0 4.4 5.5 PER (x) 22.0 14.2 8.0 6.3 P/NTA (x) 2.1 2.0 1.6 1.4
Balance Sheet (RMm)
FYE 31 Dec FY06 FY07 FY08 FY09Fixed Assets 195.0 184.7 194.3 157.0 Current Assets 213.0 246.5 230.6 235.5 Current Liabilities -178.1 -195.2 -175.8 -127.9 Others 0.0 0.0 0.0 0.0 Total 229.9 236.0 249.1 264.6 Share capital 119.1 119.1 119.2 119.3 Reserves 56.4 67.0 80.6 118.3 Shareholders’ Fund 175.5 186.1 199.8 237.6 LT Liabilities 37.5 31.8 24.8 24.8 Others 17.0 18.1 24.5 2.2 Total 230.0 236.0 249.1 264.6 Gross Debt 121.7 114.7 118.1 68.4 Net Cash/ (Debt) -77.2 -69.5 -70.8 -8.4
Cash Flow Statement (RMm)
FYE 31 Dec FY07 FY08 FY09Cash Flow from Ops 34.8 84.2 45.7Cash Flow from Investing -22.5 -61.2 45.8Cash Flow from Financing -16.5 -10.8 48.6Net Increase in Cash -4.2 12.2 45.8Cash at Beginning of Year 1.2 39.2 5.8Other Changes 1.2 -6.4 0.0Cash at End of Year 39.2 45.0 51.6
Eng Teknologi

57
INVESTMENT MERITS
Localization of content by automakers to broaden revenue base Tier 1 critical components auto supplier for Proton and Perodua Diversifying into concessionaire water treatment Liquid stock compared to other auto-part makers TP of RM0.59 based on 8x EPS
COMPANY PROFILE
EP Manufacturing (EPMB) is a leading supplier of automotive systems solutions to Proton and Perodua. A strategic partnership with Bosch, a leading global manufacturer of automotive and industrial technology, has enabled EPMB to supply brakes to Proton Holdings and other carmakers. Through its subsidiary, PEPS-JV, EPMB manufactures its own components for the corner module and assembles them with Bosch’s brake components. The Intake Air Fuel Module (IAFM) used in Proton’s CAMPRO engines was a breakthrough jointly developed by Bosch and EPMB. The company also manufactures smart water meters and is also looking at the possibility of expanding into water treatment in Indonesia.
KEY HIGHLIGHTS
Counting on Perodua. EP Manufacturing recently secured a new contract from Perodua for the manufacture of the cross member structure (a structure that holds the engine) for both the Myvi and Alza, after having invested over RM40m-RM60m in dies, moulds and R&D. Previously EPMB had only secured Perodua’s localization programme for the Viva’s cross member, from which it collects an estimated RM700-RM800 per car, along with the other parts supplied. The further localization of the Myvi and Alza should see EPMB increasing the supply of auto-parts to both models from 33 parts to 103 in total, almost tripling its revenue collected per Myvi from 2010 onwards. We estimate that revenue contribution from Perodua would increase from RM74m (as collected in FY08) to as much as RM196m in FY10 on the back of the higher average revenue per Perodua vehicle supplied (from RM477 in FY09 to RM1115 per vehicle). The growing revenue from Perodua will raise its proportionate share of EPMB’s total revenue from 15%-17% in FY08-09 to over 35% from FY10 onwards.
EPMB-Proton relationship solid. We note that over the past few years, EPMB had been selectively focusing on the supply of Perodua parts in an attempt to diversify its revenue. While no project has been pitched on Proton’s side of late, we are comforted by the fact that EPMB’s relationship with Proton remains intact given its long-standing relationship as a critical tier 1 auto supplier for Proton’s IAFM, which is used alongside the Campro engines. Also worth noting is that EPMB has contributed in enhancing the overall performance of the IAFM’s engineering performance. Furthermore, Proton also owns a minority stake of about 4% in a JV with EPMB under the company name PEPS-JV, which further solidifies the relationship between the two companies. This gives assurance that EPMB will be a potential beneficiary when Proton makes headway in the export market.
EP ManufacturingGrowing with Perodua
Target : RM0.59Price : RM0.51
AUTOMOTIVE
Stock Profile/StatisticsBloomberg Ticker EPMB MKIssued Share Capital (m) 166.0Market Capitalisation (RMm) 83.052 week H | L Price (RM) 0.64 | 0.14Average Volume (3m) ‘000 1716.4YTD Returns (%) 7.5Net gearing (x) 1.0Altman Z-Score 1.17ROCE/WACC 0.7Beta (x) 0.8Book Value/share (RM) 0.58
Major Shareholders (%)Mutual Concept 37.2Hamid Bin Abdullah 5.1EP Manufacturing 2.6
Share Performance (%)Month Absolute Relative1m 4.1 -2.8 3m 1.0 -4.1 6m 8.5 -6.9 12m 264.3 142.9
6-month Share Price Performance
0.7
0.6
0.5
0.4Oct-09 Nov-09 Dec-09 Jan-10 Feb-10 Mar-10 Apr-10

58
Water meter business to break even. We expect orders for its smart water meter to pick up to levels achieved in FY07 on the back of higher Government spending to replace water meters. With this, we see the division posting marginal profit in FY10. Over the longer term, EPMB is also looking at the possibility of venturing into water treatment in Serang, Indonesia to supply drinking water to households. Currently feasibility studies are being conducted and the first phase of the venture is expected to kick off next year and involve minimal capex of RM5m-RM8m.
Margins on the rise. Operationally, securing the new supply of parts to both the Myvi and Alza will enhance the company’s overall operating leverage via economies of scale. While we see no significant change on revenue contribution from Proton and Toyota (Middle East export market) as well as its water meter business, the doubling in revenue contribution from Perodua would potentially result in a vast improvement in EPMB’s PBT margins as well as its cash flow, given its high net gearing of 98.3%.
Net gearing not worrisome. We are not overly concerned about its gearing given the recent contract related to the Myvi’s new localization programme, which will subsequently be carried over to the upcoming Myvi replacement model slated for launch sometime in mid-2011. Furthermore, the company’s cost cutting measures will be reflected by a reduction in interest expense as EPMB further pares down its debt, as management is targeting to lower its net gearing to 50%-55% by FY11. According to its debt schedule, it is expected to pay off RM61m over the next 1 year.
COMPANY REPORT CARD
ROE. We expect EPMB’s ROE to progressively climb from 3.2% to 5.2% in FY10 on the back of a higher revenue base and margin expansion as it pares down its debt further.
Management. The company has a dedicated and hands-on management team, which is crucial in maintaining long term relationships with the two national automakers. Their experience not only involves business links but also technical collaboration. This proves favorable for EPMB in specializing in the supply of OEM parts which are predominantly platform related, thus ensuring continuity over the long run.
Dividend. Given its net gearing of 98.3% and capex needs ahead of the Myvi replacement, we do not expect EPMB to pay any dividend for the time being. However, should earnings come in better than expected, there is potential for a surprise dividend.
RECOMMENDATION
Still undervalued. Against the sector average of 10-11x, its forward PE is an attractive 7x. Our TP of RM0.59 is premised at 8x PE on its FY10 EPS. EPMB is considered relatively liquid compared with its bigger auto peers, Proton and UMW, given the free float of 50% despite its small market cap.
Income Statement (RMm)
FYE 31 Dec FY07 FY08 FY09 FY10fTurnover 303.0 483.7 467.5 562.0Growth (%) 32.6 59.6 -3.4 20.2EBIT 9.3 18.4 22.8 22.9Pretax -1.3 4.3 7.4 12.6Net Earnings -0.5 7.6 7.1 12.2FD EPS (sen) -2.8 4.6 4.3 7.3Growth (%) -261.8 -262.4 -6.5 72.2NTA/Share (RM) 0.35 0.41 0.58 0.70Div (Gross) (sen) 0.0 0.0 1.0 0.0Div (Yield) (%) 0.0 0.0 2.0 0.0PER (x) -18.2 11.2 12.0 7.0P/NTA (x) 1.5 1.2 0.9 0.7
Balance Sheet (RMm)
FYE 31 Dec FY07 FY08 FY09Fixed Assets 467.9 483.8 446.2Current Assets 157.8 150.0 131.0Current Liabilities -240.1 -253.5 -242.7Others 0.0 0.0 0.0Total 385.6 380.3 334.5Share capital 131.6 166.0 166.0Reserves 69.1 48.6 55.7Shareholders’ Fund 200.7 214.5 221.6LT Liabilities 173.7 160.3 107.2Others 11.3 5.4 5.7Total 385.6 380.3 334.5Gross Debt -262.6 -271.6 -231.1Net Cash/ (Debt) -249.3 -258.1 -217.9
Cash Flow Statement (RMm)
FYE 31 Dec FY07 FY08 FY09Cash Flow from Ops 84.2 65.2 83.9Cash Flow from Investing -71.0 -66.0 -28.5Cash Flow from Financing -30.1 -0.6 -56.3Net Increase in Cash -16.9 -1.4 -0.9Cash at Beginning of Year 27.3 10.3 9.0Other Changes -13.9 3.2 4.2Cash at End of Year 13.4 13.5 13.2
EP Manufacturing

59
INVESTMENT MERITS
Growing orders to support earnings Expanding capacity to fulfill orders and enhance earnings Diversified customer base reduces selling risks Efficiency and cost cutting to expand operating margins
COMPANY PROFILE
Evergreen Fibreboard (EFB) began in 1972 when its founder Mr. Kuo Wen Chi incorporated Evergreen Timber Products Pte Ltd. In 1977, he ventured to Malaysia to set up the Evergreen Group of Companies. Mr Kuo has been the key driving force behind the company’s growth and development. He was redesignated EFB executive deputy chairman in 2006. His sons, Kuo Jen Chang (managing director) and Kuo Jen Chiu (chief operating officer), now oversee EFB’s day-to-day operations ranging from administrative duties to business development. Today the group, headquartered in Johor, has five manufacturing locations in Malaysia, three in Thailand and one in Indonesia. Besides being located near its renewable source of raw material, plantation wood, the group is also close to major international shipping and rail ports, which facilitate efficient and timely export delivery.
KEY HIGHLIGHTS
The worst is over. We think the worst is over for EFB as demand for medium-density fibreboard (MDF) begins to pick up. Starting from 3QFY09, the company began to see improving orders, which have led to an increase in production capacity. Assuming that orders returned to pre-2009 financial crisis levels and given the newly installed annual MDF production capacity of 1.3bn m3 per year, we should see EFB registering revenue growth of 10%-15% this year while net profit will jump by more than 30%.
Capacity close to two-fold. Prior to the financial crisis, EFB’s MDF production stood at 700,000 m3 per annum. However, following the acquisition of Hume Fibreboard last year and the upcoming commencement of its MDF production plant in Indonesia, EFB is slated to push its maximum production capacity to 1.3bn m3 per annum. Based on orders received in 4QFY09, its Malaysian production plants are operating at 80% capacity while that in its Thailand plant is 75%. Although its Indonesian production plant is currently dormant, the company plans to commence operation of the Indonesian plant in 2H this year. The capacity utilisation, however, should be a minimal 50%-60%.
Evergreen FibreboardMore Than Meets The Eye
Target : RM2.08Price : RM1.72
BUILDING MATERIALS
Stock Profile/StatisticsBloomberg Ticker EVF MKIssued Share Capital (m) 513.0Market Capitalisation (RMm) 882.452 week H | L Price (RM) 1.80 | 0.49Average Volume (3m) ‘000 1035.1YTD Returns (%) 22.9Net gearing (x) 0.4Altman Z-Score 2.29ROCE/WACC 0.6Beta (x) 1.6Book Value/share (RM) 1.34
Major Shareholders (%)LTH 7.1HIMB Trading Ltd 6.0EPF 5.2
Share Performance (%)Month Absolute Relative1m 11.5 6.5 3m 17.6 11.6 6m 87.1 49.8 12m 248.0 140.0
6-month Share Price Performance
2.0
1.8
1.6
1.4
1.2
1.0Oct-09 Nov-09 Dec-09 Jan-10 Feb-10 Mar-10 Apr-10

60
Diversified risk EFB’s sales are spread out globally, with the contribution of no one single market exceeding 20%. Its footprint spans 45 countries, including Malaysia. About half of EFB’s sales are to ASEAN countries and the other half non-ASEAN. In terms of non-ASEAN exports, Taiwan and the Gulf Cooperation Council countries account for half of sales while US, Japan and European make up the other half.
Margins to improve. EFB undertook strict cost cutting and efficiency improvement initiatives in 2009. Thus the company believes that going forward its operations, ceteris paribus, should give it higher operating margins. As of FY09, its gross margins stood at about 27%, with the company aiming to raise operating margins to above 30% from efficiency improvements.
COMPANY REPORT CARD
ROE. ROE in FY10 is expected to be strong on the back of higher sales arising from its expanded production capacity and growing orders.
Management. The company is helmed by the second generation of the Kuo family. Brothers Kuo Jen Chang (MD) and Kuo Jen Chiu (COO) oversee the company’s day-to-day operations.
Dividend. Evergreen is guiding for a dividend payout ratio of 20% based on its historical track record.
RECOMMENDATION
We derive a target price of RM2.08, premised on the company’s stronger EPS this year of 23.1 sen. We peg its EPS at the higher tier of the building materials sector PE of 9 times. Re-iterate BUY recommendation on the stock.
Income Statement (RMm)
FYE 31 Dec FY07 FY08 FY09 FY10fTurnover 731.6 730.5 771.5 874.5Growth (%) 38.5 -0.1 5.6 13.4EBIT 117.8 60.9 88.9 132.9Pretax 140.4 63.9 80.4 120.6Net Earnings 118.5 76.7 87.4 118.7FD EPS (sen) 24.7 15.0 17.0 23.1Growth (%) 98.4 -39.4 13.9 35.8NTA/Share (RM) 1.01 1.15 1.34 1.52Div (Gross) (sen) 7.0 0.0 5.3 7.2Div (Yield) (%) 0.0 0.0 0.0 0.0PER (x) 7.1 11.8 10.3 7.6P/NTA (x) 1.7 1.5 1.3 1.2
Balance Sheet (RMm)
FYE 31 Dec FY07 FY08 FY09Fixed Assets 564.9 956.8 940.7Current Assets 347.8 289.4 308.8Current Liabilities -138.4 -407.3 -227.9Others 0.0 0.0 0.0Total 774.2 838.9 1021.5Share capital 120.0 128.3 128.3Reserves 317.6 372.9 460.3Shareholders’ Fund 532.5 610.7 706.2LT Liabilities 235.1 222.6 313.6Others 6.5 5.6 1.7Total 774.2 838.9 1021.5Gross Debt 228.0 469.8 412.8Net Cash/ (Debt) -105.2 -394.1 -302.5
Cash Flow Statement (RMm)
FYE 31 Dec FY07 FY08 FY09Cash Flow from Ops 169.9 121.5 121.2Cash Flow from Investing -228.0 -398.7 -18.1Cash Flow from Financing 52.4 211.9 -66.4Net Increase in Cash -5.8 -65.2 36.7Cash at Beginning of Year 147.4 141.6 76.4Other Changes 0.0 0.0 0.0Cash at End of Year 141.6 76.4 113.1
Evergreen Fibreboard

61
INVESTMENT MERITS
Leader in the provision of integrated crane services, with 70% market share
Has long-term contracts with oil majors that provide recurring income
More cranes are due for overhaul going forward New yard to handle more business
COMPANY PROFILE
Handal Resources (Handal) is a fully integrated offshore crane service and manufacturing provider specializing in the oil & gas industry in Malaysia. The company, which started operation in 1988, was listed on the Second Board of Bursa Malaysia in 2009. Today, Handal is principally involved in the provision of crane overhaul and maintenance services, lifting solutions for workover projects to revive old and abandoned oil platforms, the supply of manpower and parts, fabrication of API 2C offshore cranes and crane rental.
KEY HIGHLIGHTS
Leading provider of integrated crane services in Malaysia. We understand that Handal has a 70% share of this business while the balance 30% is shared by Petra Energy and other smaller competitors. In fact, from the geographical aspect, we gather that Handal has a monopoly on crane services off the coast of Peninsular Malaysia, and also has a slice of the exposure off the coast of Sabah and Sarawak. These services include crane reconditioning, operation and maintenance, crane inspection and consultation services.
LT contracts with oil majors. Handal has locked in LT contracts with oil majors such as Petronas Carigali, ExxonMobil and Talisman, with the bulk locked in up to 2013 to provide stable and recurring income. When these contracts expire, we do not see Handal facing problems renewing them since it not only has LT relationships with the oil majors (some of more than 14 years’ standing), but has also provided satisfactory services through its track record for timely delivery in the overhaul and maintenance of cranes.
More business coming its way. Given the recovery in crude oil price, we expect Petronas to go on a spending spree. Assuming that more than 50 new platforms are to be built over the next 5 years would give rise to demand for some 50-80 cranes, which can either be new or refurbished, to service the platforms and all these would create new job opportunities for Handal. In fact, servicing its existing customers’ platforms has given rise to ample jobs for Handal as we gather that Petronas Carigali, ExxonMobil and Talisman cumulatively own more than 200 cranes, for which overhauling is required after 8-10 years of use.
Handal Resources Leader in Offshore Crane Services
Target : RM1.49Price : RM0.80
OIL & GAS
Stock Profile/StatisticsBloomberg Ticker HDL MKIssued Share Capital (m) 90.0Market Capitalisation (RMm) 72.052 week H | L Price (RM) 1.47 | 0.72Average Volume (3m) ‘000 0.10YTD Returns (%) -1.2Net gearing (x) Net CashAltman Z-Score N.A.ROCE/WACC N.A.Beta (x) N.A.Book Value/share (RM) 0.48
Major Shareholders (%)Dato’ Mohsin Abdul Halim 24.2Mallek Rizal bin Mohsin 7.6Zahari bin Hamzah 25.6Joel Emanuel Heaney 15.4
Share Performance (%)Month Absolute Relative1m 1.9 -2.8 3m -10.0 -12.7 6m -25.7 -35.3 12m - -
6-month Share Price Performance1.2
1.1
1.0
0.9
0.8
0.7Oct-09 Nov-09 Dec-09 Jan-10 Feb-10 Mar-10 Apr-10

62
New yard to keep Handal even busier. On top of the existing 3-acre yard capable of handling about 10 cranes p.a., Handal also has a new 10-acre yard in Telok Kalong Industrial Area, Kemaman with a capacity of 30 cranes p.a. This new yard is expected to enhance Handal’s future earnings given that yard space was previously scarce.
More contracts expected to come in soon. In fact, Handal has recently been awarded a contract to provide engineering, procurement, construction and commission 22 NOS new storage tanks at the Melaka Lube Blending Plant amounting to RM17.5m by Petronas. Also, besides having a local presence here, Handal also has established a communication channel to participate in bids/tenders in Indonesia and Brunei.
COMPANY REPORT CARD
ROE. Handal’s ROE over the past 2 years has averaged about 18%. Going forward, we expect this trend to continue given the brighter business outlook.
Management. Dato’ Mohsin Abdul Halim is the founder and Executive Chairman of Handal. He is also the group’s largest shareholder, with a 24.16% stake. Mallek Rizal bin Mohsin is the Managing Director and Chief Executive Officer, responsible for all financial matters of Handal and its overall business strategy. He is also a qualified accountant by profession. Joel Emanuel Heaney is the Deputy Managing Director as well as Regional Manager and Group Advisor. He has more than 20 years’ experience in offshore crane and plays an important role in spearheading the group’s operation and performance. Zahari bin Hamzah, 47, is the Non-Independent Executive Director. He is also Executive Director and General Manager of Operations/Engineering/Sales of Handal offshore service.
Dividend. The Board of Directors declared a single-tier first and final dividend of 2 sen/share for FY09. There are no other historical figures since the company was listed only in 2009. Going forward, it expects to maintain the existing payout or higher, in line with the better performance of its business.
RECOMMENDATION
Buy. Our target price for Handal is RM1.49 based on PER of 8x FY10 earnings, which represents a discount to the industry average of about 10x. We are applying a discount to our valuation given the low liquidity in the stock.
Income Statement (RMm)
FYE 31 Dec FY07 FY08 FY09* FY10fTurnover 55.6 60.6 48.8 76.4Growth (%) 41.8 9.0 -19.4 56.5EBIT 13.2 15.7 14.7 23.7Pretax 12.1 13.8 13.8 22.7Net Earnings 8.7 9.2 10.0 16.8FD EPS (sen) 9.7 10.3 11.2 18.7Growth (%) 79.8 6.1 8.5 67.4NTA/Share (RM) - - 0.62 0.80Div (Gross) (sen) - - 2.0 3.9Div (Yield) (%) - - 2.5 4.6PER (x) 8.3 7.8 7.2 4.3P/NTA (x) - - 1.3 1.0* FY09 is based 8-month figures
Balance Sheet (RMm)
FYE 31 Dec FY07 FY08 FY09Fixed Assets - - 30.2Current Assets - - 73.7Current Liabilities - - -29.2Others - - 0.0Total - - 74.8Share capital - - 46.6Reserves - - 10.0Shareholders’ Fund - - 56.6LT Liabilities - - 18.2Others - - 0.0Total - - 74.8Gross Debt - - 32.9Net Cash/ (Debt) - - 0.7
Cash Flow Statement (RMm)
FYE 31 Dec FY07 FY08 FY09*Cash Flow from Ops - - 4.6Cash Flow from Investing - - 10.3Cash Flow from Financing - - 4.0Net Increase in Cash - - 18.8Cash at Beginning of Year - - 0.0Other Changes - - 0.0Cash at End of Year - - 18.8* FY09 is based 8-month figures
Handal Resources

63
INVESTMENT MERITS
A mall turnaround specialist Well-managed by professionals Attractive dividend yield of 8.9% vs sector average of 8.4% Relatively more defensive earnings (to the downside) Business model enables the trust to ride on retail sector upside
COMPANY PROFILE
Hektar REIT (Hektar), which has a portfolio comprising 3 shopping centres in Subang Jaya, Melaka and Muar in Johor with a combined value of RM720m, is Malaysia’s first retail-focused REIT. Hektar was listed on Bursa Malaysia’s Main Board on 4 Dec, ‘06 with Frasers Centrepoint Trust (FCT, part of the F&N Group in Singapore) as its recent cornerstone investor. It is managed by Hektar Asset Management Sdn Bhd, part of the Hektar Group, with focus on developing and managing retail shopping centres in Malaysia. Two board representatives are nominated by Frasers Centrepoint Limited (FCL, the main sponsor to FCT).
KEY HIGHLIGHTS
Earnings defensive to the downside. Hektar’s business model ensures that its earnings will remain relatively more resilient to the downside vis-à-vis those of other non-residential real estate asset classes, even during a downturn because:
• Shopping malls a safer bet? Unlike other real estate sub-segments, retail tenants usually have relatively lower bargaining power because their main business, i.e. retailing, and prospects depend very much on being in a particular shopping mall. Moving premises, or even to another shopping lot, may significantly disrupt business as customers may not necessarily follow. Plus, a lower-grade shopping mall may not attract clientele with the same buying power. Hence, the rental rates of shopping malls, at least those in prime locations, should hold up better relative to those in other real estate sub-segments.
• Consumer-driven tenants and diversified tenant base. It has a well-diversified tenant base and a healthy mix of consumer-driven tenants who are more focused on providing daily necessities to the residents in their vicinity. During a downturn, consumers may cut down on discretionary items but are unlikely to do the same for essentials and daily consumables. Except for Parkson, no other tenant contributes >3.0% of the REIT’s total monthly income.
• Well-managed tenancy expiry dates. Hektar REIT has a reasonably well-managed distribution of tenancy expiry dates. All assets combined with its tenancy expiry dates make up no more than 28% of its monthly rental income for CY10.
Hektar REITAttractive Dividend Yield
Target : RM1.29Price : RM1.22
REIT ESTATE INVESTMENT TRUST
Stock Profile/StatisticsBloomberg Ticker HEKT MKIssued Share Capital (m) 320.0Market Capitalisation (RMm) 390.452 week H | L Price (RM) 1.25 | 0.87Average Volume (3m) ‘000 88.6YTD Returns (%) 8.9Net gearing (x) 0.7Altman Z-Score n.a.ROCE/WACC 0.7Beta (x) 0.6Book Value/share (RM) 1.27
Major Shareholders (%)Frasers Centrepoint Trust 31.1Hektar Premier Sdn Bhd 27.4Hektar Black Sdn Bhd 12.7
Share Performance (%)Month Absolute Relative1m 6.1 2.5 3m 9.0 3.7 6m 19.7 3.3 12m 51.1 -5.2
6-month Share Price Performance
1.3
1.2
1.1
1.0Oct-09 Nov-09 Dec-09 Jan-10 Feb-10 Mar-10 Apr-10

64
Indirect partnership with tenants. Under this tenancy model, some of Hektar’s tenants are not only subject to the conventional step-up base rents but also turnover rents as well. The step-up base rentals include a negotiated fixed quantum base rent increase at specified periods over the tenancy term. Turnover rents, however, entail fixing a certain percentage of a tenant’s monthly or periodic sales turnover, usually with a specified sales threshold. Incorporating turnover rents in its tenancy agreements indirectly engages the management in a partnership with its tenants, thus motivating it to promote its tenants’ sales via, for example, organising events, continuous enhancement of the malls and so on.
Positioned to ride on sustainable recovery. Although it has a relatively more defensive earnings model, this does not mean that Hektar would not be able to enjoy any upside potential when the retail sector recovers. Via its turnover rent, which represent a significant 91% of its tenancies on average, significant improvement in tenants’ monthly sales turnover beyond a certain threshold will imply that Hektar gets to indirectly ride on the recovery as well. In addition, a sustainable recovery in the retail sector will eventually entail a mid-term structural change in tenancy agreement by giving Hektar more bargaining power in increasing rental via the step-up base rent agreements. This bodes well for the trust, especially in CY11 when about 39% of its monthly rental income is due for tenancy expiry. Finally, this also provides a defense against downward pressure from other threats such as competition (e.g. due to increasing supply of retail space).
Backed by sponsors. In addition to the backing of the Hektar Group, Fraser Centrepoint Trust, the leading suburban retail Singapore-based REIT, holds a 31% stake in Hektar. Meanwhile, Fraser Centrepoint Ltd, the main sponsor of FCT, holds a 40% stake in the management company. Having FCT as a cornerstone investor opens the door opportunities for more assets injection into Hektar for long-term growth. FCL, being part of the Fraser & Neave Group, has extensive interests in property development, serviced residences and investment funds. Also, the significant presence of this financially strong corporate which is backed by institutional investors should also help allay concerns over funding of Hektar’s future acquisitions.
COMPANY REPORT CARD
ROE. ROE is expected to be 9.1% and 9.3% in FY10 and FY11 respectively.
Management. The management team comprises a group of professionals/strategists with hands-on experience in some of the international real estate markets. The management is also represented by the CEO of Frasers Centrepoint Ltd (Singapore) and the CEO of Frasers Centrepoint Asset Management Ltd, the manager of Frasers Centrepoint Trust Ltd in Singapore. Management appears to be market savvy and able to read the direction of the market well in advance. It takes proactive role in not only defending the trust’s earnings on the downside but also actively seeks to enhance the trust’s earnings as well.
Dividend. Dividend yield is still attractive at 8.9% compared to 8.4% for the sector’s average.
RECOMMENDATION
Given its relatively more defensive earnings (to the downside), the potential to ride on any significant and sustainable recovery in the retail sector, coupled with its attractive dividend yield of 8.9%, we continue to advocate a BUY on Hektar.
Income Statement (RMm)
FYE 31 Dec FY07 FY08 FY09 FY10fTurnover 78.3 84.1 87.7 87.8Growth (%) - 7.4 4.3 0.1EBIT 44.9 47.5 48.6 52.5Pretax 80.5 60.4 37.1 37.0Net Earnings 80.5 60.4 37.1 37.0FD EPS (sen) 25.2 18.9 11.6 11.5Growth (%) - -25.1 -38.5 -0.5NTA/Share (RM) 1.17 1.26 1.27 1.28Div (Gross) (sen) 10.7 10.2 10.3 10.8Div (Yield) (%) 8.8 8.4 8.4 8.9PER (x) 4.8 6.5 10.5 10.6P/NTA (x) 1.0 1.0 1.0 1.0
Balance Sheet (RMm)
FYE 31 Dec FY07 FY08 FY09Fixed Assets 559.4 713.4 720.0Current Assets 28.4 24.7 57.1Current Liabilities -29.4 -34.5 -36.8Others 0.0 0.0 0.0Total 558.4 703.6 740.3Share capital 320.0 320.0 320.0Reserves 54.4 82.1 86.3Shareholders’ Fund 374.4 402.1 406.3LT Liabilities 184.0 301.5 334.0Others 0.0 0.0 0.0Total 558.4 703.6 740.3Gross Debt 184.0 301.5 334.0Net Cash/ (Debt) -164.6 -283.3 -297.4
Cash Flow Statement (RMm)
FYE 31 Dec FY07 FY08 FY09Cash Flow from Ops 48.6 44.6 39.2Cash Flow from Investing -359.1 -127.7 -20.7Cash Flow from Financing 328.6 83.2 -0.1Net Increase in Cash 18.1 0.1 18.4Cash at Beginning of Year 0.0 18.1 18.2Other Changes 0.0 0.0 0.0Cash at End of Year 18.1 18.2 36.6
Hektar REIT

65
INVESTMENT MERITS
New enrolment, higher number of international students and campus expansion to drive topline
Collaborative partnerships with top global universities Expanding locally and venturing abroad Strong reputation as an institution dedicated to academic
excellence Strong and clean balance sheet to support expansion
COMPANY PROFILE
The company, which has been in the education field since 1986, focuses mainly on tertiary education. It has 7 academic faculties and 16 centres conducting a broad range of education programmes and training courses. In the 1980s, HELP was among the pioneers of foreign twinning and external programmes in Malaysia. In 1998, it was one of the first few colleges given approval to run “3+0” degree programmes awarded by foreign universities. The company has established collaborative relationships with various renowned foreign universities to provide a gateway for students to join credit transfer programmes. In 2004, HELP was awarded “university college” status by the Ministry of Higher Education (MOHE), which allows it to “create” and award its own self-titled degrees. In early 2007, HELP was listed on the Bursa Malaysia second board.
KEY HIGHLIGHTS
A reputable institution. HELP is indeed an institution that is not short on credentials. Given its high academic standards, we understand that HELP is the first university college in Malaysia that has received full accreditation from the CPA for its accounting courses. Its accounting graduates are sought after by the “Big 4” among accounting firms in Malaysia. Over the years, it has established collaborative partnerships with many foreign universities, through which it offers twinning and credit transfer programmes. It is worth noting that 20% of the top 100 global universities ranked by the Times Higher Education Supplement (THES) 2009 have partnerships with HELP. This bodes well for the company as global ranking is the key criterion considered by a student intending to pursue higher education.
Student capacity expansion. HELP’s student population currently exceeds 9,000, of which more than 20% are international students. We expect HELP to register stronger student growth in the next few years, supported by its on-going capacity expansion strategy. Its new campus in Fraser Business Park, due to begin operation this year, will offer professional courses. Meanwhile, its flagship campus in Subang 2 is expected to be ready by 2011/2012, and will on completion accommodate about 12,000 students.
HELP InternationalMaster of Excellence
Target : RM2.40Price : RM2.16
EDUCATION
Stock Profile/StatisticsBloomberg Ticker HELP MKIssued Share Capital (m) 88.8Market Capitalisation (RMm) 191.852 week H | L Price (RM) 2.29 | 1.15Average Volume (3m) ‘000 34.3YTD Returns (%) 12.5Net gearing (x) Net CashAltman Z-Score 3.73ROCE/WACC 2.1Beta (x) 0.6Book Value/share (RM) 1.01
Major Shareholders (%)Selangor Properties 51.0Acacia Partners 7.21
Share Performance (%)Month Absolute Relative1m 14.4 11.0 3m 13.8 11.5 6m 45.3 35.0 12m 91.3 28.4
6-month Share Price Performance
2.2
2.1
2.0
1.9
1.8
1.7
1.6
1.5
1.4Oct-09 Nov-09 Dec-09 Jan-10 Feb-10 Mar-10 Apr-10

66
Resilient earnings. With education deemed a necessity, HELP’s financial performance has not been affected by the recent economic slowdown. It still posted strong topline and bottomline growth for FY09 despite the challenging economic landscape then. This proves the resilience of HELP’s business, which has been bolstered by growing demand for private education regardless of economic condition, partly attributed to limited capacity in public universities as well as higher cost of education abroad. With private higher education no longer seen as a luxury, the growing middle class group as well as financial assistance from both government and private education funds will add more fuel to demand for private education in the country.
Spreading its wings. HELP has been diversifying its business by venturing overseas and widening its course offerings to cater to CEP and vocational courses. It has been appointed by the Saudi Arabian authorities to conduct short-term executive courses and is eyeing vocational training courses in Cambodia. HELP also holds rights as the exclusive partner to set up A-Level centres across Asia, with specific focus on China. The company has also successfully built up a presence in Vietnam and Indonesia through franchising and licensing. We believe its overseas strategy via franchising and licensing enables it to enhance its reputation and branding with minimum risk.
Favorable industry dynamics. The Government’s commitment to enhancing human capital development will benefit the education industry as a whole. Over the years, the Government has significantly increased its allocation for human capital development, as can be seen through the bigger allocation under the 9MP as well as the economic stimulus packages. We expect a larger allocation for the education sector in the upcoming 10MP, which we see as being in line with Government efforts to transform Malaysia into a high income country.
COMPANY REPORT CARD
ROE. We are projecting an ROE of slightly above the mid-teens for the next 2 financial years.
Management. The company is spearheaded by its co-founder, Datuk Dr. Paul Chan, who is an experienced economist and educationist. He was previously on the Panel of Economists advising the Prime Minister’s Department and has been consultant to many private colleges in Asia. He was also Chairman of the KLSE Composite Index for 10 years.
Dividend. HELP declared gross dividends of 3 sen for FY08 and FY09. Based on management guidance, we are projecting for the same quantum being paid for FY10.
RECOMMENDATION
HELP is the most profitable listed education stock in Malaysia. Conservatively, we are projecting about 19% to 24% earnings growth for FY10 and FY11. Our target price of RM2.40 is based on the residual income model, which is the sum of 3 components; (i) its current book value, (ii) present value of 7 years’ residual income stream; and (iii) a terminal value at 5% growth. HELP’s forward multiples are also undemanding compared with the regional average of more than 20x.
Income Statement (RMm)
FYE 31 Oct FY08 FY09 FY10f FY11fTurnover 86.5 96.6 114.6 135.2Growth (%) 40.2 11.6 18.6 18.0EBIT 16.1 21.8 27.6 33.8Pretax 16.1 21.8 27.6 33.8Net Earnings 11.8 15.5 18.5 23.0FD EPS (sen) 13.3 17.4 20.8 25.9Growth (%) 22.1 30.9 19.6 24.4NTA/Share (RM) 1.09 1.11 1.13 1.35Div (Gross) (sen) 3.0 3.0 3.4 3.4Div (Yield) (%) 2.8 1.4 1.6 1.6PER (x) 8.0 12.4 10.3 10.3P/NTA (x) 1.3 2.3 1.9 1.6
Balance Sheet (RMm)
FYE 31 Oct FY07 FY08 FY09Fixed Assets 44.0 51.4 50.4Current Assets 67.4 85.0 107.7Current Liabilities 36.3 51.4 55.6Others 0.0 0.0 0.0Total 75.1 85.0 102.5Share capital 44.4 44.4 44.4Reserves 28.8 38.6 54.5Shareholders’ Fund 73.2 83.0 98.9LT Liabilities 1.9 2.0 3.6Others 0.0 0.0 0.0Total 75.1 85.0 102.5Gross Debt 0.0 0.0 0.0Net Cash/ (Debt) 57.7 74.0 98.3
Cash Flow Statement (RMm)
FYE 31 Oct FY06 FY07 FY08Cash Flow from Ops 17.4 24.8 5.1Cash Flow from Investing 8.8 -6.5 -5.6Cash Flow from Financing 9.9 -2.0 0.0Net Increase in Cash 36.2 16.3 -0.5Cash at Beginning of Year 21.5 57.7 87.7Other Changes 0.0 0.0 0.0Cash at End of Year 57.7 74.0 87.2
HELP International

67
INVESTMENT MERITS
Beneficiary of strong infra spending in Sarawak Contractor with niche expertise in marine engineering Likely to bag subsequent packages of the Kuching Wastewater
job Property sales could potentially surprise RM1.61 TP based on 12x mid CY10 earnings
COMPANY PROFILE
Hock Seng Lee (HSL) started off as a partnership in the mid-60s managed by 3 brothers from the Yii/Yu family. From a small one ship sand dredging operator, HSL has grown into a leader in marine engineering, civil engineering and construction. HSL also engages in property development, mainly in residential projects. On 10 June 1996, HSL became the only Sarawakian company listed on the construction sector of the Main Board. Over a span of 30 years, HSL has transformed about 6,000 acres of swampland in Sarawak into industrial parks, new townships, ports and airports. Apart from construction activities, HSL is also involved in property development.
KEY HIGHLIGHTS
Riding on the Sarawak theme. Currently, East Malaysia has the highest number of poor households in the nation. We feel that politically the current administration needs to ensure greater development within East Malaysia as these states played an important role in Barisan’s 2008 General Election win. Part of this development, we believe, will be fuelled by greater infrastructure spending. The best way to play this theme is via Sarawak-based contractors as the state is expected to hold its elections by early-mid 2011. We envisage an increase in jobs flow moving closer to the polls. Home grown Sarawak-based contractors like HSL are the main beneficiaries as jobs within the state are usually awarded back to them.
Marine engineering specialist. Given that Sarawak is the swampiest state in Malaysia, most jobs in there require some degree of marine engineering. HSL is a contractor with niche specialty in marine engineering encompassing works such as land reclamation and dredging. HSL owns an extensive range of advanced (and expensive) marine based heavy equipment. While HSL also engages in other general construction works, the swampy terrain of Sarawak gives it an edge over its competitors when it comes to such jobs.
Hock Seng LeeConsistently Delivering
Target : RM1.61Price : RM1.56
CONSTRUCTION
Stock Profile/StatisticsBloomberg Ticker HSL MKIssued Share Capital (m) 582.7Market Capitalisation (RMm) 885.752 week H | L Price (RM) 1.59 | 0.52Average Volume (3m) ‘000 1328.4YTD Returns (%) 43.4Net gearing (x) Net CashAltman Z-Score 3.59ROCE/WACC 1.4Beta (x) 1.2Book Value/share (RM) 0.44
Major Shareholders (%)Hock Seng Lee Enterprise 53.0Skim Amanah Saham 10.4EPF 6.5
Share Performance (%)Month Absolute Relative1m 13.0 7.9 3m 40.5 34.0 6m 45.8 31.1 12m 205.6 99.1
6-month Share Price Performance
1.6
1.5
1.4
1.3
1.2
1.1
1.0
0.9Oct-09 Nov-09 Dec-09 Jan-10 Feb-10 Mar-10 Apr-10
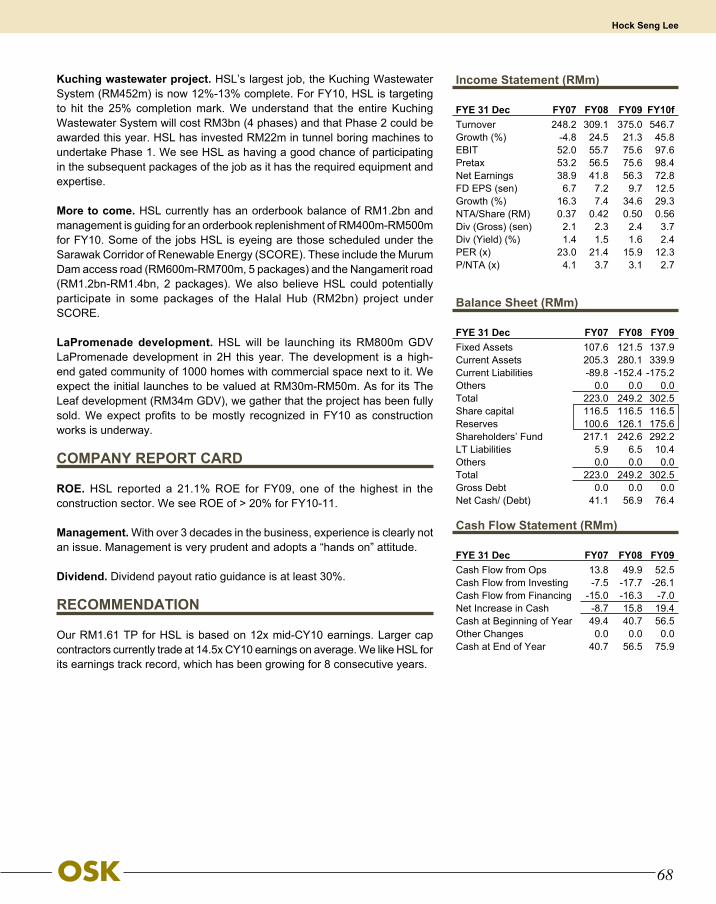
68
Kuching wastewater project. HSL’s largest job, the Kuching Wastewater System (RM452m) is now 12%-13% complete. For FY10, HSL is targeting to hit the 25% completion mark. We understand that the entire Kuching Wastewater System will cost RM3bn (4 phases) and that Phase 2 could be awarded this year. HSL has invested RM22m in tunnel boring machines to undertake Phase 1. We see HSL as having a good chance of participating in the subsequent packages of the job as it has the required equipment and expertise.
More to come. HSL currently has an orderbook balance of RM1.2bn and management is guiding for an orderbook replenishment of RM400m-RM500m for FY10. Some of the jobs HSL is eyeing are those scheduled under the Sarawak Corridor of Renewable Energy (SCORE). These include the Murum Dam access road (RM600m-RM700m, 5 packages) and the Nangamerit road (RM1.2bn-RM1.4bn, 2 packages). We also believe HSL could potentially participate in some packages of the Halal Hub (RM2bn) project under SCORE.
LaPromenade development. HSL will be launching its RM800m GDV LaPromenade development in 2H this year. The development is a high-end gated community of 1000 homes with commercial space next to it. We expect the initial launches to be valued at RM30m-RM50m. As for its The Leaf development (RM34m GDV), we gather that the project has been fully sold. We expect profits to be mostly recognized in FY10 as construction works is underway.
COMPANY REPORT CARD
ROE. HSL reported a 21.1% ROE for FY09, one of the highest in the construction sector. We see ROE of > 20% for FY10-11.
Management. With over 3 decades in the business, experience is clearly not an issue. Management is very prudent and adopts a “hands on” attitude.
Dividend. Dividend payout ratio guidance is at least 30%.
RECOMMENDATION
Our RM1.61 TP for HSL is based on 12x mid-CY10 earnings. Larger cap contractors currently trade at 14.5x CY10 earnings on average. We like HSL for its earnings track record, which has been growing for 8 consecutive years.
Income Statement (RMm)
FYE 31 Dec FY07 FY08 FY09 FY10fTurnover 248.2 309.1 375.0 546.7Growth (%) -4.8 24.5 21.3 45.8EBIT 52.0 55.7 75.6 97.6Pretax 53.2 56.5 75.6 98.4Net Earnings 38.9 41.8 56.3 72.8FD EPS (sen) 6.7 7.2 9.7 12.5Growth (%) 16.3 7.4 34.6 29.3NTA/Share (RM) 0.37 0.42 0.50 0.56Div (Gross) (sen) 2.1 2.3 2.4 3.7Div (Yield) (%) 1.4 1.5 1.6 2.4PER (x) 23.0 21.4 15.9 12.3P/NTA (x) 4.1 3.7 3.1 2.7
Balance Sheet (RMm)
FYE 31 Dec FY07 FY08 FY09Fixed Assets 107.6 121.5 137.9Current Assets 205.3 280.1 339.9Current Liabilities -89.8 -152.4 -175.2Others 0.0 0.0 0.0Total 223.0 249.2 302.5Share capital 116.5 116.5 116.5Reserves 100.6 126.1 175.6Shareholders’ Fund 217.1 242.6 292.2LT Liabilities 5.9 6.5 10.4Others 0.0 0.0 0.0Total 223.0 249.2 302.5Gross Debt 0.0 0.0 0.0Net Cash/ (Debt) 41.1 56.9 76.4
Cash Flow Statement (RMm)
FYE 31 Dec FY07 FY08 FY09Cash Flow from Ops 13.8 49.9 52.5Cash Flow from Investing -7.5 -17.7 -26.1Cash Flow from Financing -15.0 -16.3 -7.0Net Increase in Cash -8.7 15.8 19.4Cash at Beginning of Year 49.4 40.7 56.5Other Changes 0.0 0.0 0.0Cash at End of Year 40.7 56.5 75.9
Hock Seng Lee

69
INVESTMENT MERITS
Leading frozen food producer in Malaysia Operation in China to drive future earnings Expanding export market to propel earnings
COMPANY PROFILE
Kawan Food (KFB) started in the late 1970s as a small business supplying home-made pastry products to groceries and supermarkets in the Klang Valley. The company was listed on the Second Board of Bursa Malaysia on July 2005. Today, KFB is a leading manufacturer of Ready-to-Serve (RTS) frozen foods in Malaysia, commanding about 60% of the domestic frozen food market, leaving the remainder to be shared among 11 other players. We view the competition as manageable as the closest local rivals like Kart Food Industries SB and Tee Yih Jia Manufacturing SB, with their respective brand names Kart’s and Springhome, are only a quarter the size of KFB. Furthermore, all its competitors are either private companies or small and medium-sized enterprises. Its extensive automated production processes make for superior production efficiency and quality, which enhance KFB’s competitive edge. Nonetheless, on the international front, KFB inevitably faces tough competition from bigger players that possess greater financial clout and marketing resources.
KEY HIGHLIGHTS
In talks with new suppliers. KFB’s China operation, Kawan Food (Nantong) Co Ltd, which commenced operation in the last quarter of 2009, will progressively commission by the end of this year. The Nantong plant aims to supply to private labels pastry products that are different from common frozen pastry. Currently, it manufactures frozen pastry products for a big Chinese company, DaQian, and is in negotiations with other large potential customers. The company is also focusing on the halal and vegetarian food segments. With a built-up of 16,000 sq m and utilization of 70%-80% of the first phase capacity, KFB Nantong is expected to break even by the end of 2010. We believe the risk of competition is minimal given the quality of KFB products as it has obtained international certification such as HACCP and British Retail Consortium (BRC). We think this is a potential growth area as we see a growing fad for frozen food among the urban Chinese. Apart from that, KFB recently employed a new CEO, previously with Unilever and Fonterra, to take the group to greater heights.
Kawan FoodA Fast Friend in China
Target : RM1.64Price : RM1.27
CONSUMER
Stock Profile/StatisticsBloomberg Ticker KFB MKIssued Share Capital (m) 120.0Market Capitalisation (RMm) 152.452 week H | L Price (RM) 1.62 | 0.65Average Volume (3m) ‘000 27.8YTD Returns (%) -1.6Net gearing (x) Net CashAltman Z-Score 5.50ROCE/WACC 1.3Beta (x) -Book Value/share (RM) 0.69
Major Shareholders (%)Gan Thiam Chai 33.3Goshenite Ltd 24.0Gan Thiam Hock 8.4
Share Performance (%)Month Absolute Relative1m -4.5 -1.8 3m -10.9 -9.0 6m -14.7 -18.4 12m 52.1 10.6
6-month Share Price Performance
1.7
1.6
1.5
1.4
1.3
1.2
1.1
1.0Oct-09 Nov-09 Dec-09 Jan-10 Feb-10 Mar-10 Apr-10

70
Innovation to variety of products. Despite being known for its traditional West Asian flatbreads and pastries, KFB continuously innovates on its products and develops machines that produce better quality pastries that mimic hand-made pastries. For instance, it invested RM70m-RM80m on a pastry machine which has the capacity to produce 5000 pieces of paratha per hour, which can stretch the dough into thin membrane that replicates hand-made paratha. With such investments, KFB can utilize the machine to produce a variety of products such as roti bom, filo pastry and others which were previously impossible.
Promoting healthy food. Through R&D, KFB has come up with products with the right blend of taste, texture and flavour under the brand VEAT, targeting the health conscious. VEAT provides consumers with a healthy alternative to meat, which is widely accepted in Europe and North America. The product is halal and cholesterol free. Since their introduction, the products have received encouraging response from local customers and vegetarians.
Expanding export market. KFB will continue to expand its export market regionally as well as to the Middle East. Its products are certified halal by the Malaysian Islamic Development Department and cater to Muslims. Moreover, its HACCP certification will ensure that its products can be sold in developed countries such as the US.
COMPANY REPORT CARD
ROE. Kawan Food’s ROE has been a healthy 14% to 18%. Going forward, we expect KFB to register ROE of above 17% for the next 3 years.
Management. The Managing Director, T.C. Gan, who is also KFB co-founder, has been in the food manufacturing industry for more than 30 years, Given its wide distribution network, we believe that KFB would be able to maintain its lead with minimal threat from its rivals. In addition, KFB recently employed a new CEO, previously from Unilever and Fonterra, to manage its Nantong plant.
Dividend. As the company is in the midst of expansion, we do not expect a high dividend payout over the next few yeas. Hence, we think it will pay a dividend of 2.0 sen per share, translating into a gross yield of 1.7%.
RECOMMENDATION
We are ascribing a higher target price of RM1.64 using the composite of 12.5x PER over FY10 EPS. We see KFB as a long-term investment as its China operation, with more than double its current production capacity, can potentially generate strong sales given the robust local demand.
Income Statement (RMm)
FYE 31 Dec FY07 FY08 FY09 FY10fTurnover 60.4 75.2 87.6 104.1Growth (%) 14.9 24.6 16.5 18.8EBIT 9.5 12.4 18.3 20.2Pretax 9.2 12.1 17.7 19.6Net Earnings 8.2 9.5 13.6 15.7FD EPS (sen) 10.3 7.9 11.3 13.1Growth (%) 0.0 -23.2 42.8 15.6NTA/Share (RM) 0.50 0.59 0.69 0.81Div (Gross) (sen) 3.0 1.4 0.0 2.0Div (Yield) (%) 2.4 1.1 0.0 1.6PER (x) 18.5 24.1 16.9 9.7P/NTA (x) 2.5 2.1 1.8 1.6
Balance Sheet (RMm)
FYE 31 Dec FY07 FY08 FY09Fixed Assets 42.6 58.6 67.6Current Assets 31.8 31.3 41.4Current Liabilities -8.9 -14.4 -18.0Others 0.0 0.0 0.0Total 65.4 75.5 91.0Share capital 40.0 60.0 60.0Reserves 20.4 11.5 23.1Shareholders’ Fund 60.4 71.5 83.1LT Liabilities 5.0 3.9 7.9Others 0.0 0.0 0.0Total 65.4 75.5 91.0Gross Debt 3.3 2.4 8.0Net Cash/ (Debt) 8.5 7.2 8.6
Cash Flow Statement (RMm)
FYE 31 Dec FY07 FY08 FY09Cash Flow from Ops 12.6 15.2 16.5Cash Flow from Investing -7.8 -17.1 -12.7Cash Flow from Financing -3.5 -1.0 3.6Net Increase in Cash 1.3 -2.9 7.4Cash at Beginning of Year 10.6 11.8 9.5Other Changes 0.0 0.5 -0.3Cash at End of Year 11.8 9.5 16.6
Kawan Food

71
INVESTMENT MERITS
Leading can manufacturer in Malaysia Resilient demand for can division Spreading its wings to Vietnam Capitalising on Malaysia’s Halal hub status
COMPANY PROFILE
Kian Joo Can Factory (KJC) was founded by See Boon Tay in 1956. The family tussle over control that started in the early 90s remains unresolved to this day. The business decisions since then have been made independently by the company’s board, whose members have no relationship with the family. Kian Joo Holdings, the private holding company of the See Family with a 34.6% stake in KJC, has been under liquidation for the last 10 years. This process is part of the resolution of the tussle.
KJC is the largest packaging company in Malaysia, with its key products being general cans, aluminium cans, corrugated cartons and PET. About 50% to 60% of the slim cans revenue is from exports to the Middle East, Australia, America and the Asia Pacific region. The company also manufactures corrugated cartons via its 55%-owned local subsidiary, Box-Pak (M) Bhd. The company ventured into Vietnam in 2002 for the production of general cans and corrugated cartons.
KEY HIGHLIGHTS
Resilient demand for cans. The can division is the group’s major contributor. As the company mainly supplies cans to food and beverage (F&B) manufacturers, the demand for cans is resilient. As demand for processed food like sardines and baked beans is usually inelastic, the company tends to see higher sales as these items are relatively cheaper and easy to prepare. Furthermore, with aluminium prices having plunged from their peak, KJCF will benefit from margin expansion as its raw materials account for approximately 65% of total operating cost.
Positive contribution from Vietnam. Its Vietnam operation contributes approximately 20% of group earnings. It currently supplies to milk producers, mainly to international companies like Dutch Lady and Vinamilk. Going forward, we believe that KJC’s efforts to ramp up sales domestically and internationally, especially via its new joint venture with Nihon Canpack which commenced in 4Q last year to co-pack coffee drinks, will fuel future growth given the relative maturity of its domestic market.
Kian Joo Can FactoryExport Markets Reach Out For More Cans
Target : RM1.13Price : RM1.24
CONSUMER
Stock Profile/StatisticsBloomberg Ticker KJC MKIssued Share Capital (m) 444.2Market Capitalisation (RMm) 550.852 week H | L Price (RM) 1.34 | 1.1Average Volume (3m) ‘000 329.0YTD Returns (%) 6.0Net gearing (x) 0.1Altman Z-Score 3.17ROCE/WACC 0.7Beta (x) 0.7Book Value/share (RM) 1.84
Major Shareholders (%)Kian Joo Holdings 34.6EPF 20.7
Share Performance (%)Month Absolute Relative1m 0.0 -2.6 3m 4.2 0.9 6m 5.1 -3.2 12m 5.1 -28.7
6-month Share Price Performance
1.3
1.2
1.1Oct-09 Nov-09 Dec-09 Jan-10 Feb-10 Mar-10 Apr-10

72
Halal hub for the Middle East? The food safety issue in China following the milk scandal has worked to the advantage of Malaysian players as Malaysia is known as an Organisation of the Islamic Conference (OIC)-certified halal hub in the region. A growing Muslim population and surging demand for halal products worldwide - with a huge potential market of US$500bn to US$2trn - presents new opportunities for KJCF as the complementary food industry can cater to this growing market, which translates into higher can sales for KJCF.
COMPANY REPORT CARD
ROE. Going forward, we expect ROE to recover slightly on the back of stronger demand, maiden earnings contribution from its new Vietnam box plant and moderating raw material prices.
Management. Despite the long-standing family tussle of more than 10 years, the company has consistently performed, as can be seen from its earnings growth of 3% to 56%, except for a contraction in 2006 when it was hit by high raw material costs. However, we are uncertain over the management structure following the sale of a 34.64% stake in Kian Joo Holdings (KJH).
Dividend. We expect KJC to maintain its average dividend payout of approximately 40%, translating into a gross yield of 6.0% p.a at the current share price.
RECOMMENDATION
We are ascribing a target price of RM1.13 based on 8x PER over FY10 EPS. We maintain our Neutral call.
Income Statement (RMm)
FYE 31 Dec FY07 FY08 FY09 FY10fTurnover 787.2 875.5 875.6 877.4Growth (%) 19.8 11.2 0.0 0.2EBIT 67.7 97.0 68.7 88.6Pretax 60.9 90.2 68.7 88.7Net Earnings 45.0 69.5 48.9 61.2FD EPS (sen) 10.1 15.6 11.0 14.0Growth (%) 55.5 54.4 -29.7 27.3NTA/Share (RM) 1.45 1.55 1.84 1.92Div (Gross) (sen) 5.0 6.3 4.4 7.5Div (Yield) (%) 4.0 5.1 3.5 6.0PER (x) 12.2 7.9 11.3 8.8P/NTA (x) 0.9 0.8 0.7 0.6
Balance Sheet (RMm)
FYE 31 Dec FY07 FY08 FY09Fixed Assets 478.3 549.6 669.5Current Assets 458.9 515.5 504.4Current Liabilities -195.8 -260.0 -224.1Others 0.0 0.0 0.0Total 741.4 805.1 949.7Share capital 111.0 111.0 111.0Reserves 535.5 580.0 708.4Shareholders’ Fund 646.5 691.0 819.4LT Liabilities 65.1 61.8 64.1Others 29.8 52.3 66.2Total 741.4 805.1 949.7Gross Debt 152.9 201.8 140.8Net Cash/ (Debt) 125.7 180.4 114.5
Cash Flow Statement (RMm)
FYE 31 Dec FY07 FY08 FY09Cash Flow from Ops 82.7 75.4 -150.5Cash Flow from Investing -43.3 -96.6 -55.1Cash Flow from Financing -72.7 27.5 -82.7Net Increase in Cash -33.3 5.1 15.0Cash at Beginning of Year 79.4 45.8 52.6Other Changes 0.0 0.5 -0.7Cash at End of Year 45.8 52.6 64.5
Kian Joo Can Factory

73
INVESTMENT MERITS
Manufacturer with a balanced 60:40 mix of natural rubber and nitrile gloves
One of the world’s largest powder-free medical glove manufacturers
Plant utilization consistently exceeds 90% Moving towards production of higher margin gloves Buy with TP of RM11.30 based on PER of 14x FY11 earnings
COMPANY PROFILE
Kossan Rubber was listed on the Bursa Malaysia Main Board in 1996. The company was founded in 1979 by KS Lim, a qualified chemist-engineer with more than 29 years of hands-on experience in the rubber glove industry. He is currently the company MD and CEO. Kossan is principally engaged in the manufacture of medical examination gloves mainly for the pharmaceutical industry and makes technical rubber products (TRP) for the automotive, marine, construction and civil industries.
KEY HIGHLIGHTS
A balanced product mix. Kossan has a more balanced 60:40 mix of natural rubber and nitrile gloves, whereas most of its peers are more focused on the extreme end of the mix. Having this balance ensures earnings sustainability as it gives the company more flexibility in changing its glove mix when demand shifts since it has the necessary production lines and distribution arms, as well as markets to sell to.
One of world’s largest powder-free medical glove makers. Kossan aims to have an installed capacity of 14.5bn pieces of gloves p.a. by end-2010. Powder-free gloves are expected to make up about 70%-80% of its total production given the strong demand from the healthcare industry, while the remaining 30% will comprise powdered gloves. Producing powdered gloves is more of providing a service to its buyers because most of the MNCs in the healthcare sector distribute all product ranges. Also, we understand that Kossan’s powdered gloves are of medical grade and are used in developed countries.
Kossan RubberA Balanced Product Mix
Target : RM11.30Price : RM8.25
RUBBER GLOVES
Stock Profile/StatisticsBloomberg Ticker KRI MKIssued Share Capital (m) 159.9Market Capitalisation (RMm) 1,318.952 week H | L Price (RM) 8.32 | 2.89Average Volume (3m) ‘000 570.1YTD Returns (%) 51.9Net gearing (x) 0.5Altman Z-Score 3.93ROCE/WACC 1.3Beta (x) 1.1Book Value/share (RM) 2.23
Major Shareholders (%)Kossan Holdings S/B 51.8Asian Small Companies 4.9
Share Performance (%)Month Absolute Relative1m 11.7 8.0 3m 41.1 33.6 6m 83.5 65.4 12m 180.6 90.0
6-month Share Price Performance
8.7
8.1
7.5
6.9
6.3
5.7
5.1
4.5Oct-09 Nov-09 Dec-09 Jan-10 Feb-10 Mar-10 Apr-10

74
Plant utilisation consistently exceeds 90%. Compared with its peers, we understand that Kossan’s plants are the most highly utilised in Malaysia. This is mainly because: 1) 99% of its gloves are for the medical segment, which is resilient to the negative effects of the global economic recession, 2) management has been prudent in capacity expansion, which has led to higher production efficiency, 3) management works closely with its customers to gauge demand and type of gloves required going forward, and 4) management always looks at ways to upgrade its plants to achieve better production results instead of merely increasing the number of production lines.
Moving towards higher margin gloves. Kossan’s strategy is slightly different from the other rubber glove manufacturers in that it focuses on enhancing its gloves to improve its margins as against concentrating on capacity expansion. Its recently introduced more advanced glove, known as the ‘CheMax’ range which provides more matchable comfort and fit than natural rubber gloves, has given the company gross margin that is 1%-2% higher than that from conventional nitrile gloves.
COMPANY REPORT CARD
ROE. Since FY05, Kossan has been consistently delivering ROE of more than 20%. Going forward, we see this being maintained given the anticipated strong demand for medical rubber gloves on increasing healthcare and hygiene awareness among the global population.
Management. The company is closely run by the founder, KS Lim who is a chemist-engineer himself. Also, we understand that he is very passionate and hands on in rubber glove development despite holding a position as MD. Moreover, he has been prudent with his expansion plan over the past few years, yielding good results especially when the economy turned negative.
Dividend. Kossan has been consistently paying dividends since its listing in 1996. Going forward, we expect it to continuously reward its shareholders with generous dividends owing to good performance in the coming months and we believe the payout ratio would be more than 15%.
RECOMMENDATION
Maintain Buy. Our target price for Kossan is RM11.30 based on PER of 14x FY11 earnings. We like the company for having a balance product mix, conservative management, efficient plant utilisation rate and producing 99% gloves for the medical segment which has proven to be resilient to the global economic recession.
Income Statement (RMm)
FYE 31 Dec FY07 FY08 FY09 FY10fTurnover 702.6 893.1 837.0 1056.2Growth (%) 22.4 27.1 -6.3 26.2EBIT 67.6 81.2 148.0 154.5Pretax 58.3 73.1 87.4 147.6Net Earnings 55.1 59.3 66.8 119.1FD EPS (sen) 34.5 37.1 41.8 74.5Growth (%) 39.2 7.5 12.7 78.3NTA/Share (RM) 1.57 1.87 2.23 2.87Div (Gross) (sen) 8.0 10.0 12.0 15.0Div (Yield) (%) 1.0 1.2 1.5 1.8PER (x) 23.9 22.3 19.7 11.1P/NTA (x) 5.3 4.4 3.7 2.9
Balance Sheet (RMm)
FYE 31 Dec FY07 FY08 FY09Fixed Assets 284.9 362.3 361.4Current Assets 252.0 291.2 328.2Current Liabilities -242.8 -288.9 -261.9Others 0.0 0.0 0.0Total 294.1 364.6 427.7Share capital 79.9 79.9 79.9Reserves 171.9 220.0 279.0Shareholders’ Fund 251.8 299.9 359.0LT Liabilities 42.3 64.7 68.8Others 0.0 0.0 0.0Total 294.1 364.6 427.7Gross Debt 172.2 177.7 171.1Net Cash/ (Debt) -144.7 -162.6 -148.5
Cash Flow Statement (RMm)
FYE 31 Dec FY07 FY08 FY09Cash Flow from Ops 67.4 68.7 54.3Cash Flow from Investing -52.3 -65.8 -32.1Cash Flow from Financing 4.6 -9.4 -17.6Net Increase in Cash 19.7 -6.5 4.7Cash at Beginning of Year -0.8 18.4 11.8Other Changes 0.0 0.0 0.0Cash at End of Year 19.0 11.8 16.5
Kossan Rubber

75
INVESTMENT MERITS
A key intra urban highway in the Klang Valley Traffic volume to be resilient to economic slowdown Long term traffic volume insensitive to toll hikes Stake in SPRINT may have been overlooked Decent yields of >5% for FY10-11. RM3.44 TP based on 20% discount to its FCFE valuation
COMPANY PROFILE
LITRAK is the concessionaire for the Damansara-Puchong Highway (LDP). The company is tasked with operating and maintaining the LDP for another 21 years, after which the concession expires in August 2031. Unlike most highways in the Klang Valley which transverse in an east-west direction, the LDP flows from north to south. Another unique characteristic is that it operates as an open toll. As there are many entry and exit points between toll plazas, open tolls result in “traffic leakages” (i.e. some uses do not pay). There are 4 tolls along the 40km LDP, namely the Penchala toll, PJ Selatan, Puchong Barat and Puchong Selatan. Aside the LDP, LITRAK also has a 50% stake in the SPRINT Highway. SPRINT connects the populated areas of Damansara, Taman Tun Dr. Ismail, Mont Kiara and Sri Hartamas.
KEY HIGHLIGHTS
A key intra-urban highway. The LDP connects the densely populated Damansara, Kelana Jaya, Sunway and Puchong. Although not directly running through, the LDP also provides access points into Kepong, Sg. Buloh and Subang Jaya. The highway also provides connectivity to major highways with heavy traffic such as the Federal Highway and Middle Ring Road 2.
Traffic volume resilient. We reckon that traffic volume along the LDP will be resilient to the economic slowdown given its profile as a mature highway and importance in connecting urban areas in the Klang Valley in a north-south alignment. We expect traffic volume to grow steadily at low single digits for the remaining tenure of its concession. The upside to traffic growth would be stronger population growth within the Puchong townships leading to higher tollable traffic for its Puchong Barat and Selatan toll plazas. The LDP is estimated to have a standard Monday to Friday (SMF) tollable traffic of 461,000 vehicles. Key risks to traffic volume would be the reduction in fuel subsidies, which leads to higher pump prices.
LITRAK HoldingsA Defensive Stock
Target : RM3.44Price : RM3.05
TOLL CONCESSIONAIRES
Stock Profile/StatisticsBloomberg Ticker LTK MKIssued Share Capital (m) 499.9Market Capitalisation (RMm) 1,504.852 week H | L Price (RM) 3.19 | 2.11Average Volume (3m) ‘000 385.4YTD Returns (%) 7.9Net gearing (x) 2.6Altman Z-Score 1.35ROCE/WACC 1.3Beta (x) 0.9Book Value/share (RM) 0.84
Major Shareholders (%)Gamuda 46.0EPF 5.6Prudential Unit Trust 2.4
Share Performance (%)Month Absolute Relative1m -0.3 -5.7 3m 9.5 2.4 6m 11.4 -0.8 12m 52.4 -5.5
6-month Share Price Performance
3.2
3.1
3.0
2.9
2.8
2.7
2.6Oct-09 Nov-09 Dec-09 Jan-10 Feb-10 Mar-10 Apr-10

76
Next toll hike in 2011. The current RM1.60 toll for Class 1 vehicles (mostly cars) is 23.8% lower than the stipulated RM2.10 rate in the Concession Agreement (CA). For this shortfall, LITRAK receives compensation from the government. Toll rates are expected to revert to the RM2.10 level as per the CA beginning 2011. Historical evidence suggests that traffic volume should only experience a temporary contraction and recover subsequently.
Value in SPRINT overlooked. We believe the market has ascribed little value to 50% owned SPRINT given that is still in the red. This myopic view is unjustified given that SPRINT connects the most affluent areas within the Klang Valley (Damansara, Taman Tun Dr. Ismail, Mont Kiara and Sri Hartamas). Our projections indicate that SPRINT will break even by FY13. We expect traffic volume growth on the Damansara Link to be minimal, with growth mainly from the Penchala and Kerinchi Link.
COMPANY REPORT CARD
ROE. Litrak recorded ROE of 15.2% in FY09 compared to 11.8% in FY08, mainly due to its capital repayment exercise. For FY10, we are projecting an even higher ROE of 20.6% as its equity base will now fully reflect the capital repayment.
Management. Litrak is a professionally run company with Gamuda as its major shareholder.
Dividend. We think Litrak can afford to pay a DPS of RM0.17 and RM0.18 for FY10 and FY11 translating to yields of 5.8%-6.1%
RECOMMENDATION
Given the concessionary nature of Litrak, we are using the Free Cash Flow to Equity as the valuation methodology. The FCFE generated from LDP is discounted at a 10% equity cost and SPRINT at 11% given its loss making status. The present value of FCFE is then added to its cash balance. Our FCFE methodology yields a value of RM4.30/ share. We apply 20% discount to our FCFE derived valuation in arriving at our RM3.44 TP.
Income Statement (RMm)
FYE 31 March FY08 FY09 FY10f FY11fTurnover 293.0 297.5 307.5 301.4Growth (%) 14.5 1.5 3.3 -2.0EBIT 228.6 244.1 243.8 241.5Pretax 142.7 145.0 132.0 134.8Net Earnings 104.8 102.1 90.4 97.0FD EPS (sen) 21.0 20.5 18.2 19.5Growth (%) 4.3 -2.5 -11.4 7.3NTA/Share (RM) 1.86 0.84 0.91 0.99Div (Gross) (sen) 12.0 25.0 17.0 18.0Div (Yield) (%) 0.0 0.1 0.1 0.1PER (x) 14.5 14.9 16.8 15.7P/NTA (x) 1.6 3.6 3.3 3.1
Balance Sheet (RMm)
FYE 31 March FY07 FY08 FY09Fixed Assets 1863.6 1839.6 1868.0Current Assets 158.6 240.6 384.3Current Liabilities -150.5 -138.6 -86.1Others 0.0 0.0 0.0Total 1871.7 1941.6 2166.2Share capital 488.8 492.1 99.4Reserves 361.5 434.9 320.7Shareholders’ Fund 850.3 927.0 420.1LT Liabilities 1021.4 1014.5 1746.1Others 0.0 0.0 0.0Total 1871.7 1941.6 2166.2Gross Debt 890.0 797.5 1453.2Net Cash/ (Debt) -776.0 -567.1 -1075.2
Cash Flow Statement (RMm)
FYE 31 March FY07 FY08 FY09Cash Flow from Ops 306.2 231.3 335.9Cash Flow from Investing 3.3 -67.1 -31.6Cash Flow from Financing -316.5 -16.6 -186.3Net Increase in Cash -7.0 147.6 118.0Cash at Beginning of Year 116.9 227.9 109.9Other Changes 0.0 0.0 0.0Cash at End of Year 109.9 375.5 227.9
LITRAK Holdings

77
INVESTMENT MERITS
Masteel has weathered various steel cycles, with only a small loss in FY09
RM300m expansion to boost downstream capacity Direct beneficiary of stimulus packages implemented
worldwide Huge untapped export market, especially semi finished steel Fair value RM1.45, derived from a blended 6x EPS and 0.59x NTA/
share on FY10 numbers
COMPANY PROFILE
Malaysia Steel Works (Masteel) commenced operation in 1971 producing mild steel bars with an annual capacity of only 30,000 tonnes per year (tpy). In 1989, the company embarked on an extensive upgrading programme to replace its old mill with a modern semi-continuous mill utilizing the latest technology from Germany and Britain, which increased capacity at its rolling mill. In recognition of its commitment to quality management, the mill attained ISO 9002 certification towards end-1997. Subsequently, in tandem with its management’s vision, a new billet plant in Bukit Raja started commercial production in 1998 as one of the most modern meltshops in the region at the time. The company takes pride in its electronic arc furnace featuring ultra-high power (UHP) transformers, eccentric bottom tapping (EBT) configuration and fully automated furnace process control and an alloy additive plant. After further upgrading, the capacity of Masteel’s meltshop in Klang stood at 450,000 tpy while its downstream operation in Petaling Jaya has a capacity of 350,000 tpy.
KEY HIGHLIGHTS
Small, but has what it takes. Masteel is the smallest integrated long steel manufacturer in Malaysia with a meltshop near Port Klang that enjoys easy access to steel scrap imports and billet exports. However, the rolling mill in Petaling Jaya is strategically located in the centre of the Klang Valley where demand for steel is strong. The company produces niche products that command good margins amid less intense competition since there are no economies of scale to achieve, as with the big mills. Its continuous upgrading exercises have helped to improve overall efficiency and increase capacity.
Constant upgrades. Despite having successfully weathered several steel cycles, Masteel’s management is constantly seeking ways to improve plant efficiency and increase capacity. The company recently announced plans to invest approximately RM300m in a downstream expansion project to meet growing demand from the local and export markets. The project will be located adjacent to the company’s existing meltshop in Bukit Raja, Klang, on about 20 acres, from which we expect potential cost benefits arising from plant integration. We also suspect that it may be looking to invest in the industrial grade wire rods and light sections. Meanwhile, our main concern on the proposal is the company’s gearing may exceed 1x post expansion but we think the guided capex may have been on the high side.
Malaysia Steel Works (KL)
Small is Beautiful Indeed
Target : RM1.45Price : RM1.10
STEEL
Stock Profile/StatisticsBloomberg Ticker MSW MKIssued Share Capital (m) 205.4Market Capitalisation (RMm) 225.952 week H | L Price (RM) 1.18 | 0.61Average Volume (3m) ‘000 377.5YTD Returns (%) 11.1Net gearing (x) 0.5Altman Z-Score 2.05ROCE/WACC 0.0Beta (x) 1.5Book Value/share (RM) 2.21
Major Shareholders (%)Soon Seng Company SB 29.4LTH 10.0Rosly Bin Aziz 5.1
Share Performance (%)Month Absolute Relative1m -0.9 -2.4 3m 6.8 3.7 6m 18.9 7.6 12m 71.1 17.8
6-month Share Price Performance
1.2
1.1
1.0
0.9
0.8Oct-09 Nov-09 Dec-09 Jan-10 Feb-10 Mar-10 Apr-10
(Company No. 7878-V)
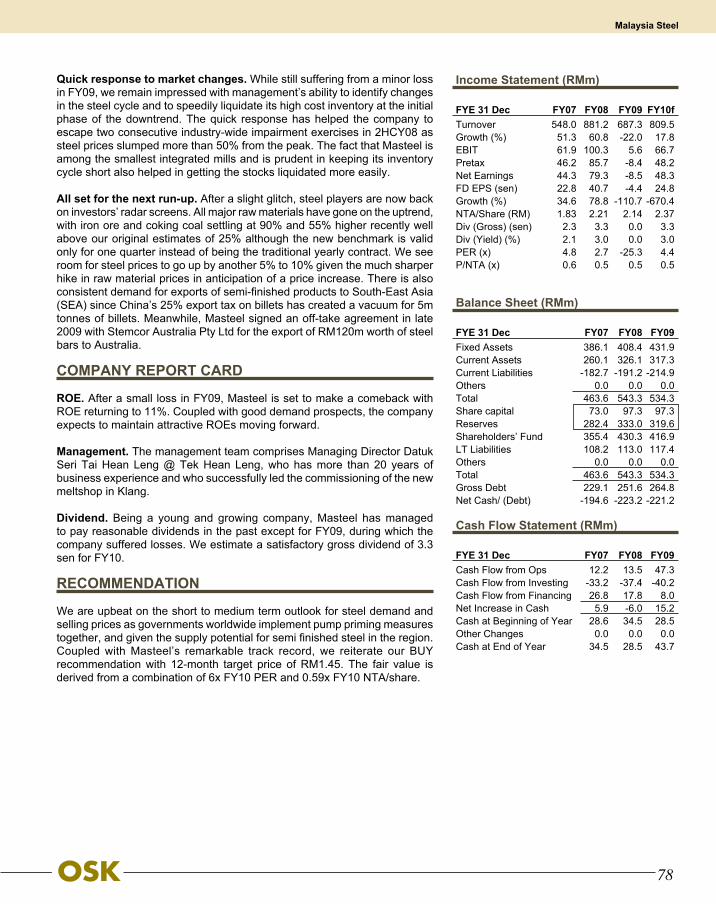
78
Quick response to market changes. While still suffering from a minor loss in FY09, we remain impressed with management’s ability to identify changes in the steel cycle and to speedily liquidate its high cost inventory at the initial phase of the downtrend. The quick response has helped the company to escape two consecutive industry-wide impairment exercises in 2HCY08 as steel prices slumped more than 50% from the peak. The fact that Masteel is among the smallest integrated mills and is prudent in keeping its inventory cycle short also helped in getting the stocks liquidated more easily.
All set for the next run-up. After a slight glitch, steel players are now back on investors’ radar screens. All major raw materials have gone on the uptrend, with iron ore and coking coal settling at 90% and 55% higher recently well above our original estimates of 25% although the new benchmark is valid only for one quarter instead of being the traditional yearly contract. We see room for steel prices to go up by another 5% to 10% given the much sharper hike in raw material prices in anticipation of a price increase. There is also consistent demand for exports of semi-finished products to South-East Asia (SEA) since China’s 25% export tax on billets has created a vacuum for 5m tonnes of billets. Meanwhile, Masteel signed an off-take agreement in late 2009 with Stemcor Australia Pty Ltd for the export of RM120m worth of steel bars to Australia.
COMPANY REPORT CARD
ROE. After a small loss in FY09, Masteel is set to make a comeback with ROE returning to 11%. Coupled with good demand prospects, the company expects to maintain attractive ROEs moving forward.
Management. The management team comprises Managing Director Datuk Seri Tai Hean Leng @ Tek Hean Leng, who has more than 20 years of business experience and who successfully led the commissioning of the new meltshop in Klang.
Dividend. Being a young and growing company, Masteel has managed to pay reasonable dividends in the past except for FY09, during which the company suffered losses. We estimate a satisfactory gross dividend of 3.3 sen for FY10.
RECOMMENDATION
We are upbeat on the short to medium term outlook for steel demand and selling prices as governments worldwide implement pump priming measures together, and given the supply potential for semi finished steel in the region. Coupled with Masteel’s remarkable track record, we reiterate our BUY recommendation with 12-month target price of RM1.45. The fair value is derived from a combination of 6x FY10 PER and 0.59x FY10 NTA/share.
Income Statement (RMm)
FYE 31 Dec FY07 FY08 FY09 FY10fTurnover 548.0 881.2 687.3 809.5Growth (%) 51.3 60.8 -22.0 17.8EBIT 61.9 100.3 5.6 66.7Pretax 46.2 85.7 -8.4 48.2Net Earnings 44.3 79.3 -8.5 48.3FD EPS (sen) 22.8 40.7 -4.4 24.8Growth (%) 34.6 78.8 -110.7 -670.4NTA/Share (RM) 1.83 2.21 2.14 2.37Div (Gross) (sen) 2.3 3.3 0.0 3.3Div (Yield) (%) 2.1 3.0 0.0 3.0PER (x) 4.8 2.7 -25.3 4.4P/NTA (x) 0.6 0.5 0.5 0.5
Balance Sheet (RMm)
FYE 31 Dec FY07 FY08 FY09Fixed Assets 386.1 408.4 431.9Current Assets 260.1 326.1 317.3Current Liabilities -182.7 -191.2 -214.9Others 0.0 0.0 0.0Total 463.6 543.3 534.3Share capital 73.0 97.3 97.3Reserves 282.4 333.0 319.6Shareholders’ Fund 355.4 430.3 416.9LT Liabilities 108.2 113.0 117.4Others 0.0 0.0 0.0Total 463.6 543.3 534.3Gross Debt 229.1 251.6 264.8Net Cash/ (Debt) -194.6 -223.2 -221.2
Cash Flow Statement (RMm)
FYE 31 Dec FY07 FY08 FY09Cash Flow from Ops 12.2 13.5 47.3Cash Flow from Investing -33.2 -37.4 -40.2Cash Flow from Financing 26.8 17.8 8.0Net Increase in Cash 5.9 -6.0 15.2Cash at Beginning of Year 28.6 34.5 28.5Other Changes 0.0 0.0 0.0Cash at End of Year 34.5 28.5 43.7
Malaysia Steel

79
INVESTMENT MERITS
A leading snack manufacturer in Malaysia Resilient demand from snack division Strong presence in Malaysia and overseas Continuous growth from product innovation and new
launchings
COMPANY PROFILE
Mamee-Double Decker (Mamee), incorporated in 1971, started off selling instant noodles. In 1980, it moved into the confectionary business by making Nicollette Swiss Herb candies, which was a success in the east coast of Peninsular Malaysia. It later moved into the cultured milk business. The company has five factories in Malaysia and one in Myanmar. Mamee is now a household brand in Malaysia with a wide array of brands including Mamee Monster, Mamee Instant and Sllrrp! Noodles and Double Decker, and exports to 120 countries worldwide. Mamee was listed on the Bursa Malaysia Main Board on 18 March 1992.
KEY HIGHLIGHTS
Top brands in Malaysia. Mamee is household brand for snacks throughout Malaysia, commanding a substantial market share. The potato crisp market, previously held by Pringles, has been overtaken by Mamee’s Mister Potato, launched in 1992. Currently the brand holds a 20% share of the market for potato crisps and chips. Other than Malaysia, Mamee is also a leading instant noodle brand in Myanmar, behind Mama noodle and Yum Yum noodle, as well as a leading crisps brand, behind Pringles in Australia.
New look, new taste. Apart from its snacks division, Mamee instant noodles have undergone rebranding through media advertising as well as engaging famous blogger Kenny Hsia as brand ambassador. This was met with success as Mamee slowly nibbles at Maggi’s 45% share in the Malaysian market. Mamee has a dedicated R&D team creating new tastes every year.
Defeating Goliath. Given the high incidence of obesity among Australian children, schools in that country have banned junk food such cola drinks, potato chips and others from the reach of school children. The government has categorised food into Green, Amber and Red groups and Mamee’s Monster noodle snacks and Mister Potato have made it into the Amber category given that the company uses virgin crude palm oil, which is healthier. Meanwhile, Pringles has been removed from the shelves of Woolworths and replaced with Mister Potato, which is more sellable given that it is a cheaper option.
Mamee-Double DeckerA Well-Loved Snack Maker
Target : RM4.10Price : RM2.92
CONSUMER
Stock Profile/StatisticsBloomberg Ticker MAMEE MKIssued Share Capital (m) 151.3Market Capitalisation (RMm) 441.752 week H | L Price (RM) 3.14 | 1.11Average Volume (3m) ‘000 173.9YTD Returns (%) 40.4Net gearing (x) Net CashAltman Z-Score 4.99ROCE/WACC 2.0Beta (x) 0.7Book Value/share (RM) 1.53
Major Shareholders (%)Pang Tee Chiew 23.8Pang Chin Hin 18.9Pang Tee Nam 10.1
Share Performance (%)Month Absolute Relative1m 11.0 6.9 3m 35.6 31.6 6m 73.6 52.6 12m 169.1 79.7
6-month Share Price Performance
3.5
3.2
2.9
2.6
2.3
2.0
1.7Oct-09 Nov-09 Dec-09 Jan-10 Feb-10 Mar-10 Apr-10

80
Long term investment. Mamee is constantly seeking acquisition targets in its quest to expand its food business. Moreover, the company recently moved into the plantation business via a joint venture with CNI Holdings. Its plantation venture is a hedge for one of its main ingredients, palm oil.
COMPANY REPORT CARD
ROE. Mamee’s ROE has consistently remained at above 12% in the last two years. Going forward, we see stronger ROE on the back of new product launching as well as rebranding of the Mamee brands to capture a larger market share.
Management. Mamee has a strong management team that was recently augmented by recruitment of new talent from the industry, which we believe will take Mamee to greater heights.
Dividend. We expect Mamee to maintain its average dividend payout of about 30%, which translates into an annual gross yield of 4% at the current share price.
RECOMMENDATION
We are ascribing a higher target price of RM4.10 by using the composite of 11x PER over FY10 EPS. We see Mamee as a dividend yielding stock with potential growth from its snacks segment as well as long-term growth for its plantation segment.
Income Statement (RMm)
FYE 31 Dec FY07 FY08 FY09 FY10fTurnover 359.7 397.0 411.5 476.4Growth (%) 3.0 10.3 3.7 15.8EBIT 20.8 30.7 55.1 79.6Pretax 19.9 30.1 56.2 72.8Net Earnings 14.0 23.6 43.6 56.4FD EPS (sen) 9.3 15.6 28.8 37.3Growth (%) -39.5 68.6 84.8 29.2NTA/Share (RM) 1.12 1.26 1.48 1.72Div (Gross) (sen) 20.0 25.0 5.0 13.0Div (Yield) (%) 6.8 8.6 1.7 4.5PER (x) 31.6 18.7 10.1 7.8P/NTA (x) 2.6 2.3 2.0 1.7
Balance Sheet (RMm)
FYE 31 Dec FY07 FY08 FY09Fixed Assets 103.0 110.2 158.3Current Assets 132.2 145.0 142.6Current Liabilities -61.7 -59.7 -73.4Others 0.0 0.0 0.0Total 173.5 195.5 227.4Share capital 80.6 86.4 151.3Reserves 88.9 104.9 72.3Shareholders’ Fund 169.5 191.3 223.6LT Liabilities 3.8 4.0 2.3Others 0.2 0.2 1.5Total 173.5 195.5 227.4Gross Debt 10.0 0.4 0.8Net Cash/ (Debt) 35.6 44.9 45.7
Cash Flow Statement (RMm)
FYE 31 Dec FY07 FY08 FY09Cash Flow from Ops 16.1 20.6 64.8Cash Flow from Investing -5.8 -14.2 -55.0Cash Flow from Financing 0.3 -7.1 -9.0Net Increase in Cash 10.6 -0.7 0.9Cash at Beginning of Year 35.0 45.6 44.9Other Changes 0.0 0.0 0.0Cash at End of Year 45.6 44.8 45.7
Mamee-Double Decker

81
INVESTMENT MERITS
Diversified range of marques helps in gaining market share Investing on more 3S centres to garner a bigger market share More contribution from subsidiaries from 2010 onwards Cheapest auto stock in our coverage at 6.9x PE TP of RM3.54 based on 9x PE
COMPANY PROFILE
MBM Resources (MBM) is principally involved in the distribution of Perodua vehicles and Daihatsu (71.50% ownership) light trucks as well as Mitsubishi, Volvo and Volkswagen cars under the dealership of Federal Auto (86%-owned) and its subsidiaries. As an independent dealer for Perodua vehicles, MBM is currently the largest dealer for both Perodua and Volvo. At the associate level, the group holds 23.60% and 42% equity interest in Perodua and Hino respectively. It is also involved in the manufacture of auto related parts via Oriental Motor Industries (steel wheel manufacturer), and Summit Venture (truck body building).
KEY HIGHLIGHTS
Less dependent on associates. In the past few years, the bulk of MBM’s bottom-line has been contributed mostly by its associates Perodua and Hino. We see this progressively reversing going forward as it banks in on a growing revenue base at the subsidiary level. Revenue contribution will be boosted by higher vehicle sales from Federal Auto, which has Volvo, Volkswagen and Mitsubishi in its stable. Management is guiding for revenue contribution from Volvo to potentially double in 2010.
Establishing a big distributorship presence. MBM Resources is committed to invest further in its 3S centres, which typically other competing distributors are reluctant to. This gives it the advantage of retaining its customer base by ensuring service continuity and at the same time stealing market share from other distributors. Being a leading automotive distributor, MBM has more bargaining power with its principals in commanding better terms, which ultimately enhances margins.
Benefits of diversification. MBM’s diverse exposure to different marques ranging from the luxury to the affordable makes as well as the passenger and commercial segments allows the group to tap a wide range of markets to increase its market share. The group’s exposure in the supply of steel rims and tyres as a tier 1 supplier to auto-manufacturers will also give it forward momentum as the auto industry revs up.
MBM ResourcesExpanding Vehicle Franchise
Target : RM3.54Price : RM2.73
AUTOMOTIVE
Stock Profile/StatisticsBloomberg Ticker MBM MKIssued Share Capital (m) 242.1Market Capitalisation (RMm) 653.652 week H | L Price (RM) 2.76 | 2.1Average Volume (3m) ‘000 50.2YTD Returns (%) 4.2Net gearing (x) Net CashAltman Z-Score 5.63ROCE/WACC 0.3Beta (x) 0.7Book Value/share (RM) 3.64
Major Shareholders (%)Med-Bumikar MARA 54.1EPF 5.3Ahmad Azizuddin 1.7
Share Performance (%)Month Absolute Relative1m 3.0 0.0 3m 8.3 0.6 6m 17.0 5.5 12m 27.2 -16.5
6-month Share Price Performance
2.9
2.8
2.7
2.6
2.5
2.4
Oct-09 Nov-09 Dec-09 Jan-10 Feb-10 Mar-10 Apr-10

82
Banking on Perodua and Hino. Apart from revenue growth from its subsidiaries, MBM Resources is also expected to see a rebound in its associates as Perodua continues to chalk up strong vehicles sales, which received a demand boost for the new MPV variant, Alza. Hino, on the other hand - thanks to its affordable pricing and leveraging on the Daihatsu distributorship platform - will continue to be a leading player in the heavy commercial vehicle segment as the local economy picks up pace.
Margins likely to be favourable. In anticipation of an appreciation in the Ringgit against the Japanese YEN and USD, we see margin expansion as being likely from both the subsidiary and associate levels. Coupled with the higher revenue base amid higher volume from its range of distributorships, we expect MBM’s profit rebounding by 38.2% from 2009. On the back of better vehicle sales going forward, we expect double digit growth in net profit over the next few years.
COMPANY REPORT CARD
ROE. While its ROE may not be as spectacular as that achieved in FY08 of 13.8%, we expect MBM’s ROE to go back to double digits by FY11.
Management. Mr. Looi Kok Loon was appointed Managing Director, replacing Dato’ Abdul Rahim bin Abdul Halim, in 2006. Although he is relatively new in the auto scene given his investment banking background, he is backed by a strong management team given his role in the board of directors of the group’s subsidiaries as well as associated companies.
Dividend. In an attempt to conserve its cash for capex spending on its distributorship infrastructure and refurbishments, we are only likely to see a dividend of 9 sen for FY10. At the current pricing, the stock’s dividend yield is 3.3%.
RECOMMENDATION
MBM is still trading at a forward PE of only 6.9x, making it one of the cheapest auto stocks in our coverage, backed by a sound balance sheet and diverse vehicle line-up. We are also optimistic on MBM’s long term prospects as the Group strengthens its distributorship in an attempt to enlarge its vehicle market share. Pegging the stock at 9x PE on FY10 EPS, we derive a target price of RM3.54 with a BUY recommendation.
Income Statement (RMm)
FYE 31 Dec FY07 FY08 FY09 FY10fTurnover 1080.9 1203.0 1187.2 1393.8Growth (%) -4.5 11.3 -1.3 17.4EBIT 54.8 63.9 39.1 70.1Pretax 140.5 149.9 92.8 136.2Net Earnings 110.5 111.0 69.0 95.3FD EPS (sen) 38.0 45.9 28.5 39.4Growth (%) 24.8 20.7 -37.9 38.2NTA/Share (RM) 2.93 3.27 3.46 3.80Div (Gross) (sen) 12.0 18.0 6.0 9.0Div (Yield) (%) 4.4 6.6 2.2 3.3PER (x) 7.2 5.9 9.6 6.9P/NTA (x) 0.9 0.8 0.8 0.7
Balance Sheet (RMm)
FYE 31 Dec FY07 FY08 FY09Fixed Assets 651.5 709.9 755.7Current Assets 342.3 367.2 387.7Current Liabilities -98.0 -77.5 -87.2Others 0.0 0.0 0.0Total 895.8 999.5 1056.2Share capital 272.5 272.6 273.1Reserves 486.4 576.5 623.0Shareholders’ Fund 758.9 849.1 896.1LT Liabilities 16.8 19.9 23.4Others 120.1 130.6 136.7Total 895.8 999.5 1056.2Gross Debt 45.1 35.5 30.3Net Cash/ (Debt) 65.9 92.3 117.1
Cash Flow Statement (RMm)
FYE 31 Dec FY07 FY08 FY09Cash Flow from Ops 72.4 36.9 49.6Cash Flow from Investing -14.8 36.0 3.4Cash Flow from Financing -57.9 -52.1 -27.4Net Increase in Cash -0.4 20.8 25.5Cash at Beginning of Year 122.1 114.1 123.4Other Changes -11.0 -7.2 -1.5Cash at End of Year 110.7 127.7 147.4
MBM Resources

83
INVESTMENT MERITS
Among the first shoe sole companies in the world to be listed Operating at maximum capacity Demand is 3x higher than capacity Strong earnings growth Recommending a 20% dividend payout ratio Attractive valuation BUY at a TP of RM1.17 (based on 5.5x FY10 EPS)
COMPANY PROFILE
Multi Sports was set up in 1993 when Executive Chairman and founder Lin Huozhi started making rubber shoe soles with only 2 assistants. After 4 years of endeavour, Lin enlarged his operation in Yanshang industrial zone, Jinjang City in Fujian province. The formerly small-scale producer is today an established sport shoe-sole designer and manufacturer of well-known local sports shoe brands such as Guohui, 3610 and Xdlong. In 2006, the Group successfully developed EVA MD I and MD II shoe soles that have enhanced elasticity and shock-absorbing characteristics. In 2008, the Group commenced in-house production of EVA compound pellets to reduce production cost, increase profit margins and reduce its reliance on third-party suppliers. In the same year, the Group received the “Quality Reliable Products” award from China Light Industry Products Guarantee Centre, which is testament to the quality of its products.
KEY HIGHLIGHTS
Among the first shoe sole companies in the world to be listed. Multi Sports, a vertically integrated shoe sole provider concentrating in the mid-stream business, is among the first few shoe sole companies in the world to be listed. Being a pioneer in such listing, we believe the company will enjoy first-mover advantage in ramping up production capacity and increasing market share. Unlike shoe manufacturers which find it difficult to penetrate foreign markets due to low awareness of their brand, the demand for Multi Sports products does not end in China. In fact, the group also exports overseas given that its customers emphasize more on product quality than branding. Moreover, the Group is also one of the top 5 sports shoe sole manufacturers in Jinjiang, satisfying ~20% of the world’s sport shoe demand.
Multi-Sports HoldingsSole Sensation
Target : RM1.17Price : RM0.475
CONSUMER
Stock Profile/StatisticsBloomberg Ticker MSH MKIssued Share Capital (m) 360.0Market Capitalisation (RMm) 171.052 week H | L Price (RM) 0.89 | 0.47Average Volume (3m) ‘000 1507.5YTD Returns (%) -7.8Net gearing (x) Net CashAltman Z-Score -ROCE/WACC -Beta (x) -Book Value/share (RM) 0.44
Major Shareholders (%)Power Wide Holdings 50.5Guoline Group Management 8.6
Share Performance (%)Month Absolute Relative1m -2.0 -6.3 3m -10.3 -13.1 6m -3.0 -15.6 12m - -
6-month Share Price Performance
0.8
0.7
0.6
0.5
0.4Oct-09 Nov-09 Dec-09 Jan-10 Feb-10 Mar-10 Apr-10

84
Solely soles. Unlike some vertically integrated shoe manufacturers involved in the midstream and downstream side that produce shoe soles and shoes, Multi Sports is a pure, vertically-integrated midstream shoe sole provider. With its focus only on shoe soles, the group can channel all its capital into R&D and advanced technologies to make products of the best possible design and of the highest quality rather than utilising its funds for A&P, market research and brand building. Concentrating on its midstream activities makes its cash flow easier to predict. Another plus in being a vertically integrated player is that it differentiates Multi Sports from its competitors, enabling the group to lower production costs and reduce its dependence on third-party suppliers for intermediate materials and semi-finished products, thus ensuring better quality control.
Operating at maximum capacity. Multi Sports’ manufacturing plants are currently running at an average of 90% utilization and plans are afoot to ramp up capacity to 74.6m in the next two years from 24.6m currently upon completion of the new plant at the end of this year. As its orderbook is 3 times its current capacity, we do not expect to see its utilization rate dipping below 80% even if the group tripled production capacity. Due to its limited resources currently, the Group has had to reject on average 40% of each customer’s orders when it plans its yearly production.
Resilient demand. The Group produces only confirmed orders, which is based on forecast shoe demand by the shoe manufacturers, and is thus less likely to be affected by actual consumer demand.
Strong top and bottom line growth. Being a pioneer and possessing an experienced management team, Multi Sports boasts an impressive top and bottom line CAGR of 33.9% and 37.8% respectively in the past two years, driven by a bigger contribution from higher margin products, economies of scale and the in-house production of EVA compound pellets.
COMPANY REPORT CARD
ROE. Prior to its listing in 4Q last year, the group’s ROE stood at >100%. Post listing, we expect Multi Sport to achieve ROEs of 28%-31% in the next two years.
Management. The group was founded by Mr Lin Huozhi, who has 17 years’ experience in the shoe-sole manufacturing industry. He is assisted by his daughter, Ms. Lin Liyng.
Dividend. The group intends to recommend a 20% payout ratio. Based on this ratio, our FY10/11 dividend yield forecasts for the stock are an attractive 9.4% and 10.4% respectively.
RECOMMENDATION
The stock is currently trading at ~2x forward PE, which we believe is unjustified given (i) its strong orderbook, which is 3x its capacity. (ii) solid fundamentals, and (iii) less intense competition compared to the market for shoe manufacturers (~100 shoe sole producers versus >3,000 shoe manufacturers in Jinjiang). We value Multi Sports at RM1.17, based on an undemanding 5.5x FY10 EPS.
Income Statement (RMm)
FYE 301 Dec FY07 FY08 FY09 FY10fTurnover 163.6 193.3 237.9 309.5Growth (%) 42.8 18.1 23.1 30.1EBIT 40.6 52.8 71.3 88.8Pretax 40.6 52.8 65.9 88.8Net Earnings 40.6 46.2 61.6 76.4FD EPS (sen) 11.3 12.8 17.1 21.2Growth (%) 42.8 18.1 23.1 30.1NTA/Share (RM) 0.02 0.02 0.28 0.31Div (Gross) (sen) 0.0 0.0 0.0 4.5Div (Yield) (%) 0.0 0.0 0.0 9.5PER (x) 4.2 3.7 2.8 2.2P/NTA (x) 28.6 0.0 0.0 0.0
Balance Sheet (RMm)
FYE 31 Dec FY07 FY08 FY09Fixed Assets 22.5 22.1 64.9Current Assets 36.3 40.8 129.6Current Liabilities -30.3 -26.2 -40.7Others 0.0 0.0 0.0Total 28.4 36.7 153.8Share capital 0.0 0.0 61.8Reserves 28.4 27.8 92.0Shareholders’ Fund 28.4 27.8 153.8LT Liabilities 0.0 8.9 0.0Others 0.0 0.0 0.0Total 28.4 36.7 153.8Gross Debt 0.0 1.0 2.0Net Cash/ (Debt) 12.8 14.0 78.6
Cash Flow Statement (RMm)
FYE 31 Dec FY07 FY08 FY09Cash Flow from Ops 28.1 45.1 49.9Cash Flow from Investing -7.5 -5.8 -6.1Cash Flow from Financing -16.1 -35.6 -44.0Net Increase in Cash 4.4 3.7 -0.1Cash at Beginning of Year 4.6 9.0 12.8Other Changes 0.0 0.0 0.0Cash at End of Year 9.0 12.8 12.6
Multi-Sports Holdings

85
INVESTMENT MERITS
A market leader in a recession-proof industry Stable tax-exempt dividend, with net dividend yield of 6.6% Expanding rapidly in the ASEAN market TP of RM2.75 based on 6.7x PE
COMPANY PROFILE
New Hoong Fatt Holdings (NHF) is Malaysia’s dominant auto body parts maker for the replacement market with an extensive product portfolio ranging from metal body parts like hoods and doors to plastic parts such as lamps, bumpers and grilles. To complement its in-house product range, NHF also trades on third parties’ auto-parts. It has an extensive distribution channel of more than 500 wholesalers and retailers throughout Malaysia. Being in the replacement market where the competition is less intense and given its status as dominant market leader, NHF boasts a commendable track record revenue growth for the past 6 years.
KEY HIGHLIGHTS
Demand resilient despite severe slowdown. NHF is clearly in the segment of the auto-parts industry that experiences resilient demand irrespective of economic condition. This can be seen during the financial crisis in 1997/1998, when its revenue in 1998 continued to record positive growth of 2% despite a sharp contraction in total industry volume (TIV) of 59%, and a 7.4% and 39% drop in GDP and manufacturing output of motor vehicle parts and accessories respectively. Similarly, last year despite the economic slowdown, NHF outperformed the overall industry with revenue jumping 20.4% y-o-y amid a 2% y-o-y- contraction in vehicle sales.
Beneficiary of abolishment of imported used parts. We also see NHF as a beneficiary of the upcoming abolishment of used imported auto-parts come June 2011 as announced in the NAP recently. The abolishment of used imported OEMs may potentially enhance the appeal of Replacement Equipment Manufacturer (REM) parts as the cheaper alternative to OEM goods, where the pricing disparity can be rather substantial (REMs are typically cheaper by 40% on average compared to OEMs).
New Hoong FattRegional Player in the Making
Target : RM2.75Price : RM2.27
AUTOMOTIVE
Stock Profile/StatisticsBloomberg Ticker NHF MKIssued Share Capital (m) 75.2Market Capitalisation (RMm) 170.652 week H | L Price (RM) 2.55 | 1.6Average Volume (3m) ‘000 32.7YTD Returns (%) 0.9Net gearing (x) 0.02Altman Z-Score 3.49ROCE/WACC 1.1Beta (x) 0.6Book Value/share (RM) 2.81
Major Shareholders (%)Kam Foong Keng 34.1Moy Wong Ah 13.4Kam Foong Sim 2.4
Share Performance (%)Month Absolute Relative1m -1.3 -2.1 3m -1.3 -12.1 6m 22.4 11.2 12m 51.3 -2.9
6-month Share Price Performance
2.62.52.42.32.22.12.01.91.81.7
Oct-09 Nov-09 Dec-09 Jan-10 Feb-10 Mar-10 Apr-10
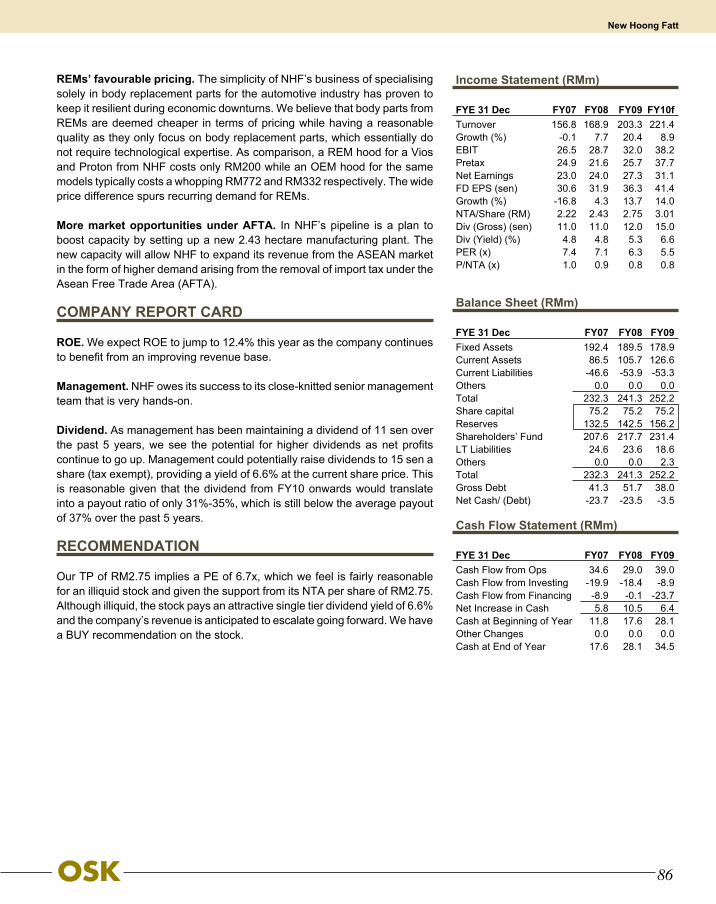
86
REMs’ favourable pricing. The simplicity of NHF’s business of specialising solely in body replacement parts for the automotive industry has proven to keep it resilient during economic downturns. We believe that body parts from REMs are deemed cheaper in terms of pricing while having a reasonable quality as they only focus on body replacement parts, which essentially do not require technological expertise. As comparison, a REM hood for a Vios and Proton from NHF costs only RM200 while an OEM hood for the same models typically costs a whopping RM772 and RM332 respectively. The wide price difference spurs recurring demand for REMs.
More market opportunities under AFTA. In NHF’s pipeline is a plan to boost capacity by setting up a new 2.43 hectare manufacturing plant. The new capacity will allow NHF to expand its revenue from the ASEAN market in the form of higher demand arising from the removal of import tax under the Asean Free Trade Area (AFTA).
COMPANY REPORT CARD
ROE. We expect ROE to jump to 12.4% this year as the company continues to benefit from an improving revenue base.
Management. NHF owes its success to its close-knitted senior management team that is very hands-on.
Dividend. As management has been maintaining a dividend of 11 sen over the past 5 years, we see the potential for higher dividends as net profits continue to go up. Management could potentially raise dividends to 15 sen a share (tax exempt), providing a yield of 6.6% at the current share price. This is reasonable given that the dividend from FY10 onwards would translate into a payout ratio of only 31%-35%, which is still below the average payout of 37% over the past 5 years.
RECOMMENDATION
Our TP of RM2.75 implies a PE of 6.7x, which we feel is fairly reasonable for an illiquid stock and given the support from its NTA per share of RM2.75. Although illiquid, the stock pays an attractive single tier dividend yield of 6.6% and the company’s revenue is anticipated to escalate going forward. We have a BUY recommendation on the stock.
Income Statement (RMm)
FYE 31 Dec FY07 FY08 FY09 FY10fTurnover 156.8 168.9 203.3 221.4Growth (%) -0.1 7.7 20.4 8.9EBIT 26.5 28.7 32.0 38.2Pretax 24.9 21.6 25.7 37.7Net Earnings 23.0 24.0 27.3 31.1FD EPS (sen) 30.6 31.9 36.3 41.4Growth (%) -16.8 4.3 13.7 14.0NTA/Share (RM) 2.22 2.43 2.75 3.01Div (Gross) (sen) 11.0 11.0 12.0 15.0Div (Yield) (%) 4.8 4.8 5.3 6.6PER (x) 7.4 7.1 6.3 5.5P/NTA (x) 1.0 0.9 0.8 0.8
Balance Sheet (RMm)
FYE 31 Dec FY07 FY08 FY09Fixed Assets 192.4 189.5 178.9Current Assets 86.5 105.7 126.6Current Liabilities -46.6 -53.9 -53.3Others 0.0 0.0 0.0Total 232.3 241.3 252.2Share capital 75.2 75.2 75.2Reserves 132.5 142.5 156.2Shareholders’ Fund 207.6 217.7 231.4LT Liabilities 24.6 23.6 18.6Others 0.0 0.0 2.3Total 232.3 241.3 252.2Gross Debt 41.3 51.7 38.0Net Cash/ (Debt) -23.7 -23.5 -3.5
Cash Flow Statement (RMm)
FYE 31 Dec FY07 FY08 FY09Cash Flow from Ops 34.6 29.0 39.0Cash Flow from Investing -19.9 -18.4 -8.9Cash Flow from Financing -8.9 -0.1 -23.7Net Increase in Cash 5.8 10.5 6.4Cash at Beginning of Year 11.8 17.6 28.1Other Changes 0.0 0.0 0.0Cash at End of Year 17.6 28.1 34.5
New Hoong Fatt

87
INVESTMENT MERITS
Eyeing 8 straight years of earnings growth High PBT margin of at least 25% since FY04 Worldwide HDD shipment is expected to achieve 12.5% growth
this year Qualifying to supply to a new HDD customer Trading at historical peak-cycle valuation
COMPANY PROFILE
Notion VTec is one of biggest high precision engineering specialists in Malaysia with 2 manufacturing plants in Klang, Selangor, which it has expanded several times since its IPO in 2005. The main factory is located on 9 acres on a 350k sq ft built-up area while the other - of 80k sq ft - is on 3 acres. From the RM47.3m cash raised from its IPO, it has spent RM32m to construct a new factory in Klang and purchase new machinery. Notion VTec started off with 2,000 sq ft of floor space and 4 computer numerically-controlled machines (CNC). Presently, it has about 1,300 employees, and 80% of its factory workers are foreigners. The company has 960 CNC machines at the 2 production facilities. It has attained ISO 9001: 2000, ISO140001: 2004 and ISO / TS16949 certification.
KEY HIGHLIGHTS
Key contribution from HDDs and digital cameras. Notion VTec derives the bulk of its revenue from the hard disk drives (HDD) and digital camera industries. Its key customers are MNCs such as Western Digital, Hitachi and Nikon. Its key products are camera cam barrels, digital camera body lens ring, HDD anti-disk, HDD disk clamps, HDD spacer rings and so on (refer to Appendix I for details on key products). Other industries with a lower sales contribution are the automotive, consumer electronics and air conditioning sectors.
A growing industry. In 4Q08, the HDD industry was hit hard by the deteriorating global economy. In early 2009, market research consultancy TRENDFOCUS projected that worldwide HDD shipments in 2009 could potentially drop 12% from 2008 as corporates and consumers rein in spending on PCs and consumer electronics. Nevertheless, as the world economy gradually improved in the first three quarters of 2009, demand for HDDs actually expanded, with TRENDFOCUS expecting 4Q09 shipments to trend even higher. The firm said an increase in PC demand, especially for mobile computing solutions, was the key driver, adding that 2009 shipments are expected to rise by a slight 2.8%. TRENDFOCUS has projected 12.5% growth in worldwide HDD shipments in 2010, and another 11% for 2011 and 2012. We believe the long-term growth trend for HDD shipments is intact due to growing digitalization of content, sustainable sales growth of PCs, notebooks and netbooks, especially in the emerging markets, the growing need for external/backup storage, and the creation of new market opportunities in the consumer electronic industry.
Notion VTecRecord Sales Seen For FY10
Target : RM3.38Price : RM3.28
TECHNOLOGY
Stock Profile/StatisticsBloomberg Ticker NVB MKIssued Share Capital (m) 154.6Market Capitalisation (RMm) 507.052 week H | L Price (RM) 3.52 | 0.80Average Volume (3m) ‘000 872.0YTD Returns (%) 20.6Net gearing (x) 23.0Altman Z-Score 4.13ROCE/WACC 1.6Beta (x) 1.0Book Value/share (RM) 1.18
Major Shareholders (%)Choo Wing Hong 14.2Nikon Corporation 10.0Choo Wing Onn 9.5
Share Performance (%)Month Absolute Relative1m 8.7 3.6 3m 20.9 5.0 6m 47.6 29.2 12m 295.0 163.9
6-month Share Price Performance
3.5
3.3
3.1
2.9
2.7
2.5
2.3
2.1Oct-09 Nov-09 Dec-09 Jan-10 Feb-10 Mar-10 Apr-10

88
Firm demand for digital cameras. Despite the global recession, the Camera and Imaging Products Association (CIPA) still expects shipments of digital cameras to remain relatively flat at 119m units in 2009. Various factors have contributed to the stable demand for digital cameras, one of them being that declining prices and better features over the years have helped to support volume growth. Demand is expected to remain strong going forward, especially in emerging markets such as China, India and Eastern Europe. Over the last three years, the growing popularity of social websites such as Facebook and Flikr has helped to promote the culture of sharing photos online.
A new HDD customer. Notion VTec has just been qualified by a new HDD customer, Samsung, to produce 2.5” HDD components. This qualification by Samsung allows Notion VTec to mass produce 2.5” HDD components for the first time. Before this project, 90% of its HDD components is for the 3.5” HDD segment. Notion VTec is the second supplier for this particular component. Depending on world demand, Notion VTec could be making 500k pieces a month for this customer, at an average selling price (ASP) of RM4 apiece. However, we believe that the price will gradually decrease over time. If Notion VTec executes this project smoothly, there is a possibility that the volume could go up to 1m pieces per month by mid-2010.
Management guidance. Barring unforeseen circumstances, management’s internal target for FY10 revenue ranges from RM220m to RM240m while FY10 net profit ranges from RM50m to RM55m. According to management, the HDD industry is expected to remain robust in 2010 and even in 2011 owing to economic recovery and PC growth. The camera segment is also expected to grow in tandem with market demand. However, for 2QFY10, management expects revenue to decline before growing strongly in 3Q and 4Q.
COMPANY REPORT CARD
ROE. ROE has been ranging from 24% to 29% since its IPO.
Management. Notion VTec was founded in 1995 by Mr. William Choo, Mr. Lee and Mr. Thoo, who are the Managing Director, Executive Director and Executive Chairman respectively. Mr. Thoo is a relative of the Choo family by marriage. The Choo family collectively owns 36.2% in the company while Mr. Thoo has a 7.6% equity stake. William is the biggest shareholder among the family members, with a 15.8% stake.
Dividend. Notion VTec currently does not have a dividend policy. In view of the heavy capex to be incurred in FY10, we do not see the company paying high dividends, but it may at least maintain last year’s 10 sen tax-exempt gross dividend. Based on our dividend estimates, about 20% of net profit is expected to be paid out as dividend.
RECOMMENDATION
Trading around peak-cycle valuation. Should optimism in the equity market remain high, Notion VTec’s share price can still continue to go up despite its appreciation towards the historical peak-cycle valuation of 10x while its FY10 earnings are not expected to significantly deviate from our 34% EPS growth forecast. Maintain Trading Buy.
Income Statement (RMm)
FYE 31 Dec FY07 FY08 FY09 FY10fTurnover 104.5 146.0 172.6 224.3 Growth (%) 16.2 39.7 18.2 30.0 EBIT 27.5 34.7 42.6 64.3 Pretax 30.9 40.9 43.0 62.8 Net Earnings 26.6 32.9 36.0 52.8 FD EPS (sen) 18.9 23.4 25.6 37.5 Growth (%) 19.0 23.7 9.3 46.9 NTA/Share (RM) 0.81 0.97 1.16 1.45 Div (Gross) (sen) 12.0 5.6 6.7 12.0 Div (Yield) (%) 3.7 1.7 2.0 3.7 PER (x) 17.3 14.0 12.8 8.7 P/NTA (x) 4.1 3.4 2.8 2.3
Balance Sheet (RMm)
FYE 31 Sept FY06 FY07 FY08 FY09Fixed Assets 82.5 90.0 153.1 178.6 Current Assets 47.2 60.1 84.5 104.5 Current Liabilities -20.6 -24.0 -60.5 -58.1 Others 0 0.0 0.0 0.0 Total 109.1 126.1 177.1 224.9 Share capital 58.6 58.6 70.4 70.4 Reserves 40.3 55.2 66.4 105.5 Shareholders’ Fund 99.0 113.9 136.8 175.8 LT Liabilities 9.2 10.7 39.3 48.2 Others 0.9 1.5 1.1 0.9 Total 109.1 126.1 177.1 224.9 Gross Debt 8.6 7.1 19.4 63.4 Net Cash/ (Debt) 1.4 13.0 -1.8 -3.3
Cash Flow Statement (RMm)
FYE 31 Sept FY07 FY08 FY09Cash Flow from Ops 34.7 32.8 18.0Cash Flow from Investing -11.0 -21.0 -19.5Cash Flow from Financing -14.0 -14.8 -1.3Net Increase in Cash 9.6 -3.0 -2.7Cash at Beginning of Year 10.0 19.6 19.1Other Changes 0.0 0.0 0.0Cash at End of Year 19.6 16.6 16.6
Notion VTec

89
INVESTMENT MERITS
A value stock Malaysia’s biggest tissue paper manufacturer A recession-proof business Diversifying into recycling and stationery business Decent dividend yield and payout Target price of RM0.60 tagged at an average 10x FY11 EPS
COMPANY PROFILE
NTPM, incepted in 1979, has blossomed into Malaysia’s biggest tissue paper manufacturer. Through its well-known line-up of brands such as Premier, Cutie, Royal Gold, Intimate, and ConV, NTPM satisfies some 60% of Malaysia’s tissue paper needs. The company also exports to Singapore (~20% of revenue) and Australia, New Zealand, Thailand and China.
KEY HIGHLIGHTS
On a steady roll. NTPM is involved in the manufacture of tissue and personal care products, which are deemed necessities and are recession-proof. Demand for NTPM’s products has not slowed down, as can be seen from its consistent sales growth of a CAGR of >10% over the last five years. We believe that while consumers may cut down on non-discretionary items, they would not be able to dispense with spending on necessities like tissue paper. Although some consumers may opt for cheaper products, NTPM is still well-positioned for this as it has different prices for different products targeting different markets.
Market leader with strong pricing power. NTPM is the country’s largest tissue paper manufacturer, commanding >60% share of the local tissue market. Apart from having a large clientele that provides it with consistent revenue, the company’s large market share also gives it strong pricing power, which could help mitigate margins pressure arising from fluctuations in prices of raw materials, which mainly comprise recycled and pure pulp. Nonetheless, the group would try to contain price increases before passing them on to customers.
Supplement growth from overseas market and personal care segment.Given that NTPM has achieved a considerable share of the tissue paper market, the company intends to focus more on the personal care segment going forward. While this would supplement organic growth in the local tissue segment, we do not expect the personal care segment to contribute substantially in the near term as NTPM would need to price its products competitively in order to penetrate the market and win market share. Also, the group plans to expand its business overseas, as this contribution is still
NTPM HoldingsWield Pricing Power
Target : RM0.60Price : RM0.585
CONSUMER
Stock Profile/StatisticsBloomberg Ticker NTPM MKIssued Share Capital (m) 1123.2Market Capitalisation (RMm) 657.152 week H | L Price (RM) 0.625 | 0.31Average Volume (3m) ‘000 738.8YTD Returns (%) 4.5Net gearing (x) 0.2Altman Z-Score 6.70ROCE/WACC 2.8Beta (x) 0.6Book Value/share (RM) 0.18
Major Shareholders (%)Lee See Jin 29.3Teoh Boon Beng 17.6Chong Choon Lee 12.3
Share Performance (%)Month Absolute Relative1m 0.7 -3.4 3m 0.7 -4.0 6m 14.4 1.0 12m 89.9 17.7
6-month Share Price Performance
0.7
0.6
0.5
Oct-09 Nov-09 Dec-09 Jan-10 Feb-10 Mar-10 Apr-10

90
low, at slightly over 20%. Currently, it has presence in 26 countries, with Singapore accounting for ~20% of total sales.
Diversifying into recycling and stationery business. Other than its traditional tissue paper and personal care manufacturing business, NTPM is now venturing into the recycling business. This involves producing compressed boards from paper waste generated in-house and plastic products from plastic waste/tetra packs. Hence, these products command lucrative margins, especially as production volume increases. Meanwhile, the group has also ventured into the stationery business.
COMPANY REPORT CARD
ROE. NTPM has been recording an average ROE of 19% in the past 6 years. We expect ROE to stay at this level in view of the fact that the group looks set to sustain earnings.
Management. The group’s Managing Director, Mr. Lee See Jin, is the founder of NTPM and has more than 26 years’ experience in the paper industry. He has roped in his son, Mr. Lee Chong Choon, to help man the fort.
Dividend. NTPM has been consistently paying a dividend payout >60%. While the company does not have a formal dividend policy, management is committed to maintaining a minimum payout of 50%. Based on our FY10 net dividend forecast of 3.5 sen, the stock offers a dividend yield of ~6%, which makes it a good stock pick for 2H10, given our house view of a weaker 2H10.
RECOMMENDATION
Our target price of RM0.60 is tagged at an average 10x FY11 EPS. Its high dividend yield of 6%, consistent earnings growth and defensive nature are the stock’s attractions.
Income Statement (RMm)
FYE 30 Apr FY08 FY09 FY10f FY11fTurnover 306.2 358.6 419.0 463.7Growth (%) 13.1 17.1 16.9 16.8EBIT 43.9 60.6 83.0 85.8Pretax 41.6 58.7 81.6 83.6Net Earnings 33.1 46.2 64.4 66.8FD EPS (sen) 2.9 4.1 5.7 6.0Growth (%) 13.1 17.1 16.9 3.7NTA/Share (RM) 0.12 0.12 0.13 0.13Div (Gross) (sen) 2.3 2.6 3.5 3.6Div (Yield) (%) 3.8 4.5 6.0 6.0PER (x) 19.8 14.2 10.2 10.1P/NTA (x) 5.0 4.7 4.6 4.5
Balance Sheet (RMm)
FYE 30 Apr FY07 FY08 FY09Fixed Assets 178.0 177.2 182.6Current Assets 106.8 114.3 130.9Current Liabilities -78.4 -79.7 -83.0Others 0.0 0.0 0.0Total 206.4 211.9 230.5Share capital 62.4 62.4 112.3Reserves 109.0 120.7 90.9Shareholders’ Fund 171.4 183.1 203.3LT Liabilities 34.4 28.2 26.5Others 0.6 0.6 0.7Total 206.4 211.9 230.5Gross Debt 51.1 40.1 44.8Net Cash/ (Debt) -38.5 -27.5 -32.0
Cash Flow Statement (RMm)
FYE 30 Apr FY07 FY08 FY09Cash Flow from Ops 38.6 49.5 58.2Cash Flow from Investing -13.3 -17.4 -24.1Cash Flow from Financing -24.4 -32.2 -33.7Net Increase in Cash 1.0 -0.1 0.4Cash at Beginning of Year 11.7 12.7 12.6Other Changes 0.0 0.0 0.0Cash at End of Year 12.7 12.6 13.0
NTPM Holdings

91
INVESTMENT MERITS
A successful homegrown brand Resilient during economic downturns Different business concepts to serve different market segments TP of RM4.25 is based on 9.5x FY11 EPS
COMPANY PROFILE
Listed in 1998, Padini Holdings (Padini) was founded by Mr. Yong Pang Chaun, the present Managing Director and its substantial shareholder with a 42.6% stake. The company started as a manufacturer and wholesaler selling garments outright to retailers. A few years later, the company made a departure from the textile industry and ventured into mid-end garments and the shoe retail business. Today, Padini’s operations in Malaysia comprise 197 stores and consignment counters, as well as 72 franchise and dealer stores overseas. Overseas revenue accounts for ~10% of group revenue. The company has 7 in-house fashion labels, namely Vincci (VNC overseas), Padini, Padini Authentics, PDI, Seed, Miki and P&Co.
KEY HIGHLIGHTS
Showing resilience during the downturn. Padini’s earnings have been resilient, registering a CAGR of 29% over the past 4 years backed by widening EBITDA margins, which have jumped from 13.9% in FY06 to 18.7% in FY09. While FY08/09 was a tough year, the group managed to chalk up earnings growth of 18.7% y-o-y, which was impressive considering that consumer spending was weak. The solid earnings growth was mainly attributed to new openings and effective product sourcing management
Shifting to multi-brand concept stores. Padini is moving away from the typical single brand store to multi-brand concept stores given the higher visibility of its brands. The shift should ease its capex commitment in the form of cost savings on IFO and space rental in the longer term. We think that concept stores are in a better position to draw the crowd via potential cross-selling from offering all its brands under one roof. Furthermore, anecdotal evidence also suggests that shoppers are more likely to be ‘biased’ towards a concept store compared with a single brand store given the variety of stocks on display. The group’s multi-brand concept store has expanded from 3 in 2003 to 19 in 2009 whereas the number of single brand stores has gone down from 71 in 2003 to only 53 in 2009.
Padini HoldingsA Hard-Wearing Outfit
Target : RM4.25Price : RM3.80
CONSUMER
Stock Profile/StatisticsBloomberg Ticker PAD MKIssued Share Capital (m) 131.6Market Capitalisation (RMm) 500.052 week H | L Price (RM) 4.3 | 2.39Average Volume (3m) ‘000 23.5YTD Returns (%) 1.1Net gearing (x) Net CashAltman Z-Score 5.24ROCE/WACC 1.7Beta (x) 0.8Book Value/share (RM) 1.55
Major Shareholders (%)Yong Pang Chaun 42.6Puncak Bestari SB 27.3
Share Performance (%)Month Absolute Relative1m -3.8 -6.1 3m -3.4 -7.9 6m 23.4 12.9 12m 75.7 3.9
6-month Share Price Performance
4.4
4.2
4.0
3.8
3.6
3.4
3.2
3.0
2.8Oct-09 Nov-09 Dec-09 Jan-10 Feb-10 Mar-10 Apr-10

92
Brands outlets the star performers. The brands outlets are Padini’s version of ‘run-of-the-mill’ shops (akin to Reject Shops and FOS) stocking up a multitude of labels that may not necessarily be its own. Since the opening of the first store in Ampang Point in 2006, the response has been positive. There are currently 8 brands outlets in Malaysia. While sales at these outlets are still lower than that from the multi-brand stores given that the products in these outlets are 50% cheaper than in-house brands, PBT margins are higher at about 30% versus 23% for multi-brand stores, and revenue has grown at a CAGR of 88% over the past 2 years. As most of the products are sourced from consignors, Padini intends to increase the sales proportion of its own products (not in-house brands) to enhance margins. We see the brands outlets providing a cushion in a weak economic climate as the products are priced lower.
Secret of success. Padini’s steady results are backed by its unique business model, which comprises: (i) multi concept stores which can pull in the crowd; (ii) different types of stores targeting different market segments (multi-concept stores and stand-alone stores targeting mid-high end markets whereas the brands outlets target the lower-end market; (iii) outsourcing model, which helps Padini to save on operation costs, (iv) a wide range of products, ranging from accessories to apparel and footwear; (v) a myriad of designs (50 designs per month) for its Vincci shoes, which is the main contributor, accounting for ~34% (FY09) of total revenue; (vi) its well-established local brands, and (vii) the opening of brands outlets serving mainly the lower-end market.
COMPANY REPORT CARD
ROE. Padini’s ROEs are always superior to its peers’, having shot up from 7% in FY04 to 24.3% to FY09. While we expect ROE to moderate to ~20% in the next two years on slower expansion, an ROE of 20% is still well above the industry average.
Management. Mr. Yong, the founder, together with Mr. Chan Kwai Heng, the Executive Director, each have about 20 to 30 years’ experience in the apparel industry.
Dividend. The group paid a net DPS of 13.5 sen in FY09. We have conservatively forecast for Padini to maintain a net DPS of 15 sen for FY10 and 18 sen for FY11, representing ~40% dividend payout.
RECOMMENDATION
We value Padini at a target price of RM4.25, pegged at the industry average of 9.5x PE. While we favour the company’s robust ROE, ROA, earnings growth and strong balance sheet with net cash of RM25m, we maintain our NEUTRAL recommendation given the limited share price upside.
Income Statement (RMm)
FYE 30 June FY08 FY09 FY10f FY11fTurnover 383.3 475.8 492.7 553.2Growth (%) 20.9 24.1 3.6 12.3EBIT 58.4 69.1 71.8 81.2Pretax 57.7 67.6 69.4 79.5Net Earnings 41.7 49.5 51.4 58.9FD EPS (sen) 31.7 37.6 39.0 44.7Growth (%) 20.9 24.1 3.6 12.3NTA/Share (RM) 1.29 1.55 1.91 2.30Div (Gross) (sen) 18.0 13.5 15.0 18.0Div (Yield) (%) 4.7 3.6 3.9 4.7PER (x) 12.0 10.1 9.7 8.5P/NTA (x) 3.0 2.5 2.0 1.6
Balance Sheet (RMm)
FYE 30 June FY07 FY08 FY09Fixed Assets 53.6 74.4 81.2Current Assets 142.1 188.2 208.2Current Liabilities -48.7 -91.6 -81.8Others 0.0 1.7 0.0Total 147.0 172.7 207.6Share capital 65.6 65.8 65.8Reserves 77.1 103.7 138.3Shareholders’ Fund 142.7 169.5 204.0LT Liabilities 4.3 3.2 3.5Others 0.0 0.0 0.0Total 147.0 172.7 207.6Gross Debt 8.2 28.2 31.8Net Cash/ (Debt) 13.7 -6.4 33.7
Cash Flow Statement (RMm)
FYE 30 June FY07 FY08 FY09Cash Flow from Ops 27.3 4.7 63.0Cash Flow from Investing -23.5 -23.9 -19.4Cash Flow from Financing 4.3 19.6 -0.3Net Increase in Cash 8.0 0.4 43.2Cash at Beginning of Year 14.2 21.9 21.8Other Changes -0.4 -0.4 0.6Cash at End of Year 21.9 21.8 65.6
Padini Holdings

93
INVESTMENT MERITS
A leading pipe, fittings and flow controls (PFF) player New JV with Al-Otaishan Trading Group in Saudi Arabia Possess a new stainless steel plant Expanding overseas, with plans to venture to Indonesia
COMPANY PROFILE
Pantech Group Holdings’ (Pantech) history traces back to 1988 when Pantech Corporation SB (Pantech Corp) was established to take over the partnership of Mr. Jimmy Chew and Mr. Goh Teoh Kean. Since then, Pantech has become Malaysia’s leading supplier and stockist of quality stainless steel, API pipes, fittings, valves, flanges and more. As part of the group’s expansion plan, Panaflo and Pantech Kuantan were established to penetrate the Singapore and East Malaysia markets. Pantech Steel SB was incorporated in March 2000 to produce butt-welded carbon steel fittings such as elbows, tees, reducers and end-caps by deploying state-of-the-art technology to manufacture quality butt-welded fittings more efficiently. Pantech Steel exports more than 80% of its products to United States, Canada, South America, Europe and Asean. The company was listed on the Main Board of Bursa Malaysia on 15 Feb 2007.
KEY HIGHLIGHTS
Close to its customers. Recently, Pantech signed a memorandum of understanding (MoU) with Al-Otaishan to set up its first offshore plant in Saudi Arabia to supply carbon steel fittings for the oil and gas industry. Al-Otaishan, a general contractor with interest in the oil and gas sector and petrochemical industries in Saudi Arabia and Gulf Cooperation Council (GCC), will be the sole distributor and agent for Pantech’s products. The new plant is expected to complete by the end of the next financial year. With such presence in Saudi Arabia and GCC, we believe there is potential in the region as the company can tap into Al-Otaishan’s network.
New stainless steel plant. The company has added stainless steel pipes to its manufacturing portfolio. It has invested RM200m over 3 to 5 years in the new manufacturing plant, which has a capacity of 500-600 tonnes per month in Phase 1, which will be operational this year. Orders for stainless steel pipes could easily be met since Pantech is currently trading 300-400 tonnes of stainless steel pipes every month. In Phase 2, it will build a stainless steel fitting plant, and move into alloy fittings and pipes in Phase 3.
Pantech Group HoldingsPiping Hot
Target : RM0.88Price : RM0.935
STEEL
Stock Profile/StatisticsBloomberg Ticker PGHB MKIssued Share Capital (m) 375.0Market Capitalisation (RMm) 350.652 week H | L Price (RM) 1.05 | 0.47Average Volume (3m) ‘000 294.5YTD Returns (%) 3.3Net gearing (x) 0.6Altman Z-Score 3.36ROCE/WACC 2.2Beta (x) 1.4Book Value/share (RM) 0.53
Major Shareholders (%)CTL Capital Holdings 22.5GL Management Agency 16.6Koperasi Permodalan FELDA 12.4
Share Performance (%)Month Absolute Relative1m -1.0 -5.4 3m 0.0 -6.5 6m 6.1 -6.4 12m 101.0 31.2
6-month Share Price Performance
1.1
1.0
0.9
0.8Oct-09 Nov-09 Dec-09 Jan-10 Feb-10 Mar-10 Apr-10

94
Projects ongoing. Pantech’s presence in the major oil and gas, and petrochemicals hubs as well as palm oil refineries in the region gives it an advantage over other players. Management has indicated its projects in hand are still ongoing, with manufacturing orders to sustain until July 2010. Pantech’s involvement in the Shell Gumusut project’s submersible rig will sustain demand for its products.
Expanding abroad. Pantech is currently focusing on overseas sales to Kazakhstan, India, UAE, Sri Lanka, Brunei and Mexico, from which it receives regular orders. It has also ventured into Venezuela. In line with plans to penetrate Indonesia, the company is in the process of setting up a representative office in that country.
COMPANY REPORT CARD
ROE. Pantech’s ROE has been a healthy 23% to 35%, which we expect to rise steadily as the company focuses on delivering attractive margins.
Management. Pantech’s management comprises professionals who are the driving force behind its success.
Dividend. Despite being a young listed company, management realises the importance of rewarding shareholders and has declared a satisfactory gross dividend of 3.0 sen for FY10.
RECOMMENDATION
We maintain our NEUTRAL recommendation and derive a TP of RM0.88 based on a 6x PER over FY11 EPS.
Income Statement (RMm)
FYE 28 Feb FY08 FY09 FY10f FY11fTurnover 313.5 511.2 517.2 533.7Growth (%) 246.0 63.1 1.2 3.2EBIT 51.2 90.5 81.4 85.0Pretax 44.9 82.0 68.5 71.6Net Earnings 34.2 59.6 50.7 53.0FD EPS (sen) 22.8 15.9 13.5 14.1Growth (%) 27.0 -30.2 -15.0 4.5NTA/Share (RM) 0.98 0.53 0.43 0.49Div (Gross) (sen) 5.2 2.2 3.0 3.5Div (Yield) (%) 5.6 2.3 3.2 3.7PER (x) 4.1 5.9 6.9 6.6P/NTA (x) 1.0 1.8 2.2 1.9
Balance Sheet (RMm)
FYE 28 Feb FY07 FY08 FY09Fixed Assets 41.8 57.6 67.4Current Assets 197.9 220.4 341.8Current Liabilities -92.7 -99.8 -174.3Others 0.0 0.0 0.0Total 147.1 178.2 234.9Share capital 75.0 75.0 75.0Reserves 43.0 71.5 124.9Shareholders’ Fund 118.0 146.5 199.9LT Liabilities 30.1 31.7 35.0Others -1.0 0.0 0.0Total 147.1 178.2 234.9Gross Debt 103.5 102.1 158.2Net Cash/ (Debt) -70.7 -96.4 -124.4
Cash Flow Statement (RMm)
FYE 28 Feb FY07 FY08 FY09Cash Flow from Ops -8.0 -10.8 38.7Cash Flow from Investing 16.8 -16.5 -13.6Cash Flow from Financing 22.8 0.6 3.7Net Increase in Cash 31.6 -26.7 28.8Cash at Beginning of Year 0.0 31.6 4.9Other Changes 0.0 0.0 0.1Cash at End of Year 31.6 4.9 33.8
Pantech Group Holdings

95
INVESTMENT MERITS
Number 1 stationery brand in Germany Award winning “Pelikan” brand, established since 1838 Global presence in 160 countries Earnings to double on acquisition of Herlitz Continuous expansion to new markets Undemanding valuations for its global exposure BUY at a TP of RM1.44 (based on 8x FY10 EPS)
COMPANY PROFILE
The company started as Diperdana Holdings (Diperdana), a service provider of mainly logistics and haulage services. In April 2005, the company disposed of its logistics and haulage business and took up a controlling stake in Pelikan Holding AG, a stationery company listed on the Switzerland Stock Exchange. In June, Diperdana changed its name to Pelikan International Corporation, marking a major change in its business and a new beginning. Currently, Pelikan is listed on the Bursa Malaysia Main Board. The enduring 171-year-old Pelikan brand deals mainly with the design and manufacture of writing instruments, art and leisure colour painting articles, and school and business supplies and learning utensils.
KEY HIGHLIGHTS
Strong branding in Europe. Pelikan is a leading brand in Europe, with many of its products commanding the largest market share in the region. While Pelikan could not escape the impact of deteriorating consumer spending in Europe, we believe the group will recover faster than the rest, premised on the fact that stationery products are deemed necessities and there is certain brand affinity for its products in the region. Better still, as it is mandatory for school children to use fountain pens in parts of Europe, the demand for Pelikan’s range of fountain pens specifically catering for the student market will remain stable.
Acquisition of Herlitz to double earnings. Although Pelikan’s margins are under pressure in the interim due to anaemic consumer spending in Europe, which has in turn dragged down sales and rendered it insufficient to cover fixed costs, the company stands to reap substantial cost synergies from R&D expenses, labour costs, raw material costs and cross selling etc after its recent acquisition of Herlitz. As Pelikan and Herlitz have commanding presence in different markets and make products that complement each other, the consolidation of the two entities would give rise to substantial cost savings via cross selling and riding on each other’s distribution networks. In the immediate term, Pelikan plans to streamline its logistics centre in a central location in Berlin (logistics centre owned by Herlitz), from which it stands to realize cost savings amounting to EUR5m/annum. In the longer term, Pelikan would embark on a plant rationalization to reduce the numbers of plants in the combined entity from 13 to 3. Based on management guidance, the acquisition would double the group’s top and bottom line.
Pelikan InternationalGrowing Global Profile
Target : RM1.44Price : RM1.31
CONSUMER
Stock Profile/StatisticsBloomberg Ticker PELI MK Issued Share Capital (m) 512.8Market Capitalisation (RMm) 671.852 week H | L Price (RM) 1.61 | 0.70Average Volume (3m) ‘000 457.9YTD Returns (%) 3.4Net gearing (x) 0.6Altman Z-Score 1.76ROCE/WACC 0.4Beta (x) 1.6Book Value/share (RM) 1.16
Major Shareholders (%)LTH 30.1PBS Office Supplies Holdings 20.2H Partners Management 6.2
Share Performance (%)Month Absolute Relative1m 8.1 2.9 3m -2.9 -8.2 6m -5.3 -17.1 12m 90.6 15.5
6-month Share Price Performance
1.5
1.4
1.3
1.2Oct-09 Nov-09 Dec-09 Jan-10 Feb-10 Mar-10 Apr-10

96
Continuous expansion. The group is still actively seeking business opportunities as its core stationery business is highly dependent on volume, which has slowed considerably in its traditional markets. Pelikan is targeting the United Kingdom, India and Latin America, all of which have large populations to tap. By targeting new markets, Pelikan would be able to maintain a sustainable increase in earnings over the longer term to supplement the largely organic growth in its more mature markets. It is worth mentioning that although sales contraction is seen across the board, Mexico and Asia still registered positive sales growth and only a slight contraction respectively in FY09. Funding is now less of a concern since the group has completed a rights issue to raise proceeds totaling RM188.7m. We see its net gearing hovering at 0.5x-0.6x in the next two years.
Inks Porsche manufacturing and distribution contract. Pelikan recently entered into a Manufacturing and Distribution Licence Agreement with Porsche Lizenz- und Handelsgesellschaft mbH & Co. KG, Germany for the use of the “Porsche Design” trademark on its writing instruments. The agreement gives Pelikan 5-year rights to manufacture and distribute writing instruments under the “Porsche Design” brand worldwide commencing 1 Jan 2011. Pelikan’s guidance is that it could reap RM100m in sales over 5 years. While this would not have a substantial impact on group earnings, it will nonetheless raise Pelikan’s profile as a leading writing instrument maker. The agreement also gives Pelikan the opportunity to keep a close eye on the design of Porsche writing instruments.
COMPANY REPORT CARD
ROE. The group’s ROE has been hovering at an average 18% from 2005-2007 but has dropped to an average 6.4% over the past 2 years. Going forward, we expect ROE to climb to 11%-12% as cost synergies from the acquisition of Herlitz help double group earnings.
Management. Mr. Loo Hooi Keat, the man behind the switch to the Pelikan business, is the Group CEO of Pelikan International and Switzerland. Given its established brand name and the expertise of its professionals, the company will be on the right track towards achieving its goals of consolidating and expanding Pelikan.
Dividend. While Pelikan’s dividend payout has dropped from ~30% to 17% in 2008, we are forecasting a payout ~30% of the group’s net earnings going forward.
RECOMMENDATION
Our target price of RM1.44 is based on 8x FY10 EPS. Based on Pelikan’s currently undemanding 8x forward PE, the stock offers a good entry level for investors seeking to tap on its strong earnings growth, which could potentially double in FY10.
Income Statement (RMm)
FYE 31 Dec FY07 FY08 FY09 FY10fTurnover 1194.9 1288.5 1208.3 2516.4Growth (%) 81.2 7.8 -6.2 108.3EBIT 119.3 77.0 69.2 193.6Pretax 99.8 49.4 50.0 144.5Net Earnings 93.1 36.7 34.9 92.8FD EPS (sen) 27.1 10.7 10.2 27.0Growth (%) 81.2 7.8 -6.2 108.3NTA/Share (RM) 0.65 0.74 0.84 1.34Div (Gross) (sen) 11.0 2.0 2.0 5.0Div (Yield) (%) 8.4 1.5 1.5 3.8PER (x) 4.8 12.3 12.9 4.8P/NTA (x) 2.0 1.8 1.6 1.0
Balance Sheet (RMm)
FYE 31 Dec FY07 FY08 FY09Fixed Assets 773.0 767.6 798.5Current Assets 787.7 733.7 697.2Current Liabilities -473.9 -449.3 -462.9Others 0.0 0.0 0.0Total 1086.8 1051.9 1032.7Share capital 288.1 343.2 343.2Reserves 200.7 200.5 229.6Shareholders’ Fund 488.7 543.6 572.7LT Liabilities 577.2 489.1 433.1Others 20.8 19.2 26.9Total 1086.8 1051.9 1032.7Gross Debt 342.0 366.4 388.1Net Cash/ (Debt) -230.2 -289.4 -325.4
Cash Flow Statement (RMm)
FYE 31 Dec FY07 FY08 FY09Cash Flow from Ops 53.6 43.8 36.2Cash Flow from Investing -13.8 -43.8 -44.4Cash Flow from Financing 5.7 -0.1 23.1Net Increase in Cash 45.6 -0.1 14.9Cash at Beginning of Year 29.6 70.8 43.8Other Changes -4.5 -26.8 -6.5Cash at End of Year 70.8 43.8 52.3
Pelikan International

97
INVESTMENT MERITS
Upcoming malls and monorail in Taman Desa Tebrau to boost growth
Has a sizeable land bank, strong balance sheet and solid cash flow
Sitting on net cash of RM1.82/share, or about 60.5% of current share price
Shrewd and professional management team Attractive valuation at 0.55x CY10 P/NTA.
COMPANY PROFILE
Plenitude was incorporated on 6 Nov, 2000 as a private limited company and subsequently converted to a public limited company the same year. Plenitude was listed on the Bursa Malaysia Main Board on 18 Nov, 2003. The success of the Group, which is well diversified throughout Peninsular Malaysia, over the past few years is attributable to the development of its strategically located properties such as Taman Desa Tebrau in Johor Baru, Taman Putra Prima in Sepang, The Residences at Changkat Kiara and Changkat View Condominium in Sri Hartamas, as well as Bandar Perdana in Sungai Petani. Plenitude still has over 2,000 acres of undeveloped land with a GDV of over RM4bn. In 2001, the Group acquired the 3-star, 200-room Tanjung Bungah Beach Hotel for RM19.1m from Danaharta. Plenitude also bought another 10.6-acre freehold land in Bandar Batu Feringghi, Penang. In 2007, the company sold a piece of land in the Desa Tebrau township to the Ikano Group for the development of the latter’s famed IKEA mall.
KEY HIGHLIGHTS
Taman Desa Tebrau, Johor Baru. This RM2.0bn development on 965.7 acres 14km from JB town has enjoyed a take-up rate of 90% for all its launches so far and has undeveloped landbank of about 600 acres. The upcoming IKEA mall, expected to join the ranks of Aeon Jusco Tebrau and Tesco in the next few years, was set to boost the township’s attractiveness but for some reason, plans for its construction has been delayed to sometime this year or the next. Another factor underpinning the township’s competitive edge over other townships in the vicinity is the proposed monorail system covering Taman Desa Tebrau City, which will bring tremendous growth to the township.
PlenitudeA Long-term Value Creator
Target : RM4.60Price : RM3.01
PROPERTY
Stock Profile/StatisticsBloomberg Ticker PLEN MKIssued Share Capital (m) 135.0Market Capitalisation (RMm) 406.452 week H | L Price (RM) 3.15 | 1.81Average Volume (3m) ‘000 32.8YTD Returns (%) 14.4Net gearing (x) Net CashAltman Z-Score 3.50ROCE/WACC 1.1Beta (x) 0.9Book Value/share (RM) 4.83
Major Shareholders (%)Ikatanbina Sdn Bhd 45.5Ong Bee Kuan 19.6
Share Performance (%)Month Absolute Relative1m 7.4 2.1 3m 11.7 7.0 6m 12.4 -5.6 12m 72.8 9.5
6-month Share Price Performance
3.1
3.0
2.9
2.8
2.7
2.6Oct-09 Nov-09 Dec-09 Jan-10 Feb-10 Mar-10 Apr-10
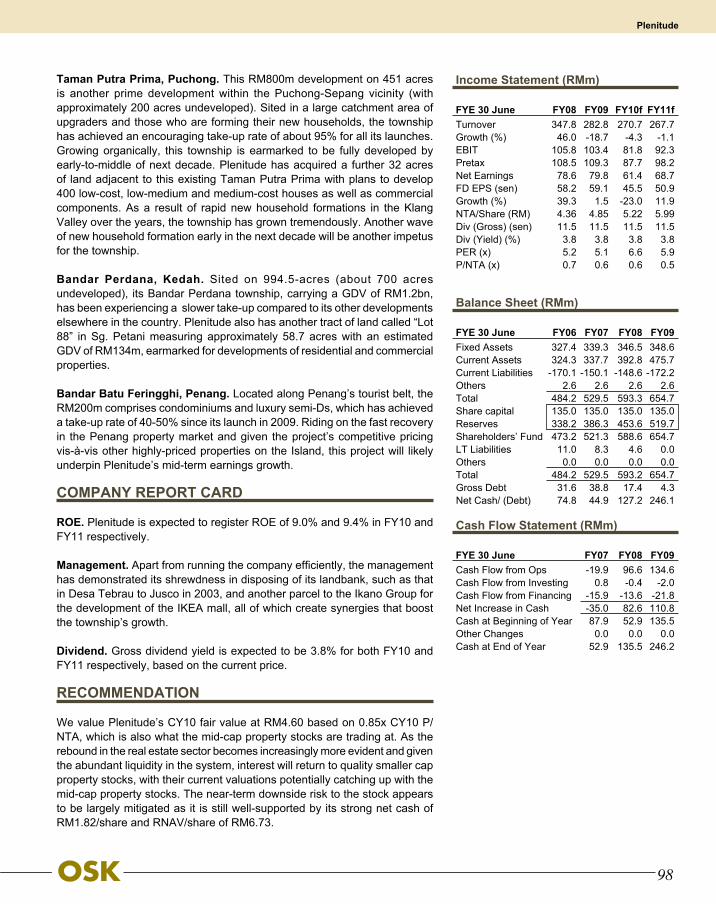
98
Taman Putra Prima, Puchong. This RM800m development on 451 acres is another prime development within the Puchong-Sepang vicinity (with approximately 200 acres undeveloped). Sited in a large catchment area of upgraders and those who are forming their new households, the township has achieved an encouraging take-up rate of about 95% for all its launches. Growing organically, this township is earmarked to be fully developed by early-to-middle of next decade. Plenitude has acquired a further 32 acres of land adjacent to this existing Taman Putra Prima with plans to develop 400 low-cost, low-medium and medium-cost houses as well as commercial components. As a result of rapid new household formations in the Klang Valley over the years, the township has grown tremendously. Another wave of new household formation early in the next decade will be another impetus for the township.
Bandar Perdana, Kedah. Sited on 994.5-acres (about 700 acres undeveloped), its Bandar Perdana township, carrying a GDV of RM1.2bn, has been experiencing a slower take-up compared to its other developments elsewhere in the country. Plenitude also has another tract of land called “Lot 88” in Sg. Petani measuring approximately 58.7 acres with an estimated GDV of RM134m, earmarked for developments of residential and commercial properties.
Bandar Batu Feringghi, Penang. Located along Penang’s tourist belt, the RM200m comprises condominiums and luxury semi-Ds, which has achieved a take-up rate of 40-50% since its launch in 2009. Riding on the fast recovery in the Penang property market and given the project’s competitive pricing vis-à-vis other highly-priced properties on the Island, this project will likely underpin Plenitude’s mid-term earnings growth.
COMPANY REPORT CARD
ROE. Plenitude is expected to register ROE of 9.0% and 9.4% in FY10 and FY11 respectively.
Management. Apart from running the company efficiently, the management has demonstrated its shrewdness in disposing of its landbank, such as that in Desa Tebrau to Jusco in 2003, and another parcel to the Ikano Group for the development of the IKEA mall, all of which create synergies that boost the township’s growth.
Dividend. Gross dividend yield is expected to be 3.8% for both FY10 and FY11 respectively, based on the current price.
RECOMMENDATION
We value Plenitude’s CY10 fair value at RM4.60 based on 0.85x CY10 P/NTA, which is also what the mid-cap property stocks are trading at. As the rebound in the real estate sector becomes increasingly more evident and given the abundant liquidity in the system, interest will return to quality smaller cap property stocks, with their current valuations potentially catching up with the mid-cap property stocks. The near-term downside risk to the stock appears to be largely mitigated as it is still well-supported by its strong net cash of RM1.82/share and RNAV/share of RM6.73.
Income Statement (RMm)
FYE 30 June FY08 FY09 FY10f FY11fTurnover 347.8 282.8 270.7 267.7Growth (%) 46.0 -18.7 -4.3 -1.1EBIT 105.8 103.4 81.8 92.3Pretax 108.5 109.3 87.7 98.2Net Earnings 78.6 79.8 61.4 68.7FD EPS (sen) 58.2 59.1 45.5 50.9Growth (%) 39.3 1.5 -23.0 11.9NTA/Share (RM) 4.36 4.85 5.22 5.99Div (Gross) (sen) 11.5 11.5 11.5 11.5Div (Yield) (%) 3.8 3.8 3.8 3.8PER (x) 5.2 5.1 6.6 5.9P/NTA (x) 0.7 0.6 0.6 0.5
Balance Sheet (RMm)
FYE 30 June FY06 FY07 FY08 FY09Fixed Assets 327.4 339.3 346.5 348.6Current Assets 324.3 337.7 392.8 475.7Current Liabilities -170.1 -150.1 -148.6 -172.2Others 2.6 2.6 2.6 2.6Total 484.2 529.5 593.3 654.7Share capital 135.0 135.0 135.0 135.0Reserves 338.2 386.3 453.6 519.7Shareholders’ Fund 473.2 521.3 588.6 654.7LT Liabilities 11.0 8.3 4.6 0.0Others 0.0 0.0 0.0 0.0Total 484.2 529.5 593.2 654.7Gross Debt 31.6 38.8 17.4 4.3Net Cash/ (Debt) 74.8 44.9 127.2 246.1
Cash Flow Statement (RMm)
FYE 30 June FY07 FY08 FY09Cash Flow from Ops -19.9 96.6 134.6Cash Flow from Investing 0.8 -0.4 -2.0Cash Flow from Financing -15.9 -13.6 -21.8Net Increase in Cash -35.0 82.6 110.8Cash at Beginning of Year 87.9 52.9 135.5Other Changes 0.0 0.0 0.0Cash at End of Year 52.9 135.5 246.2
Plenitude
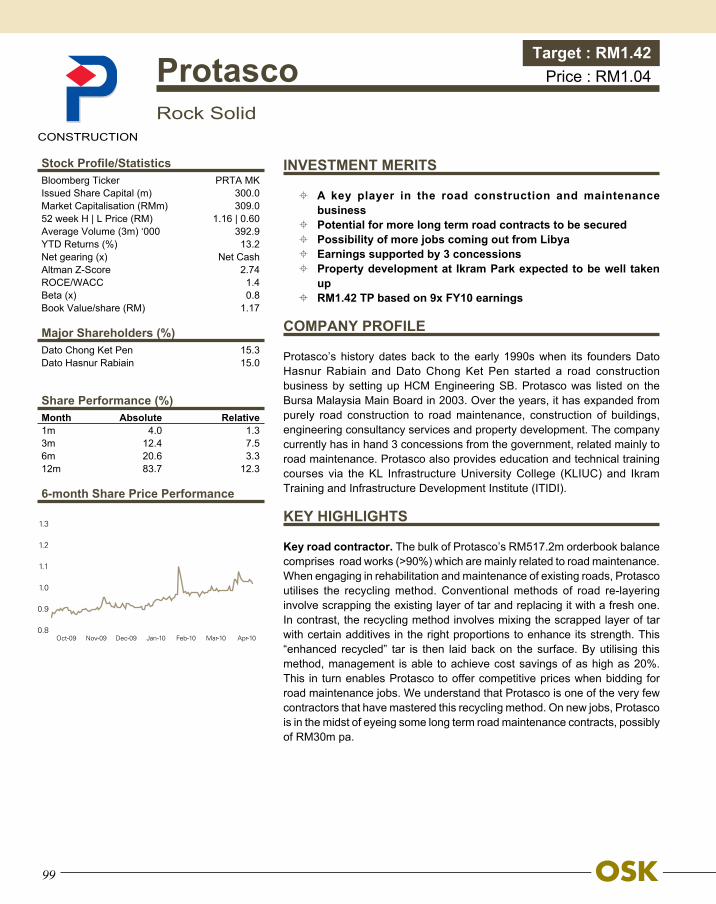
99
INVESTMENT MERITS
A key player in the road construction and maintenance business
Potential for more long term road contracts to be secured Possibility of more jobs coming out from Libya Earnings supported by 3 concessions Property development at Ikram Park expected to be well taken
upRM1.42 TP based on 9x FY10 earnings
COMPANY PROFILE
Protasco’s history dates back to the early 1990s when its founders Dato Hasnur Rabiain and Dato Chong Ket Pen started a road construction business by setting up HCM Engineering SB. Protasco was listed on the Bursa Malaysia Main Board in 2003. Over the years, it has expanded from purely road construction to road maintenance, construction of buildings, engineering consultancy services and property development. The company currently has in hand 3 concessions from the government, related mainly to road maintenance. Protasco also provides education and technical training courses via the KL Infrastructure University College (KLIUC) and Ikram Training and Infrastructure Development Institute (ITIDI).
KEY HIGHLIGHTS
Key road contractor. The bulk of Protasco’s RM517.2m orderbook balance comprises road works (>90%) which are mainly related to road maintenance. When engaging in rehabilitation and maintenance of existing roads, Protasco utilises the recycling method. Conventional methods of road re-layering involve scrapping the existing layer of tar and replacing it with a fresh one. In contrast, the recycling method involves mixing the scrapped layer of tar with certain additives in the right proportions to enhance its strength. This “enhanced recycled” tar is then laid back on the surface. By utilising this method, management is able to achieve cost savings of as high as 20%. This in turn enables Protasco to offer competitive prices when bidding for road maintenance jobs. We understand that Protasco is one of the very few contractors that have mastered this recycling method. On new jobs, Protasco is in the midst of eyeing some long term road maintenance contracts, possibly of RM30m pa.
Protasco Rock Solid
Target : RM1.42Price : RM1.04
CONSTRUCTION
Stock Profile/StatisticsBloomberg Ticker PRTA MKIssued Share Capital (m) 300.0Market Capitalisation (RMm) 309.052 week H | L Price (RM) 1.16 | 0.60Average Volume (3m) ‘000 392.9YTD Returns (%) 13.2Net gearing (x) Net CashAltman Z-Score 2.74ROCE/WACC 1.4Beta (x) 0.8Book Value/share (RM) 1.17
Major Shareholders (%)Dato Chong Ket Pen 15.3 Dato Hasnur Rabiain 15.0
Share Performance (%)Month Absolute Relative1m 4.0 1.3 3m 12.4 7.5 6m 20.6 3.3 12m 83.7 12.3
6-month Share Price Performance
1.3
1.2
1.1
1.0
0.9
0.8Oct-09 Nov-09 Dec-09 Jan-10 Feb-10 Mar-10 Apr-10
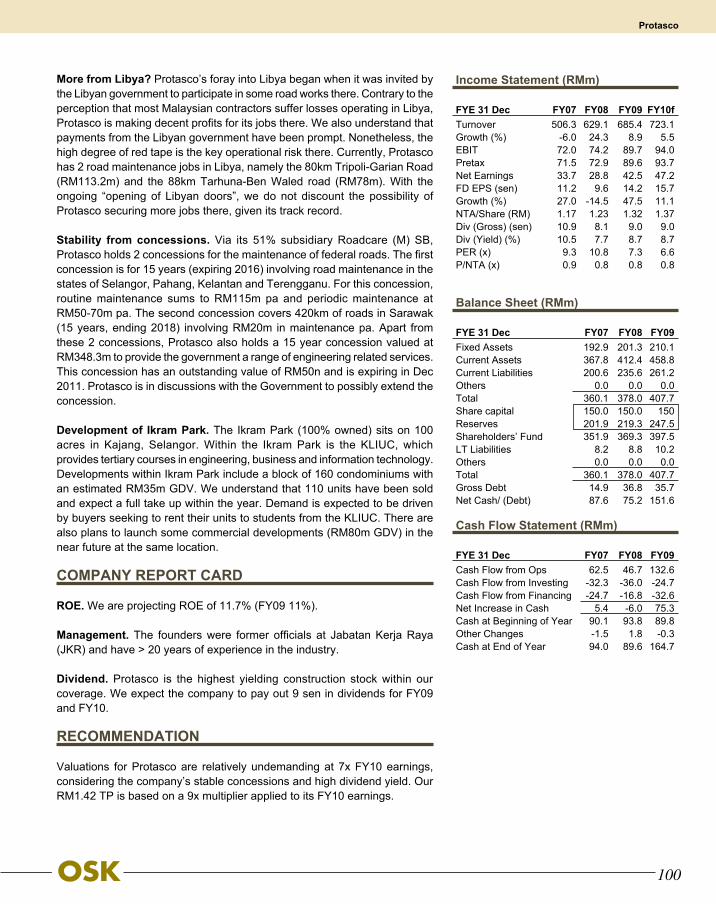
100
More from Libya? Protasco’s foray into Libya began when it was invited by the Libyan government to participate in some road works there. Contrary to the perception that most Malaysian contractors suffer losses operating in Libya, Protasco is making decent profits for its jobs there. We also understand that payments from the Libyan government have been prompt. Nonetheless, the high degree of red tape is the key operational risk there. Currently, Protasco has 2 road maintenance jobs in Libya, namely the 80km Tripoli-Garian Road (RM113.2m) and the 88km Tarhuna-Ben Waled road (RM78m). With the ongoing “opening of Libyan doors”, we do not discount the possibility of Protasco securing more jobs there, given its track record.
Stability from concessions. Via its 51% subsidiary Roadcare (M) SB, Protasco holds 2 concessions for the maintenance of federal roads. The first concession is for 15 years (expiring 2016) involving road maintenance in the states of Selangor, Pahang, Kelantan and Terengganu. For this concession, routine maintenance sums to RM115m pa and periodic maintenance at RM50-70m pa. The second concession covers 420km of roads in Sarawak (15 years, ending 2018) involving RM20m in maintenance pa. Apart from these 2 concessions, Protasco also holds a 15 year concession valued at RM348.3m to provide the government a range of engineering related services. This concession has an outstanding value of RM50n and is expiring in Dec 2011. Protasco is in discussions with the Government to possibly extend the concession.
Development of Ikram Park. The Ikram Park (100% owned) sits on 100 acres in Kajang, Selangor. Within the Ikram Park is the KLIUC, which provides tertiary courses in engineering, business and information technology. Developments within Ikram Park include a block of 160 condominiums with an estimated RM35m GDV. We understand that 110 units have been sold and expect a full take up within the year. Demand is expected to be driven by buyers seeking to rent their units to students from the KLIUC. There are also plans to launch some commercial developments (RM80m GDV) in the near future at the same location.
COMPANY REPORT CARD
ROE. We are projecting ROE of 11.7% (FY09 11%). Management. The founders were former officials at Jabatan Kerja Raya (JKR) and have > 20 years of experience in the industry.
Dividend. Protasco is the highest yielding construction stock within our coverage. We expect the company to pay out 9 sen in dividends for FY09 and FY10.
RECOMMENDATION
Valuations for Protasco are relatively undemanding at 7x FY10 earnings, considering the company’s stable concessions and high dividend yield. Our RM1.42 TP is based on a 9x multiplier applied to its FY10 earnings.
Income Statement (RMm)
FYE 31 Dec FY07 FY08 FY09 FY10fTurnover 506.3 629.1 685.4 723.1Growth (%) -6.0 24.3 8.9 5.5EBIT 72.0 74.2 89.7 94.0Pretax 71.5 72.9 89.6 93.7Net Earnings 33.7 28.8 42.5 47.2FD EPS (sen) 11.2 9.6 14.2 15.7Growth (%) 27.0 -14.5 47.5 11.1NTA/Share (RM) 1.17 1.23 1.32 1.37Div (Gross) (sen) 10.9 8.1 9.0 9.0Div (Yield) (%) 10.5 7.7 8.7 8.7PER (x) 9.3 10.8 7.3 6.6P/NTA (x) 0.9 0.8 0.8 0.8
Balance Sheet (RMm)
FYE 31 Dec FY07 FY08 FY09Fixed Assets 192.9 201.3 210.1Current Assets 367.8 412.4 458.8Current Liabilities 200.6 235.6 261.2Others 0.0 0.0 0.0Total 360.1 378.0 407.7Share capital 150.0 150.0 150Reserves 201.9 219.3 247.5Shareholders’ Fund 351.9 369.3 397.5LT Liabilities 8.2 8.8 10.2Others 0.0 0.0 0.0Total 360.1 378.0 407.7Gross Debt 14.9 36.8 35.7Net Cash/ (Debt) 87.6 75.2 151.6
Cash Flow Statement (RMm)
FYE 31 Dec FY07 FY08 FY09Cash Flow from Ops 62.5 46.7 132.6Cash Flow from Investing -32.3 -36.0 -24.7Cash Flow from Financing -24.7 -16.8 -32.6Net Increase in Cash 5.4 -6.0 75.3Cash at Beginning of Year 90.1 93.8 89.8Other Changes -1.5 1.8 -0.3Cash at End of Year 94.0 89.6 164.7
Protasco

101
INVESTMENT MERITS
Unbroken 20-year earnings track record Expanding livestock activities to Vietnam Palm oil activities to drive long-term growth Potential catalyst from palm pellet project Regional expansion in marine products manufacturing
COMPANY PROFILE
Founded in 1987, QL Resources (QL) started as a small-scale trader in marine-based products and subsequently grew into an integrated resource-based food and agricultural group. The company was listed in March 2000 and transferred to the Main Board in January 2002. Today, QL is a diversified agriculture-based group of companies involved in marine product manufacturing (MPM); oil palm plantation and milling (OPPM) and feed commodities and livestock farming (FCLF). A major player in the resource-based agro business, the company can proudly lay claim to an uninterrupted earnings track record for the last 20 years.
KEY HIGHLIGHTS
Sustainable earnings from palm oil activities. The company has a 20,000ha of land in Tarakan, East Kalimantan, of which 10,000ha is planted with CPO. It would take another 2 years to plant the remaining 10,000ha of land. Two mills, each costing about US$8m-US$10m, will be built there with the first mill completed in 2006. Management, which expects this division to contribute about 40% of group PBT in 6 to 10 years, said the company is looking to acquire more plantation land in Indonesia.
A boost from palm biomass. QL recently ventured into biomass (palm pellets), which produces energy equivalent to that from wood pellets. The project is currently being commercialised and is expected to contribute by FY2011. As we stated in our previous report, there is huge potential in Europe given that palm pellets are widely used throughout the continent and may be a cheaper alternative to wood pellets. Apart from its maiden project, management intends to add one more processing mill in Kalimantan.
QL ResourcesAn Enviable Earnings Record
Target : RM4.30Price : RM3.44
CONSUMER
Stock Profile/StatisticsBloomberg Ticker QLG MKIssued Share Capital (m) 395.2Market Capitalisation (RMm) 1,355.452 week H | L Price (RM) 3.52 | 2.04Average Volume (3m) ‘000 305.9YTD Returns (%) 6.1Net gearing (x) 0.7Altman Z-Score 3.67ROCE/WACC 1.4Beta (x) 0.8Book Value/share (RM) 1.05
Major Shareholders (%)CBG Holdings SB 47.0Farsathy Holdings SB 13.5
Share Performance (%)Month Absolute Relative1m -0.6 -3.9 3m 3.4 -1.5 6m 21.8 10.3 12m 70.1 13.5
6-month Share Price Performance
3.5
3.4
3.3
3.2
3.1
3.0
2.9
2.8
2.7Oct-09 Nov-09 Dec-09 Jan-10 Feb-10 Mar-10 Apr-10

102
Potential in aquaculture. The first phase of QL’s new surimi plant in Surabaya, Indonesia, which will have a production capacity of 5000 tonnes per year, will boost its existing production by at least 25%. Construction of the plant, which will cost about RM25m, will be internally funded. QL is also looking at expanding its fishmeal business in Phase 2 of the Surabaya plant, for which construction is expected to start in 2012. QL is currently studying the potential for prawn farming. Unlike conventional culture of tiger prawns, the group intends to grow a new prawn species, penaeus vannamei, which is less susceptible to disease but costs less to produce. This project will entail QL buying 100 ha of land in the east coast to build an integrated system with ponds, a water treatment system and so on. These are expected to incur capex of RM80m for FY10 and FY11.
ILF expands to Vietnam. QL will also be expanding to Vietnam its integrated livestock farming operation (ILF), which has been deferred for nearly two years. It is expected to inject about RM30m-RM40m into the project over the next two years to set up a day-old breeder farm and a semi-closed layer house targeting 300,000 eggs per day. The day-old breeder farm will be set up via a proposed joint venture (JV) with a local egg producer. We believe there is potential in Vietnam as the Vietnamese Government encourages modern closed systems to mitigate the risk of birds contracting viruses and to re-build public confidence. As a consequence, many small scale farms have wound up as modern closed air-conditioning systems require heavy capital expenditure, which most poultry farmers can ill-afford. Since the average egg consumption per capita in Vietnam is 90 eggs per annum compared to 200 for Malaysia, there is promise of good growth potential in that country.
COMPANY REPORT CARD
ROE. Over the past 3 years, QL has been registering impressive ROEs of around 24%. We expect this to be maintained in the next 3 years.
Management .The company’s Managing Director, Mr. Chia Song Kun, who is also the founder, has been in the business for more than 20 years. He has won numerous awards, such as the KPMG Shareholder Value Awards, the Edge’s Top 20 CEO in Malaysia and is one of the Top 5 nominees in the 2006 Ernst & Young Entrepreneur Award Master Category.
Dividend. Based on a payout ratio of 25.9% of net profit, we expect QL to pay a 12 sen gross dividend for FY11, which translates into a gross yield of 3.6%.
RECOMMENDATION
We believe the company, which has demonstrated an ability to grow in times of crisis and being an integrated player, will be fairly resilient going forward. This justifies our BUY recommendation with a target price of RM4.30, based on 15x PER on FY11 EPS.
Income Statement (RMm)
FYE 31 Mar FY08 FY09 FY10f FY11fTurnover 1302.0 1397.9 1498.2 1659.4Growth (%) 16.4 7.4 12.8 10.8EBIT 103.8 116.0 135.6 154.8Pretax 95.8 109.9 119.2 137.5Net Earnings 80.8 89.3 97.5 113.6FD EPS (sen) 20.4 22.6 24.6 28.7Growth (%) 27.8 10.6 9.2 16.5NTA/Share (RM) 1.08 1.25 1.23 1.42Div (Gross) (sen) 6.5 7.0 10.0 12.0Div (Yield) (%) 1.9 2.0 2.9 3.5PER (x) 16.8 15.2 13.9 12.0P/NTA (x) 3.2 2.7 2.8 2.4
Balance Sheet (RMm)
FYE 31 Mar FY07 FY08 FY09Fixed Assets 366.2 465.4 568.8Current Assets 304.6 362.4 384.6Current Liabilities -259.8 -318.4 -295.8Others 0.0 0.0 0.0Total 411.1 509.4 657.7Share capital 110.0 110.0 165.0Reserves 187.8 250.8 252.9Shareholders’ Fund 297.8 360.8 417.9LT Liabilities 87.8 109.2 192.4Others 25.5 39.5 47.4Total 411.1 509.4 657.7Gross Debt 264.8 317.0 378.5Net Cash/ (Debt) -236.5 -269.0 -310.2
Cash Flow Statement (RMm)
FYE 31 Mar FY07 FY08 FY09Cash Flow from Ops 95.7 116.5 77.2Cash Flow from Investing -79.9 -116.5 -129.9Cash Flow from Financing -16.9 17.5 79.0Net Increase in Cash -1.1 17.6 26.2Cash at Beginning of Year 18.7 17.6 35.1Other Changes 0.0 0.0 0.0Cash at End of Year 17.5 35.1 61.3
QL Resources
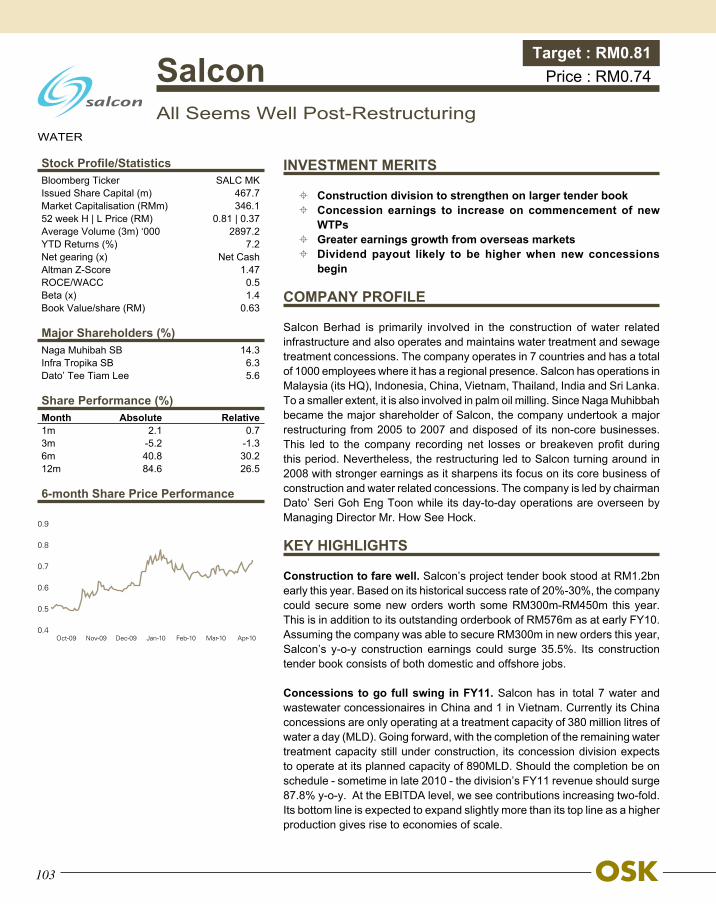
103
INVESTMENT MERITS
Construction division to strengthen on larger tender book Concession earnings to increase on commencement of new
WTPs Greater earnings growth from overseas markets Dividend payout likely to be higher when new concessions
begin
COMPANY PROFILE
Salcon Berhad is primarily involved in the construction of water related infrastructure and also operates and maintains water treatment and sewage treatment concessions. The company operates in 7 countries and has a total of 1000 employees where it has a regional presence. Salcon has operations in Malaysia (its HQ), Indonesia, China, Vietnam, Thailand, India and Sri Lanka. To a smaller extent, it is also involved in palm oil milling. Since Naga Muhibbah became the major shareholder of Salcon, the company undertook a major restructuring from 2005 to 2007 and disposed of its non-core businesses. This led to the company recording net losses or breakeven profit during this period. Nevertheless, the restructuring led to Salcon turning around in 2008 with stronger earnings as it sharpens its focus on its core business of construction and water related concessions. The company is led by chairman Dato’ Seri Goh Eng Toon while its day-to-day operations are overseen by Managing Director Mr. How See Hock.
KEY HIGHLIGHTS
Construction to fare well. Salcon’s project tender book stood at RM1.2bn early this year. Based on its historical success rate of 20%-30%, the company could secure some new orders worth some RM300m-RM450m this year. This is in addition to its outstanding orderbook of RM576m as at early FY10. Assuming the company was able to secure RM300m in new orders this year, Salcon’s y-o-y construction earnings could surge 35.5%. Its construction tender book consists of both domestic and offshore jobs.
Concessions to go full swing in FY11. Salcon has in total 7 water and wastewater concessionaires in China and 1 in Vietnam. Currently its China concessions are only operating at a treatment capacity of 380 million litres of water a day (MLD). Going forward, with the completion of the remaining water treatment capacity still under construction, its concession division expects to operate at its planned capacity of 890MLD. Should the completion be on schedule - sometime in late 2010 - the division’s FY11 revenue should surge 87.8% y-o-y. At the EBITDA level, we see contributions increasing two-fold. Its bottom line is expected to expand slightly more than its top line as a higher production gives rise to economies of scale.
SalconAll Seems Well Post-Restructuring
Target : RM0.81Price : RM0.74
WATER
Stock Profile/StatisticsBloomberg Ticker SALC MKIssued Share Capital (m) 467.7Market Capitalisation (RMm) 346.152 week H | L Price (RM) 0.81 | 0.37Average Volume (3m) ‘000 2897.2YTD Returns (%) 7.2Net gearing (x) Net CashAltman Z-Score 1.47ROCE/WACC 0.5Beta (x) 1.4Book Value/share (RM) 0.63
Major Shareholders (%)Naga Muhibah SB 14.3Infra Tropika SB 6.3Dato’ Tee Tiam Lee 5.6
Share Performance (%)Month Absolute Relative1m 2.1 0.7 3m -5.2 -1.3 6m 40.8 30.2 12m 84.6 26.5
6-month Share Price Performance
0.9
0.8
0.7
0.6
0.5
0.4Oct-09 Nov-09 Dec-09 Jan-10 Feb-10 Mar-10 Apr-10
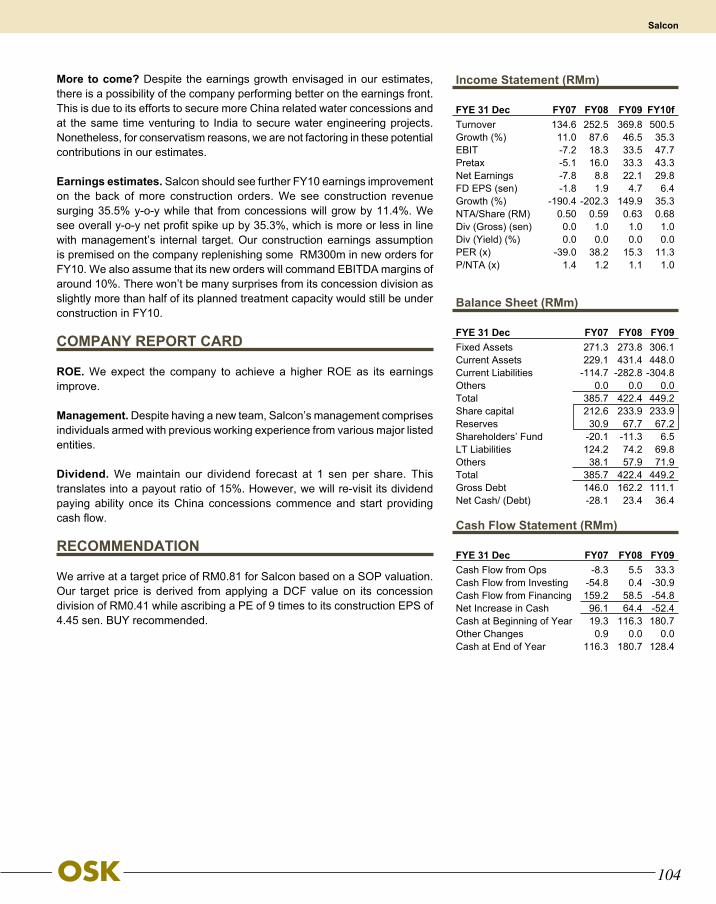
104
More to come? Despite the earnings growth envisaged in our estimates, there is a possibility of the company performing better on the earnings front. This is due to its efforts to secure more China related water concessions and at the same time venturing to India to secure water engineering projects. Nonetheless, for conservatism reasons, we are not factoring in these potential contributions in our estimates.
Earnings estimates. Salcon should see further FY10 earnings improvement on the back of more construction orders. We see construction revenue surging 35.5% y-o-y while that from concessions will grow by 11.4%. We see overall y-o-y net profit spike up by 35.3%, which is more or less in line with management’s internal target. Our construction earnings assumption is premised on the company replenishing some RM300m in new orders for FY10. We also assume that its new orders will command EBITDA margins of around 10%. There won’t be many surprises from its concession division as slightly more than half of its planned treatment capacity would still be under construction in FY10.
COMPANY REPORT CARD
ROE. We expect the company to achieve a higher ROE as its earnings improve.
Management. Despite having a new team, Salcon’s management comprises individuals armed with previous working experience from various major listed entities.
Dividend. We maintain our dividend forecast at 1 sen per share. This translates into a payout ratio of 15%. However, we will re-visit its dividend paying ability once its China concessions commence and start providing cash flow.
RECOMMENDATION
We arrive at a target price of RM0.81 for Salcon based on a SOP valuation. Our target price is derived from applying a DCF value on its concession division of RM0.41 while ascribing a PE of 9 times to its construction EPS of 4.45 sen. BUY recommended.
Income Statement (RMm)
FYE 31 Dec FY07 FY08 FY09 FY10fTurnover 134.6 252.5 369.8 500.5Growth (%) 11.0 87.6 46.5 35.3EBIT -7.2 18.3 33.5 47.7Pretax -5.1 16.0 33.3 43.3Net Earnings -7.8 8.8 22.1 29.8FD EPS (sen) -1.8 1.9 4.7 6.4Growth (%) -190.4 -202.3 149.9 35.3NTA/Share (RM) 0.50 0.59 0.63 0.68Div (Gross) (sen) 0.0 1.0 1.0 1.0Div (Yield) (%) 0.0 0.0 0.0 0.0PER (x) -39.0 38.2 15.3 11.3P/NTA (x) 1.4 1.2 1.1 1.0
Balance Sheet (RMm)
FYE 31 Dec FY07 FY08 FY09Fixed Assets 271.3 273.8 306.1Current Assets 229.1 431.4 448.0Current Liabilities -114.7 -282.8 -304.8Others 0.0 0.0 0.0Total 385.7 422.4 449.2Share capital 212.6 233.9 233.9Reserves 30.9 67.7 67.2Shareholders’ Fund -20.1 -11.3 6.5LT Liabilities 124.2 74.2 69.8Others 38.1 57.9 71.9Total 385.7 422.4 449.2Gross Debt 146.0 162.2 111.1Net Cash/ (Debt) -28.1 23.4 36.4
Cash Flow Statement (RMm)
FYE 31 Dec FY07 FY08 FY09Cash Flow from Ops -8.3 5.5 33.3Cash Flow from Investing -54.8 0.4 -30.9Cash Flow from Financing 159.2 58.5 -54.8Net Increase in Cash 96.1 64.4 -52.4Cash at Beginning of Year 19.3 116.3 180.7Other Changes 0.9 0.0 0.0Cash at End of Year 116.3 180.7 128.4
Salcon

105
INVESTMENT MERITS
An integrated designer, manufacturer and retailer of kitchen systems
Firm earnings on the back of stable retail division growth Project revenue to propel future earnings Newly launched Kubiq brand to penetrate the low to mid-end
segment TP of RM1.94 based on FY11 EPS based on conservative building
material sector P/E of 7 times.
COMPANY PROFILE
Founded in 1994 by Mr. Tan Kee Choong and Mr. Chooi Yoey Sun, Signature International (SI) has established itself as a major design, manufacturer and retailer (DMR) of kitchen systems. Its operation has gone global, with 27 outlets in the local market and 15 in the international front. SI’s role as a kitchen systems specialist has positioned it as a leading domestic kitchen systems player with the largest retail network in Malaysia. Apart from kitchen systems, SI also operates other businesses such as the (i) marketing and distribution of Built-In Kitchen Appliances and White Goods, ii) DMR of Wardrobe Systems, and iii) manufacture of glass and aluminium products.
KEY HIGHLIGHTS
Full control. Signature International attributes much of its success to a few characteristics which it has built upon throughout its operating years. Currently, SI is an integrated DMR of kitchen systems across the entire value chain from the start till the implementation of kitchen systems in a household premise, except for physical installation, which is outsourced to an appointed contractor. By having control over most of the value chain, SI has since listing been able to command PBT margins of around 17% or above, which is ahead of most its peers. SI’s business comprises two main divisions, the first being its retail division catering to end-customers while the second - the project division - is involved in the installation of kitchen systems for an entire household (condominiums and apartments).
Retail division the stalwart. SI’s initial business entails the DMR of kitchen systems for end-users. As at FY09, its retail division’s revenue accounted for 31.7% of total revenue. Although this division’s contribution has fallen drastically from 47.3% in the previous year due to higher project earnings, SI’s retail division nonetheless provides an excellent platform for brand building, which plays a vital a role in ensuring the company’s sustainability. Going forward we do not see SI’s retail division playing a major role in enhancing the group’s earnings, but it should provide stable revenue growth of about 5%-7% annually upon the rollout of 1 or 2 new outlets a year.
Signature InternationalHomegrown Brand Makes Good Abroad
Target : RM1.94Price : RM1.52
BUILDING MATERIALS
Stock Profile/StatisticsBloomberg Ticker SIGN MKIssued Share Capital (m) 80.0Market Capitalisation (RMm) 121.652 week H | L Price (RM) 1.71 | 1.02Average Volume (3m) ‘000 51.9YTD Returns (%) -6.2Net gearing (x) Net CashAltman Z-Score 5.88ROCE/WACC 2.2Beta (x) 0.7Book Value/share (RM) 1.04
Major Shareholders (%)Tan Kee Choong 26.0Chooi Yoey Sun 25.9HSC Healthcare SB 15.0
Share Performance (%)Month Absolute Relative1m 0.6 -5.2 3m -0.5 -11.6 6m 3.9 -12.3 12m 39.2 -11.9
6-month Share Price Performance
1.8
1.7
1.6
1.5
1.4Oct-09 Nov-09 Dec-09 Jan-10 Feb-10 Mar-10 Apr-10

106
Project division the key driver. SI had in the past 5 years significantly boosted its earnings from projects by an average 80.5% a year. To name a few, SI has been delivering kitchen systems to high-end property developments such as One Residency, The Troika and The Binjai condominiums in KL city centre. Offshore, its notable projects are the Al Reem Island and the F1 Circuit, both located in Abu Dhabi, UAE. Amid a slowdown in FY10 project earnings due to the slowdown in new property launches in FY09, we see this division regaining strength in FY11 as the domestic property cycle perks up and it increases its overseas exposure to property markets in India, Indonesia, Vietnam and Thailand. For now we estimate that revenue of the project division will weaken by 9% in FY10 but subsequently jump 16% in FY11.
New opportunities. In December 2009, SI launched a new brand, Kubiq, targeted at the low to mid end consumer market. The Kubiq brand is priced from RM2000 to RM5000 per set, compared with its mainstream Signature Kitchen sets, which go for RM30000 to RM50000 each. With a business model similar to that of retail furniture giant IKEA, SI’s Kubiq brand is poised to garner more market share.
COMPANY REPORT CARD
ROE. We estimate SI’s ROE at around the mid teens. A further upside in new projects clinched beyond our estimates will boost ROE more than expected
Management. Management has been innovative in delivering new products and customization base on market trends, as evident with the launch of its Kubiq brand.
Dividend. We estimate the SI to provide a gross yield of 3.8 sen in FY10, premised on a payout ratio of 11.7%, as in the previous year.
RECOMMENDATION
Tagging a low-tier end building material sector PE of 7 times to our FY11F EPS of 27.7 sen, we derive a target price of RM1.94 for SI. BUY recommended.
Income Statement (RMm)
FYE 30 Jun FY07 FY08 FY09 FY10fTurnover 85.1 110.2 158.4 145.4Growth (%) 47.2 29.4 43.8 -8.2EBIT 14.8 20.6 27.6 26.6Pretax 14.4 19.7 26.7 25.8Net Earnings 11.0 15.5 20.3 19.6FD EPS (sen) 13.7 19.3 25.4 24.5Growth (%) 0.7 0.4 0.3 0.0NTA/Share (RM) 0.51 0.84 1.04 1.26Div (Gross) (sen) 0.0 2.5 4.1 3.8Div (Yield) (%) 0.0 1.6 2.6 2.5PER (x) 11.3 8.0 6.1 6.3P/NTA (x) 2.4 1.5 1.2 0.8
Balance Sheet (RMm)
FYE 30 Jun FY07 FY08 FY09Fixed Assets 18.7 24.5 29.8Current Assets 35.6 81.4 89.0Current Liabilities -17.1 -33.1 -30.8Others 0.0 0.0 0.0Total 37.1 72.8 88.0Share capital 31.2 40.0 40.0Reserves 28.0 43.1 59.0Shareholders’ Fund 31.9 67.4 83.3LT Liabilities 5.0 4.8 4.0Others 0.2 0.6 0.8Total 37.1 72.8 88.0Gross Debt 3.6 5.2 4.6Net Cash/ (Debt) 1.1 22.3 14.6
Cash Flow Statement (RMm)
FYE 30 Jun FY07 FY08 FY09Cash Flow from Ops 8.2 5.1Cash Flow from Investing -6.1 -5.7Cash Flow from Financing 20.6 -4.4Net Increase in Cash 22.7 -4.9Cash at Beginning of Year 4.8 27.5Other Changes 0.0 0.0Cash at End of Year 27.5 22.6
Signature International

107
INVESTMENT MERITS
An integrated long steel manufacturer with 1.3m tpy capacity Professionally-run operation with good track record Direct beneficiary of stimulus packages worldwide Potential M&A candidate post-privatization of Hume Industries TP RM3.04, based on a blended 9x PER and 1.17x NTA/share on
FY10 numbers
COMPANY PROFILE
Southern Steel was founded in 1963 as a small galvanized iron sheet plant that has expanded to become what is today a major steel manufacturing group. Backed by its well known shareholders that include Hume Industries (a member of Hong Leong Group Malaysia) and Natsteel Asia, which is the wholly owned subsidiary of Tata Steel, India. Southern Steel engages state-of-the-art technology and a strictly enforced quality control system. The company operates a 1.3m-tonne per year (tpy) integrated steel mill in Seberang Perai, Penang, focusing on long steel production. Besides the usual bar and wire rods, the company is also one of the few steel mills in the world producing industrial grade wire rods from the EAF process, in addition to making value added products. Its wholly-owned subsidiary, Southern Steel Mesh, is a market leader in the wire mesh market. Southern Steel also provides cut and bending of the bars to meet customer requirements and operates a pipe mill. It is also the first steel mill group in Malaysia to attain ISO 9002 certification, a testimony of its commitment to quality excellence.
KEY HIGHLIGHTS
Managed by professionals. Unlike other local steel mills that fill their key positions with mostly family members, the company is managed by a professional team that has years of experience in the steel industry. Although Hong Leong Group and Tata Steel are the company’s major shareholders, both are not involved the day-to-day operations of Southern Steel. We are also impressed with management’s efforts to gradually pare down its gearing, which has fallen to below 1x from 3x during the Asian Financial Crisis.
Sharp turnaround in 2HFY09. Southern Steel made a comeback in 2HFY09 after few quarters in the doldrums due to huge inventories write-downs. Its results in 4Q were impressive, with numbers that took us and consensus by surprise, as the company erased all its losses in 1H despite our expectation of full-year losses. Apart from the mismatch in delivery of sales prior to the drop in 4Q, we suspect the improved demand for industrial grade wire rods in tandem with the recovery in manufacturing activities was a contributing factor.
Southern SteelPotential for M&A
Target : RM3.04Price : RM2.53
STEEL
Stock Profile/StatisticsBloomberg Ticker SSB MKIssued Share Capital (m) 419.4Market Capitalisation (RMm) 1,061.152 week H | L Price (RM) 2.69 | 1.44Average Volume (3m) ‘000 324.6YTD Returns (%) 27.8Net gearing (x) 1.0Altman Z-Score 2.02ROCE/WACC 0.1Beta (x) 1.6Book Value/share (RM) 1.68
Major Shareholders (%)Hume Industries 41.5Natsteel Holdings 27.0Southern Amalgamated 7.7
Share Performance (%)Month Absolute Relative1m 11.9 7.4 3m 25.9 21.0 6m 49.8 34.5 12m 66.8 10.2
6-month Share Price Performance
2.8
2.6
2.4
2.2
2.0
1.8
1.6Oct-09 Nov-09 Dec-09 Jan-10 Feb-10 Mar-10 Apr-10

108
Potential M&A candidate? Southern Steel is 41.5%-owned by Hume Industries, which has received a Voluntary General Offer from its major shareholder Tan Sri Quek to take the holding company private. On the surface, we find little connection between this move and any potential corporate action involving Southern Steel, but we suspect the privatization of Hume may give its ultimate shareholder the flexibility to exit the steel business at the right pricing. We suspect that Tata Steel, which is the company’s second major shareholder, may have been eyeing Hume’s stake in Southern Steel. Given the revival in the steel industry, we suspect Southern Steel could easily carry a price tag of more than RM3 per share at 8x normalized earnings, should a major block be offered to the market.
Poised for the next surge. After a slow period, steel players have returned to investors’ radar screens. All major raw materials are on the uptrend, with iron ore and coking coal settling 90% and 55% higher recently, which was way above our original estimates of 25%, although the new benchmark is valid only for one quarter instead of being the traditional yearly contract. We see room for steel prices to go up by another 5% to 10% given the much sharper hike in raw material in anticipation of a price increase. There is also consistent demand for exports of semi-finished products to South-East Asia (SEA) since China’s 25% export tax on billets has created a vacuum of 5m tonnes of billets.
COMPANY REPORT CARD
ROE. With the improved industry outlook driven by better demand prospects from the stimulus packages introduced by various governments, we expect Southern Steel to chalk up an impressive ROE of 20.9% in FY10.
Management. Unlike other local steel mills where key positions are mostly given to family members, Southern Steel is managed by a professional team that has years of experience in the steel industry.
Dividend. Southern Steel always allocates a portion of its free cash flow to rewards its shareholder via dividend payment. We expect a reasonable gross dividend of 10.4 sen for FY10.
RECOMMENDATION
Other than being upbeat on the short to medium term outlook for steel demand and selling prices as governments worldwide implement pump priming initiatives, we are also excited over the potential value creation in Southern Steel, taking the cue from the series of corporate exercises involving its major shareholder at the Hume level. We maintain our BUY recommendation on Southern Steel with a fair value of RM3.04, derived from 9x PER and 1.17x NTA/share on FY10 numbers.
Income Statement (RMm)
FYE 31 Dec FY07 FY08 FY09 FY10fTurnover 2811.0 3222.6 2032.5 2747.8Growth (%) 19.5 14.6 -36.9 35.2EBIT 232.8 175.4 28.9 247.2Pretax 195.2 106.5 8.8 217.8Net Earnings 191.7 104.7 16.2 172.1FD EPS (sen) 48.0 25.4 3.9 41.8Growth (%) 105.8 -47.0 -84.5 961.8NTA/Share (RM) 1.65 1.72 1.71 2.05Div (Gross) (sen) 10.4 17.4 6.9 10.4Div (Yield) (%) 4.2 6.9 2.8 4.2PER (x) 5.3 9.9 64.2 6.0P/NTA (x) 1.5 1.5 1.5 1.2
Balance Sheet (RMm)
FYE 31 Dec FY07 FY08 FY09Fixed Assets 779.5 751.1 737.5Current Assets 993.4 1140.5 976.3Current Liabilities -932.4 -1106.7 -940.9Others 49.0 49.0 49.0Total 889.4 833.8 821.8Share capital 399.0 411.5 411.5Reserves 307.3 347.1 342.4Shareholders’ Fund 706.3 758.6 753.8LT Liabilities 181.0 75.2 68.0Others 2.1 0.0 0.0Total 889.4 833.8 821.8Gross Debt 792.1 904.3 762.0Net Cash/ (Debt) -734.9 -836.9 -729.6
Cash Flow Statement (RMm)
FYE 31 Dec FY07 FY08 FY09Cash Flow from Ops 60.1 60.4 227.8Cash Flow from Investing 24.9 -66.4 -92.5Cash Flow from Financing -70.4 -3.7 -150.0Net Increase in Cash 14.5 -9.6 -14.8Cash at Beginning of Year 34.6 49.1 39.5Other Changes 0.0 0.0 0.0Cash at End of Year 49.1 39.5 24.7
Southern Steel

109
INVESTMENT MERITS
Sizable orderbook balance of RM3bn Preferred contractor for Capitala and Sun City Potential road jobs from India Strong market share in the quarry business Accelerated earnings recognition from property segment RM2.26 TP based on 10x FY10 earnings
COMPANY PROFILE
The company was incorporated as Sungei Way Holdings in 1978 with quarrying being its primary business. Subsequently in 1984, it was listed on the Main Board of Bursa. Prior to the 1997 Asian financial crisis, Sunway was one of the larger listed Malaysian construction stocks. However, when the crisis struck, Sunway was hit due to its then high gearing as well as project delays. Since then, Sunway has embarked on various measures to reduce its gearing via asset and business disposals. The Sunway today is clearly a turnaround story with businesses in construction, property development, quarrying, trading and building materials.
KEY HIGHLIGHTS
Positive construction prospects. Sunway currently has an orderbook balance of RM3bn, of which 54.9% is in the Middle East, 24.4% in Malaysia and 20.7% in India and Singapore. Management said it will be tendering for RM16bn worth of jobs, RM9bn of which will be in Malaysia. Guidance is for a success rate in tenders of 10-15%. Underpinned by more project roll outs under the 10MP, we believe that contract flows will remain strong for Sunway. Moving forward, we expect most jobs to be awarded on an open tender basis, which will benefit contractors with a strong track record like Sunway.
A preferred contractor. Currently Sunway is constructing Phase 1 (Rihan Heights) of the USD25bn Arzanah Development in Abu Dhabi. Tenders for Phase 2 (~RM1bn), we understand, could be called next year and we believe that Sunway has a strong participating chance given its status as the preferred contractor of Capitala, the developer. Besides that, there are a few developments in the pipeline for its sister company, Sun City. These include the Pyramid mall extension, a corporate tower, extension of the Sunway College and some new residential developments all collectively worth RM700m-RM800m. Sunway is also the preferred contractor for Sun City, as is evident by its 50% success rate despite the open tender system employed by Sun City.
Sunway Holdings Back to Form
Target : RM2.26Price : RM1.53
CONSTRUCTION
Stock Profile/StatisticsBloomberg Ticker SGW MKIssued Share Capital (m) 601.5Market Capitalisation (RMm) 926.352 week H | L Price (RM) 1.60 | 0.68Average Volume (3m) ‘000 900.2YTD Returns (%) 21.3Net gearing (x) 0.9Altman Z-Score 1.39ROCE/WACC 0.4Beta (x) 1.5Book Value/share (RM) 0.90
Major Shareholders (%)Tan Sri Jeffrey Cheah 45.0
Share Performance (%)Month Absolute Relative1m 10.1 8.5 3m 15.9 11.5 6m 10.1 2.3 12m 118.6 52.0
6-month Share Price Performance
1.6
1.5
1.4
1.3
1.2
1.1Oct-09 Nov-09 Dec-09 Jan-10 Feb-10 Mar-10 Apr-10
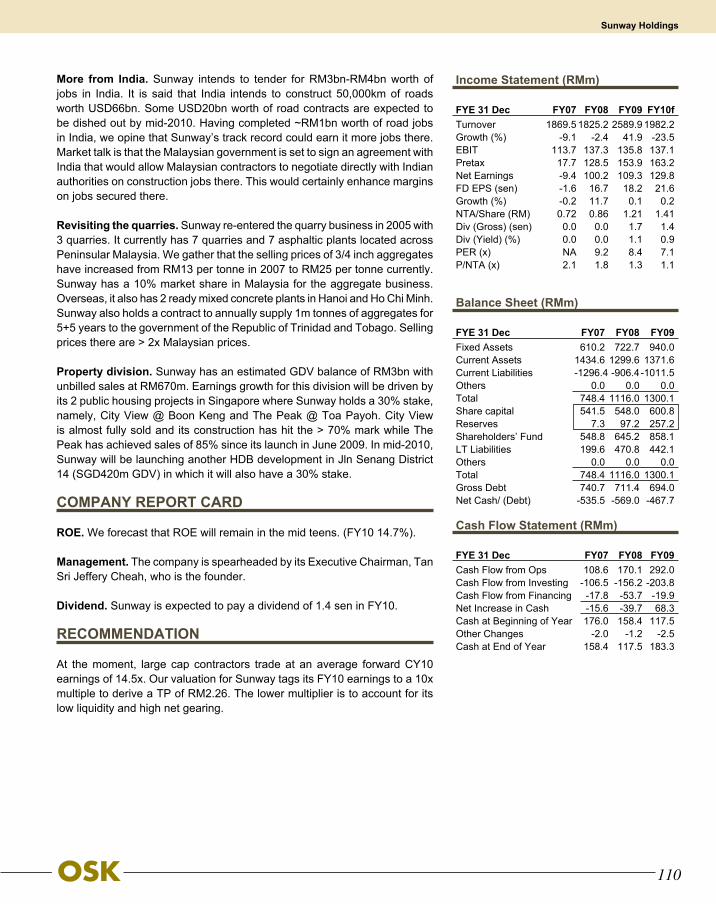
110
More from India. Sunway intends to tender for RM3bn-RM4bn worth of jobs in India. It is said that India intends to construct 50,000km of roads worth USD66bn. Some USD20bn worth of road contracts are expected to be dished out by mid-2010. Having completed ~RM1bn worth of road jobs in India, we opine that Sunway’s track record could earn it more jobs there. Market talk is that the Malaysian government is set to sign an agreement with India that would allow Malaysian contractors to negotiate directly with Indian authorities on construction jobs there. This would certainly enhance margins on jobs secured there.
Revisiting the quarries. Sunway re-entered the quarry business in 2005 with 3 quarries. It currently has 7 quarries and 7 asphaltic plants located across Peninsular Malaysia. We gather that the selling prices of 3/4 inch aggregates have increased from RM13 per tonne in 2007 to RM25 per tonne currently. Sunway has a 10% market share in Malaysia for the aggregate business. Overseas, it also has 2 ready mixed concrete plants in Hanoi and Ho Chi Minh. Sunway also holds a contract to annually supply 1m tonnes of aggregates for 5+5 years to the government of the Republic of Trinidad and Tobago. Selling prices there are > 2x Malaysian prices.
Property division. Sunway has an estimated GDV balance of RM3bn with unbilled sales at RM670m. Earnings growth for this division will be driven by its 2 public housing projects in Singapore where Sunway holds a 30% stake, namely, City View @ Boon Keng and The Peak @ Toa Payoh. City View is almost fully sold and its construction has hit the > 70% mark while The Peak has achieved sales of 85% since its launch in June 2009. In mid-2010, Sunway will be launching another HDB development in Jln Senang District 14 (SGD420m GDV) in which it will also have a 30% stake.
COMPANY REPORT CARD
ROE. We forecast that ROE will remain in the mid teens. (FY10 14.7%).
Management. The company is spearheaded by its Executive Chairman, Tan Sri Jeffery Cheah, who is the founder.
Dividend. Sunway is expected to pay a dividend of 1.4 sen in FY10.
RECOMMENDATION
At the moment, large cap contractors trade at an average forward CY10 earnings of 14.5x. Our valuation for Sunway tags its FY10 earnings to a 10x multiple to derive a TP of RM2.26. The lower multiplier is to account for its low liquidity and high net gearing.
Income Statement (RMm)
FYE 31 Dec FY07 FY08 FY09 FY10fTurnover 1869.5 1825.2 2589.9 1982.2Growth (%) -9.1 -2.4 41.9 -23.5EBIT 113.7 137.3 135.8 137.1Pretax 17.7 128.5 153.9 163.2Net Earnings -9.4 100.2 109.3 129.8FD EPS (sen) -1.6 16.7 18.2 21.6Growth (%) -0.2 11.7 0.1 0.2NTA/Share (RM) 0.72 0.86 1.21 1.41Div (Gross) (sen) 0.0 0.0 1.7 1.4Div (Yield) (%) 0.0 0.0 1.1 0.9PER (x) NA 9.2 8.4 7.1P/NTA (x) 2.1 1.8 1.3 1.1
Balance Sheet (RMm)
FYE 31 Dec FY07 FY08 FY09Fixed Assets 610.2 722.7 940.0Current Assets 1434.6 1299.6 1371.6Current Liabilities -1296.4 -906.4 -1011.5Others 0.0 0.0 0.0Total 748.4 1116.0 1300.1Share capital 541.5 548.0 600.8Reserves 7.3 97.2 257.2Shareholders’ Fund 548.8 645.2 858.1LT Liabilities 199.6 470.8 442.1Others 0.0 0.0 0.0Total 748.4 1116.0 1300.1Gross Debt 740.7 711.4 694.0Net Cash/ (Debt) -535.5 -569.0 -467.7
Cash Flow Statement (RMm)
FYE 31 Dec FY07 FY08 FY09Cash Flow from Ops 108.6 170.1 292.0Cash Flow from Investing -106.5 -156.2 -203.8Cash Flow from Financing -17.8 -53.7 -19.9Net Increase in Cash -15.6 -39.7 68.3Cash at Beginning of Year 176.0 158.4 117.5Other Changes -2.0 -1.2 -2.5Cash at End of Year 158.4 117.5 183.3
Sunway Holdings
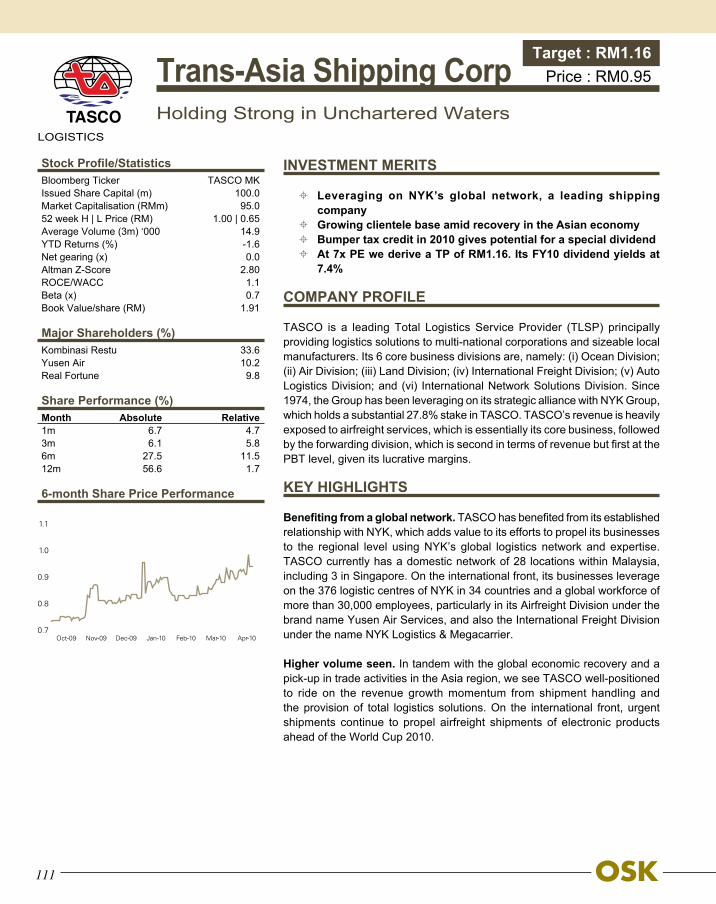
111
INVESTMENT MERITS
Leveraging on NYK’s global network, a leading shipping company
Growing clientele base amid recovery in the Asian economy Bumper tax credit in 2010 gives potential for a special dividend At 7x PE we derive a TP of RM1.16. Its FY10 dividend yields at
7.4%
COMPANY PROFILE
TASCO is a leading Total Logistics Service Provider (TLSP) principally providing logistics solutions to multi-national corporations and sizeable local manufacturers. Its 6 core business divisions are, namely: (i) Ocean Division; (ii) Air Division; (iii) Land Division; (iv) International Freight Division; (v) Auto Logistics Division; and (vi) International Network Solutions Division. Since 1974, the Group has been leveraging on its strategic alliance with NYK Group, which holds a substantial 27.8% stake in TASCO. TASCO’s revenue is heavily exposed to airfreight services, which is essentially its core business, followed by the forwarding division, which is second in terms of revenue but first at the PBT level, given its lucrative margins.
KEY HIGHLIGHTS
Benefiting from a global network. TASCO has benefited from its established relationship with NYK, which adds value to its efforts to propel its businesses to the regional level using NYK’s global logistics network and expertise. TASCO currently has a domestic network of 28 locations within Malaysia, including 3 in Singapore. On the international front, its businesses leverage on the 376 logistic centres of NYK in 34 countries and a global workforce of more than 30,000 employees, particularly in its Airfreight Division under the brand name Yusen Air Services, and also the International Freight Division under the name NYK Logistics & Megacarrier.
Higher volume seen. In tandem with the global economic recovery and a pick-up in trade activities in the Asia region, we see TASCO well-positioned to ride on the revenue growth momentum from shipment handling and the provision of total logistics solutions. On the international front, urgent shipments continue to propel airfreight shipments of electronic products ahead of the World Cup 2010.
Trans-Asia Shipping CorpHolding Strong in Unchartered Waters
Target : RM1.16Price : RM0.95
LOGISTICS
Stock Profile/StatisticsBloomberg Ticker TASCO MKIssued Share Capital (m) 100.0Market Capitalisation (RMm) 95.052 week H | L Price (RM) 1.00 | 0.65Average Volume (3m) ‘000 14.9YTD Returns (%) -1.6Net gearing (x) 0.0Altman Z-Score 2.80ROCE/WACC 1.1Beta (x) 0.7Book Value/share (RM) 1.91
Major Shareholders (%)Kombinasi Restu 33.6Yusen Air 10.2Real Fortune 9.8
Share Performance (%)Month Absolute Relative1m 6.7 4.7 3m 6.1 5.8 6m 27.5 11.5 12m 56.6 1.7
6-month Share Price Performance
1.1
1.0
0.9
0.8
0.7Oct-09 Nov-09 Dec-09 Jan-10 Feb-10 Mar-10 Apr-10

112
Expanding clientele. Management said TASCO has secured more jobs as a regional logistics hub for a major LCD supplier following its recent move to a bigger warehouse, and expects to secure more sizeable long term contracts in FY10. This has led to the full utilization of its warehouses, which has sent management on the constant lookout for new warehouses.
Receiving bumper tax credit. After spending huge capex over the past few years on warehouse expansion & acquisitions totalling RM200m, we see the company receiving another round of tax credits on reinvestment allowances in 2010 estimated at RM8.9m. Last year, TASCO received RM5.9m in tax credit. For the investor, the substantial tax credit could potentially come in the form of special dividends, which we have not included into our forecast assumption.
COMPANY REPORT CARD
ROE. We expect ROE to improve to 12% from 8.6% in FY09 over the next 3 years as less capex are likely to be incurred going forward.
Management. TASCO’s market presence and its synergy with NYK would have not been possible without Mr. Lee Check Poh and its strong management. This has been evident throughout his employment since 1977 as the company has evolved from a customs broking services provider to a leading TLSP in Malaysia. The strength of the group’s management is complemented by the assigning of NYK representatives to TASCO’s management team to work towards the company’s goals.
Dividend. Not taking into consideration the potential special dividend from its tax credit, we still expect TASCO to pay a dividend of 7 sen, which gives an attractive yield of 7.4%.
RECOMMENDATION
We derive a TP of RM1.16 based on 7x PE, which is the average sector PE for small cap logistic players. TASCO is an attractive stock given its good dividend yield. We see its earnings momentum pick up as margins from its international business expand further on the back of a recovering global economy.
Income Statement (RMm)
FYE 31 Dec FY07 FY08 FY09 FY10fTurnover 329.8 366.5 280.6 314.4Growth (%) -7.0 11.1 -23.4 12.0EBIT 17.4 19.1 12.7 16.3Pretax 18.4 22.6 20.1 34.4Net Earnings 13.2 16.4 10.1 16.7FD EPS (sen) 13.2 16.4 10.1 16.7Growth (%) 6.4 24.5 -38.5 65.1NTA/Share (RM) 1.52 1.59 1.55 1.71Div (Gross) (sen) 7.0 7.0Div (Yield) (%) 0.0 0.0 7.4 7.4PER (x) 7.2 5.8 9.4 5.7P/NTA (x) 0.6 0.6 0.6 0.6
Balance Sheet (RMm)
FYE 31 Dec FY07 FY08 FY09Fixed Assets 76.7 136.6 155.7Current Assets 131.7 109.6 107.7Current Liabilities -45.2 -58.6 -51.7Others 0.0 0.0 0.0Total 163.3 187.6 211.7Share capital 100.0 100.0 100.0Reserves 59.2 80.4 92.6Shareholders’ Fund 159.2 180.4 192.6LT Liabilities 4.1 7.2 19.0Others 0.0 0.0 0.0Total 163.3 187.6 211.7Gross Debt 7.0 2.7 18.7Net Cash/ (Debt) 55.2 43.7 16.3
Cash Flow Statement (RMm)
FYE 31 Dec FY07 FY08 FY09Cash Flow from Ops 16.1 26.7 19.4Cash Flow from Investing -11.7 -36.9 -39.2Cash Flow from Financing 21.0 -5.5 8.4Net Increase in Cash 25.4 -15.8 -11.4Cash at Beginning of Year 36.8 62.2 46.4Other Changes 0.0 0.0 0.0Cash at End of Year 62.2 46.4 35.0
Trans-Asia Shipping Corp

113
INVESTMENT MERITS
Attractive dividend yield of above 7% Consistently paid dividends even during bad times With the worst being over, FY10 earnings are expected to turn
around Deemed the most efficient tile maker in the industry
COMPANY PROFILE
Yi-Lai is principally a manufacturer of ceramic, homogeneous and multi-effect tiles under the trademark “Alpha Tiles”. The company commenced operation in 1990 by installing a single Italian production line with capacity of 1.4m square meters in Kulai, Johor. Yi-Lai has grown by leaps and bounds over the years on increasing production capacity and the installation of a homogenous production line that commands more lucrative margins. The company has been profitable despite the challenging business conditions during the Asian Financial Crisis in 1997, and the global financial meltdown in 2008. Yi-Lai was listed on the Main Board of Bursa Malaysia in 2002. Presently, the company has the second largest production capacity in the local ceramic tile industry in terms of product diversity.
KEY HIGHLIGHTS
Business recovering. 2009 was a tough year for Yi-lai as its operating margins slumped to below 20% versus its historical average, which is usually above this level. A lower sales volume means no economies of scale and higher raw material prices, which led to narrower margins during the period. However, with recent signs of the domestic property market recovering towards the end of 2009, operating margins are now starting to improve. In FY10, the improvements in both margins and sales will bolster overall earnings y-o-y.
Earnings on the mend. We see the domestic property market recovering this year, particularly the low to mid end housing category. Given the company’s ability to operate efficiently and trim operating costs, we see its margins improving in the subsequent quarters. Improvements are already being seen in its 4QFY09, during which EBITDA margins stood at 26.2% (+3.7p.pts q-o-q; +8.6p.pts y-o-y). For FY10, we estimate that net earnings will increase by a marginal 4.3% while revenue will tick up by 5.7%.
Yi-LaiConsistent Dividend Paymaster
Target : RM0.76Price : RM0.78
BUILDING MATERIALS
Stock Profile/StatisticsBloomberg Ticker YLAI MKIssued Share Capital (m) 160.0Market Capitalisation (RMm) 124.852 week H | L Price (RM) 0.82 | 0.53Average Volume (3m) ‘000 76.5YTD Returns (%) 11.4Net gearing (x) Net CashAltman Z-Score 4.39ROCE/WACC 0.4Beta (x) 1.0Book Value/share (RM) 1.25
Major Shareholders (%)Lim Oon Kok 30.1LTH 10.0Mohammed Zain Zabidi 9.8
Share Performance (%)Month Absolute Relative1m 5.4 1.2 3m 10.6 5.5 6m 13.8 2.4 12m 51.6 -0.3
6-month Share Price Performance
0.9
0.8
0.7
0.6Oct-09 Nov-09 Dec-09 Jan-10 Feb-10 Mar-10 Apr-10

114
Declaring dividends as usual. Although its y-o-y earnings declined on the back of weaker sales, Yi-Lai nevertheless declared a total tax-exempt dividend of 6 sen per share, which translates into a gross yield of approximately 7.7%. Yi-Lai’s cash balance had ranged from RM45m to RM55m in the past 5 years, which supports its dividend payments.
COMPANY REPORT CARD
ROE. In view of a recovering domestic property market, we see its ROE improving this year.
Management. Under an experienced management team. Yi-lai stands out for its operation efficiency, and in outperforming its peers.
Dividend. Yi-lai’s dividend paying ability since its listing has impressed us. In the past 5 years, the company’s payout ratio has ranged from 60%-80%. We expect the company to pay dividends that translate into a gross yield of 8.3% this year.
RECOMMENDATION
Yi-lai currently trades at a forward FY10 PE of 9.5 times, which is within the average sector PE of 8-10 times. Despite being on par with the industry, Yi-la’s generous dividend yield of over 8.3% is key in supporting its share price. Our target price is derived from a PE of 9x its FY10 EPS of 7.7 sen. NEUTRAL.
Income Statement (RMm)
FYE 31 Dec FY07 FY08 FY09 FY10fTurnover 112.7 119.1 111.1 121.1Growth (%) -15.1 5.8 -6.8 9.1EBIT 19.5 15.6 14.1 15.5Pretax 21.2 16.8 15.4 16.9Net Earnings 17.6 13.2 11.8 13.5FD EPS (sen) 11.0 8.2 7.4 8.5Growth (%) -26.1 -25.3 -10.4 14.7NTA/Share (RM) 1.18 1.19 1.23 1.25Div (Gross) (sen) 9.0 8.1 6.0 6.5Div (Yield) (%) 12.2 11.0 8.2 8.8PER (x) 6.7 8.9 10.0 8.7P/NTA (x) 0.6 0.6 0.6 0.6
Balance Sheet (RMm)
FYE 31 Dec FY07 FY08 FY09Fixed Assets 91.7 86.1 84.3Current Assets 121.8 129.0 139.6Current Liabilities -16.1 -16.3 -18.4Others 0.0 0.0 0.0Total 197.4 198.8 205.6Share capital 80.0 80.0 80.0Reserves 108.6 110.3 117.0Shareholders’ Fund 188.6 190.3 197.0LT Liabilities 8.8 8.5 12.9Others 0.0 0.0 0.0Total 197.4 198.8 209.9Gross Debt 8.8 8.5 4.3Net Cash/ (Debt) 39.4 39.0 47.1
Cash Flow Statement (RMm)
FYE 31 Dec FY07 FY08 FY09Cash Flow from Ops 18.6 13.1 14.7Cash Flow from Investing -17.4 -1.6 -5.7Cash Flow from Financing -15.7 -12.0 -5.2Net Increase in Cash -14.5 -0.6 3.8Cash at Beginning of Year 62.7 48.2 47.6Other Changes 0.0 0.0 0.0Cash at End of Year 48.2 47.6 51.4
Yi-Lai

115
INVESTMENT MERITS
A remarkable 20-year track record Exposure in 4 countries Vertically integrated business model Strong balance sheet with zero borrowings 60% dividend payout ratio
COMPANY PROFILE
Zhulian, incorporated in Malaysia on 2 Jan 1997, transferred to the Main Board of Bursa Malaysia in April the same year. The group, whose core business is in multi-level marketing (MLM), has diversified interests in the manufacture and trading of costume and fine jewellery, consumer products and printing. Zhulian currently has 80 agencies functioning as its distribution centres throughout Malaysia. It produces >80% of its products in-house. Its well-established domestic exposure aside, the group has also expanded its business to Thailand, Indonesia and Singapore.
KEY HIGHLIGHTS
Exposure in 3 countries. Aside from its local business, the group has successfully expanded its MLM business to Thailand, Indonesia and Singapore. As at Nov 2009, it had 273 agencies and some 480,000 distributors in the South-East Asian region. We believe there is still room for the group to grow in the respective countries given their huge population base and cultural similarities. More importantly, >95% of its members are bumiputera, which means it is the biggest MLM player in the bumiputera market, which paves a smooth path for Zhulian to widen its reach. Given that the group is still pouring capex into its existing markets to expand its offices, we think this reflects management’s strong belief that there is plenty of room for growth in these markets
Diversified product mix. Over the years, the group has expanded its product lines from being exclusively in costume jewellery to a wide range of consumer products. Unlike other MLM players for which the bulk of revenue heavily relies on certain products, Zhulian’s revenue base is diversified, covering a few main product ranges comprising jewellery, supplements, water filters and beverages, which collectively contribute >70% of total sales.
Zhulian CorporationRoom For More Growth
Target : RM3.43Price : RM2.24
CONSUMER
Stock Profile/StatisticsBloomberg Ticker ZHCB MKIssued Share Capital (m) 345.0Market Capitalisation (RMm) 772.852 week H | L Price (RM) 2.32 | 0.99Average Volume (3m) ‘000 314.9YTD Returns (%) 35.5Net gearing (x) Net CashAltman Z-Score 8.72ROCE/WACC 2.2Beta (x) 0.7Book Value/share (RM) 0.92
Major Shareholders (%)Zhulian Holdings 35.0The Best Source Holdings 17.3Teoh Beng Seng 11.6
Share Performance (%)Month Absolute Relative1m 4.2 0.7 3m 37.7 30.1 6m 25.9 10.8 12m 137.6 51.8
6-month Share Price Performance
2.5
2.0
1.5
1.0
0.5
0.0Oct-09 Nov-09 Dec-09 Jan-10 Feb-10 Mar-10 Apr-10

116
In-house production widens margins. With its 3 plants in Malaysia, Zhulian produces more than 80% of its products, which helps to enhance margins. This can be seen from its superior EBITDA margin of >25% versus its peers’ MLM EBITDA margin of <20%. Hence, while its revenue is smaller than the other listed MLM companies in Bursa such as Hai-O and Amway, its net profit is higher although the company was established only in 1997. Its two most profitable products are jewellery and supplements, which command gross profit margins of 30% to 40% and contribute ~50% of group sales.
Strong balance sheet. The group has a strong balance sheet and zero borrowings, with net cash of RM125.1m, or RM0.36/share as at Nov 2009. Given its huge cash pile and low capex commitment, we do not discount the potential of a corporate exercise in the future.
COMPANY REPORT CARD
ROE. While Zhulian has a lower average ROE of about 25% over the past 3 years compared to its MLM peers’ average ROE of ~30%, its ROE is nonetheless considered high versus those of other retail players.
Management. The group was founded by Teoh Beng Seng, who has more than 30 years of experience in fine gold jewellery production.
Dividend. The group is committed to a payout of 60% of net earnings as dividend. We forecast a 60% dividend payout for the next two years, which translates into a dividend yield of 7.7%-9.4%.
RECOMMENDATION
Our target price of RM3.43 is based on 12x FY10 EPS, which is the MLM sector average. We think the stock deserves to trade on par with Hai-O given its higher dividend payout ratio, superior margins, higher net cash per share although slower profit growth and ROE.
Income Statement (RMm)
FYE 31 Dec FY07 FY08 FY09 FY10fTurnover 220.5 303.6 315.3 379.8Growth (%) - 37.6 3.9 20.5EBIT 55.2 73.4 82.9 100.9Pretax 74.3 95.0 102.7 123.3Net Earnings 58.9 74.7 82.0 98.6FD EPS (sen) 17.1 21.6 23.8 28.6Growth (%) - 37.6 3.9 20.5NTA/Share (RM) 0.59 0.56 0.68 0.79Div (Gross) (sen) 15.5 11.0 14.0 17.2Div (Yield) (%) 6.9 4.9 6.3 7.7PER (x) 13.1 10.3 9.4 7.8P/NTA (x) 3.8 4.0 3.3 2.8
Balance Sheet (RMm)
FYE 31 Dec FY07 FY08 FY09Fixed Assets 87.7 131.7 143.7Current Assets 195.8 210.8 229.6Current Liabilities -33.7 -60.7 -51.4Others 0.0 0.0 0.0Total 249.8 281.7 321.9Share capital 172.5 172.5 172.5Reserves 77.2 107.0 147.6Shareholders’ Fund 249.7 279.5 320.1LT Liabilities 0.0 2.2 1.4Others 0.1 0.1 0.4Total 249.8 281.7 321.9Gross Debt 0.0 0.0 0.0Net Cash/ (Debt) 120.1 106.5 125.1
Cash Flow Statement (RMm)
FYE 31 Dec FY07 FY08 FY09Cash Flow from Ops 37.5 50.5 68.4Cash Flow from Investing 16.1 -29.6 1.7Cash Flow from Financing -20.9 -34.5 -51.7Net Increase in Cash 32.6 -13.7 18.4Cash at Beginning of Year 87.5 120.1 106.5Other Changes 0.0 0.0 0.2Cash at End of Year 120.1 106.5 125.0
Zhulian Corporation

Ranking based on Market Cap & FY10 ROE (%)Ranking Company Mkt Cap (RMm) FY10 ROE Page
1 KPJ Healthcare 1,555.0 16.8% 31
2 Lingkaran Trans Kota Holdings 1,524.8 19.8% 75
3 Lion Industries Corporation 1,370.7 10.0% 33
4 QL Resources 1,355.4 19.9% 101
5 Kossan Rubber Industries 1,318.9 26.0% 73
6 Southern Steel 1,061.1 19.3% 107
7 Alam Maritim Resources 976.0 18.6% 17
8 Sunway Holdings 920.1 13.3% 109
9 Faber Group 914.8 19.8% 21
10 Hock Seng Lee 909.0 22.1% 67
11 Coastal Contracts 898.9 25.8% 49
12 Hai-O Enterprise 895.9 33.7% 27
13 Evergreen Fibreboard 882.4 15.8% 59
14 Naim Holdings 860.0 13.0% 35
15 Zhulian 772.8 26.6% 115
16 Pelikan International Corporation 671.8 11.2% 95
17 MBM Resources 660.9 9.8% 81
18 NTPM Holdings 657.1 24.6% 89
19 Axis REIT 614.2 8.9% 43
20 Adventa 555.3 27.7% 37
21 Kian Joo Can Factory 550.8 7.2% 71
22 Notion Vtec 507.0 25.9% 87
23 Padini Holdings 500.0 20.4% 91
24 AEON Credit Service 494.4 22.6% 39
25 Mamee-Double Decker 441.7 21.7% 79
26 Leader Universal Holdings 436.5 11.5% 31
27 Glomac 430.9 7.5% 25
28 Plenitude 406.4 8.7% 97
29 Hektar REIT 390.4 9.0% 63
30 Pantech Group Holdings 350.6 31.4% 93
31 Salcon 346.1 8.9% 103
32 Eng Teknologi Holdings 328.9 19.7% 55
33 Protasco 312.0 11.7% 99
34 C.I. Holdings 286.8 20.2% 19
35 Delloyd Ventures 277.3 12.2% 51
36 Malaysia Steel Works (KL) 225.9 10.4% 77
37 HELP International 191.8 17.9% 65
38 Multi Sports Holdings Ltd 171.0 31.0% 83
39 New Hoong Fatt Holdings 170.6 12.4% 85
40 Kawan Food 152.4 16.4% 69
41 Ajiya 144.0 12.9% 41
42 Century Logistics Holdings 133.9 15.2% 47
43 Efficient E-Solutions 131.7 16.7% 53
44 Yi-Lai 124.8 6.2% 113
45 Signature International 121.6 26.6% 105
46 Freight Management Holdings 98.0 16.8% 23
47 Trans-Asia Shipping Corporation 95.0 7.9% 111
48 CBS Technology 87.5 23.3% 45
49 EP Manufacturing 84.6 5.2% 57
50 Handal Resources 72.0 23.8% 61
APPENDICESAppendix 1

Ranking Based on FY10 Gross Dividend Yield (%) & FY10 Gross DPS (sen)Ranking Company FY09 GDY FY10 DPS (sen) Page
1 Mamee-Double Decker 12.4% 13.0 79
2 Multi Sports Holdings Ltd 9.5% 4.5 83
3 Hektar REIT 8.9% 10.8 63
4 Yi-Lai 8.3% 6.5 113
5 Axis REIT 8.1% 16.3 43
6 Zhulian 7.7% 17.2 115
7 Trans-Asia Shipping Corporation 7.4% 7.0 111
8 Freight Management Holdings 6.8% 5.5 23
9 New Hoong Fatt Holdings 6.6% 15.0 85
10 Protasco 6.3% 9.0 99
11 C.I. Holdings 6.0% 0.0 19
12 Kian Joo Can Factory 6.0% 7.5 71
13 Lingkaran Trans Kota Holdings 5.6% 17.0 75
14 Eng Teknologi Holdings 5.5% 15.0 55
15 AEON Credit Service 5.5% 22.5 39
16 Hai-O Enterprise 5.4% 24.0 27
17 NTPM Holdings 5.1% 3.0 89
18 Century Logistics Holdings 4.9% 6.3 47
19 Glomac 4.2% 7.0 25
20 Southern Steel 4.1% 10.4 107
21 Padini Holdings 3.9% 15.0 91
22 Plenitude 3.8% 11.5 97
23 Pelikan International Corporation 3.8% 5.0 95
24 Leader Universal Holdings 3.7% 3.7 31
25 Notion Vtec 3.7% 12.0 87
26 Evergreen Fibreboard 3.6% 7.5 59
27 MBM Resources 3.3% 9.0 81
28 KPJ Healthcare 3.2% 9.5 29
29 Malaysia Steel Works (KL) 3.0% 3.3 77
30 QL Resources 2.9% 10.0 101
31 Ajiya 2.9% 6.0 41
32 Handal Resources 2.8% 3.9 61
33 Faber Group 2.8% 7.0 21
34 Pantech Group Holdings 2.7% 2.5 93
35 Efficient E-Solutions 2.5% 0.5 53
36 Hock Seng Lee 2.4% 3.7 67
37 Delloyd Ventures 2.4% 9.0 51
38 Kawan Food 2.4% 3.0 69
39 Naim Holdings 2.2% 7.5 35
40 Signature International 2.0% 3.8 105
41 Adventa 1.9% 7.0 37
42 Kossan Rubber Industries 1.6% 13.0 73
43 HELP International 1.6% 3.4 65
44 Salcon 1.2% 1.0 103
45 Alam Maritim Resources 1.0% 2.0 17
46 Coastal Contracts 0.8% 2.0 49
47 Sunway Holdings 0.7% 1.4 109
48 Lion Industries Corporation 0.5% 1.0 33
49 CBS Technology 0.0% 0.0 45
50 EP Manufacturing 0.0% 0.0 57
Appendix 2

Appendix 3Ranking based on FY10 PER (x) & FY10 EPS (sen)Ranking Company FY10 PER FY10 EPS PAGE1 Multi Sports Holdings Ltd 2.2 21.2 83
2 Handal Resources 4.1 19.7 61
3 Lion Industries Corporation 4.5 42.4 33
4 Malaysia Steel Works (KL) 4.7 24.8 77
5 Century Logistics Holdings 5.0 33.0 47
6 Ajiya 5.5 38.1 41
7 New Hoong Fatt Holdings 5.5 41.4 85
8 Coastal Contracts 5.6 45.4 49
9 Trans-Asia Shipping Corporation 5.7 16.7 111
10 Eng Teknologi Holdings 6.0 43.4 55
11 Freight Management Holdings 6.1 13.1 23
12 Southern Steel 6.2 41.8 107
13 Signature International 6.2 24.5 105
14 Leader Universal Holdings 6.4 15.7 31
15 Protasco 6.6 15.7 99
16 Plenitude 6.6 45.5 97
17 Delloyd Ventures 6.7 47.2 51
18 CBS Technology 6.8 8.0 45
19 Efficient E-Solutions 6.9 2.9 53
20 Pantech Group Holdings 6.9 13.5 93
21 MBM Resources 6.9 39.4 81
22 EP Manufacturing 6.9 7.3 57
23 Sunway Holdings 7.1 21.6 109
24 Pelikan International Corporation 7.2 18.0 95
25 Evergreen Fibreboard 7.4 23.1 59
26 Mamee-Double Decker 7.8 37.3 79
27 Zhulian Corporation 7.8 28.6 115
28 Alam Maritim Resources 8.0 24.9 17
29 Kian Joo Can Factory 9.0 13.8 71
30 Naim Holdings 9.2 37.4 35
31 AEON Credit Service 9.3 44.4 39
32 Adventa 9.3 42.7 37
33 Faber Group 9.5 26.6 21
34 Notion Vtec 9.6 37.5 87
35 Kawan Food 9.7 13.1 69
36 Padini Holdings 9.7 39.0 91
37 Yi-Lai 10.1 7.7 113
38 C.I. Holdings 10.2 19.7 19
39 Glomac 10.3 14.1 25
40 HELP International 10.4 20.8 65
41 Hektar REIT 10.6 11.5 63
42 Kossan Rubber Industries 11.1 74.5 73
43 Salcon 11.6 6.4 103
44 Axis REIT 12.3 16.2 43
45 Hai-O Enterprise 12.3 35.8 27
46 Hock Seng Lee 12.5 12.5 67
47 NTPM Holdings 12.7 4.6 89
48 KPJ Healthcare 13.8 21.3 29
49 QL Resources 13.9 24.6 101
50 Lingkaran Trans Kota Holdings 16.9 18.2 75

Appendix 4Ranking Based on FY10 PBV (x) & FY10 BPS (sen)Ranking Full Name FY10 PBV FY10 BPS PAGE1 EP Manufacturing 0.4 1.4 57
2 Trans-Asia Shipping Corporation 0.4 2.1 111
3 Lion Industries Corporation 0.5 4.2 33
4 Malaysia Steel Works (KL) 0.5 2.4 77
5 Plenitude 0.6 5.2 97
6 Multi Sports Holdings Ltd 0.6 0.8 83
7 Yi-Lai 0.6 1.2 113
8 Kian Joo Can Factory 0.6 1.9 71
9 New Hoong Fatt Holdings 0.7 3.3 85
10 MBM Resources 0.7 4.0 81
11 Ajiya 0.7 3.0 41
12 Leader Universal Holdings 0.7 1.4 31
13 Century Logistics Holdings 0.8 2.2 47
14 Protasco 0.8 1.4 99
15 Glomac 0.8 1.9 25
16 Pelikan International Corporation 0.8 1.6 95
17 Delloyd Ventures 0.8 3.9 51
18 Sunway Holdings 0.9 1.6 109
19 Signature International 0.9 1.6 105
20 Hektar REIT 1.0 1.3 63
21 Handal Resources 1.0 0.8 61
22 Freight Management Holdings 1.0 0.8 23
23 Salcon 1.0 0.7 103
24 Axis REIT 1.1 1.8 43
25 Evergreen Fibreboard 1.1 1.6 59
26 Efficient E-Solutions 1.2 0.2 53
27 Eng Teknologi Holdings 1.2 2.2 55
28 Southern Steel 1.2 2.2 107
29 Naim Holdings 1.2 2.9 35
30 Coastal Contracts 1.5 1.8 49
31 Alam Maritim Resources 1.5 1.3 17
32 CBS Technology 1.6 0.3 45
33 Kawan Food 1.6 0.8 69
34 Mamee-Double Decker 1.7 1.7 79
35 HELP International 1.9 1.2 65
36 Faber Group 1.9 1.3 21
37 Padini Holdings 2.0 1.9 91
38 C.I. Holdings 2.1 1.0 19
39 AEON Credit Service 2.1 2.0 39
40 Zhulian 2.1 1.0 115
41 Pantech Group Holdings 2.2 0.4 93
42 KPJ Healthcare 2.3 1.3 29
43 Notion Vtec 2.5 1.4 87
44 Adventa 2.6 1.5 37
45 Hock Seng Lee 2.8 0.6 67
46 QL Resources 2.8 1.2 101
47 Kossan Rubber Industries 2.9 2.9 73
48 NTPM Holdings 3.1 0.2 89
49 Lingkaran Trans Kota Holdings 3.3 0.9 75
50 Hai-O Enterprise 4.2 1.1 27

App
endi
x 5
Earn
ing
Sum
mar
yC
ompa
ny /
Sect
or N
et P
rofit
(RM
m)
Net
Mar
gin
RO
E P
ER (x
) P
BV
(x)
Gro
ss D
iv Y
ield
TP
CA
LL
FY0
8 F
Y09
FY1
0f
FY08
FY09
FY10
fFY
08FY
09FY
10f
FY09
FY10
f F
Y09
FY1
0f
FY09
FY10
f (R
M)
Del
loyd
Ven
ture
s20
.633
.941
.57.
1%11
.8%
11.5
%7.
2%11
.0%
12.2
%8.
26.
70.
90.
82.
4%2.
4%3.
78B
UY
EP
Man
ufac
turin
g7.
67.
112
.21.
6%1.
5%2.
2%3.
5%3.
2%5.
2%11
.96.
90.
40.
42.
2%0.
0%0.
59N
EU
TRA
LM
BM
Res
ourc
es11
1.0
69.0
95.3
9.2%
5.8%
6.8%
13.1
%7.
7%9.
8%9.
66.
90.
70.
72.
3%3.
3%3.
54B
UY
New
Hoo
ng F
att H
oldi
ngs
24.0
27.3
31.1
14.2
%13
.4%
14.0
%11
.0%
11.8
%12
.4%
6.2
5.5
0.7
0.7
5.3%
6.6%
2.75
BU
YA
utom
otiv
e S
ecto
r16
3.2
137.
318
0.1
8.0%
8.1%
8.6%
8.7%
8.4%
9.9%
9.0
6.5
0.69
0.63
3.1%
3.1%
Ajiy
a 21
.623
.426
.46.
8%7.
3%7.
6%13
.4%
12.8
%12
.9%
6.2
5.5
0.8
0.7
3.8%
2.9%
1.90
BU
YE
verg
reen
Fib
rebo
ard
76.7
87.4
118.
710
.5%
11.3
%13
.6%
13.4
%13
.3%
15.8
%10
.17.
41.
21.
13.
8%3.
6%2.
08B
UY
Sig
natu
re In
tern
atio
nal
15.5
20.3
19.6
14.0
%12
.8%
13.5
%26
.7%
25.6
%26
.6%
6.0
6.2
1.5
0.9
3.8%
2.0%
1.94
BU
YYi
-Lai
13
.211
.812
.311
.1%
10.6
%10
.5%
6.8%
6.0%
6.2%
10.6
10.1
0.6
0.6
4.3%
8.3%
0.70
NE
UTR
AL
Bui
ldin
g M
ater
ials
Sec
tor
127.
014
2.9
177.
010
.6%
10.5
%11
.3%
15.1
%14
.4%
15.4
%8.
27.
31.
00.
83.
9%4.
2%Fa
ber G
roup
61.1
83.0
96.6
9.1%
10.3
%10
.3%
19.2
%21
.3%
19.8
%11
.09.
52.
41.
92.
4%2.
8%2.
75B
UY
Con
glom
erat
e61
.183
.096
.69.
1%10
.3%
10.3
%19
.2%
21.3
%19
.8%
11.0
9.5
2.4
1.9
2.4%
2.8%
Hoc
k S
eng
Lee
41.8
56.3
72.8
13.5
%15
.0%
13.3
%17
.2%
19.3
%22
.1%
16.1
12.5
3.1
2.8
1.5%
2.4%
1.61
BU
YN
aim
Hol
ding
s70
.078
.793
.511
.9%
14.9
%14
.4%
11.5
%11
.8%
13.0
%10
.99.
21.
31.
22.
7%2.
2%4.
21B
UY
Pro
tasc
o28
.842
.547
.24.
6%6.
2%6.
5%8.
0%11
.1%
11.7
%7.
36.
60.
80.
89.
9%6.
3%1.
42B
UY
Sun
way
Hol
ding
s10
0.2
109.
312
9.8
5.5%
4.2%
6.5%
15.5
%12
.7%
13.3
%8.
47.
11.
10.
91.
3%0.
7%2.
03N
EU
TRA
LC
onst
ruct
ion
Sec
tor
240.
828
6.8
343.
38.
9%10
.1%
10.2
%13
.1%
13.7
%15
.0%
10.7
8.8
1.6
1.4
3.9%
2.9%
C.I.
Hol
ding
s14
.521
.028
.05.
0%5.
8%7.
4%14
.0%
15.8
%20
.2%
13.7
10.2
2.2
2.1
4.2%
6.0%
2.40
BU
YH
ai-O
Ent
erpr
ise
48.5
52.0
72.6
13.0
%12
.0%
12.7
%34
.5%
31.5
%33
.7%
17.2
12.3
5.4
4.2
9.5%
5.4%
5.04
BU
YK
awan
Foo
d9.
513
.615
.712
.6%
15.5
%12
.1%
13.7
%16
.3%
16.4
%11
.29.
71.
81.
60.
0%2.
4%1.
64TR
AD
ING
BU
YK
ian
Joo
Can
Fac
tory
69.5
48.9
61.2
7.9%
5.6%
7.0%
10.4
%6.
0%7.
2%11
.39.
00.
70.
63.
7%6.
0%1.
13N
EU
TRA
LM
amee
-Dou
ble
Dec
ker
23.6
43.6
56.4
5.9%
10.6
%11
.8%
12.3
%19
.5%
21.7
%10
.17.
82.
01.
70.
0%12
.4%
4.10
BU
YM
ulti
Spo
rts H
oldi
ngs
Ltd
46.2
61.6
76.4
23.9
%25
.9%
24.7
%16
6.1%
36.9
%31
.0%
2.8
2.2
1.1
0.6
0.0%
9.5%
1.17
BU
YN
TPM
Hol
ding
s34
.146
.251
.811
.1%
12.9
%12
.4%
18.8
%22
.7%
24.6
%14
.212
.73.
23.
14.
5%5.
1%0.
49N
EU
TRA
LP
adin
i Hol
ding
s42
.749
.551
.411
.1%
10.4
%10
.4%
25.0
%24
.3%
20.4
%10
.19.
72.
52.
03.
6%3.
9%4.
25N
EU
TRA
LP
elik
an In
tern
atio
nal C
orpo
ratio
n40
.634
.992
.83.
2%2.
9%3.
7%7.
5%6.
1%11
.2%
19.2
7.2
1.2
0.8
1.5%
3.8%
1.44
BU
YQ
L R
esou
rces
80.8
89.3
97.5
6.2%
6.4%
6.5%
22.4
%21
.4%
19.9
%15
.213
.93.
22.
82.
2%2.
9%4.
30B
UY
Zhul
ian
Cor
pora
tion
74.7
82.0
98.6
24.6
%26
.0%
26.0
%26
.7%
25.6
%26
.6%
9.4
7.8
2.4
2.1
6.2%
7.7%
3.43
BU
YC
onsu
mer
Sec
tor
484.
754
2.6
702.
411
.3%
12.2
%12
.2%
31.9
%20
.6%
21.2
%12
.29.
32.
32.
03.
2%5.
9%H
ELP
Inte
rnat
iona
l11
.815
.518
.513
.6%
16.0
%16
.1%
15.9
%17
.6%
17.9
%12
.410
.42.
21.
91.
4%1.
6%2.
40B
UY
Edu
catio
n S
ecto
r11
.815
.518
.513
.6%
16.0
%16
.1%
15.9
%17
.6%
17.9
%12
.410
.42.
21.
91.
4%1.
6%A
EO
N C
redi
t Ser
vice
33.4
48.8
53.3
22.0
%26
.1%
25.5
%18
.4%
22.6
%22
.6%
10.1
9.3
2.3
2.1
6.1%
5.5%
4.95
BU
YFi
nanc
e S
ecto
r33
.448
.853
.322
.0%
26.1
%25
.5%
18.4
%22
.6%
22.6
%10
.19.
32.
32.
16.
1%5.
5%K
PJ
Hea
lthca
re78
.410
1.9
112.
46.
2%7.
0%7.
0%13
.8%
16.6
%16
.8%
15.3
13.8
2.5
2.3
2.9%
3.2%
3.92
BU
YH
ealth
care
Sec
tor
78.4
101.
911
2.4
6.2%
7.0%
7.0%
13.8
%16
.6%
16.8
%15
.313
.82.
52.
32.
9%3.
2%Le
ader
Uni
vers
al H
oldi
ngs
64.9
53.4
68.5
2.6%
2.7%
3.2%
13.0
%9.
9%11
.5%
8.2
6.4
0.8
0.7
3.9%
3.7%
1.13
BU
YIn
dust
rial S
ecto
r64
.953
.468
.52.
6%2.
7%3.
2%13
.0%
9.9%
11.5
%8.
26.
40.
80.
73.
9%3.
7%C
entu
ry L
ogis
tics
Hol
ding
s12
.120
.926
.912
.7%
5.7%
7.9%
8.7%
13.4
%15
.2%
6.4
5.0
0.9
0.8
3.0%
4.9%
2.00
BU
YFr
eigh
t Man
agem
ent H
oldi
ngs
12.2
13.6
16.0
5.5%
5.9%
6.2%
16.3
%16
.2%
16.8
%7.
26.
11.
21.
05.
6%6.
8%0.
95B
UY
Tran
s-A
sia
Shi
ppin
g C
orpo
ratio
n16
.410
.116
.74.
5%3.
6%5.
3%9.
1%5.
2%7.
9%9.
45.
70.
50.
47.
3%7.
4%1.
16B
UY
Logi
stic
s S
ecto
r40
.744
.659
.67.
6%5.
1%6.
5%11
.4%
11.6
%13
.3%
7.7
5.6
0.8
0.7
5.3%
6.4%
Ala
m M
ariti
m R
esou
rces
76.4
95.8
122.
721
.4%
27.6
%29
.9%
19.3
%19
.6%
18.6
%10
.28.
02.
01.
50.
8%1.
0%2.
99B
UY
Coa
stal
Con
tract
s96
.716
2.7
159.
927
.8%
34.9
%35
.8%
31.4
%35
.5%
25.8
%5.
55.
62.
01.
51.
0%0.
8%3.
63B
UY
Han
dal R
esou
rces
9.2
10.0
17.7
15.3
%20
.6%
20.3
%19
.4%
17.7
%23
.8%
7.2
4.1
1.3
1.0
2.5%
2.8%
1.38
BU
YO
il an
d G
as S
ecto
r18
2.3
268.
530
0.3
21.5
%27
.7%
28.7
%23
.4%
24.3
%22
.7%
7.6
5.9
1.7
1.3
1.4%
1.5%
Axi
s R
EIT
63.4
62.0
49.8
100.
2%86
.2%
59.4
%14
.2%
11.1
%8.
9%9.
912
.31.
11.
18.
2%8.
1%1.
91N
EU
TRA
LG
lom
ac35
.132
.041
.910
.8%
9.3%
13.2
%7.
0%6.
2%7.
5%13
.510
.30.
80.
811
.1%
4.2%
1.66
TRA
DIN
G B
UY
Hek
tar R
EIT
60.4
37.1
37.0
71.8
%42
.3%
42.1
%15
.0%
9.1%
9.0%
10.5
10.6
1.0
1.0
9.2%
8.9%
1.29
BU
YP
leni
tude
78.7
79.8
61.4
22.6
%28
.2%
22.7
%13
.4%
12.2
%8.
7%5.
16.
60.
60.
64.
4%3.
8%4.
60N
EU
TRA
LP
rope
rty S
ecto
r23
7.6
210.
919
0.1
51.4
%41
.5%
34.4
%12
.4%
9.7%
8.5%
9.7
9.9
0.9
0.8
8.2%
6.3%
Adv
enta
20.1
47.5
59.4
9.0%
16.8
%15
.0%
12.5
%25
.7%
27.7
%11
.79.
33.
02.
61.
9%1.
9%5.
37B
UY
Kos
san
Rub
ber I
ndus
tries
59.3
66.8
119.
16.
6%8.
0%11
.3%
19.8
%18
.7%
26.0
%19
.711
.13.
72.
92.
2%1.
6%11
.30
BU
YR
ubbe
r Glo
ve S
ecto
r79
.411
4.3
178.
57.
8%12
.4%
13.2
%16
.2%
22.2
%26
.9%
15.7
10.2
3.3
2.7
2.1%
1.8%
Lion
Indu
strie
s C
orpo
ratio
n86
1.9
-257
.630
3.3
12.4
%-5
.4%
5.1%
28.4
%-9
.3%
10.0
%n.
a4.
50.
50.
50.
0%0.
5%2.
51B
UY
Mal
aysi
a S
teel
Wor
ks (K
L)79
.3-8
.548
.39.
0%-1
.2%
6.0%
18.4
%-2
.0%
10.4
%n.
a4.
70.
50.
50.
0%3.
0%1.
45B
UY
Pan
tech
Gro
up H
oldi
ngs
34.2
59.6
50.7
10.9
%11
.7%
9.8%
23.4
%34
.3%
31.4
%5.
96.
92.
02.
22.
4%2.
7%0.
88B
UY
Sou
ther
n S
teel
10
4.7
16.2
172.
13.
2%0.
8%6.
3%13
.8%
2.2%
19.3
%65
.56.
21.
41.
22.
8%4.
1%3.
04B
UY
Ste
el S
ecto
r1,
080.
1-1
90.3
574.
48.
9%1.
5%6.
8%21
.0%
6.3%
17.8
%35
.75.
61.
11.
11.
3%2.
6%C
BS
Tec
hnol
ogy
5.7
11.0
12.8
28.0
%12
.9%
16.9
%18
.4%
25.4
%23
.3%
8.0
6.8
2.0
1.6
0.0%
0.0%
0.48
BU
YE
ffici
ent E
-Sol
utio
ns15
.816
.719
.126
.6%
25.5
%25
.2%
19.1
%17
.0%
16.7
%7.
96.
91.
31.
211
.2%
2.5%
0.19
BU
YE
ng T
ekno
logi
Hol
ding
s24
.543
.554
.94.
4%9.
2%10
.1%
10.9
%18
.3%
19.7
%7.
66.
01.
41.
27.
5%5.
5%3.
25B
UY
Not
ion
Vte
c 32
.936
.052
.822
.5%
20.9
%23
.5%
24.0
%22
.0%
25.9
%14
.19.
63.
12.
52.
5%3.
7%3.
38B
UY
Tech
nolo
gy S
ecto
r78
.910
7.2
139.
620
.4%
17.1
%18
.9%
18.1
%20
.7%
21.4
%9.
47.
32.
01.
65.
3%2.
9%Li
ngka
ran
Tran
s K
ota
Hol
ding
s10
4.8
102.
190
.435
.8%
34.3
%29
.4%
11.3
%24
.3%
19.8
%14
.916
.93.
63.
315
.3%
5.6%
3.44
BU
YTo
ll C
once
ssio
n S
ecto
r10
4.8
102.
190
.435
.8%
34.3
%29
.4%
11.3
%24
.3%
19.8
%14
.916
.93.
63.
315
.3%
5.6%
Sal
con
8.8
22.1
29.8
3.5%
6.0%
6.0%
-78.
1%34
1.3%
90.3
%15
.711
.61.
11.
01.
4%1.
2%0.
81B
UY
Oth
ers
Sec
tor
8.8
22.1
29.8
3.5%
6.0%
6.0%
-78.
1%34
1.3%
90.3
%15
.711
.61.
11.
01.
4%1.
2%TO
P 50
SM
ALL
CA
P EA
RN
ING
S U
NIV
ERSE
(ex
stee
l sec
tor)
1,99
7.8
2,28
1.9
2,74
0.4
14.7
%14
.6%
14.6
%10
.9%
35.6
%21
.8%
12.6
9.1
1.79
1.55
4.2%
3.6%