Top ECMs for Labs and Data Centers - US Department of Energy · 2011 ASHRAE Thermal Guidelines ....
49
NREL is a national laboratory of the U.S. Department of Energy, Office of Energy Efficiency and Renewable Energy, operated by the Alliance for Sustainable Energy LLC Top ECMs for Labs and Data Centers FUPWG Otto Van Geet, PE October 10, 2012
Transcript of Top ECMs for Labs and Data Centers - US Department of Energy · 2011 ASHRAE Thermal Guidelines ....

NREL is a national laboratory of the U.S. Department of Energy, Office of Energy Efficiency and Renewable Energy, operated by the Alliance for Sustainable Energy LLC
Top ECMs for Labs and Data Centers
FUPWG
Otto Van Geet, PE
October 10, 2012

2
Labs are Energy Hogs!
• 3 to 8 times as energy intensive as office buildings
Total Site Energy Use Intensity BTU/sf-yr for various laboratories in the Labs21 Benchmarking Database
Typical
Office Building

3
• Core information resources – Design Guide – Case Studies – Energy Benchmarking – Best Practice Guides – Technical Bulletins
• Design process tools – Env. Performance
Criteria – Labs21 Process Manual
Labs21 Toolkit

4
Six BIG HITS
1. Scrutinize the air changes: Optimize ventilation rates
2. Tame the hoods: Compare exhaust device options
3. Get real with loads: Right-size HVAC systems
4. Just say no to re-heat: Minimize simultaneous heating and cooling
5. Drop the pressure drop: Use lower pressure-drop HVAC designs
6. Use energy recovery in most climates

5
LABORATORY ROOM
OUTSIDE OUTSIDE
AIR
FILTERS
SUPPLY FAN
COOLING 35%
HEATING 5%
LOCAL HEATING
5% SUPPLY FAN POWER
30%
30% SU. FAN + 20% EXH. FAN
50% ENERGY
PRIMARY AIR HANDLING UNIT EXHAUST FAN POWER
20% HUMIDIFICATION 5%
Adapted with permission by Gregory DeLuga, Siemens Building Technologies, Inc.
Basic Lab HVAC System

6
Basic VAV System Diagram
• Sash position monitored by control system.
• Control system modulates damper in fume hood exhaust duct.
• Feedback maintains precise air flow for sash position.
• Supply make-up air modulates to maintain negative room pressure differential.
• Coordinates both supply & exhaust offset and lab differential pressure.
• Temperature control provided by modulating supply air temperature with coil.
Hit 2: Reduce Fume Hood Energy Use

7
#1 Scrutinize the Air Changes • Most Labs are over ventilated • Options to consider
– cfm/sqft rather than ACR – Panic switch concept – Cascading air from clean to dirty – Setback ACR when lab is unoccupied – Demand controlled ventilation (based on monitoring of
hazards and odors) – Control Banding (one rate doesn’t fit all) – Modeling and simulation for optimization
• Ventilation effectiveness is more dependent on lab and
HVAC design than air change rates (ACR)

8
#2 Tame the Hoods 1. Reduce the number and
size of hoods 2. Restrict the sash opening 3. Use Two “speeds”
occupied and un-occupied
4. Use variable air volume (VAV)
5. Consider high performance hoods
6. Say no to Auxiliary Air hoods and canopy hoods

9
Impact of Sash Management Training
Impact of Sash Management Training on Airflow Ratio Duke University Lab Module
1.00
1.20
1.40
1.60
1.80
2.00
6/18/2
003
6/25/2
003
7/2/20
03
7/9/20
03
7/16/2
003
7/23/2
003
7/30/2
003
Time
Airfl
ow M
anag
emen
t Rat
io(a
vg c
fm/m
in c
fm)
Sash managementtraining 7/7-8
Post-training avg = 1.64
Pre-training avg = 1.89

10
#3 Drop the Pressure Drop
• Up to one half HVAC energy goes to fans
• How low can you go?
Image courtesy of Rumsey Engineers, Inc.

11
Low Pressure Drop Design
Image courtesy of Rumsey Engineers, Inc.

12
Source: J. Weale, P. Rumsey, D. Sartor, L. E. Lock, “Laboratory Low-Pressure Drop Design,” ASHRAE Journal, August 2002.
Component Standard Good Better
Air handler face velocity 500 400 300
Air Handler 2.5 in. w.g. 1.5 in. w.g. 0.75 in.w.g.
Heat Recovery Device 1.00 in. w.g. 0.60 in. w.g. 0.35 in. w.g.
VAV Control Devices Constant Volume, N/A
Flow Measurement Devices, 0.60 - 0.30 in. w.g.
Pressure Differential Measurement and Control, 0.10 in. w.g.
Zone Temperature Control Coils
0.5 in. w.g. 0.30 in. w.g. 0.05 in. w.g.
Total Supply and Return Ductwork
4.0 in. w.g. 2.25 in. w.g. 1.2 in. w.g.
Exhaust Stack 0.7” w.g. full design flow through entire exhaust system, Constant Volume
0.7” w.g. full design flow through fan and stack only, VAV System with bypass
0.75” w.g. averaging half the design flow, VAV System with multiple stacks
Noise Control (Silencers) 1.0” w.g. 0.25” w.g. 0.0” w.g.
Total 9.7” w.g. 6.2” w.g. 3.2” w.g.
Approximate W / CFM 1.8 1.2 0.6
Low Pressure-Drop Design Guidelines

13
#4 Get Real with Plug Loads
• Save capital cost and operating cost
• Measure actual loads in similar labs
• Design for high part- load efficiency
– Modular design approaches
• Plug load diversity in labs increases reheat

14
Measured vs. Design – UC Davis Case Study
• Significant over-sizing not unusual

15
#5 Just Say No to Reheat • Reheat (simultaneous heating and cooling) causes major
energy use in labs
– High-load areas require lower supply air temperature, so reheat occurs in other spaces
Range of measured W/sf (15min Avg kW) in a university lab building
-
2
4
6
8
10
12
14
16
18
3L2A 3L2B 3L2C 3L2D 3L2E 3L2H 3L2L 3L2M 2L2G 2L2H 3L1N Main T1

16
System Alternatives to Minimize Reheat • Ventilation air
with zone coils
• Ventilation air with fan coils
• Ventilation air with radiant cooling
• Ventilation air with inductive cooling coils (chilled beam)

17
Optimize Thermal Environment • Global Ecology Center,
Stanford University
– Main labs: 73 F +/- 5F
– Highest intensity equipment (freezers, etc.)in dedicated warehouse: 55F - 95F
– Tight-tolerance equipment in separate room: 70 F +/- 1F
• Additional 17% savings over 41% CA Title 24 savings
Source: EHDD Architecture

18
Energy Recovery • Factors that improve energy recovery
economics include:
– Colder climates (e.g. more than 3,000 heating degree-days)
– High exhaust rates
– High utility rates
• Consider impact of increase pressure drop due to energy recovery devices in airflow.
• Evaporative cooling in exhaust stream can increase cooling energy-recovery without adding moisture to supply air.
Energy recovery system
#6 Use energy recovery in most climates

19
Data Center Energy • Data centers are energy intensive facilities
– Server racks now designed for more than 25+ kW
– Surging demand for data storage
– Typical facility ~ 1MW, can be > 20 MW
– 1.5% of US Electricity consumption
– Projected to double in next 5 years
• Significant data center building boom – Power and cooling constraints in existing facilities

20
BPG Table of Contents
• Summary • Background • Information Technology
Systems • Environmental Conditions • Air Management • Cooling Systems • Electrical Systems • Other Opportunities for
Energy Efficient Design • Data Center Metrics &
Benchmarking
21
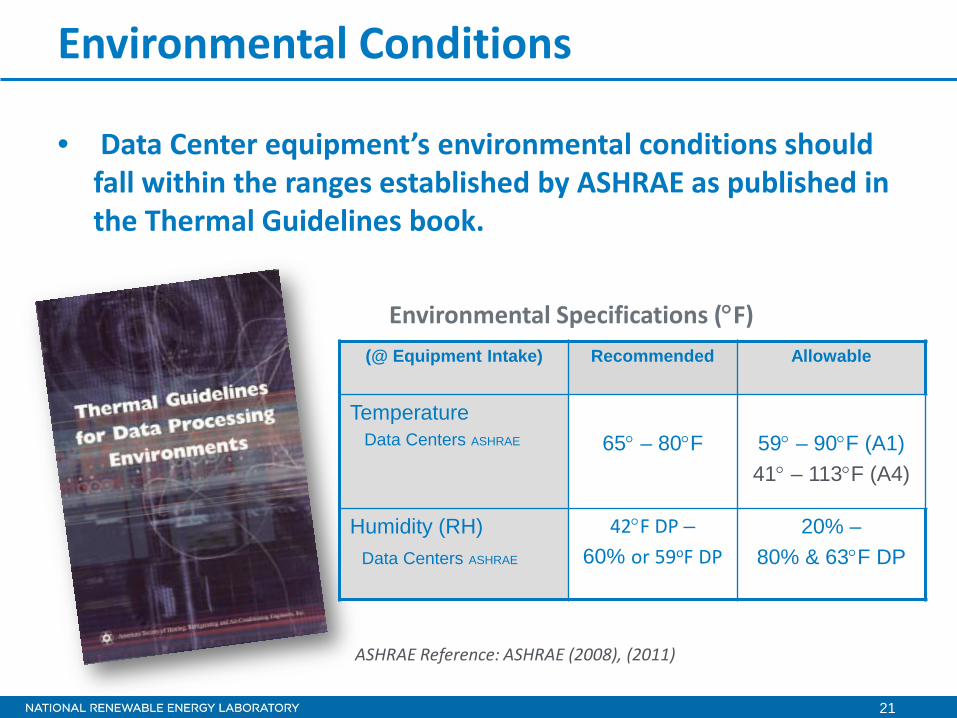
• Data Center equipment’s environmental conditions should fall within the ranges established by ASHRAE as published in the Thermal Guidelines book.
Environmental Conditions
ASHRAE Reference: ASHRAE (2008), (2011)
(@ Equipment Intake) Recommended Allowable
Temperature Data Centers ASHRAE
65° – 80°F
59° – 90°F (A1) 41° – 113°F (A4)
Humidity (RH) Data Centers ASHRAE
42°F DP – 60% or 59oF DP
20% – 80% & 63°F DP
Environmental Specifications (°F)

22
Equipment Environmental Specification
Air Inlet to IT Equipment is the important
specification to meet
Outlet temperature is not important to IT Equipment

23
2011 ASHRAE Thermal Guidelines
2011 Thermal Guidelines for Data Processing Environments – Expanded Data Center Classes and Usage Guidance. White paper prepared by ASHRAE Technical Committee TC 9.9

24
2011 ASHRAE allowable ranges
Dry Bulb Temperature

25
Estimated Savings
Baseline System DX Cooling with no economizer
Load 1 ton of cooling, constant year-round
Efficiency (COP) 3
Total Energy (kWh/yr) 10,270
Recommended Range Allowable Range
Results Hours Energy (kWh) Hours Energy (kWh)
Zone1: DX Cooling Only 25 8 2 1
Zone2: Multistage Indirect Evap. + DX (H80) 26 16 4 3
Zone3: Multistage Indirect Evap. Only 3 1 0 0
Zone4: Evap. Cooler Only 867 97 510 57
Zone5: Evap. Cooler + Economizer 6055 417 1656 99
Zone6: Economizer Only 994 0 4079 0
Zone7: 100% Outside Air 790 0 2509 0
Total 8,760 538 8,760 160
Estimated % Savings - 95% - 98%

26
Improve Air Management
• Typically, more air circulated than required
• Air mixing and short circuiting leads to: – Low supply temperature – Low Delta T
• Use hot and cold aisles • Improve isolation of hot and
cold aisles – Reduce fan energy – Improve air-conditioning
efficiency – Increase cooling capacity
26
Hot aisle / cold aisle configuration decreases mixing of intake & exhaust air, promoting efficiency.
Source: http://www1.eere.energy.gov/femp/pdfs/eedatacenterbestpractices.pdf

27
Isolate Cold and Hot Aisles
Source: http://www1.eere.energy.gov/femp/pdfs/eedatacenterbestpractices.pdf
70-80ºF vs. 45-55ºF
95-105ºF vs. 60-70ºF

28
Psychrometric Bin Analysis
0
0.002
0.004
0.006
0.008
0.01
0.012
0.014
0.016
0.018
0.02
0.022
0.024
0.026
0.028
0.03
0.032
0.034
0.036
30 40 50 60 70 80 90 100 110 120
Hum
idity
Rat
io (l
b W
ater
/lb D
ry A
ir)
Dry-Bulb Temperature (ºF)
Boulder, Colorado TMY3 Weather Data
TMY3 Weather Data
Class 1 Recommended Range
Class 1 Allowable Range
60ºF
50ºF
40ºF
Rel
ativ
e H
umid
ity
80% 60% 40% 20%
100%
70ºF
60ºF
50ºF
40ºF
Rel
ativ
e H
umid
ity
80% 60% 40% 20%
100%
80ºF
Design Conditions (0.4%): 91.2 db, 60.6 wb

29
Adding Air Curtains for Hot/Cold Isolation
Photo used with permission from the National Snow and Ice Data Center. http://www.nrel.gov/docs/fy12osti/53939.pdf

30
2011 ASHRAE Liquid Cooling Guidelines
NREL ESIF HPC (HP hardware) using 75 F supply, 113 F return –W4/W5NREL

31
Liquid Cooling – Overview
Water and other liquids (dielectrics, glycols and refrigerants) may be used for heat removal.
• Liquids typically use LESS transport energy (14.36 Air to Water Horsepower ratio for example below).
• Liquid-to-liquid heat exchangers have closer approach temps than Liquid-to-air (coils), yielding increased economizer hours.

32
Moving to liquid cooling designs
• As server heat densities rise, liquid heat removal solutions become more appropriate.
• Heat removal efficiency increases as the liquid gets closer to the source of heat.
• Liquids can provide cooling with higher temperature coolant.
• Liquids also offer the potential for better re-use of waste heat.

33
Liquid Cooling – Systems / Loops
Liquid Cooling Systems / Loops within a Data Center

34
In-Row Cooling
Graphics courtesy of Rittal

35
Rear Door (open)
Rear-Door Liquid Cooling
Inside rack RDHx, open 90°
Liquid Cooling Connections
Rear Doors (closed)

36
Server Component Liquid Cooling
36
Within a server, most of the heat is concentrated in a small number of areas
CPUs, GPUs and memory generate 60-80% of data center heat-load RackCDU cools these components directly, bypassing the CRAC entirely
RackCDU Retrofit
Redundant Liquid Cooling Pumps
Air-Cooled Heat Sinks

37
RackCDUTM “Hot-Spot” Liquid Cooling
37
Redundant mini-pumps ensure reliability
Low-pressure, low-volume mini-loops and factory sealed design eliminate risk of leaks
Servers are physically separated facilty water (prevents leaks; maximizes performance)
RackCDUTM brings liquid coolant directly to the hottest components
Outdoor Dry Cooler
Cooling Loop
Rack Extension
Liquid-to-Liquid HEX

38
“Chill-off 2” evaluation of close-coupled cooling solutions

39
Cooling Takeaways…
• Use a central plant (e.g. chiller/CRAHs) vs. CRAC units
• Use centralized controls on CRAC/CRAH units to prevent simultaneous humidifying and dehumidifying.
• Move to liquid cooling (room, row, rack, chip) • Consider VSDs on fans, pumps, chillers, and towers • Use air- or water-side economizers. • Expand humidity range and improve humidity
control (or disconnect).

40
PUE – simple and effective

41
“I am re-using waste heat from my data center on another part of my site and my PUE is 0.8!”

42
“I am re-using waste heat from my data center on another part of my site and my PUE is 0.8!”
ASHRAE & friends (DOE, EPA, TGG, 7x24, etc..) do not allow reused energy in PUE & PUE is always >1.0 Another metric has been developed by The Green Grid +; ERE – Energy Reuse Effectiveness http://www.thegreengrid.org/en/Global/Content/white-papers/ERE
ERE – adds energy reuse

43
Utility
Cooling
UPS PDU
IT
RejectedEnergy
(a)
(b)(c) (d)
(f)
(e)
ReusedEnergy
(g)
ERE – adds energy reuse

Savings at Data Centers
• Huge energy consumption
• Energy use = 52,010,100 kWh/yr in FY11
• PUE = 2.0
Stennis Data Center

Savings at Data Centers
• Traveled to Stennis for one week with an NREL team.
• Team identified financially viable energy and renewable energy projects.
• Team developed a site-specific action plan for implementing measures.
What we did

Savings at Data Centers
Results: The team identified 15 energy conservation measures in 5 categories:
• UPS upgrades • HVAC systems • Lighting upgrades • IT environment
improvements • Renewable energy
additions

Savings at Data Centers
Cost Savings Bundle
Package Total Cost ($)
Energy Savings
(kWh/year)
Cost Savings ($/year)
Simple Payback (years)
All ECMs without PV system $3,050,027 19,531,494 $1,367,205 2.2
All ECMs including PV system $9,743,777 $22,038,905 $1,542,723 6.3

48
1. Reduce the IT load - Virtualization & Consolidation (up to 80% reduction) 2. Implement contained hot aisle and cold aisle layout
o Curtains, equipment configuration, blank panels, cable entrance/exit ports,
3. Install economizer (air or water) and evaporative cooling (direct or indirect)
4. Raise discharge air temperature. Install VFD’s on all computer room air conditioning (CRAC) fans (if used) and network the controls
5. Reuse data center waste heat if possible 6. Raise the chilled water (if used) set-point
o Increasing chiller water temperature by 1°F reduces chiller energy use by 1.4%
7. Install high efficiency equipment including UPS, power supplies, etc. 8. Move chilled water as close to server as possible (direct liquid cooling) 9. Consider centralized high efficiency water cooled chiller plant
o Air-cooled = 2.9 COP, water-cooled = 7.8 COP
Energy Conservation Measures

49
Otto VanGeet 303.384.7369
RSF II 21 kBtu/ft2 $246/ft2 construction cost
Questions?