Top 10 States For Afterschoolafterschoolalliance.org/documents/AA3PM-2014/AA3PM_TOP_10.pdf ·...
22
Top 10 States For Afterschool Over the past decade, much progress has been made nationally to increase enrollment in afterschool programs–programs that are keeping children safe, inspiring them to learn and supporting working families between the hours of 3 and 6 p.m. The national perspective of America After 3PM paints a broad picture of how children are spending their time during the out-of-school hours and the needs of their parents. However, as unmet demand for afterschool programs continues to rise and the number of children alone and unsupervised in the hours after school remains high, 1 a state-level assessment is important to identify where the greatest progress is being made in afterschool program participation rates and gain a better understanding of the factors that contribute to increased participation in afterschool programs. Elements such as the rate of participation in afterschool programs, the number of children alone and unsupervised after school, and parental satisfaction with afterschool programs vary from state to state, however identifying the top 10 states for afterschool allows one to take a closer look at what steps these states have taken to ensure that more children and families have access to quality afterschool programs. A composite score was calculated for all 50 states, plus the District of Columbia, and indexed against the national average to determine the top 10 states for afterschool. Each state’s overall score is based on similar variables used to identify the 2009 top 10 states, and includes afterschool program participation, afterschool programs reaching children in need and parents’ satisfaction with key features of their afterschool program: • Percent of children in an afterschool program weighted by the average number of hours per week each child spends in an afterschool program. • Percent of afterschool program participants who are low-income. 2 • Percent of children not in self-care. • Percent of parents, overall, who agree that afterschool programs in their area provide a high quality of care. 3 • Percent of parents with a child in an afterschool program who are extremely satisfied with their program overall. • Percent of parents with a child in an afterschool program who are satisfied with their afterschool program’s quality of care.* • Percent of parents with a child in an afterschool program who are satisfied with their afterschool program’s variety of activities.* • Percent of parents with a child in an afterschool program who are satisfied with the cost of their afterschool program.* AMERICA AFTER3PM AMERICA AFTER 3PM 1
Transcript of Top 10 States For Afterschoolafterschoolalliance.org/documents/AA3PM-2014/AA3PM_TOP_10.pdf ·...
Top 10 States For Afterschool
Over the past decade, much progress has been made nationally to increase enrollment in afterschool programs–programs that are keeping children safe, inspiring them to learn and supporting working families between the hours of 3 and 6 p.m. The national perspective of America After 3PM paints a broad picture of how children are spending their time during the out-of-school hours and the needs of their parents. However, as unmet demand for afterschool programs continues to rise and the number of children alone and unsupervised in the hours after school remains high,1 a state-level assessment is important to identify where the greatest progress is being made in afterschool program participation rates and gain a better understanding of the factors that contribute to increased participation in afterschool programs.
Elements such as the rate of participation in afterschool programs, the number of children alone and unsupervised after school, and parental satisfaction with afterschool programs vary from state to state, however identifying the top 10 states for afterschool allows one to take a closer look at what steps these states have taken to ensure that more children and families have access to quality afterschool programs.
A composite score was calculated for all 50 states, plus the District of Columbia, and indexed against the national average to determine the top 10 states for afterschool. Each state’s overall score is based on similar variables used to identify the 2009 top 10 states, and includes afterschool program participation, afterschool programs reaching children in need and parents’ satisfaction with key features of their afterschool program:
• Percent of children in an afterschool program weighted by the average number of hours per week each child spends in an afterschool program.
• Percent of afterschool program participants who are low-income.2
• Percent of children not in self-care.
• Percent of parents, overall, who agree that afterschool programs in their area provide a high quality of care.3
• Percent of parents with a child in an afterschool program who are extremely satisfied with their program overall.
• Percent of parents with a child in an afterschool program who are satisfied with their afterschool program’s quality of care.*
• Percent of parents with a child in an afterschool program who are satisfied with their afterschool program’s variety of activities.*
• Percent of parents with a child in an afterschool program who are satisfied with the cost of their afterschool program.*
AMERICA
AFTER3PM
AMERICA AFTER 3PM1

Overall, states identified among the top 10 were those with high afterschool participation rates—combined with time spent in an afterschool program, low rates of unsupervised children after school and high rates of parent satisfaction with afterschool programs. A synopsis on each top 10 state is included, as well as details on state-specific afterschool policy developments, federal and state funding streams for afterschool programs, and partnerships and systems in place that have helped to create an ecosystem conducive to the spread and cultivation of afterschool opportunities for children and families. For instance, 8 of the top 10 states—with support from the Charles Stewart Mott Foundation—have established a statewide afterschool network composed of organizations committed to supporting and growing quality afterschool programs in their states. In addition, nearly all of the top 10 states include cities that are focused on building quality afterschool systems at the local level, including four states (D.C., Fla., Mass. and Tenn.) with city systems supported in part by The Wallace Foundation.
Each state on the top 10 list is at the forefront of transforming the hours between 3 and 6 p.m. into a time of learning, exploration and growth for the children in their communities. However, in the U.S., including in the top 10 states, there remains more than 19 million children who would be enrolled in an afterschool program if one were available to them. To ensure that afterschool programs are available and accessible to all children and families, regardless of income level or location, would require a concerted effort on the part of federal, state and local policy makers; the philanthropic community; educators; advocates; and families. Over the past 10 years, the nation has made progress creating more opportunities for children to take advantage of the supports and benefits afterschool programs have to offer. Following the lead of the top 10 states for afterschool, we can turn the goal of afterschool for all into a reality.
1 The 2014 America After 3PM edition found that approximately 19.4 million children (41 percent) not currently in an afterschool program would be enrolled in a program if one were available to them, according to their parents. This is an increase from 18.5 million children (38 percent) in 2009 and 15.3 million children (30 percent) in 2004. Additionally, America After 3PM found that there are approximately 11.3 million children (20 percent) without supervision between the hours of 3 and 6 p.m.
2 The proxy for this variable is children that qualify for the Federal Free or Reduced Price Lunch Program.
3 In 2009, this variable was the percent of parents overall who agree that “afterschool programs are available in my area.”
* In 2009, these features were determined to be the most influential based on a regression analysis. To show comparisons between 2014 and 2009, the variables were kept as similar as possible and included in the 2014 calculation.
AMERICA AFTER 3PM2

California
California has secured the number one spot in the top 10 states for afterschool, moving up from fourth in 2009. The state’s afterschool program participation rate has surged over the past five years, increasing 6 percentage points from 2009 and serving more than 377,000 additional students across California. Although the average number of hours children in California spend in afterschool programs per week decreased slightly from 2009, the state is still among the top 10 states in this category. California also saw significant increases in parent satisfaction with their afterschool programs from 2009: parent satisfaction with program cost increased 14 points (80 percent in 2014 vs. 66 percent in 2009), parent satisfaction with the variety of their afterschool program’s activities increased 12 points (86 percent in 2014 vs. 74 percent in 2009) and parent satisfaction with their afterschool program’s quality of care increased 9 points (92 percent in 2014 vs. 83 percent in 2009).
California’s afterschool participation rate above the national average may be due to significant state funding dedicated specifically to expanding the availability of afterschool programs. In 2006, a voter approved ballot initiative began an annual investment of $550 million for California’s After School Education and Safety (ASES) program. ASES programs provide an academically enriching environment for children in kindergarten through ninth grade during the afterschool hours through partnerships between schools and local communities, where every three dollars of state investment requires a local match of one dollar.
The state also ensures afterschool programs for high school students, reserving half of California’s 21st Century Community Learning Centers (21st CCLC) federal funding, which totaled $125 million in 2014, for the High School After School Education and Safety for Teens (ASSETs) program. In addition, numerous city-level efforts—including those in Los Angeles, the San Francisco Bay Area and Oakland—are helping to ensure greater access to quality afterschool programs. More than 2 in 5 California schools (44 percent) offer a state- and federally-funded afterschool program, and these schools serve nearly double the average number of students eligible for free or reduced price meals when compared to schools without an afterschool program. California schools with an expanded learning program have an average of 82 percent of students eligible for the free or reduced price meals, compared to an average of 44 percent of students in schools without programs.
1
California’s children during the after school hours
Children in an afterschool program
Low-income children participating in an afterschool program
Average time a child spends in an afterschool program per week
Children in self-care
25%RANK: 3
47%RANK: 14
8 hoursRANK: 9
19%RANK: 37
19% 2009 CA 38% 2009 CA 9.29 2009 CA 24% 2009 CA
18% 2014 National 45% 2014 National 7.37 2014 National 20% 2014 National
AMERICA AFTER 3PM3

Quality of California’s afterschool programs
Parents extremely satisfied with their afterschool program overall
Parents satisfied with their afterschool program’s quality of care
Parents satisfied with their afterschool program’s variety of activities
Parents satisfied with the cost of their afterschool program
Parents agree that afterschool programs in their area provide a high quality of care
47%RANK: 39
92%RANK: 10
86%RANK: 10
80%RANK: 16
66%RANK: 1
53% 2009 CA 83% 2009 CA 74% 2009 CA 66% 2009 CA 59% 2009 CA
50% 2014 National 88% 2014 National 80% 2014 National 75% 2014 National 50% 2014 National
California has also placed an emphasis on the quality of the state’s afterschool programs, creating the California Department of Education After School Division (After School Division) in late 2011 tasked with developing and implementing a strategic plan to build on the state’s expanded learning investments. The California AfterSchool Network’s Quality Committee Work Group and the After School Division developed new quality standards for expanded learning programs that underlie the strategic plan. These standards are just one example of the California AfterSchool Network’s efforts to advance quality afterschool opportunities across the state.
Despite California’s number one ranking, there is still significant unmet need for afterschool programs in the state. Half of all children not enrolled in an afterschool program would be enrolled in one if a program were available to them.
AMERICA AFTER 3PM4

District of Columbia
The District of Columbia comes in at the number two spot in its first appearance in America After 3PM. This is the first year America After 3PM has collected data on the District of Columbia, and its position on the top 10 list is driven primarily by the percentage of D.C.’s children that participate in afterschool programs and the hours that they spend in those programs. However, there remain a significant number of children who are not able to take advantage of the opportunities afterschool programs have to offer. Although D.C. ranks first in the nation for the percent of children participating in an afterschool program, it has one of the highest percentages of children alone and unsupervised in the hours after school, as well as the highest unmet demand, where 2 in 3 children (66 percent) in D.C. not enrolled in an afterschool program would be enrolled if one were available to them.
The District of Columbia has continuously worked to rebuild investments in afterschool programs—which dropped from more than $11 million in afterschool program funding for D.C. Public Schools (DCPS) in 2011 to approximately $7 million in 2013. The close collaboration of the D.C. Alliance of Youth Advocates and the D.C. Children and Youth Investment Trust Corporation has helped to increase afterschool program funding by raising awareness of the impact of afterschool programs for children and families, facilitating coordination between government agencies and community partners, and nurturing the quality and capacity of providers. In 2015, more than $8 million will be made available to
2
District of Columbia’s children during the afterschool hours
Children in an afterschool program
Low-income children participating in an afterschool program
Average time a child spends in an afterschool program per week
Children in self-care
35%RANK: 1
20%RANK: 49
8.98 hoursRANK: 4
26%RANK: 2
N/A 2009 DC N/A 2009 DC N/A 2009 DC N/A 2009 DC
18% 2014 National 45% 2014 National 7.37 2014 National 20% 2014 National
Quality of District of Columbia’s afterschool programs
Parents extremely satisfied with their afterschool program overall
Parents satisfied with their afterschool program’s quality of care
Parents satisfied with their afterschool program’s variety of activities
Parents satisfied with the cost of their afterschool program
Parents agree that afterschool programs in their area provide a high quality of care
34%RANK: 50
95%RANK: 5
55%RANK: 51
45%RANK: 51
53%RANK: 8
N/A 2009 DC N/A 2009 DC N/A 2009 DC N/A 2009 DC N/A 2009 DC
50% 2014 National 88% 2014 National 80% 2014 National 75% 2014 National 50% 2014 National
AMERICA AFTER 3PM5

DCPS for afterschool and summer programming. This funding complements a $1 million investment in the Community Schools Initiative and $3 million in funding to the D.C. Children and Youth Investment Trust Corporation—which manages grants to community-based organizations providing afterschool programming—along with the $5.6 million in 21st Century Community Learning Center funding that D.C. received in 2014. In addition to public funding, D.C. has also been bolstered by The Wallace Foundation’s early support for the city’s systems building work from 2005 through 2010, as well as a local philanthropic community that is committed to enriching the lives of thousands of D.C. youth during non-school hours through investments in a robust network of high-quality youth serving organizations.
AMERICA AFTER 3PM6
Florida
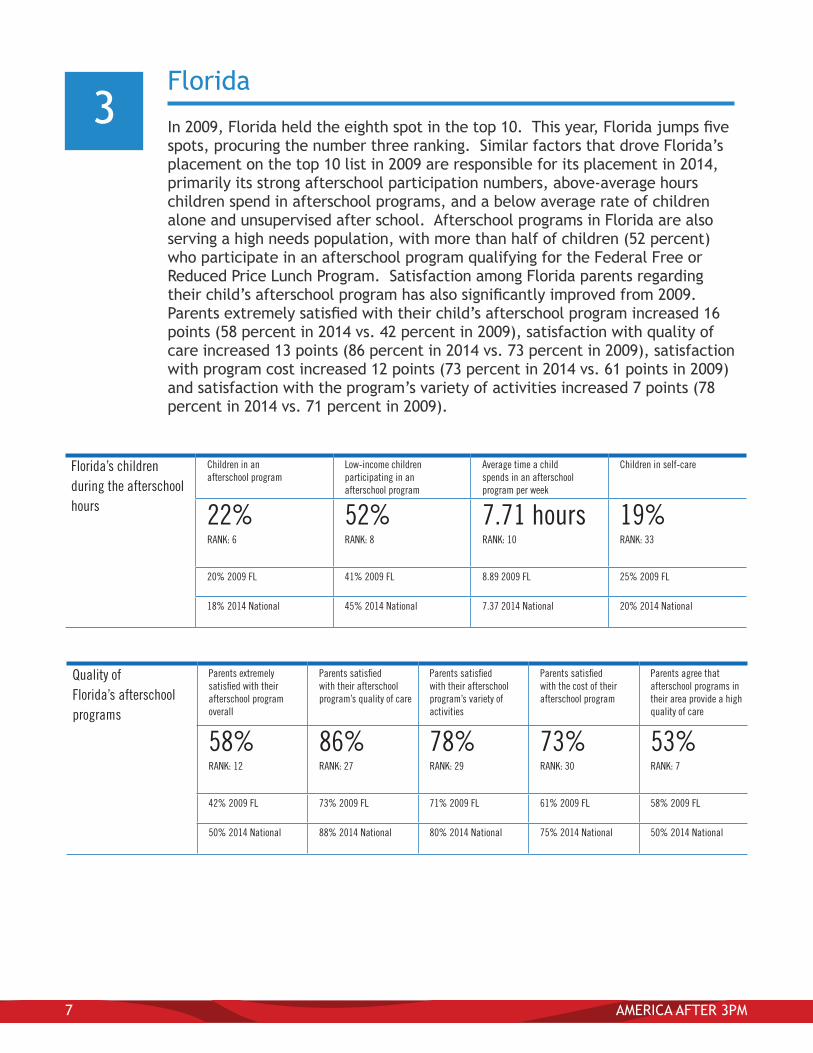
In 2009, Florida held the eighth spot in the top 10. This year, Florida jumps five spots, procuring the number three ranking. Similar factors that drove Florida’s placement on the top 10 list in 2009 are responsible for its placement in 2014, primarily its strong afterschool participation numbers, above-average hours children spend in afterschool programs, and a below average rate of children alone and unsupervised after school. Afterschool programs in Florida are also serving a high needs population, with more than half of children (52 percent) who participate in an afterschool program qualifying for the Federal Free or Reduced Price Lunch Program. Satisfaction among Florida parents regarding their child’s afterschool program has also significantly improved from 2009. Parents extremely satisfied with their child’s afterschool program increased 16 points (58 percent in 2014 vs. 42 percent in 2009), satisfaction with quality of care increased 13 points (86 percent in 2014 vs. 73 percent in 2009), satisfaction with program cost increased 12 points (73 percent in 2014 vs. 61 points in 2009) and satisfaction with the program’s variety of activities increased 7 points (78 percent in 2014 vs. 71 percent in 2009).
3
Florida’s children during the afterschool hours
Children in an afterschool program
Low-income children participating in an afterschool program
Average time a child spends in an afterschool program per week
Children in self-care
22%RANK: 6
52%RANK: 8
7.71 hoursRANK: 10
19%RANK: 33
20% 2009 FL 41% 2009 FL 8.89 2009 FL 25% 2009 FL
18% 2014 National 45% 2014 National 7.37 2014 National 20% 2014 National
Quality of Florida’s afterschool programs
Parents extremely satisfied with their afterschool program overall
Parents satisfied with their afterschool program’s quality of care
Parents satisfied with their afterschool program’s variety of activities
Parents satisfied with the cost of their afterschool program
Parents agree that afterschool programs in their area provide a high quality of care
58%RANK: 12
86%RANK: 27
78%RANK: 29
73%RANK: 30
53%RANK: 7
42% 2009 FL 73% 2009 FL 71% 2009 FL 61% 2009 FL 58% 2009 FL
50% 2014 National 88% 2014 National 80% 2014 National 75% 2014 National 50% 2014 National
AMERICA AFTER 3PM7

Florida has a unique resource to supplement the $59.7 million in federal funding from the 21st Century Community Learning Centers initiative in 2014 and further support the sustainability of afterschool programs in the state: the Children’s Services Councils (CSCs). The CSCs—located in eight counties and representing close to 60 percent of students in Miami-Dade, Broward, Palm Beach, Martin, St. Lucie, Duval, Pinellas and Hillsborough counties—are government entities established by county citizens to help fund local organizations that provide services to children and families. CSCs provide support for quality afterschool programming and enable afterschool programs to offer their services at either no-cost or a low-cost to Florida families. Additionally, there are burgeoning afterschool systems within the state that are helping to coordinate, grow and improve quality among Florida’s afterschool programs. Jacksonville and Tampa were highlighted by the National League of Cities (NLC) as among the 27 cities that are most advanced in creating citywide afterschool approaches. For example, NLC’s report, “Municipal Leadership for Afterschool,” found that both Jacksonville and Tampa have “well-developed mechanisms to manage a large group of afterschool providers and facilitate action on multiple system-building elements.”i In addition, the Florida Afterschool Network is working to advance the availability of quality afterschool programs across the state, in partnership with state and local funders and providers, to better meet the needs of children and families.
AMERICA AFTER 3PM8

Vermont
Vermont is 1 of 6 states new to the top 10 list in 2014. A strong afterschool participation number and an increase in the average time children spend in afterschool programs are contributing factors to Vermont’s fourth-place ranking. Strong parent satisfaction with their child’s afterschool program overall, the quality of care, and program cost are also drivers of Vermont’s entry into the top 10. The state has made progress in the area of parent satisfaction; parents satisfied with their program’s quality of care increased from 84 percent in 2009 to 89 percent in 2014 and satisfaction with the cost of their afterschool program increased from 82 percent in 2009 to 88 percent in 2014.
Afterschool programs in Vermont—funded through a variety of sources, including $5.6 million in federal 21st Century Community Learning Centers funding in 2014 and more than $1 million in local school budget funding—benefit from the collaborative efforts of the Vermont Agency of Education and the Vermont Agency of Human Services, Department for Children and Families. Often with leadership and support from Vermont Afterschool, the statewide afterschool network, these agencies work together on a number of key initiatives to support program quality, including the use of a common statewide program quality assessment tool and funding for a wide variety of professional development—ranging from staff trainings and a statewide afterschool conference to an extensive, in-depth coaching model for program improvement. In Burlington, Vermont’s largest city, the Burlington Citywide Afterschool Coalition is another afterschool partnership serving as a source of support for program quality citywide.
4
Vermont’s children during the afterschool hours
Children in an afterschool program
Low-income children participating in an afterschool program
Average time a child spends in an afterschool program per week
Children in self-care
24%RANK: 4
14%RANK: 51
7.51 hoursRANK: 14
24%RANK: 5
20% 2009 VT 22% 2009 VT 4.47 2009 VT 41% 2009 VT
18% 2014 National 45% 2014 National 7.37 2014 National 20% 2014 National
Quality of Vermont’s afterschool programs
Parents extremely satisfied with their afterschool program overall
Parents satisfied with their afterschool program’s quality of care
Parents satisfied with their afterschool program’s variety of activities
Parents satisfied with the cost of their afterschool program
Parents agree that afterschool programs in their area provide a high quality of care
61%RANK: 8
89%RANK: 18
79%RANK: 27
88%RANK: 5
51%RANK: 13
66% 2009 VT 84% 2009 VT 85% 2009 VT 82% 2009 VT 60% 2009 VT
50% 2014 National 88% 2014 National 80% 2014 National 75% 2014 National 50% 2014 National
AMERICA AFTER 3PM9

Since 2007, Vermont has had statewide “Core Competencies for Afterschool Professionals” in place, which serve as the foundation for the afterschool field’s professional development system and a tool to guide and strengthen standards of practice. The state has taken added measures to help ensure high program quality, like specific licensing regulations for school-age afterschool programs; bonuses for individuals earning the Vermont Afterschool Professional Credential, which includes college coursework specific to afterschool; and a designated seat for afterschool on the PreK-16 Council, Vermont’s statewide education think tank. The state continues to focus on making sure that all children and youth can participate in quality afterschool programs. In 2014, the Vermont Legislature called for a Working Group on Equity and Access in Expanded Learning Time charged with studying the issue and providing recommendations to the legislature by the end of the year.
AMERICA AFTER 3PM10
Massachusetts
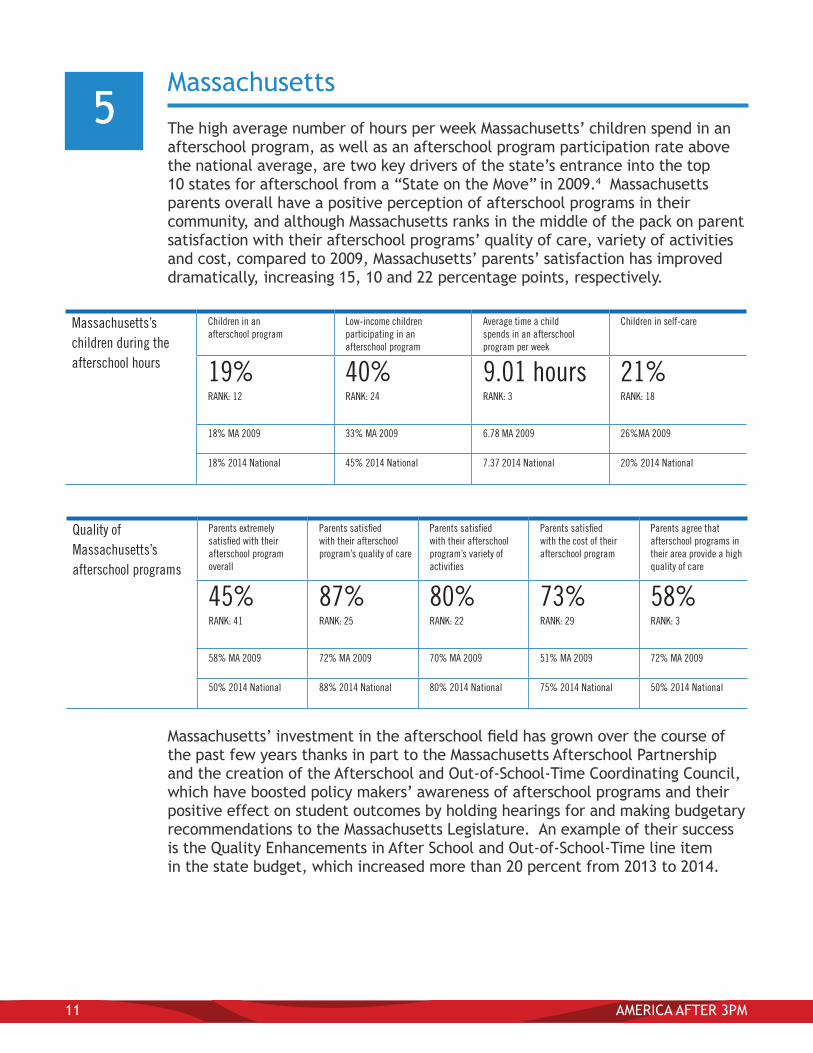
The high average number of hours per week Massachusetts’ children spend in an afterschool program, as well as an afterschool program participation rate above the national average, are two key drivers of the state’s entrance into the top 10 states for afterschool from a “State on the Move” in 2009.4 Massachusetts parents overall have a positive perception of afterschool programs in their community, and although Massachusetts ranks in the middle of the pack on parent satisfaction with their afterschool programs’ quality of care, variety of activities and cost, compared to 2009, Massachusetts’ parents’ satisfaction has improved dramatically, increasing 15, 10 and 22 percentage points, respectively.
Massachusetts’ investment in the afterschool field has grown over the course of the past few years thanks in part to the Massachusetts Afterschool Partnership and the creation of the Afterschool and Out-of-School-Time Coordinating Council, which have boosted policy makers’ awareness of afterschool programs and their positive effect on student outcomes by holding hearings for and making budgetary recommendations to the Massachusetts Legislature. An example of their success is the Quality Enhancements in After School and Out-of-School-Time line item in the state budget, which increased more than 20 percent from 2013 to 2014.
5
Massachusetts’s children during the afterschool hours
Children in an afterschool program
Low-income children participating in an afterschool program
Average time a child spends in an afterschool program per week
Children in self-care
19%RANK: 12
40%RANK: 24
9.01 hoursRANK: 3
21%RANK: 18
18% MA 2009 33% MA 2009 6.78 MA 2009 26%MA 2009
18% 2014 National 45% 2014 National 7.37 2014 National 20% 2014 National
Quality of Massachusetts’s afterschool programs
Parents extremely satisfied with their afterschool program overall
Parents satisfied with their afterschool program’s quality of care
Parents satisfied with their afterschool program’s variety of activities
Parents satisfied with the cost of their afterschool program
Parents agree that afterschool programs in their area provide a high quality of care
45%RANK: 41
87%RANK: 25
80%RANK: 22
73%RANK: 29
58%RANK: 3
58% MA 2009 72% MA 2009 70% MA 2009 51% MA 2009 72% MA 2009
50% 2014 National 88% 2014 National 80% 2014 National 75% 2014 National 50% 2014 National
AMERICA AFTER 3PM11
The 2015 budget included $15 million aimed at reducing Massachusetts’ income eligible waitlist for child care; $6.57 million for salaries, benefits and professional development for early education and out-of-school-time educators; as well as an increase in funding for Gov. Deval Patrick’s Gateway Cities Education Agenda. In 2014, the Gateway Cities Education Agenda received $3 million to support career and enrichment academies for English language learners out of school, including after school and during the summer, as well as additional targeted support to students. Massachusetts also continued strong levels of funding for youth violence prevention grants and a robust summer jobs program for at-risk youth. These state investments supplement the 2014 federal funding of $16.8 million for 21st Century Community Learning Centers in Massachusetts and local investments in afterschool systems, such as Boston AfterSchool & Beyond.4. In the 2009 edition of America After 3PM, Minnesota, Washington, Maryland, Oregon, Massachusetts and Ohio were
identified as “States on the Move” based on calculations examining gains in afterschool program participation and decreases in the percentage of children unsupervised after school between 2004 and 2009.
AMERICA AFTER 3PM12

Arizona
The exceptionally high number of parents who report satisfaction with various aspects of their child’s afterschool program drive Arizona’s number six ranking. Arizona parents that report they are extremely satisfied with their child’s afterschool program overall in 2014 was close to double that in 2009. Similar to 2009, Arizona parents report being satisfied with their afterschool program’s quality of care, variety of activities, and cost. More than 9 in 10 Arizona parents agreed that they were satisfied with the quality of care (95 percent) and the variety of activities (91 percent) their child’s afterschool program provides. While parent satisfaction with afterschool programs increased, the average number of hours children spend in afterschool programs in Arizona dropped significantly, from more than 11 hours in 2009 to 6.79 hours in 2014.
Improving program quality has been a focal point in Arizona in recent years. The Arizona Center for Afterschool Excellence (AzCASE) and Valley of the Sun United Way (VSUW) convened a statewide committee of afterschool stakeholders in 2012—including afterschool program providers, state agencies, policy makers, schools and philanthropic organizations—to discuss the needs of Arizona’s youth and develop standards for afterschool programs. The committee developed and released the “Arizona Quality Standards for Out-of-School Time Programs” in October 2013. To date, more than 400 afterschool providers have committed to use the standards to strengthen the quality of their programs. The quality standards are the first in a three-part continuous quality improvement strategy. A quality assessment tool is due to be adopted in late 2014 and will be followed by the development of a comprehensive professional development system. In 2014, Arizona received $25 million in federal funding for 21st Century Community Learning Centers grants, which helps to fund more than 300 afterschool programs. In addition, local support for quality programming is increasing, with Phoenix, Tempe, Tucson and Flagstaff all making significant investments in quality afterschool programs in their communities.
6
Arizona’s children during the afterschool hours
Children in an afterschool program
Low-income children participating in an afterschool program
Average time a child spends in an afterschool program per week
Children in self-care
16%RANK: 27
53%RANK: 5
6.79 hoursRANK: 32
19%RANK: 28
16% 2009 AZ 26% 2009 AZ 11.02% 2009 AZ 22% 2009 AZ
18% 2014 National 45% 2014 National 7.37 2014 National 20% 2014 National
AMERICA AFTER 3PM13

Quality of Arizona’s afterschool programs
Parents extremely satisfied with their afterschool program overall
Parents satisfied with their afterschool program’s quality of care
Parents satisfied with their afterschool program’s variety of activities
Parents satisfied with the cost of their afterschool program
Parents agree that afterschool programs in their area provide a high quality of care
67%RANK: 3
95%RANK: 3
91%RANK: 3
87%RANK: 7
43%RANK: 31
35% 2009 AZ 89% 2009 AZ 88% 2009 AZ 79% 2009 AZ 57% 2009 AZ
50% 2014 National 88% 2014 National 80% 2014 National 75% 2014 National 50% 2014 National
AMERICA AFTER 3PM14
Oregon
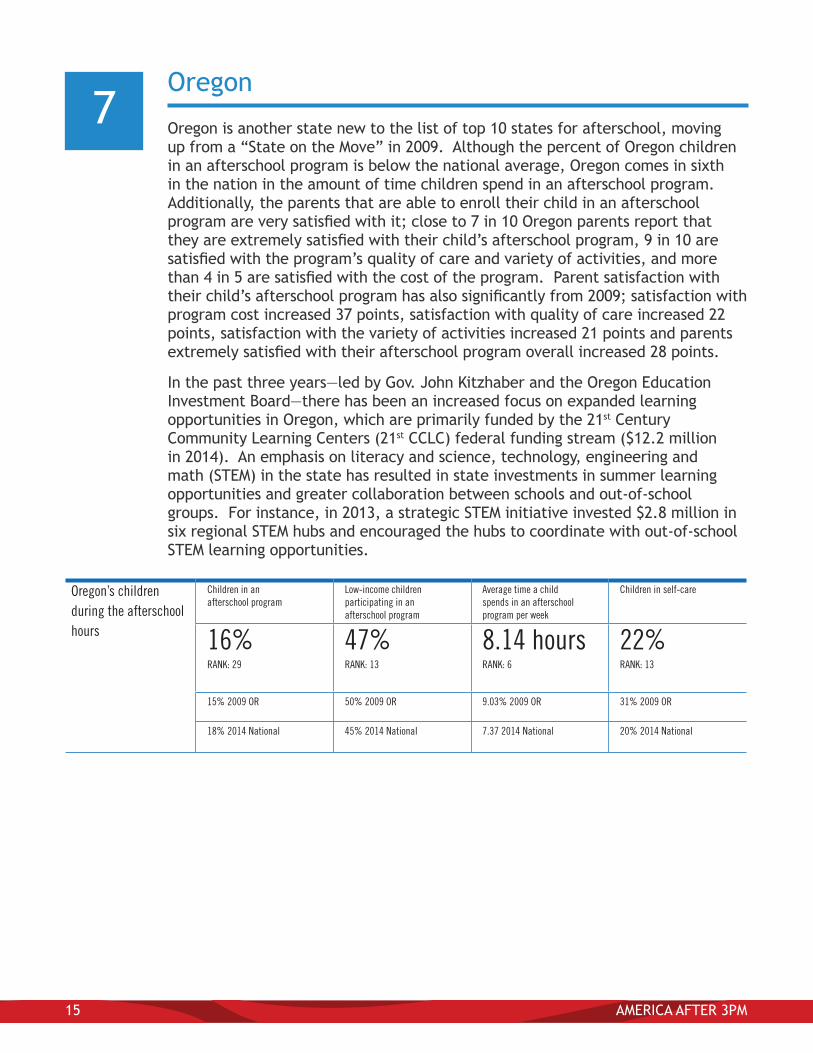
Oregon is another state new to the list of top 10 states for afterschool, moving up from a “State on the Move” in 2009. Although the percent of Oregon children in an afterschool program is below the national average, Oregon comes in sixth in the nation in the amount of time children spend in an afterschool program. Additionally, the parents that are able to enroll their child in an afterschool program are very satisfied with it; close to 7 in 10 Oregon parents report that they are extremely satisfied with their child’s afterschool program, 9 in 10 are satisfied with the program’s quality of care and variety of activities, and more than 4 in 5 are satisfied with the cost of the program. Parent satisfaction with their child’s afterschool program has also significantly from 2009; satisfaction with program cost increased 37 points, satisfaction with quality of care increased 22 points, satisfaction with the variety of activities increased 21 points and parents extremely satisfied with their afterschool program overall increased 28 points.
In the past three years—led by Gov. John Kitzhaber and the Oregon Education Investment Board—there has been an increased focus on expanded learning opportunities in Oregon, which are primarily funded by the 21st Century Community Learning Centers (21st CCLC) federal funding stream ($12.2 million in 2014). An emphasis on literacy and science, technology, engineering and math (STEM) in the state has resulted in state investments in summer learning opportunities and greater collaboration between schools and out-of-school groups. For instance, in 2013, a strategic STEM initiative invested $2.8 million in six regional STEM hubs and encouraged the hubs to coordinate with out-of-school STEM learning opportunities.
7
Oregon’s children during the afterschool hours
Children in an afterschool program
Low-income children participating in an afterschool program
Average time a child spends in an afterschool program per week
Children in self-care
16%RANK: 29
47%RANK: 13
8.14 hoursRANK: 6
22%RANK: 13
15% 2009 OR 50% 2009 OR 9.03% 2009 OR 31% 2009 OR
18% 2014 National 45% 2014 National 7.37 2014 National 20% 2014 National
AMERICA AFTER 3PM15

Program quality and staff development are supported by OregonASK, the statewide afterschool network. OregonASK provides training and technical assistance to some of Oregon’s 21st CCLC programs, hosts an annual conference for afterschool professionals and experts, and in 2012 with the help of the OregonASK Steering Committee and stakeholder organizations, revised “Oregon’s Quality Standards for Afterschool and Summer Programs”—a framework of standards, competencies and outcomes originally developed in 2006. With funding from the Oregon Office of Child Care, OregonASK also provides technical assistance to the school-age licensed programs that are currently in the process of acquiring Oregon’s Quality Rating and Improvement System (QRIS) status, working on revisions to Oregon’s school-age rules and providing content specific training. Additionally during the last three years, OregonASK has partnered with the National Summer Learning Association, the Oregon State Library, and the Oregon Department of Education’s Child Nutrition program to develop a collective state impact framework to reduce summer learning loss. OregonASK is currently in the process of field testing an elementary health and wellness curriculum as well as building program safety support systems—creating and implementing emergency preparedness plans, and safety policies and procedures. These quality efforts are paying off for the families who are able to participate in programs, but much work remains to be done to help ensure greater access to quality afterschool opportunities across the state.
Quality of Oregon’s afterschool programs
Parents extremely satisfied with their afterschool program overall
Parents satisfied with their afterschool program’s quality of care
Parents satisfied with their afterschool program’s variety of activities
Parents satisfied with the cost of their afterschool program
Parents agree that afterschool programs in their area provide a high quality of care
68%RANK: 2
90%RANK: 14
90%RANK: 4
84%RANK: 9
41%RANK: 37
40% 2009 OR 68% 2009 OR 69% 2009 OR 47% 2009 OR 48% 2009 OR
50% 2014 National 88% 2014 National 80% 2014 National 75% 2014 National 50% 2014 National
AMERICA AFTER 3PM16
Nebraska
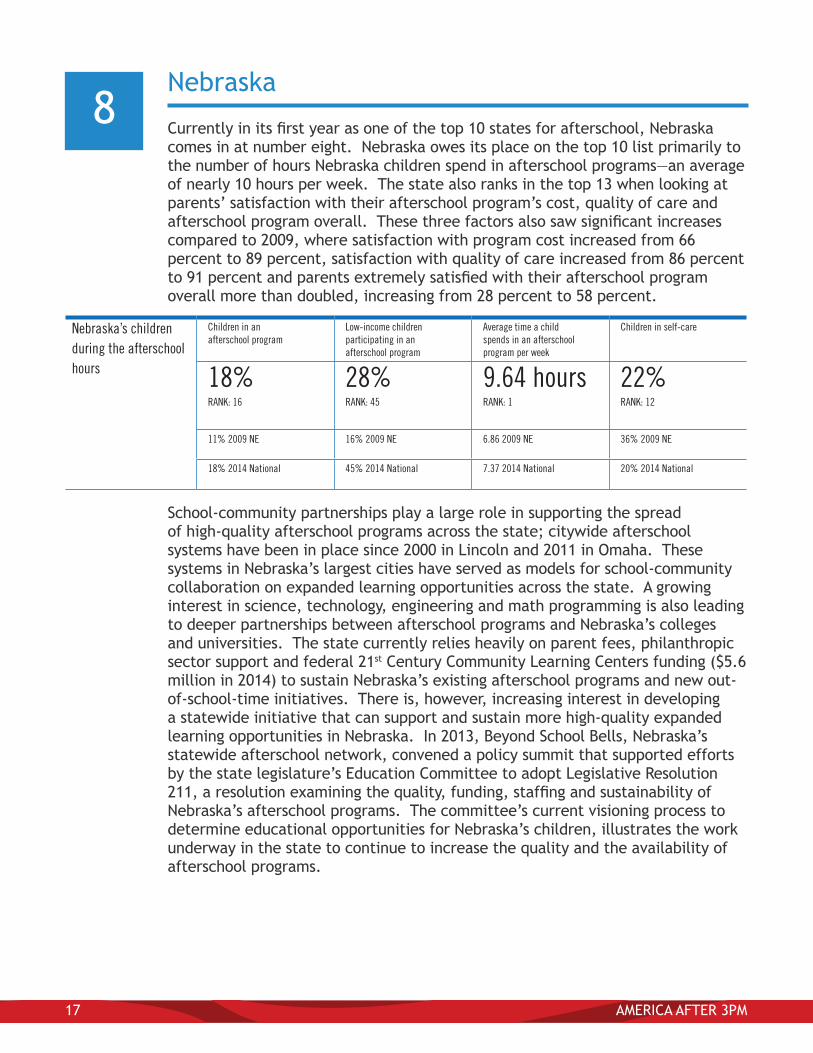
Currently in its first year as one of the top 10 states for afterschool, Nebraska comes in at number eight. Nebraska owes its place on the top 10 list primarily to the number of hours Nebraska children spend in afterschool programs—an average of nearly 10 hours per week. The state also ranks in the top 13 when looking at parents’ satisfaction with their afterschool program’s cost, quality of care and afterschool program overall. These three factors also saw significant increases compared to 2009, where satisfaction with program cost increased from 66 percent to 89 percent, satisfaction with quality of care increased from 86 percent to 91 percent and parents extremely satisfied with their afterschool program overall more than doubled, increasing from 28 percent to 58 percent.
School-community partnerships play a large role in supporting the spread of high-quality afterschool programs across the state; citywide afterschool systems have been in place since 2000 in Lincoln and 2011 in Omaha. These systems in Nebraska’s largest cities have served as models for school-community collaboration on expanded learning opportunities across the state. A growing interest in science, technology, engineering and math programming is also leading to deeper partnerships between afterschool programs and Nebraska’s colleges and universities. The state currently relies heavily on parent fees, philanthropic sector support and federal 21st Century Community Learning Centers funding ($5.6 million in 2014) to sustain Nebraska’s existing afterschool programs and new out-of-school-time initiatives. There is, however, increasing interest in developing a statewide initiative that can support and sustain more high-quality expanded learning opportunities in Nebraska. In 2013, Beyond School Bells, Nebraska’s statewide afterschool network, convened a policy summit that supported efforts by the state legislature’s Education Committee to adopt Legislative Resolution 211, a resolution examining the quality, funding, staffing and sustainability of Nebraska’s afterschool programs. The committee’s current visioning process to determine educational opportunities for Nebraska’s children, illustrates the work underway in the state to continue to increase the quality and the availability of afterschool programs.
8
Nebraska’s children during the afterschool hours
Children in an afterschool program
Low-income children participating in an afterschool program
Average time a child spends in an afterschool program per week
Children in self-care
18%RANK: 16
28%RANK: 45
9.64 hoursRANK: 1
22%RANK: 12
11% 2009 NE 16% 2009 NE 6.86 2009 NE 36% 2009 NE
18% 2014 National 45% 2014 National 7.37 2014 National 20% 2014 National
AMERICA AFTER 3PM17
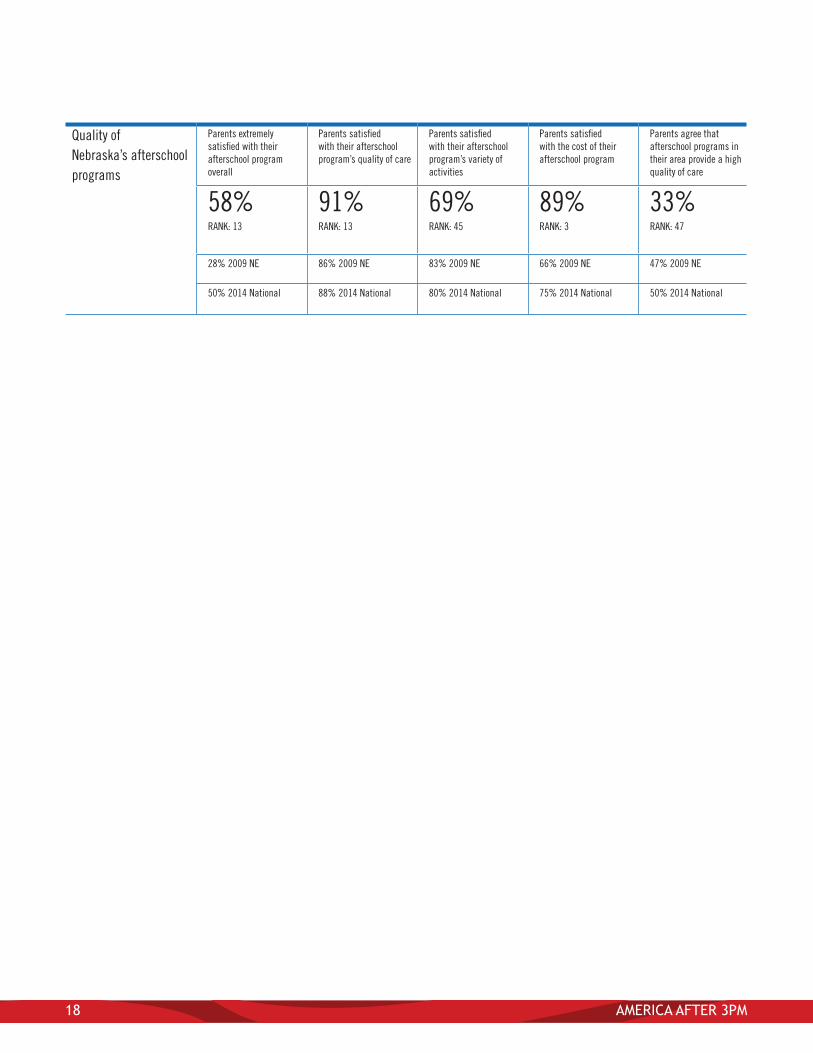
Quality of Nebraska’s afterschool programs
Parents extremely satisfied with their afterschool program overall
Parents satisfied with their afterschool program’s quality of care
Parents satisfied with their afterschool program’s variety of activities
Parents satisfied with the cost of their afterschool program
Parents agree that afterschool programs in their area provide a high quality of care
58%RANK: 13
91%RANK: 13
69%RANK: 45
89%RANK: 3
33%RANK: 47
28% 2009 NE 86% 2009 NE 83% 2009 NE 66% 2009 NE 47% 2009 NE
50% 2014 National 88% 2014 National 80% 2014 National 75% 2014 National 50% 2014 National
AMERICA AFTER 3PM18
Tennessee
This is Tennessee’s first year in the top 10, with its entry driven by the high percentage of high-needs students served by afterschool programs. More than half of Tennessee’s children in afterschool programs qualify for the Federal Free or Reduced Price Lunch Program. The low percentage of children unsupervised after school, as well as the high number of parents extremely satisfied with their afterschool program overall, are additional factors contributing to Tennessee’s number nine ranking. While parent satisfaction regarding quality of care, variety of activities and cost only ranks in the top 20, there are significant increases in satisfaction in all three areas when comparing the answers to 2009, jumping 25, 25 and 16 percentage points, respectively. The percentage of children participating in afterschool programs in Tennessee increased 5 percentage points from 2009 to 2014, however, the state remains in the middle of the pack regarding afterschool program participation.
Afterschool program quality improvements are spreading throughout the state at the municipal level. For example, in 2011 Nashville was identified by the National League of Cities as one of 27 cities most advanced in their coordination of afterschool programming for their work around the Nashville After Zone Alliance (NAZA), a network of afterschool program providers established under Mayor Karl Dean and supported in part by The Wallace Foundation. NAZA doubled the number of students participating in afterschool programs in the Nashville area between the 2010-2011 and 2011-2012 school years. By 2015, NAZA hopes to serve more than 1,000 students per year. At the state level, the Department of Education, with the input of a broad coalition of experts, produced the Tennessee School-Age Developmental Standards, which guide afterschool and child care providers regarding the continuum of developmental milestones for children and address the social-emotional, physical and cognitive aspects of the development of school-age children, as well as help inform choices related to activities, environment, program structure, staffing, materials and supplies.
9
Tennessee’s children during the afterschool hours
Children in an afterschool program
Low-income children participating in an afterschool program
Average time a child spends in an afterschool program per week
Children in self-care
18%RANK: 19
52%RANK: 10
7.24 hoursRANK: 20
17%RANK: 49
13% 2009 TN 41% 2009 TN 7.48 2009 TN 29% 2009 TN
18% 2014 National 45% 2014 National 7.37 2014 National 20% 2014 National
AMERICA AFTER 3PM19

The state places an emphasis on serving high-needs students. Established by a state constitutional amendment, Tennessee uses a portion of unclaimed state lottery winnings to fund high-quality programs for at-risk students—the Lottery for Education: Afterschool Programs (LEAPs). At least 50 percent of students in LEAPs qualify for the Federal Free or Reduced Price Lunch Program or are at-risk academically. For the 2014 LEAPs award cycle, more than $13.8 million was awarded to 79 agencies. These city- and state-level investments supplement federal 21st Century Community Learning Centers funding awarded to the state, most recently totaling $21.8 million in 2014.
Quality of Tennessee’s afterschool programs
Parents extremely satisfied with their afterschool program overall
Parents satisfied with their afterschool program’s quality of care
Parents satisfied with their afterschool program’s variety of activities
Parents satisfied with the cost of their afterschool program
Parents agree that afterschool programs in their area provide a high quality of care
66%RANK: 4
89%RANK: 16
80%RANK: 18
78%RANK: 19
42%RANK: 33
44% 2009 TN 64% 2009 TN 55% 2009 TN 62% 2009 TN 58% 2009 TN
50% 2014 National 88% 2014 National 80% 2014 National 75% 2014 National 50% 2014 National
AMERICA AFTER 3PM20
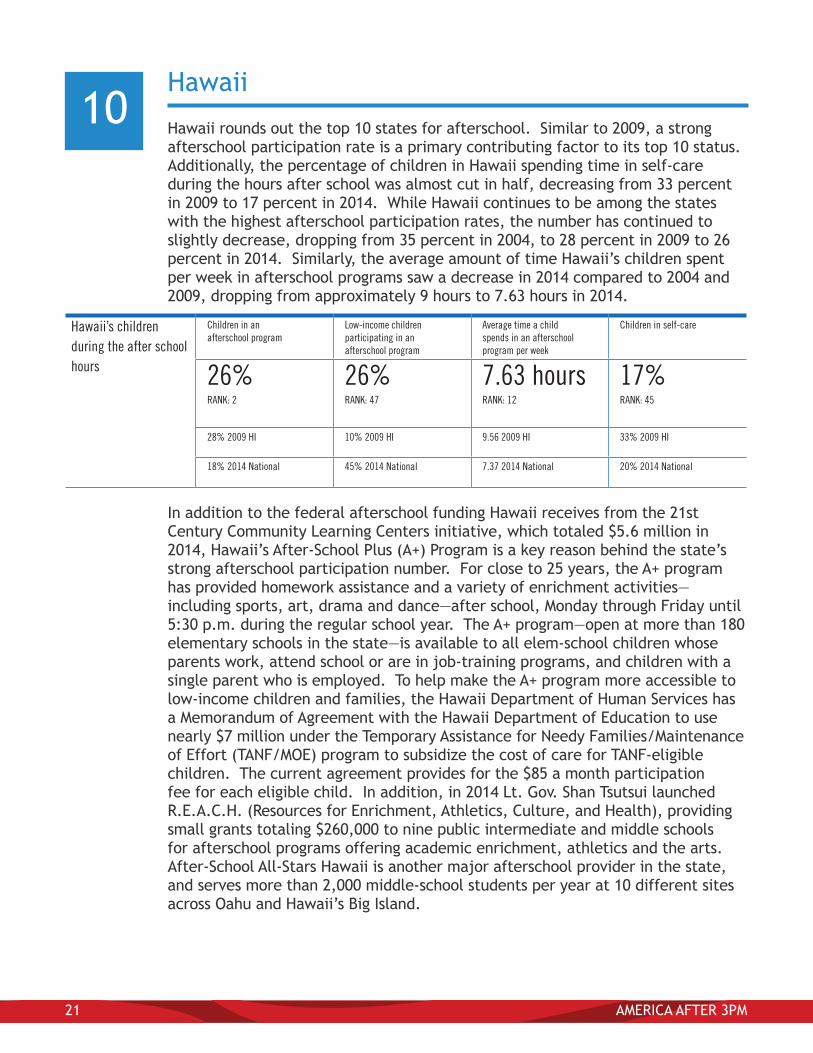
Hawaii
Hawaii rounds out the top 10 states for afterschool. Similar to 2009, a strong afterschool participation rate is a primary contributing factor to its top 10 status. Additionally, the percentage of children in Hawaii spending time in self-care during the hours after school was almost cut in half, decreasing from 33 percent in 2009 to 17 percent in 2014. While Hawaii continues to be among the states with the highest afterschool participation rates, the number has continued to slightly decrease, dropping from 35 percent in 2004, to 28 percent in 2009 to 26 percent in 2014. Similarly, the average amount of time Hawaii’s children spent per week in afterschool programs saw a decrease in 2014 compared to 2004 and 2009, dropping from approximately 9 hours to 7.63 hours in 2014.
In addition to the federal afterschool funding Hawaii receives from the 21st Century Community Learning Centers initiative, which totaled $5.6 million in 2014, Hawaii’s After-School Plus (A+) Program is a key reason behind the state’s strong afterschool participation number. For close to 25 years, the A+ program has provided homework assistance and a variety of enrichment activities—including sports, art, drama and dance—after school, Monday through Friday until 5:30 p.m. during the regular school year. The A+ program—open at more than 180 elementary schools in the state—is available to all elem-school children whose parents work, attend school or are in job-training programs, and children with a single parent who is employed. To help make the A+ program more accessible to low-income children and families, the Hawaii Department of Human Services has a Memorandum of Agreement with the Hawaii Department of Education to use nearly $7 million under the Temporary Assistance for Needy Families/Maintenance of Effort (TANF/MOE) program to subsidize the cost of care for TANF-eligible children. The current agreement provides for the $85 a month participation fee for each eligible child. In addition, in 2014 Lt. Gov. Shan Tsutsui launched R.E.A.C.H. (Resources for Enrichment, Athletics, Culture, and Health), providing small grants totaling $260,000 to nine public intermediate and middle schools for afterschool programs offering academic enrichment, athletics and the arts. After-School All-Stars Hawaii is another major afterschool provider in the state, and serves more than 2,000 middle-school students per year at 10 different sites across Oahu and Hawaii’s Big Island.
10
Hawaii’s children during the after school hours
Children in an afterschool program
Low-income children participating in an afterschool program
Average time a child spends in an afterschool program per week
Children in self-care
26%RANK: 2
26%RANK: 47
7.63 hoursRANK: 12
17%RANK: 45
28% 2009 HI 10% 2009 HI 9.56 2009 HI 33% 2009 HI
18% 2014 National 45% 2014 National 7.37 2014 National 20% 2014 National
AMERICA AFTER 3PM21

Quality of Hawaii’s afterschool programs
Parents extremely satisfied with their afterschool program overall
Parents satisfied with their afterschool program’s quality of care
Parents satisfied with their afterschool program’s variety of activities
Parents satisfied with the cost of their afterschool program
Parents agree that afterschool programs in their area provide a high quality of care
47%RANK: 38
79%RANK: 44
70%RANK: 44
70%RANK: 37
44%RANK: 29
52% 2009 HI 74% 2009 HI 72% 2009 HI 72% 2009 HI 59% 2009 HI
50% 2014 National 88% 2014 National 80% 2014 National 75% 2014 National 50% 2014 National
AMERICA AFTER 3PM22