TOOLS USED TO EXPRESS RELATIONSHIPS Schedules Graphs Equations.
24
TOOLS USED TO EXPRESS RELATIONSHIPS Schedules Graphs Equations
-
date post
21-Dec-2015 -
Category
Documents
-
view
214 -
download
0
Transcript of TOOLS USED TO EXPRESS RELATIONSHIPS Schedules Graphs Equations.

TOOLS USED TO EXPRESS RELATIONSHIPS
SchedulesGraphs
Equations

Schedule ( or Table)
Definition: a list of different
values of a variable and the value of a related variable
Price Quantity$2 204 156 108 5

Equation
Definition: a mathematical statement usually
involving dependent and independent variables.
Example: Qd = f(P)

Dependent variable: a variable that changes as the
controlled variable is changed
Independent variable: the controlled variable a variable that is not a function of the
equation and causes change in the dependent variable

Graph
Definition: a visual
representation of functional relationships or the movements of a variable over time.
Purpose to visualize the
relationship
P
D
Q

Constructing a Graph
Step 1: Number lineY
X00
Positive YNegative X
Positive YPositive X
Negative YNegative X
Negative YPositive X

Constructing a Graph
Step 1: Number line
0 5 10 15 20 25
NOT this…
Do this…
0 5 20 30 52 55 70 72

Constructing a Graph
Step 2: Label axis
Price
Quantity

Constructing a Graph
Step 2: Plot Points on graph
Price
Quantity
. . .

Constructing a Graph
Step 3: Connect Points on graph
Price
Quantity
. . .
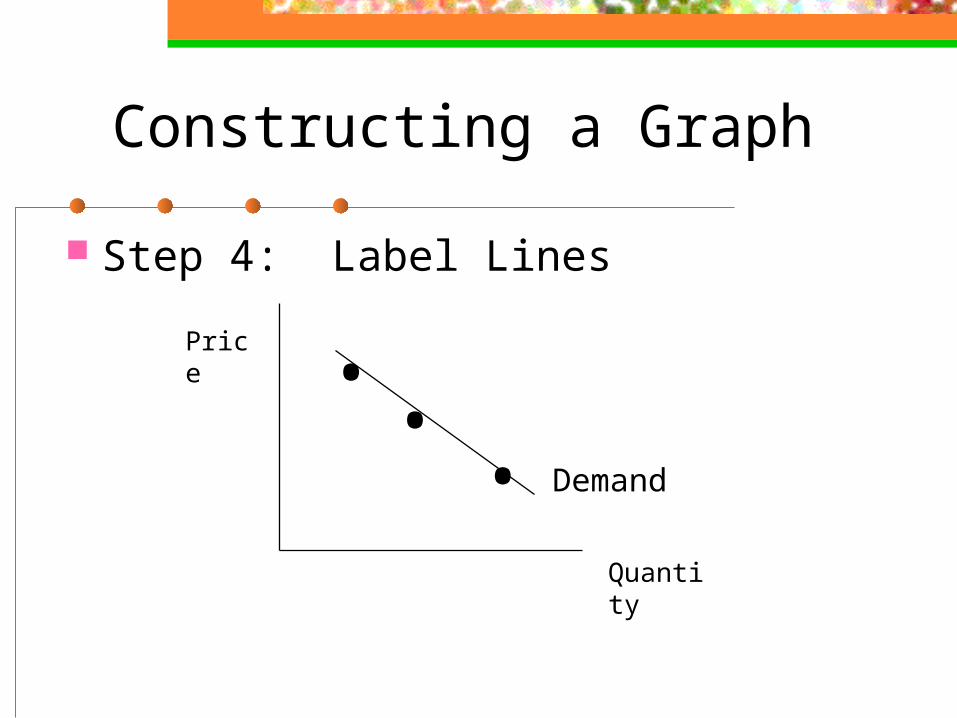
Constructing a Graph
Step 4: Label Lines
Price
Quantity
. . . Demand

Linear Relationships between Variables
Negative Relationship
also called:Inverse or Indirect
Relationship
as values of X change, values of Y change in the opposite direction
Y
X
Y = f(X)
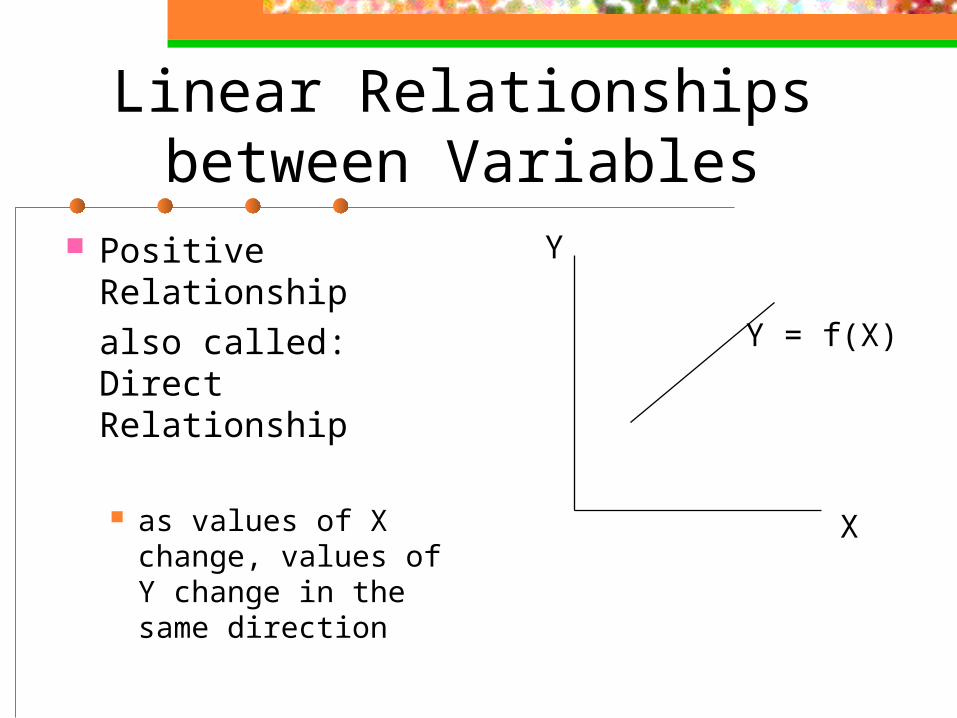
Linear Relationships between Variables
Positive Relationshipalso called:Direct Relationship
as values of X change, values of Y change in the same direction
Y
X
Y = f(X)

Measuring Linear Relationships
Slope measures how
strongly the dependent variable is influenced by the independent variable
FormulaSlope = Rise / Run
= Change in Y
Change in X

Measuring Linear Relationships
Negative lines have negative slopes
Positive lines have positive slopes
Straight lines have only one slope along the line.

Intercept:
the value of the dependent variable (Y) when the value of the independent variable (X) is zero
Y = f(X)
Y
X
intercept

Graphical Assumptions
Homogeneous Units each unit of the independent variable
(X) is identical
Divisibility each unit of the independent variable
can be divided infinitesimally

Nonlinear Relationships
Exhibit changing relationship between variables
Have more than one slope along the line
Y
X
Y = f(X)

Nonlinear relationships
At the minimum point the slope is equal to zero
At the maximum point the slope is equal to zero
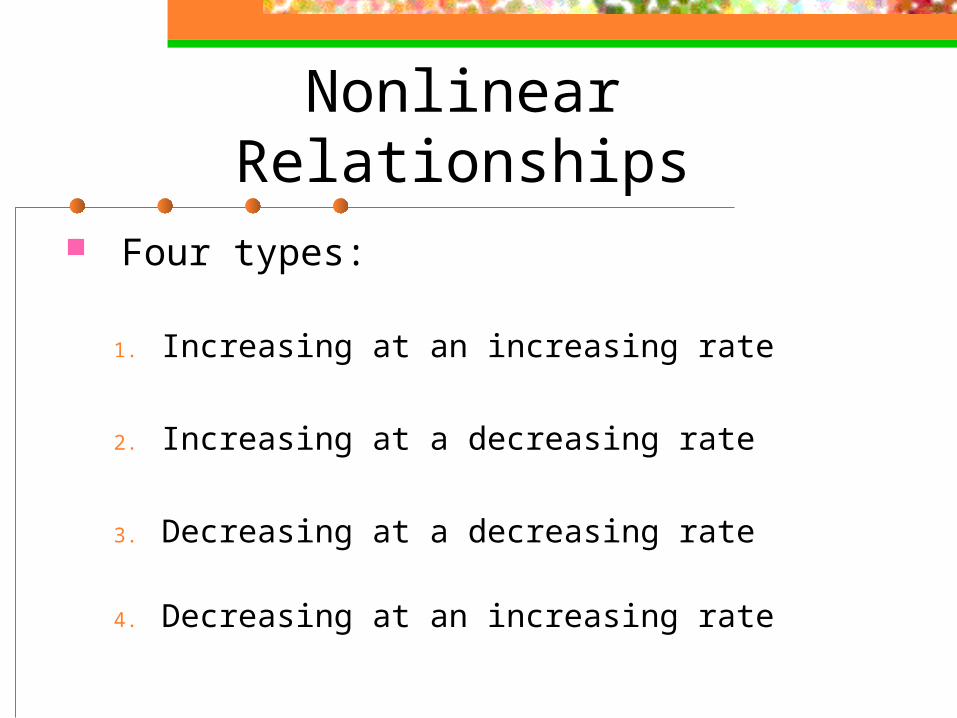
Nonlinear Relationships
Four types:
1. Increasing at an increasing rate
2. Increasing at a decreasing rate
3. Decreasing at a decreasing rate
4. Decreasing at an increasing rate

Nonlinear relationship
Increasing at an Increasing Rate: increases in the X
variable lead to larger increases in the Y Variable
Y
X
Y = f(X)

Nonlinear relationship
Increasing at a Decreasing Rate: increases in the X
variable lead to smaller increases in the Y Variable
Y
X
Y = f(X)

Nonlinear relationship
Decreasing at a Decreasing Rate: increases in the X
variable lead to smaller decreases in the Y Variable
Y
X
Y = f(X)

Nonlinear relationship
Decreasing at an Increasing Rate: increases in the X
variable lead to larger decreases in the Y Variable
Y
X
Y = f(X)