Tools to Guide Anemia Programming Webinar Presentation · National and District Tools to Guide...
33
National and District Tools to Guide Anemia Programming Alexis D’Agostino, SPRING Monitoring and Evaluation Specialist Denish Moorthy, SPRING Technical Advisor, Micronutrients March 23 rd , 2017
Transcript of Tools to Guide Anemia Programming Webinar Presentation · National and District Tools to Guide...

National and District Tools to Guide Anemia Programming
Alexis D’Agostino, SPRING Monitoring and Evaluation Specialist Denish Moorthy, SPRING Technical Advisor, Micronutrients
March 23rd, 2017
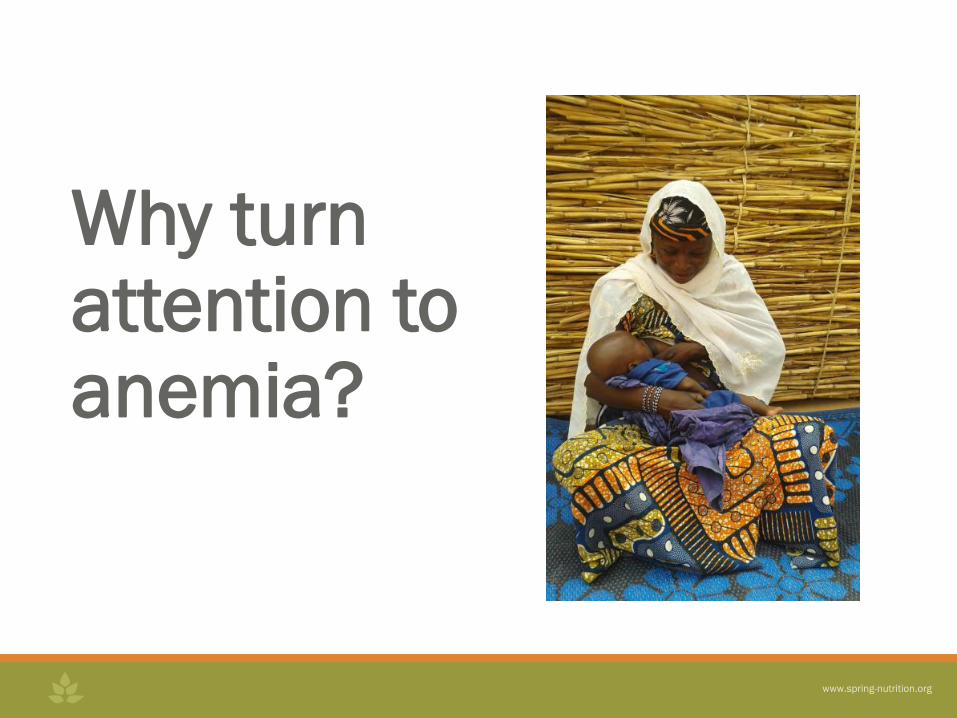
Why turn attention to anemia?
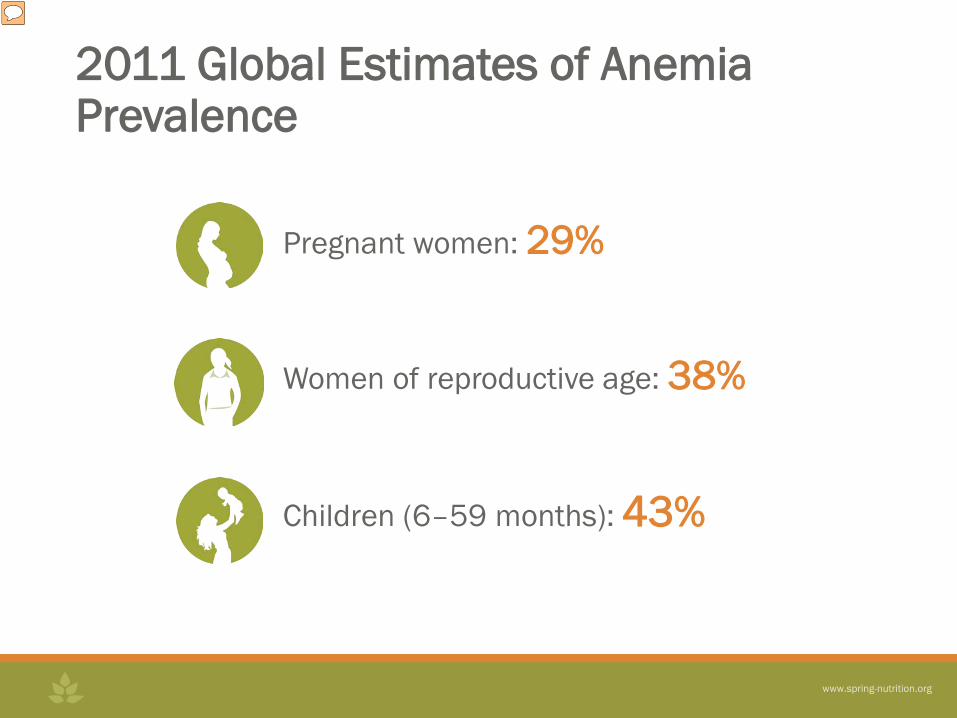
2011 Global Estimates of Anemia Prevalence
Pregnant women: 29%
Women of reproductive age: 38%
Children (6–59 months): 43%
Presenter
Presentation Notes
Women, especially those who are pregnant, and young children face high levels of anemia. Because of these high numbers, the World Health Assembly targets include a target for a 50% reduction of anemia by 2025. Highest burden in SSA and South Asia. For children, very high prevalence (over 60%) in West and Central Africa.

Presenter
Presentation Notes
Yet, anemia is where countries are finding it most difficult to make progress, with only three countries on course to meet the WHA 2025 targets.….represents less than 2 percent of the total population of the 185 counties with available data. This progress (or lack thereof) was reported in the 2016 Global Nutrition Report. Implementers and policymakers have been working to reduce anemia for years – but we know that anemia is and remains a problem for much of the world. Increased risk of mortality Maternal mortality Preterm and LBW Child mortality Disability > major depression, chronic respiratory diseases, Injuries Impaired motor and cognitive child function Slower emotional development Poor academic performance Loss of productivity later in life

• an understanding of the context-specific causes and interventions that address them effectively
• a multi-sectoral, multi-stakeholder approach
An effective strategy for anemia reduction requires…
Presenter
Presentation Notes
Reasons for slow progress: Part of the difficulty is that anemia is not caused by one thing and nor can it be addressed through a one-size-fits-all program. Luckily, we know that there are opportunities to decrease anemia rates by addressing the causes of anemia with effective interventions through multi-sectoral and multi-stakeholder approaches.

SPRING developed two tools…
• An interactive, web-based Guidance for Conducting Landscape Analyses for Anemia
• An Excel-based District Assessment Tool for Anemia (DATA)
Presenter
Presentation Notes
It is within this context that SPRING developed two separate but complimentary tools, one for understanding anemia as a problem within a country’s context, and another for prioritizing actions across multiple sectors to address anemia at the district level

Landscape Analysis Guidance: Why? • Helps users know the anemia
problem in the country • Shows users how to capture
information on the multiple factors that contribute to anemia
• Helps users understand the existing strategies for anemia prevention and control
Presenter
Presentation Notes
By following this guidance, users will form a context-specific evidence base and identify areas that should be prioritized to guide the development of multisectoral and multi-stakeholder anemia efforts.
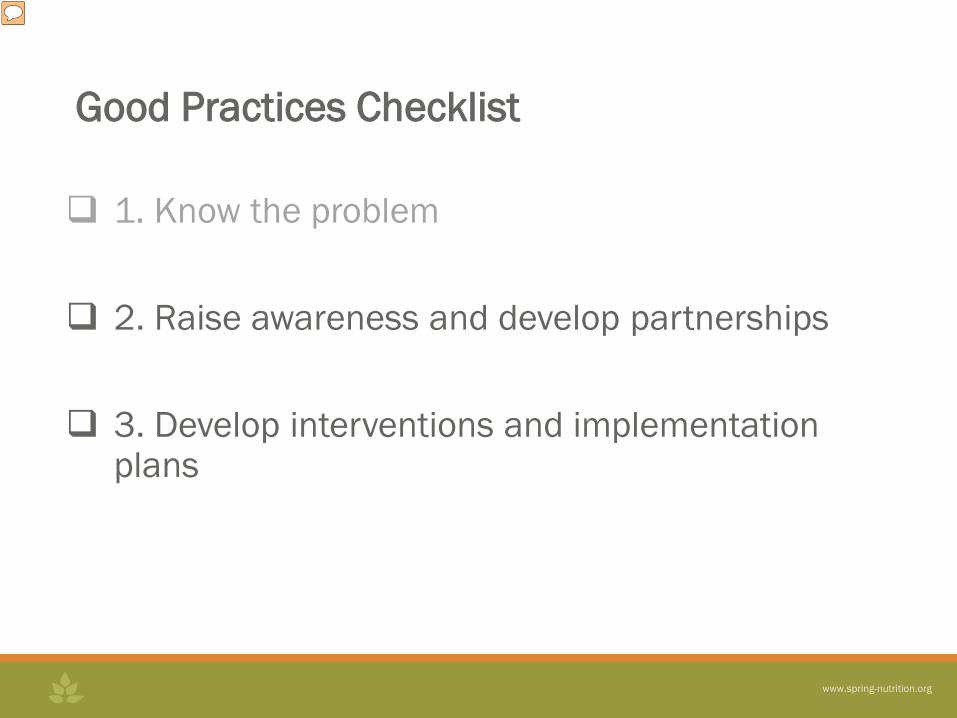
Good Practices Checklist
1. Know the problem
2. Raise awareness and develop partnerships
3. Develop interventions and implementation plans
Presenter
Presentation Notes
What we are facing is a status quo where anemia is part of a fractured landscape of stakeholders and sectors. Everyone is trying to do the right thing but not always sure exactly what the right thing is. In part I of the “Anemia Prevention and Control Guide: What works” USAID, UNICEF, the World Bank, and others suggest taking a three step approach to developing a strategy for anemia prevention and control. The step of knowing the problem, though, is often a black box, with an immense amount of data available in some areas, and very little available in others. Implementers and policy makers can be overwhelmed trying to understand what they should be doing during this step. This is where SPRING’s guidance on conducting a landscape analysis comes in.
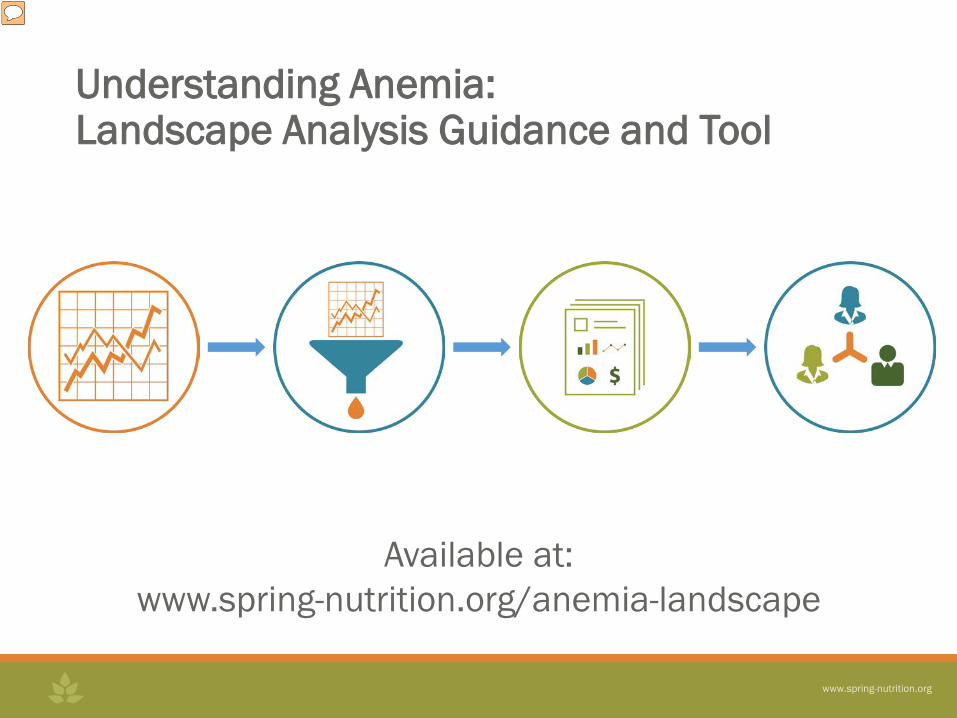
Available at: www.spring-nutrition.org/anemia-landscape
Understanding Anemia: Landscape Analysis Guidance and Tool
Presenter
Presentation Notes
We have developed an online resource that walks the user through the whole process of doing a landscape analysis for anemia. From understanding anemia, to gathering data on its causes and interventions. We’ve also provided an Excel-based tool that allows you to collect the data in one central place an perform some automatic analyses. After going through this guidance, you’ll have the building blocks you need for a landscape analysis, and you will be ready to move onto awareness building, partnership development, intervention development, and planning for implementation: steps 2 and 3. What I would like to do now is step back a bit and explain a bit more about this set of resources. We’ve designed this with implementers and policymakers in mind. The ideal user is the kind of person who would be tasked with conducting a landscape assessment for anemia. However, we’ve presented all of the data in a modular way so that even if you are not conducting a full landscape analysis yourself, you can explore the areas you are interested in learning more about and find references to additional resources so you can better understand the data you and your colleagues are collecting and using as you think about a multisectoral anemia strategy.

Understanding the Foundation
The Problem
The Process
The Data
Presenter
Presentation Notes
A strong foundation for undertaking a landscape analysis requires that you understand the nature of the problem that anemia presents, the process of carrying out a landscape analysis, and how to approach data collection to ensure you are making use of available data, all of which we cover in the beginning of the guidance.
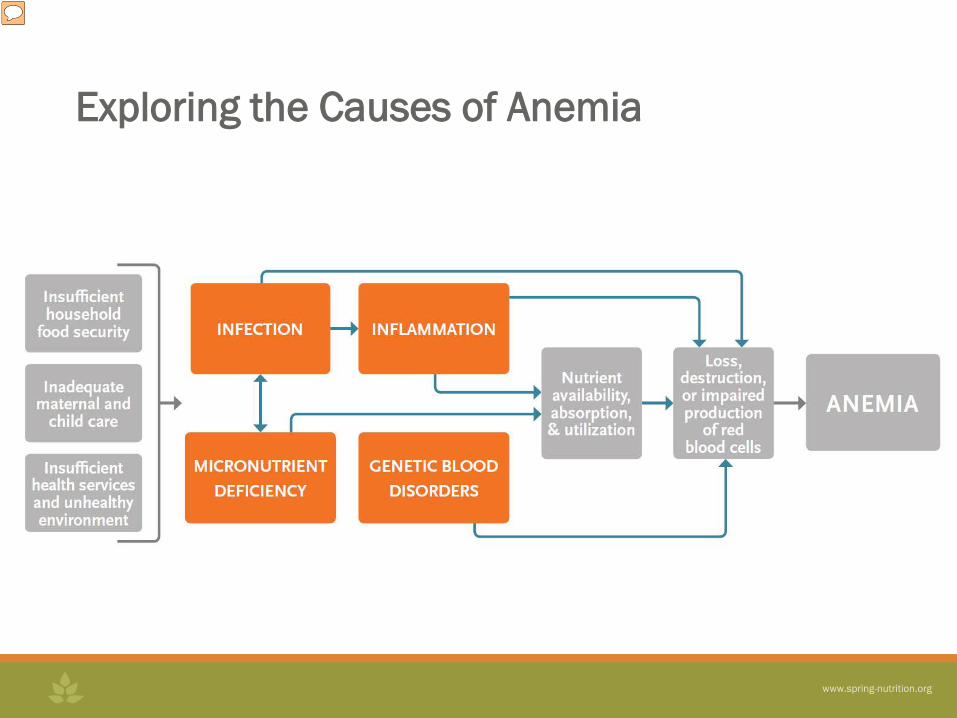
Exploring the Causes of Anemia
Presenter
Presentation Notes
Understanding the causes of anemia, shown here in our causal pathway, is an important part of any landscape analysis. We focus on four main causes, going into detail on specific infections and micronutrient deficiencies.
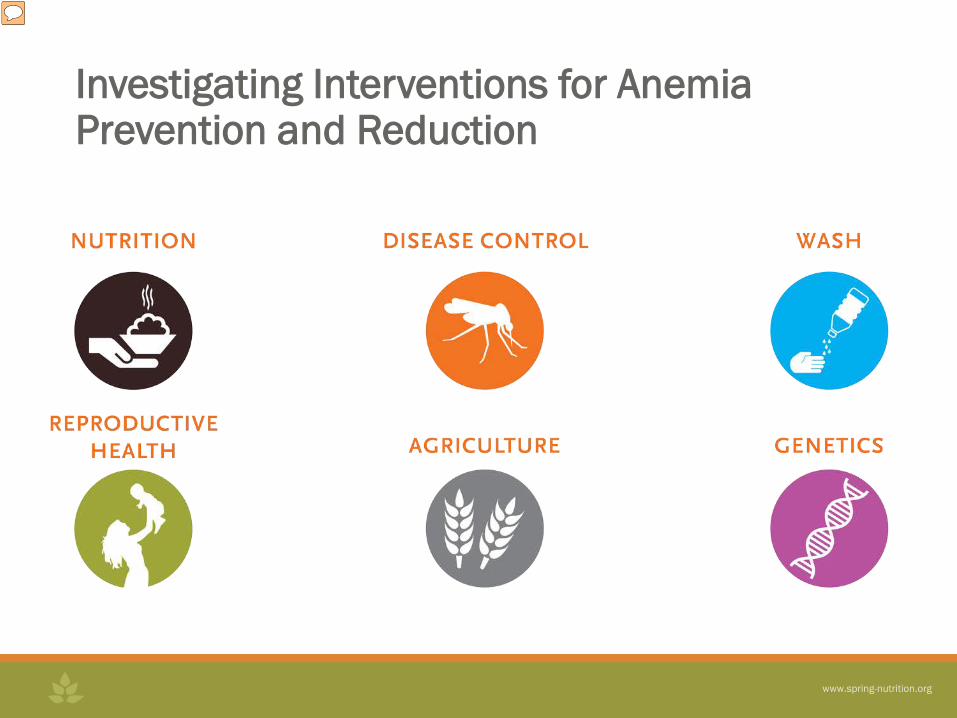
Investigating Interventions for Anemia Prevention and Reduction
Presenter
Presentation Notes
Understanding causes isn’t enough, though, so we explore some of the most common interventions used to prevent or address anemia, across these focus areas.
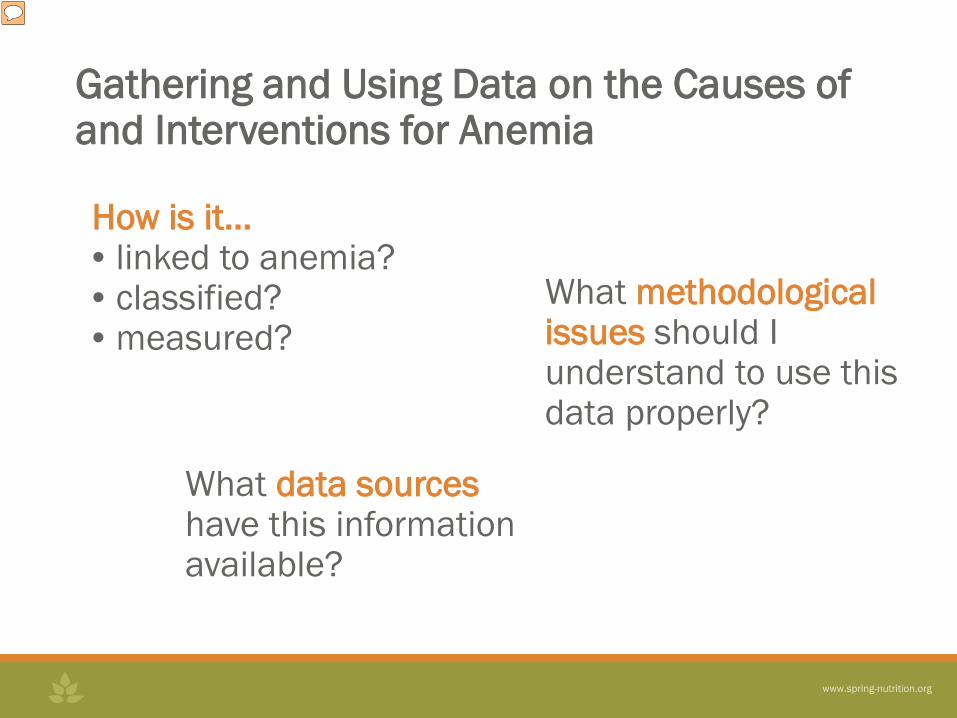
Gathering and Using Data on the Causes of and Interventions for Anemia
How is it… • linked to anemia? • classified? • measured?
What data sources have this information available?
What methodological issues should I understand to use this data properly?
Presenter
Presentation Notes
Each cause and intervention has its own page that answers these questions, detailing its link to anemia, how it is classified and measured, sources of data, and any methodological issues you should be aware of when you include data in your landscape analysis.
Examining the Policy Environment for Anemia
1 2 3
Presenter
Presentation Notes
Finally, we explore the policy environment to ensure that your landscape analysis takes into account the presence or absence of anemia-related policies. Tracking down these policies can be difficult to do, so we provide guidance on three options for pulling together this information: conducting key informant interviews – we even provide questions to use in your interview; searching online databases that specialize in this type of information; and reviewing websites of key government agencies.
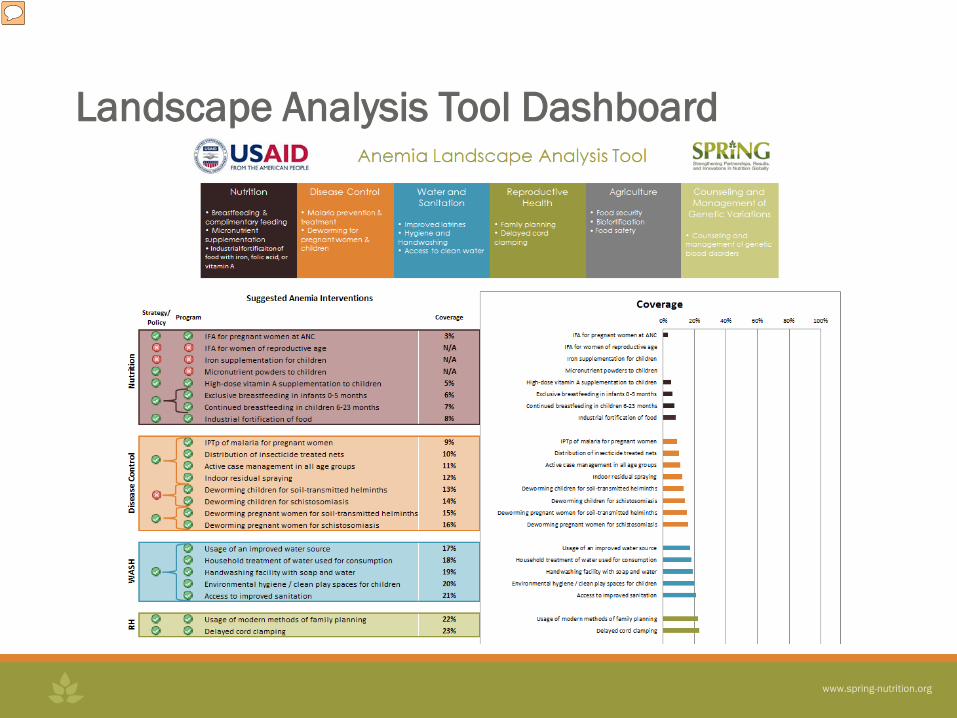
Landscape Analysis Tool Dashboard
Presenter
Presentation Notes
You can input all of the data you collect, on causes, programs, and policies into the Excel-based tool to come up with an analysis of your findings. From here the data and specific context you’ve developed can be compiled into a full landscape analysis. We even provide examples of landscape analyses SPRING has conducted to help you finish up.
Presenter
Presentation Notes
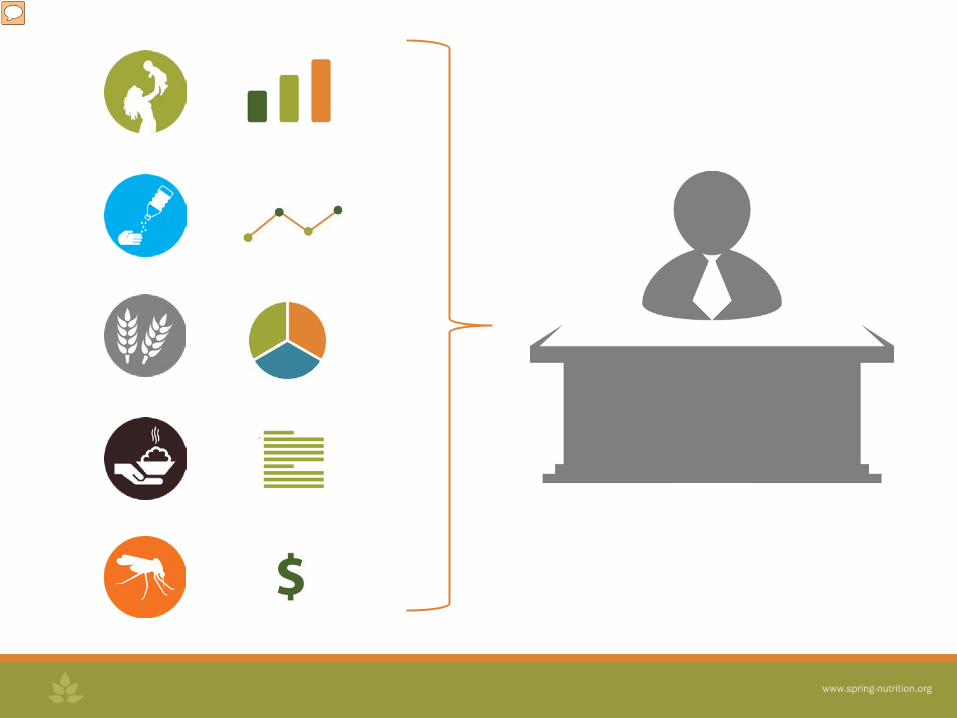
So if you use it, where will this Landscape analysis guidance leave you? Hopefully with a better understanding of the issues your country faces in addressing anemia. Sometimes the landscape analysis will unearth some unexpected findings, forcing you to attack the problem in a different way that you had before, sometimes in collaboration with different partners. For example, as in the case of Sierra Leone, you might find that iron deficiency is not as big of a problem as had been assumed, or you may identify some patterns in the data that highlight difficulties in implementing a key intervention.
Presenter
Presentation Notes
Hopefully by linking systems, understanding the big picture, and knowing the real situation of anemia, we are also able to pass on this knowledge to those who matter most – the people whose lives we aim to improve. Using a landscape analysis to understand the anemia situation can allow us to implement more effectively, target more purposively, and act more empathetically.
Anemia Programming at the District Level: District Assessment Tool for Anemia (DATA)
Dr. Denish Moorthy, Technical Advisor, Micronutrients, SPRING, Washington, D.C.
March 23, 2017
Why District Level?
• Decision making becoming disaggregated
• Resources limited; Decisions need to be made
• Opinions matter: perspective and expertise of district level staff
• Comparisons: Want to know how they are doing vis-à-vis regional and national
• Simple visualization

Why DATA?
A district level tool:
• Increases awareness of the importance of contextual factors
• Identifies the gaps, enablers, and barriers to addressing anemia risk factors
• Assists with prioritization of district-level anemia interventions
Purpose of DATA
• Increases an understanding about anemia and its causes
• Highlights current data and encourages further data collection
• Helps prioritize activities and interventions in a way that is most likely to address the most important causes of anemia
Slide 4
Presenter
Presentation Notes
DATA is designed to: Increase understanding about anemia and its causes Awareness about anemia's multifactorial nature Improved understanding of risk factors Emphasis on multisectoral efforts needed to address anemia Highlights current data and encourages further data collection Uses data that is already-available data routinely collected by districts to inform decisions Helps prioritize activities and interventions in a way that is most likely to address the most important causes of anemia Walks participants through a barriers assessment exercise to identify the gaps in implementation
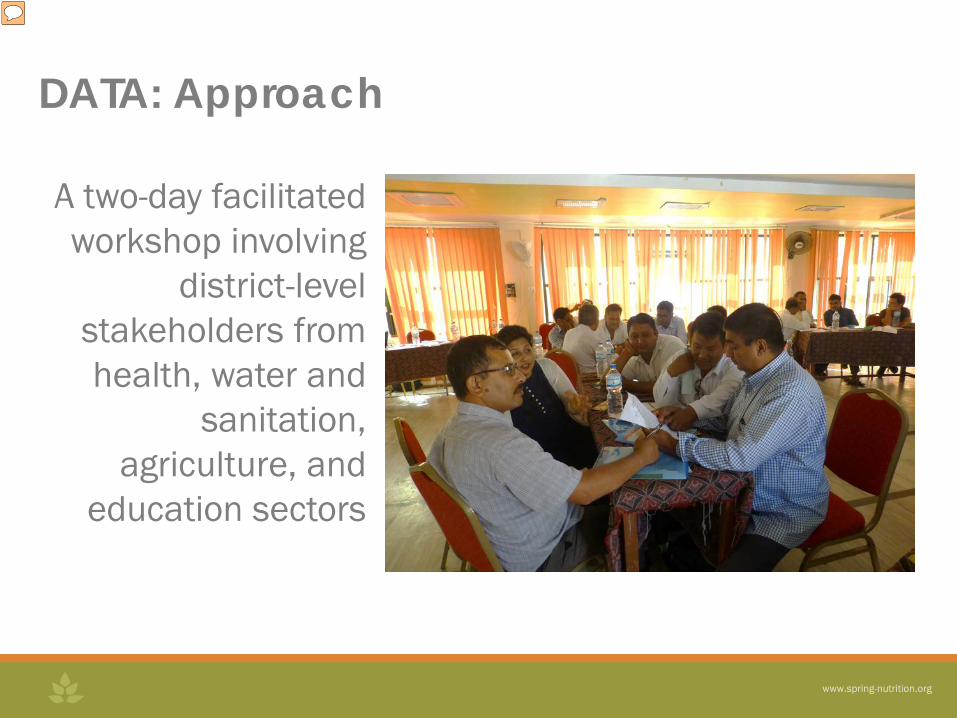
DATA: Approach
A two-day facilitated workshop involving
district-level stakeholders from health, water and
sanitation, agriculture, and
education sectors
Presenter
Presentation Notes
Approach: In a 2-day facilitated workshop, district-level actors use DATA to: Answer quantitative and qualitative questions about factors related anemia within the district DATA converts data from the questionnaires to snapshots of anemia and risk factor prevalence, and sectoral-level anemia programming in the district Review the outputs of the survey in two dashboards Identify and prioritize actions that can help to alleviate anemia in the district Accompanying User and Facilitator Guides provide detailed guidance for this process
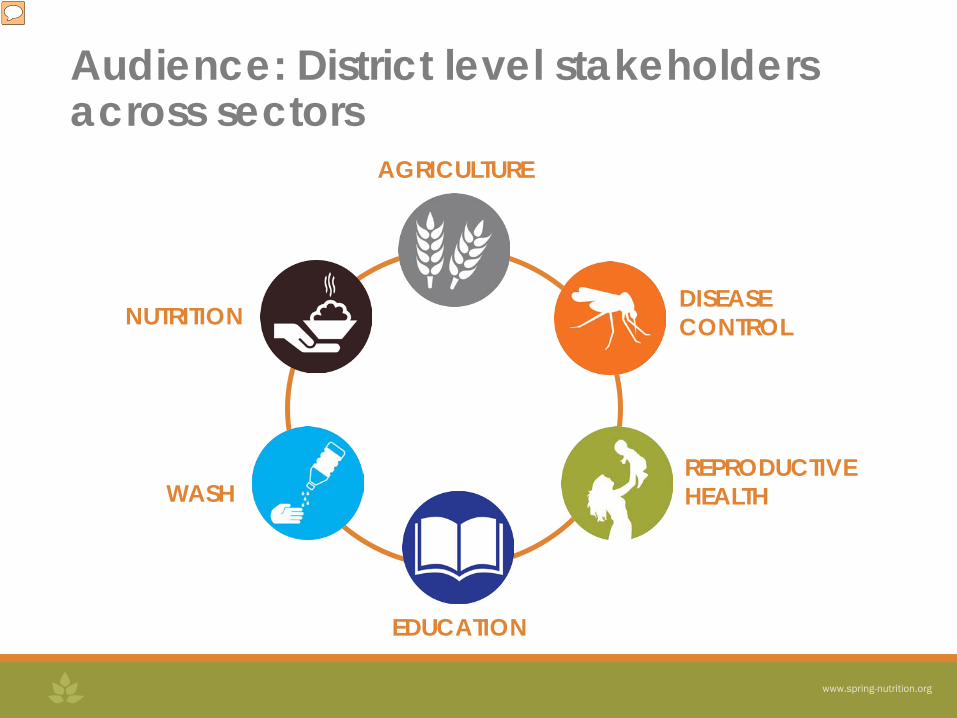
Audience: District level stakeholders across sectors
AGRICULTURE
NUTRITION
WASH
EDUCATION
REPRODUCTIVE HEALTH
DISEASE CONTROL
Presenter
Presentation Notes
Given that anemia’s risk factors and interventions span multiple sectors, the district-level workshop participants should include government stakeholders from the following sectors: the health sector, especially the nutrition, disease control, and reproductive health units, as well as the water, sanitation and hygiene (WASH), agriculture, and education divisions. Non-governmental organizations, donor agencies, academia, and the private sector often have roles to play in anemia reduction and control efforts, and should be part of the workshop if they are involved or implicated in the implementation anemia-related interventions in the district.
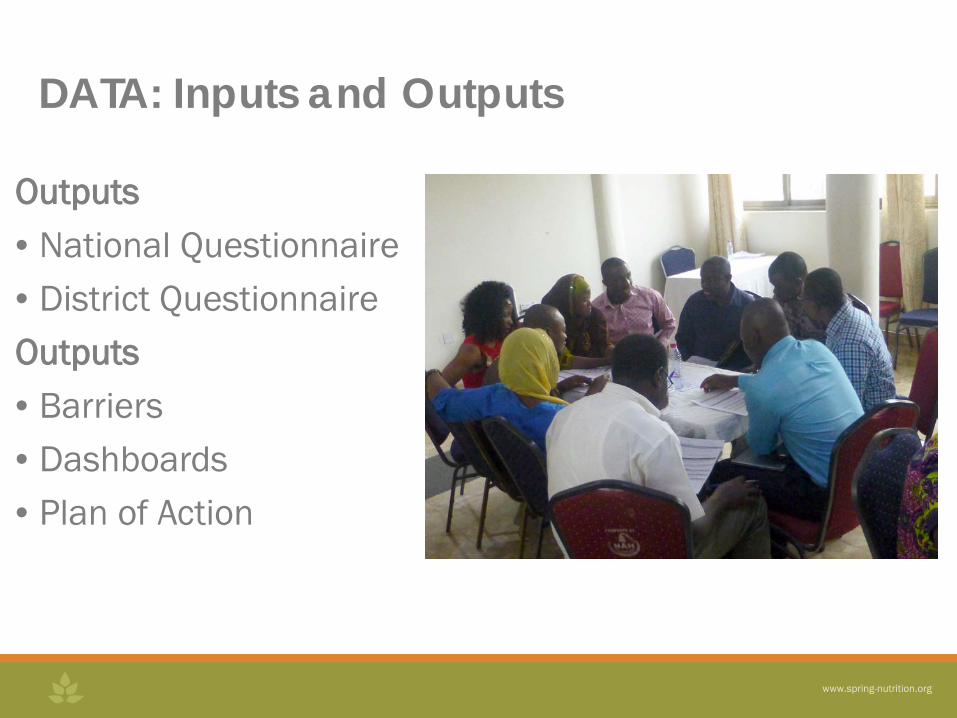
DATA: Inputs and Outputs
Outputs • National Questionnaire • District Questionnaire Outputs • Barriers • Dashboards • Plan of Action
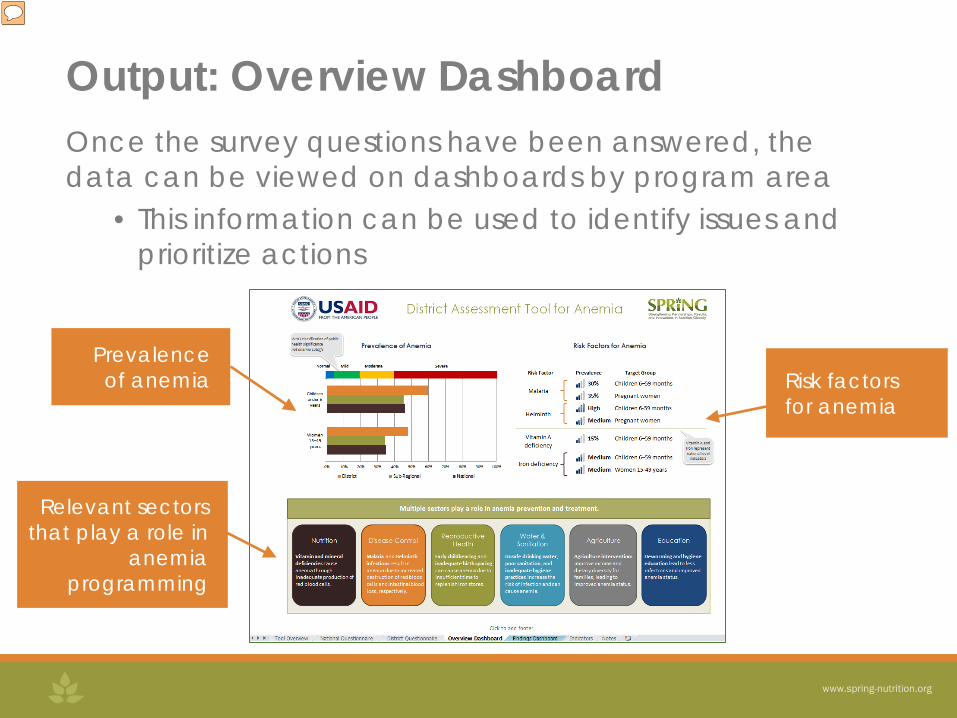
Output: Overview Dashboard Once the survey questions have been answered, the data can be viewed on dashboards by program area
• This information can be used to identify issues and prioritize actions
Prevalence of anemia
Relevant sectors that play a role in
anemia programming
Risk factors for anemia
Presenter
Presentation Notes
The Overview Dashboard tab displays high-level data, including: anemia prevalence for children under 5 years and women 15–49 years at the national, sub-national, and district levels; prevalence of anemia risk factors; and an overview of the sectors involved in anemia reduction.
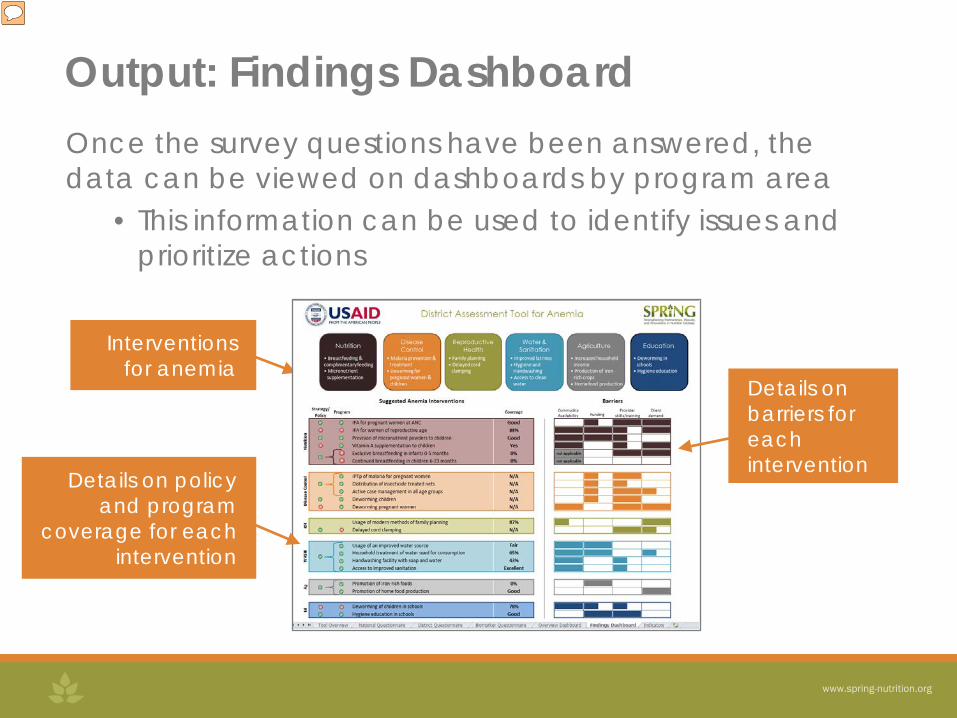
Output: Findings Dashboard Once the survey questions have been answered, the data can be viewed on dashboards by program area
• This information can be used to identify issues and prioritize actions
Interventions
for anemia Details on barriers for each intervention
Details on policy and program
coverage for each intervention
Presenter
Presentation Notes
The Findings Dashboard includes: a list of interventions that are available for anemia reduction, and policy and program coverage information for these suggested programs in your district, based on the answers you provided in the National and District Questionnaires. The dashboard also includes a section on barriers to each of the suggested programs, which participants will complete as one large group. Depending on the data that is entered in the questionnaires, the information shown may be quantitative or qualitative.

Steps of Using DATA
Step 1: Review the anemia situation—consult Overview Dashboard
Step 2: Review anemia programs and policy—consult Findings Dashboard
Step 3: Review inputs to prioritization—discuss considerations for program implementation
Step 4: Identify and assess barriers to implementation—complete the barriers section
Step 5: Formulate a plan of action
Presenter
Presentation Notes
*Read out loud the five steps involved in using DATA, and explain to workshop participants that these steps will be covered in much more detail on Day 2, during the “Decision Framework for Prioritization of Anemia Action” presentation*
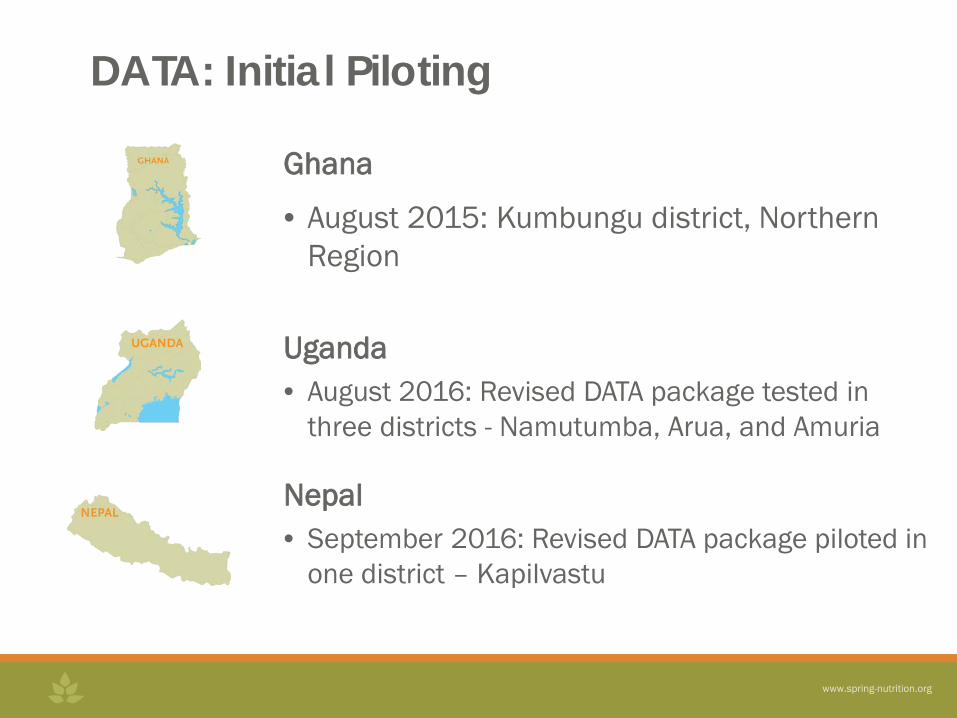
Ghana
• August 2015: Kumbungu district, Northern Region
Uganda • August 2016: Revised DATA package tested in
three districts - Namutumba, Arua, and Amuria
Nepal • September 2016: Revised DATA package piloted in
one district – Kapilvastu
DATA: Initial Piloting
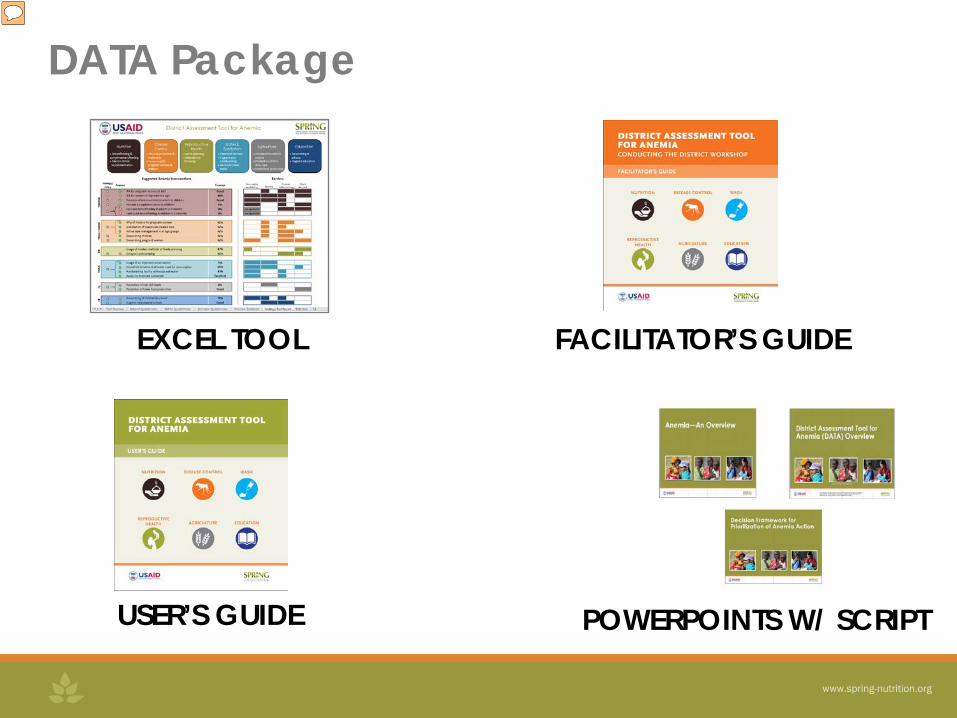
DATA Package
EXCEL TOOL
USER’S GUIDE
FACILITATOR’S GUIDE
POWERPOINTS W/ SCRIPT
Presenter
Presentation Notes
Package Excel-based district-level tool Guides: Facilitator’s and Users PowerPoints with script

SPRING DATA Page
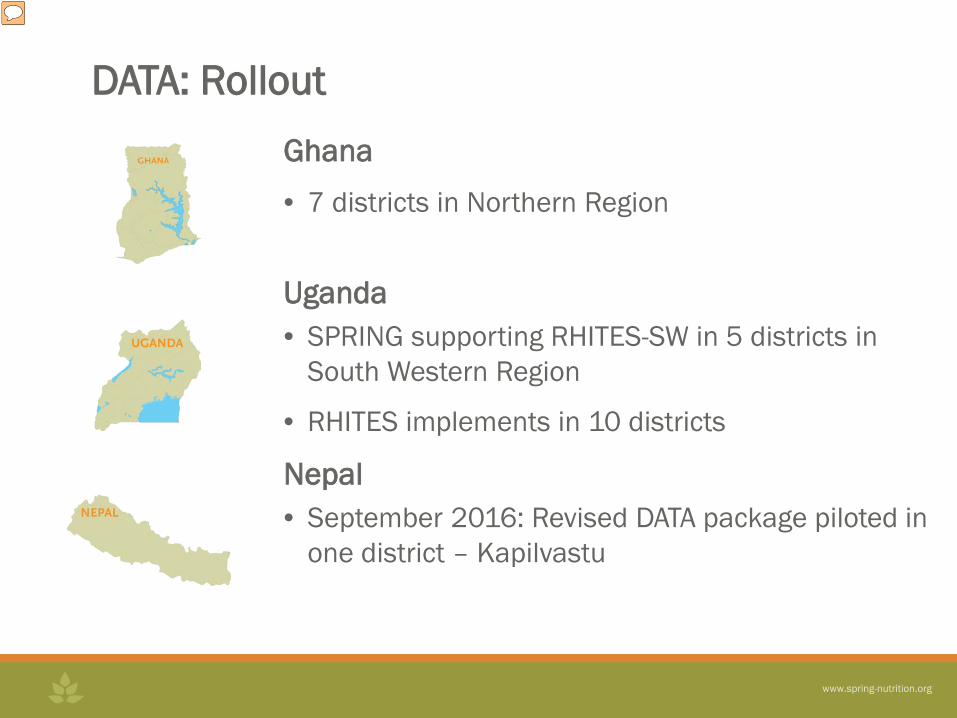
Ghana • 7 districts in Northern Region Uganda • SPRING supporting RHITES-SW in 5 districts in
South Western Region
• RHITES implements in 10 districts
Nepal • September 2016: Revised DATA package piloted in
one district – Kapilvastu
DATA: Rollout
Presenter
Presentation Notes
Uganda August 2016: Full DATA package (excel-based tool, Facilitator’s guide and User’s guide) tested in five districts Nepal September 2016: Full DATA package piloted in Kapilvastu District. Potential for scale-up to other districts in PY6 with the support of UNICEF Ghana In PY6: Under the leadership of Nutrition Department of the Regional Health Directorate, SPRING plans to support DATA rollout to 15 districts in Ghana where SPRING has a local presence: Northern, Upper East, and Upper West regions.

DATA Team
Advisory Board • Rolf Klem, HKI • Robin Houston, JSI • Omar Dary, USAID • Tariq Azim, JSI • Edward Bonku, JSI • Phil Harvey (Honorary)
• Toby Stillman, Save (Previous)
SPRING Team • Danya Sarkar • Teemar Fisseha • Sorrel Namaste • Anuradha Narayan • Denish Moorthy
CHIME, JSI • Emma Stewart, JSI • Barbara Knittel, JSI
All participants in DATA Workshops to date and in the future

This presentation was made possible by the American people through the U.S. Agency for International Development (USAID) under Cooperative Agreement No. AID-OAA-A-11-00031, the Strengthening Partnerships, Results, and Innovations in Nutrition Globally (SPRING) project.
Thank you!