TONGAAT HULETT INTERIM RESULTS FOR THE SIX MONTHS … · sugar brands in South Africa, Zimbabwe,...
13
TONGAAT HULETT INTERIM RESULTS FOR THE SIX MONTHS ENDED 30 SEPTEMBER 2015 Revenue of R7,609 billion (2014: R8,073 billion) -5,7% Operating profit of R1,361 billion (2014: R1,510 billion) -9,9% Operating cash flow of R2,292 billion (2014: R2,413 billion) -5,0% Headline earnings of R673 million (2014: R773 million) -12,9% Interim dividend of 170 cents per share (2014: 170 cents per share) COMMENTARY The results for the half-year ended 30 September 2015 were attained with strong performances from the land conversion activities and the starch operation being more than off-set by the impact of difficult conditions for the sugar industry. In total, for the six months, revenue amounted to R7,6 billion and operating profit of R1,4 billion was generated, which is 9,9% below last year. Land conversion and development activities generated operating profit of R576 million from the sale of 65 developable hectares (2014: R435 million from 49 developable hectares). Sales in this period came from Cornubia (industrial and office), Sibaya (commencement of node 1 for high-end residential), Umhlanga Ridge Town Centre, Kindlewood, Izinga and Bridge City. The profit per developable hectare averaged R8,9 million in the half-year, ranging from R4 million to over R38 million per developable hectare, in line with the expectations previously communicated. The starch and glucose operation increased operating profit to R281 million (2014: R264 million). Sales volumes of prime products reflected a 1% reduction in the half- year, with gains in the coffee/creamer sector and a slight increase in exports being off- set by reductions in the confectionery, prepared foods, canning and paper making sectors. Maize costs were competitive and there were ongoing improvements in operating efficiencies, co-product recoveries and cost control. The various sugar operations’ revenue totalled R5,0 billion for the six months, which was 14% below the previous half-year. Profit before the impact of cane valuations was R1,13 billion compared to R1,45 billion in the first half of last year. A reduction in sugar production is being driven by poor growing conditions, particularly in South Africa. In addition to lower volumes, export revenues are also being impacted by a lower international sugar price, with regional deficit markets and EU exports linked to that price. Export prices earned into the EU have reduced by some 5,3 US cents per pound, in line with the reduction in the world price, compared to the first half of last year, with a revenue impact of some R200 million in Zimbabwe and Mozambique. Cost reduction initiatives continue across all operations. There are multiple currency dynamics, with positive and negative effects compared to the same period last year. The negative cane valuation impact of R570 million at the half-year is to be expected with the harvesting that has taken place and is consistent overall with the movement 1
Transcript of TONGAAT HULETT INTERIM RESULTS FOR THE SIX MONTHS … · sugar brands in South Africa, Zimbabwe,...

TONGAAT HULETT
INTERIM RESULTS FOR THE
SIX MONTHS ENDED 30 SEPTEMBER 2015
Revenue of R7,609 billion (2014: R8,073 billion) -5,7%
Operating profit of R1,361 billion (2014: R1,510 billion) -9,9%
Operating cash flow of R2,292 billion (2014: R2,413 billion) -5,0%
Headline earnings of R673 million (2014: R773 million) -12,9%
Interim dividend of 170 cents per share (2014: 170 cents per share)
COMMENTARY
The results for the half-year ended 30 September 2015 were attained with strong
performances from the land conversion activities and the starch operation being more
than off-set by the impact of difficult conditions for the sugar industry. In total, for the
six months, revenue amounted to R7,6 billion and operating profit of R1,4 billion was
generated, which is 9,9% below last year.
Land conversion and development activities generated operating profit of R576
million from the sale of 65 developable hectares (2014: R435 million from 49
developable hectares). Sales in this period came from Cornubia (industrial and office),
Sibaya (commencement of node 1 for high-end residential), Umhlanga Ridge Town
Centre, Kindlewood, Izinga and Bridge City. The profit per developable hectare
averaged R8,9 million in the half-year, ranging from R4 million to over R38 million
per developable hectare, in line with the expectations previously communicated.
The starch and glucose operation increased operating profit to R281 million (2014:
R264 million). Sales volumes of prime products reflected a 1% reduction in the half-
year, with gains in the coffee/creamer sector and a slight increase in exports being off-
set by reductions in the confectionery, prepared foods, canning and paper making
sectors. Maize costs were competitive and there were ongoing improvements in
operating efficiencies, co-product recoveries and cost control.
The various sugar operations’ revenue totalled R5,0 billion for the six months, which
was 14% below the previous half-year. Profit before the impact of cane valuations
was R1,13 billion compared to R1,45 billion in the first half of last year. A reduction
in sugar production is being driven by poor growing conditions, particularly in South
Africa. In addition to lower volumes, export revenues are also being impacted by a
lower international sugar price, with regional deficit markets and EU exports linked to
that price. Export prices earned into the EU have reduced by some 5,3 US cents per
pound, in line with the reduction in the world price, compared to the first half of last
year, with a revenue impact of some R200 million in Zimbabwe and Mozambique.
Cost reduction initiatives continue across all operations. There are multiple currency
dynamics, with positive and negative effects compared to the same period last year.
The negative cane valuation impact of R570 million at the half-year is to be expected
with the harvesting that has taken place and is consistent overall with the movement
1

seen last year. Operating profit after cane valuations, from all the sugar operations,
totalled R562 million compared to R864 million in the first half of last year.
The South African sugar operations, including the agriculture, milling, refining and
various downstream activities have seen a reduction of operating profit to R154
million (2014: R259 million). Production volumes are substantially below last year as
a result of the drought in KwaZulu-Natal (including the Darnall mill not being opened
this season) and export sales volumes have consequently reduced by 88% compared
to the same period last year. The overall reduction in volumes has been partly off-set
by focused cost reductions and improved local market pricing, with a reduced impact
of imports into the local market. Value added activities, including speciality sugars,
branding, packing and distribution in Botswana, Namibia and South Africa, as well as
Voermol (the specialist animal feeds business), continue to make a significant
contribution.
The Tambankulu Estate in Swaziland recorded operating profit of R32 million (2014:
R35 million), which continues to reflect the impact of lower sugar cane prices.
The Mozambique sugar operating profit reduced to R142 million (2014: R226
million) due to lower export sales prices and sales volumes in the half-year. The lower
sales volumes are as a result of lower production levels at this stage in the season. The
effect of lower export revenues, including the reduction in export prices into the EU,
was partially off-set by increased local market revenues.
The Zimbabwe sugar operations’ operating profit for the half-year amounted to R234
million (US$19 million) compared to the R344 million (US$32 million) in the same
period last year. Domestic market sales volume levels have been maintained despite
the challenging local economic conditions. This was more than off-set by lower
export volumes, due to the timing of shipments between the first and second halves of
the year, and lower export prices into the EU. The strength of the US dollar is exerting
pressure, particularly in respect of US dollar based costs (such as wages and salaries)
and Euro based revenues. The movement in the exchange rate has benefitted the
conversion of the US dollar earnings into Rands on consolidation.
Finance costs of R314 million (2014: R297 million) were commensurate with the
borrowing levels and prevailing interest rates.
Operating cash flow generated for the six months was R2,3 billion (2014: R2,4
billion), before working capital movements. The absorption of cash in working capital
at the half-year was some R2,4 billion, being the middle of the sugar season when
sugar stocks and debtor levels are usually substantially higher than at the end of the
financial year. The increased level of land conversion sales and profits has led to a
higher level of accounts receivable. Capital expenditure for the half-year has
increased with high return initiatives being undertaken, for example the
coffee/creamer production facility expansion in the starch and glucose operation.
After taking all of the aforementioned into account, net debt at the half-year was
R5,27 billion (2014: R4,90 billion).
2

Headline earnings for the half-year amounted to R673 million (2014: R773 million).
An interim dividend of 170 cents per share has been declared (2014: 170 cents per
share).
OUTLOOK
Tongaat Hulett has substantially enhanced its strategic positioning over the past few
years and will continue to do so, focusing on multiple strategic thrusts, all with a
positive impact on earnings and cash flow, through the various cycles that the
business experiences. The financial results for the current full year continue to be
influenced by a number of substantial and varying dynamics, both negative and
positive, and the full impact is difficult to predict at this stage.
Tongaat Hulett’s Sugar Production and its Markets
Tongaat Hulett’s sugar production in 2015/16 has been heavily impacted by the
drought in KwaZulu-Natal and the lower water and dam levels for irrigation have had
an impact in Mozambique, Zimbabwe and Swaziland. Sugar production in total for
the 2015/16 season is expected to be between 1 005 000 and 1 093 000 tons (2014/15:
1 314 000 tons), with South Africa between 310 000 and 325 000 tons (2014/15:
541 000 tons), Zimbabwe between 410 000 and 450 000 tons (2014/15: 445 000 tons),
Mozambique between 230 000 and 260 000 tons (2014/15: 271 000 tons) and the raw
sugar equivalent in Swaziland between 55 000 and 58 000 tons (2014/15: 57 000
tons). Production levels in 2016/17 will largely depend on the extent of rainfall over
the next 7 months. The drought has already had an impact, particularly in South
Africa. In Zimbabwe, Mozambique and Swaziland the quantum of irrigation is being
reduced as a mitigation measure against potential poor rainfall in the coming months.
Electricity availability has, at times, impacted on irrigation. A return to regular
growing conditions, together with the benefit of the intensive agricultural
improvement plans that are well under way, should lead to sugar production
increasing to above 1,6 million tons by 2018/19.
A number of factors are in play in the markets where Tongaat Hulett operates. The
key markets are the domestic markets in countries where it produces sugar, all of
which have the potential to grow Tongaat Hulett’s supply. Progress is being made
with the effectiveness of various import protection measures. In Zimbabwe and
Mozambique, sugar refining matters are being addressed, which should lead to the
replacement of imported industrial white sugar. Growth is expected in consumption
per capita, off a low base, particularly in Mozambique and partly in Zimbabwe,
together with increased distribution and marketing initiatives. In South Africa, with its
current low sugar production level, Tongaat Hulett is having to procure other
producers’ raw sugar for refining to supply its local market white sugar position and
plans to replace this with its own production in future. Tongaat Hulett has the leading
sugar brands in South Africa, Zimbabwe, Botswana and Namibia. Total local market
sales in Tongaat Hulett’s domestic markets could increase from some 850 000 tons in
2014/15 to some 1 090 000 tons by 2018/19.
Tongaat Hulett’s additional sugar is sold mainly into regional and EU markets, where
a premium is earned above the volatile world sugar price. Coming out of 5 years of
global surplus production, high stock levels and a low world price, the expectations
3

for the current year are that global supply will fall short of global demand. Current
weather conditions, together with farmer behaviour driven by low prices and input
cost pressures, are exerting downward pressure on global sugar production levels.
Global sugar consumption is predicted to continue to grow at a rate of some 1,5% to
2% per annum, with most of this growth coming from low per capita consumption
developing countries.
Tongaat Hulett has key market positions and experience in both the EU and the region
(southern and eastern Africa). The EU reforms are leading to a shift for Tongaat
Hulett away from the EU to regional deficit markets, replacing deep sea imports and
benefitting from trade-bloc advantages. By 2018/19, regional exports could increase
from 100 000 tons in 2014/15 to some 275 000 tons and EU exports are likely to
reduce from 327 000 tons to some 130 000 tons.
Cost Reductions
The sustainable cost reductions achieved over the past two years (equivalent to some
R950 million in real terms), while having to absorb input price increases, provided a
good base for the next steps in the concerted cost reduction process in the sugar
operations. An overall reduction in goods, services, transport, marketing, salaries and
wages costs in real terms is expected this year.
Growing Starch and Glucose
The starch and glucose operation is well positioned strategically and is focused on
growing its sales volume, with an enhanced product mix and customer growth
prospects into Africa. This is underpinned by improving use of its available capacity
and the efficiency of its operations. The R135 million expansion project for the
coffee/creamer sector is currently in its commissioning phase. For the second half of
this year, 85% of maize requirements have been priced, back to back with customers,
with margins slightly below the same time last year. The current prevailing dry
weather conditions have resulted in planting delays for the forthcoming maize season.
Rain is required during the next three to six months to allow the crop to be planted
and established. The margins earned on approximately 55% of the starch operation’s
sales volumes for the next financial year will be influenced by the extent to which
local maize prices trade closer to import parity levels.
Momentum in Land Conversion and Development
The momentum in Tongaat Hulett’s land conversion and development activities
continues, with good progress on numerous value unlocking activities spanning the
portfolio of 8 026 developable hectares in KZN earmarked for development. These
activities include strengthening demand drivers, unlocking infrastructure at key
points, securing release from agriculture and other development approvals, while
executing optimal sales strategies for the various parcels of land. The value achieved
per hectare of land sold is increasingly reflecting this steadily improving land
conversion platform and varies based on usage and location. Tongaat Hulett continues
to work together with Government, related organisations and key stakeholders in the
property industry to capture the synergy of each other’s unique capabilities and to
create and unlock value for all stakeholders. An increasing number of significant
4

black economic empowerment related land development transactions are taking place.
This all has a positive impact on economic development, including industrial,
commercial, tourism and all levels of residential development in the Durban/KZN
North Coast area, complementing the simultaneous rural development taking place
around new agricultural cane developments.
Following the sales of the last 18 months, which total 173 developable hectares, the
remainder of this financial year could see muted sales activity. Significant early sales
momentum (40 developable hectares sold) has been achieved in opening up both the
western expansion of Umhlanga Ridge Town Centre into Cornubia and a new
development area in node 1 of Sibaya at eMdloti, with a further 58 developable
hectares to come in these areas following a consolidation around these early catalyst
sales. Good progress has been made, after a 2-year comprehensive process, in
understanding how to unlock optimal value from the prime 42 developable hectares in
precincts 1 and 2 of Umhlanga Ridgeside. A single sale of these 42 hectares, with the
current commercial and residential mix, is not likely to be the optimum route and a
multiple sales approach will now be embarked upon, benefitting from the significant
interest created to date.
An update of the land portfolio document (including prospective usage, market
momentum, demand drivers, possible timing and values) is available on the
www.tongaat.com website. It includes an update of the possible 5-year sales
outcomes, indicating total sales of at least 639 developable hectares with a profit
range of R2 million to R39 million per developable hectare. It also details those areas
where commercial negotiations have commenced or are likely to commence over the
next 24 months.
Tongaat Hulett continues to focus on value creation for all stakeholders through an
all-inclusive approach to growth and development, with its footprint in six SADC
countries, its ability to process both sugar cane and maize, animal feeds thrust,
electricity generation and ethanol opportunities, increased momentum in land
conversion and its socio-economic positioning and constructive interfaces with
Governments and society.
For and on behalf of the Board
Bahle Sibisi Peter Staude
Chairman Chief Executive Officer
Amanzimnyama
Tongaat, KwaZulu-Natal
12 November 2015
5

TONGAAT HULETT LIMITED
INTERIM RESULTS
for the 6 months ended 30 September 2015
Income Statement
Condensed consolidated Unaudited Unaudited Audited
6 months to 6 months to 12 months to
30 September 30 September 31 March
Rmillion 2015 2014 2015
Revenue 7 609 8 073 16 155
Operating profit 1 361 1 510 2 089
Net financing costs (note 1) (314) (297) (617)
Profit before tax 1 047 1 213 1 472
Tax (note 2) (305) (336) (425)
Net profit for the period 742 877 1 047
Profit attributable to:
Shareholders of Tongaat Hulett 701 800 989
Minority (non-controlling) interest 41 77 58
742 877 1 047
Headline earnings attributable to
Tongaat Hulett shareholders (note 3) 673 773 945
Earnings per share (cents)
Net profit per share
Basic 609.1 700.9 864.6
Diluted 609.1 700.9 864.6
Headline earnings per share
Basic 584.8 677.2 826.1
Diluted 584.8 677.2 826.1
Dividend per share (cents) 170.0 170.0 380.0
Currency conversion
Rand/US dollar closing 13.85 11.26 12.17
Rand/US dollar average 12.57 10.64 11.05
Rand/Metical average 0.35 0.35 0.35
Rand/Euro average 13.95 14.35 13.96
US dollar/Euro average 1.11 1.35 1.26
Registration number: 1892/000610/06 JSE share code: TON ISIN: ZAE000096541
6

Segmental Analysis
Condensed consolidated Unaudited Unaudited Audited
6 months to 6 months to 12 months to
30 September 30 September 31 March
Rmillion 2015 2014 2015
REVENUE
Sugar
Zimbabwe 1 863 1 824 3 471
Swaziland 148 146 203
Mozambique 1 394 1 482 1 804
South Africa 1 603 2 365 6 143
Sugar operations - total 5 008 5 817 11 621
Starch operations 1 750 1 740 3 447
Land Conversion and Developments 851 516 1 087
Consolidated total 7 609 8 073 16 155
OPERATING PROFIT
Sugar
Zimbabwe 234 344 386
Swaziland 32 35 29
Mozambique 142 226 130
South Africa 154 259 261
Sugar operations - total 562 864 806
Starch operations 281 264 561
Land Conversion and Developments 576 435 829
Centrally accounted and consolidation items (49) (42) (86)
BEE IFRS 2 charge and transaction costs (9) (11) (21)
Consolidated total 1 361 1 510 2 089
FURTHER ANALYSIS OF SUGAR OPERATING PROFIT
Sugar operations - before cane valuations 1 132 1 454 710
Zimbabwe 533 609 320
Swaziland 58 64 40
Mozambique 411 556 215
South Africa 130 225 135
Cane valuations - income statement effect (570) (590) 96
Zimbabwe (299) (265) 66
Swaziland (26) (29) (11)
Mozambique (269) (330) (85)
South Africa 24 34 126
Sugar operations - after cane valuations 562 864 806
Zimbabwe 234 344 386
Swaziland 32 35 29
Mozambique 142 226 130
South Africa 154 259 261
7

Statement of Financial Position
Condensed consolidated Unaudited Unaudited Audited
30 September 30 September 31 March
Rmillion 2015 2014 2015
ASSETS
Non-current assets
Property, plant and equipment 12 870 11 737 12 059
Growing crops (note 4) 5 168 4 623 5 473
Long-term receivable 541 502 518
Goodwill 416 358 376
Intangible assets 59 65 64
Investments 28 20 27
19 082 17 305 18 517
Current assets 11 782 10 176 8 026
Inventories 4 721 4 503 2 472
Trade and other receivables 5 094 3 935 3 886
Cash and cash equivalents 1 967 1 738 1 668
TOTAL ASSETS 30 864 27 481 26 543
EQUITY AND LIABILITIES
Capital and reserves
Share capital 135 135 135
Share premium 1 544 1 544 1 544
BEE held consolidation shares (642) (695) (674)
Retained income 8 397 7 983 7 959
Other reserves 3 731 2 764 2 925
Shareholders' interest 13 165 11 731 11 889
Minority interest in subsidiaries 2 143 1 808 1 887
Equity 15 308 13 539 13 776
Non-current liabilities 7 882 7 098 7 944
Deferred tax 2 685 2 289 2 491
Long-term borrowings 3 795 3 449 4 056
Non-recourse equity-settled BEE borrowings 622 667 654
Provisions 780 693 743
Current liabilities 7 674 6 844 4 823
Trade and other payables (note 5) 3 969 3 454 3 173
Short-term borrowings 3 446 3 193 1 604
Tax 259 197 46
TOTAL EQUITY AND LIABILITIES 30 864 27 481 26 543
Number of shares (000)
– in issue 135 113 135 113 135 113
– weighted average (basic) 115 083 114 139 114 388
– weighted average (diluted) 115 083 114 139 114 388
8

Statement of Cash Flows
Condensed consolidated Unaudited Unaudited Audited
6 months to 6 months to 12 months to
30 September 30 September 31 March
Rmillion 2015 2014 2015
Operating profit 1 361 1 510 2 089
Surplus on disposal of property, plant and equipment (34) (29) (77)
Depreciation 314 309 564
Growing crops and other non-cash items 651 623 1
Operating cash flow 2 292 2 413 2 577
Change in working capital (2 389) (1 837) (44)
Cash flow from operations (97) 576 2 533
Tax payments (109) (214) (353)
Net financing costs (314) (297) (617)
Cash flow from operating activities (520) 65 1 563
Expenditure on property, plant and equipment:
New (268) (75) (203)
Replacement (296) (143) (509)
Major plant overhaul cost changes (57) (38) (20)
Capital expenditure on growing crops (18) (10) (76)
Other capital items 45 30 93
Net cash flow before dividends and financing activities (1 114) (171) 848
Dividends paid (235) (237) (429)
Net cash flow before financing activities (1 349) (408) 419
Borrowings raised 1 550 1 210 218
Non-recourse equity-settled BEE borrowings (32) (24) (37)
Shares issued 1 1
Settlement of share-based payment awards (33) (149) (175)
Net increase in cash and cash equivalents 136 630 426
Balance at beginning of period 1 668 1 067 1 067
Foreign currency translation 163 41 175
Cash and cash equivalents at end of period 1 967 1 738 1 668
9
Condensed consolidated Unaudited Unaudited Audited
6 months to 6 months to 12 months to
30 September 30 September 31 March
Rmillion 2015 2014 2015
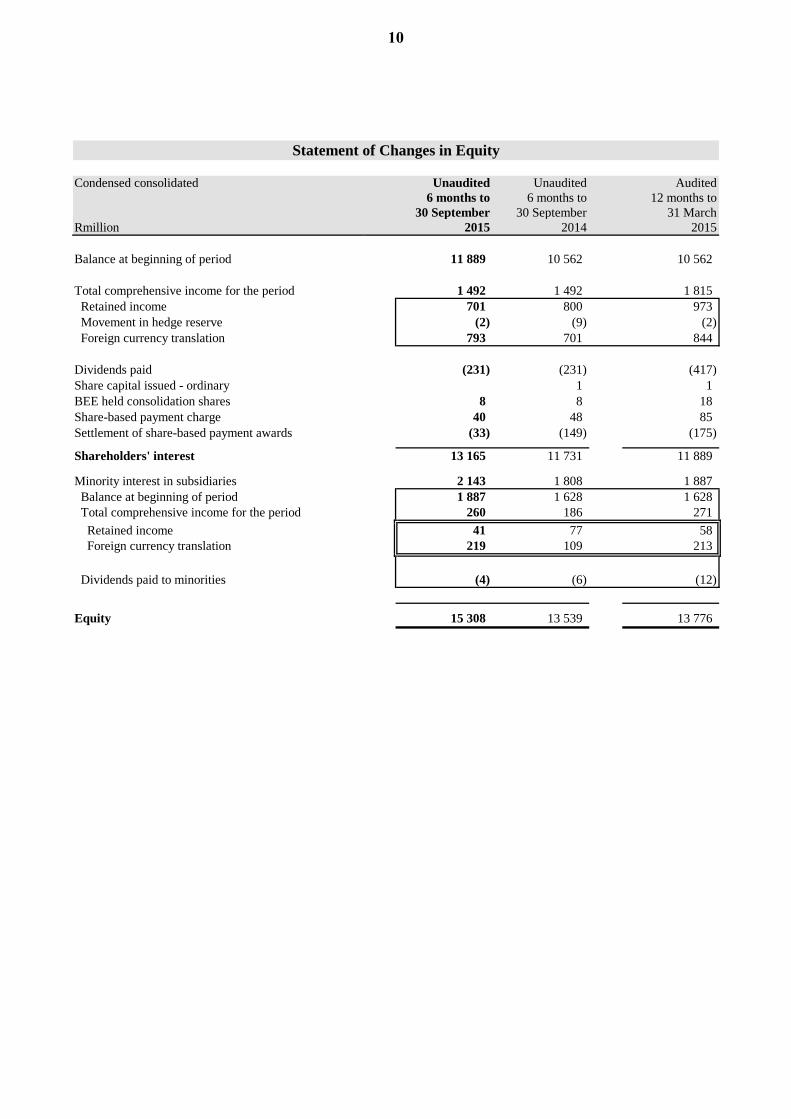
Balance at beginning of period 11 889 10 562 10 562
Total comprehensive income for the period 1 492 1 492 1 815
Retained income 701 800 973
Movement in hedge reserve (2) (9) (2)
Foreign currency translation 793 701 844
Dividends paid (231) (231) (417)
Share capital issued - ordinary 1 1
BEE held consolidation shares 8 8 18
Share-based payment charge 40 48 85
Settlement of share-based payment awards (33) (149) (175)
Shareholders' interest 13 165 11 731 11 889
Minority interest in subsidiaries 2 143 1 808 1 887
Balance at beginning of period 1 887 1 628 1 628
Total comprehensive income for the period 260 186 271
Retained income 41 77 58
Foreign currency translation 219 109 213
Dividends paid to minorities (4) (6) (12)
Equity 15 308 13 539 13 776
Statement of Changes in Equity
10

Statement of Other Comprehensive Income
Condensed consolidated Unaudited Unaudited Audited
6 months to 6 months to 12 months to
30 September 30 September 31 March
Rmillion 2015 2014 2015
Net profit for the period 742 877 1 047
Other comprehensive income 1 010 801 1 039
Items that will not be reclassified to profit or loss:
Foreign currency translation 1 012 810 1 057
Actuarial loss (23)
Tax on actuarial loss 7
Items that may be reclassified subsequently to profit or loss:
Hedge reserve (3) (13) (3)
Tax on movement in hedge reserve 1 4 1
Total comprehensive income for the period 1 752 1 678 2 086
Total comprehensive income attributable to:
Shareholders of Tongaat Hulett 1 492 1 492 1 815
Minority (non-controlling) interest 260 186 271
1 752 1 678 2 086
11

Notes
Condensed consolidated Unaudited Unaudited Audited
6 months to 6 months to 12 months to
30 September 30 September 31 March
Rmillion 2015 2014 2015
1. Net financing costs
Interest paid (350) (331) (685)
Interest capitalised 3 1
Interest received 33 34 67
(314) (297) (617)
2. Tax
Normal (316) (267) (261)
Deferred 11 (69) (164)
(305) (336) (425)
3. Headline earnings
Profit attributable to shareholders 701 800 989
Adjusted for:
Capital profit on disposal of land and buildings (26) (21) (48)
Capital profit on other items (2) (2)
(Surplus)/loss on disposal of property, plant and equipment (4) (6) 4
Tax on the above items 2 2 2
673 773 945
4. Growing crops
5. Trade and other payables
6. Capital expenditure commitments
Contracted 261 192 163
Approved 338 238 478
599 430 641
7. Operating lease commitments 94 88 82
8. Guarantees and contingent liabilities 68 42 33
9. Basis of preparation and accounting policies
Included in trade and other payables is the maize obligation (interest bearing) of R573 million (30 September 2014: R494
million and 31 March 2015: R246 million).
Tongaat Hulett has adopted all the new or revised accounting pronouncements as issued by the IASB which were effective for
Tongaat Hulett from 1 January 2015. The adoption of these standards had no recognition and measurement impact on the
financial results.
The condensed consolidated unaudited results for the half-year ended 30 September 2015 have been prepared in accordance with
the International Financial Reporting Standard (IFRS) IAS 34 Interim Financial Reporting, the SAICA Financial Reporting
Guides as issued by the Accounting Practices Committee, Financial Reporting Pronouncements as issued by the Financial
Reporting Standards Council and the requirements of the Companies Act of South Africa. The report has been prepared using
accounting policies that comply with IFRS which are consistent with those applied in the financial statements for the year ended
31 March 2015 and were prepared under the supervision of the Chief Financial Officer, M H Munro CA (SA).
Growing crops, comprising roots and standing cane, are measured at fair value which is determined using an estimate of cane
yields and prices. Changes in fair value are recognised in profit or loss. A change in yield of one ton per hectare on the estimated
yield of 83 tons cane per hectare (30 September 2014: 86 tons per hectare and 31 March 2015: 83 tons per hectare) would result
in a R25 million (30 September 2014: R22 million and 31 March 2015: R25 million) change in fair value while a change of one
percent in the cane price would result in a R26 million (30 September 2014: R20 million and 31 March 2015: R26 million)
change in fair value.
12
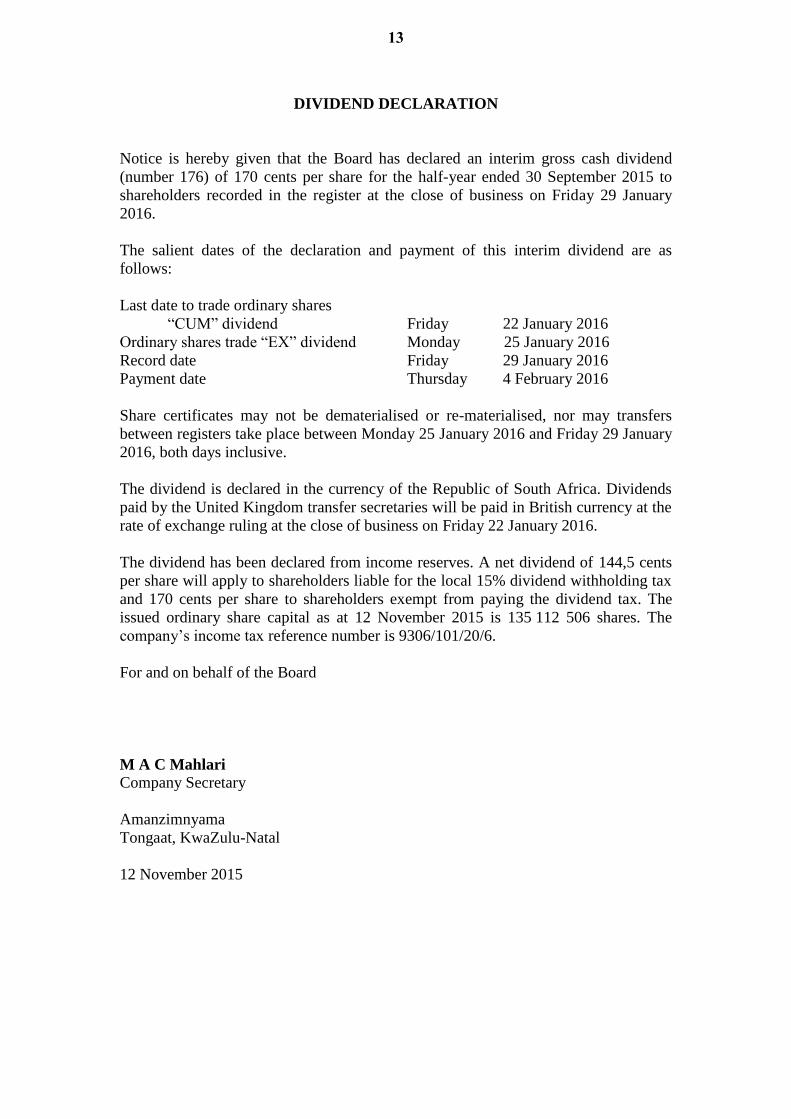
DIVIDEND DECLARATION
Notice is hereby given that the Board has declared an interim gross cash dividend
(number 176) of 170 cents per share for the half-year ended 30 September 2015 to
shareholders recorded in the register at the close of business on Friday 29 January
2016.
The salient dates of the declaration and payment of this interim dividend are as
follows:
Last date to trade ordinary shares
“CUM” dividend Friday 22 January 2016
Ordinary shares trade “EX” dividend Monday 25 January 2016
Record date Friday 29 January 2016
Payment date Thursday 4 February 2016
Share certificates may not be dematerialised or re-materialised, nor may transfers
between registers take place between Monday 25 January 2016 and Friday 29 January
2016, both days inclusive.
The dividend is declared in the currency of the Republic of South Africa. Dividends
paid by the United Kingdom transfer secretaries will be paid in British currency at the
rate of exchange ruling at the close of business on Friday 22 January 2016.
The dividend has been declared from income reserves. A net dividend of 144,5 cents
per share will apply to shareholders liable for the local 15% dividend withholding tax
and 170 cents per share to shareholders exempt from paying the dividend tax. The
issued ordinary share capital as at 12 November 2015 is 135 112 506 shares. The
company’s income tax reference number is 9306/101/20/6.
For and on behalf of the Board
M A C Mahlari
Company Secretary
Amanzimnyama
Tongaat, KwaZulu-Natal
12 November 2015
13