
TonenGeneral Sekiyu K.K. 1H 2005 Financial Results and ...
31
1 TonenGeneral Sekiyu K.K. 1H 2005 Financial Results and Business Strategy August 23, 2005 at TSE Arrows This material contains forward-looking statements based on projections and estimates that involve many variables. TonenGeneral operates in an extremely competitive business environment and in an industry characterized by rapid changes in supply-demand balance. Certain risks and uncertainties including, without limitation, general economic conditions in Japan and other countries, crude prices and the exchange rate between the yen and the U.S. dollar, could cause the Company’s results to differ materially from any projections and estimates presented in this publication.
Transcript of TonenGeneral Sekiyu K.K. 1H 2005 Financial Results and ...

1
TonenGeneral Sekiyu K.K.1H 2005 Financial Results andBusiness Strategy
August 23, 2005at TSE Arrows
This material contains forward-looking statements based on projections and estimates that involve many variables. TonenGeneral operates in an extremely competitive business environment and in an industry characterized by rapid changes in supply-demand balance. Certain risks and uncertainties including, without limitation, general economic conditions in Japan and other countries, crude prices and the exchange rate between the yen and the U.S. dollar, could cause the Company’s results to differ materially from any projections and estimates presented in this publication.

2
2
2
Business Overview G. W. Pruessing
1H 2005 Business Results andRevised FY 2005 Financial Forecast W. J. Bogaty
Refining & SupplyJ. Mutoh
ChemicalsD. L. Schuessler

3
Business Overview
G. W. Pruessing
Representative Director, Chairman and President,TonenGeneral Sekiyu K.K.
Japan Chairman of ExxonMobil Group Companies

4
4
4
80
90
100
'01 '02 '03 '04
Five Years since the TonenGeneral MergerIndustry
» Surplus capacity both in refining and marketing; reducing slowly» Crude price rising; sharp increases last 18 months» Low sulfur motor-fuels introduced; 2003 & 2005» Chemicals segment highly profitable from 2004
TonenGeneral has responded to meet industry challenges » Retain/create assets that will produce profits in our core business even in poor
industry environment» Focus on profitability, return, and long-term perspective
363205
85277
482
0
250
500
'00* '01 '02 '03 '04
(100M Yen) TonenGeneral Net Income (Consolidated)
* Tonen+General (unaudited pro forma combined)
Refining Capacity & Motouris’ SS (’01 = 100)
Refining Capacity
Motouris’ SS

5
5
5
9.0
7.77.2
5
6
7
8
9
10
1990 2003 2010
Corporate CitizenshipSafety» The top priority in all our activities
» Commitment to our vision: “Nobody Gets Hurt”
Governance and Integrity» Clear standards of business conduct
» Controls Integrity Management System
» Effective statutory Audit process
» Rigorous internal independent audit
Focus on the environment» Actions to improve energy efficiency and reduce
greenhouse gas emissions in our operations• Global Energy Management System (GEMS)
• Cogeneration
Unit Energy Consumption in refineries (Consolidated)
-14%
Industry Target 10% reduction
Energy consumption (KL)/ APS throughput (KKL)
0.20 0.190.11
0.33
0.09 0.15
0
0.2
0.4
0.6
0.8
1
'00 '01 '02 '03 '04 1H '05
Total Recordable Incident Rate (#/ 0.2Mil Hrs)(TonenGeneral vs ExxonMobil Group,
Refining and Supply )
-14% -20%
ExxonMobil Group
6
6
6
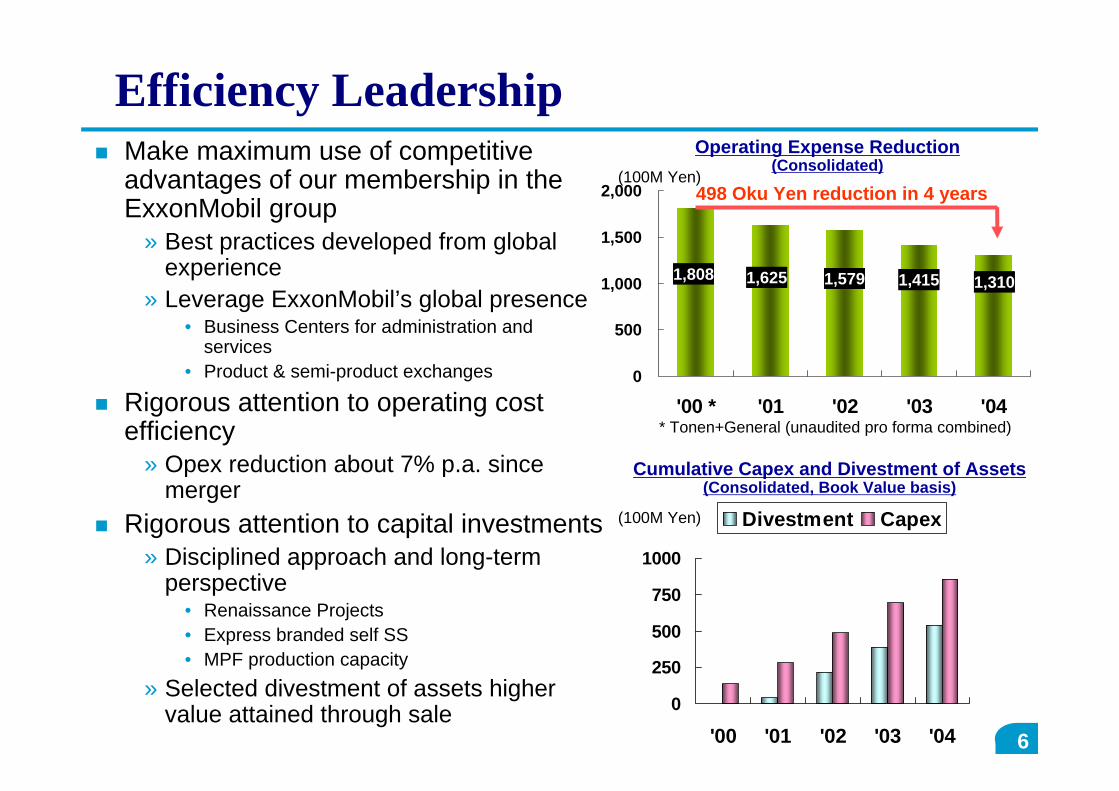
Efficiency LeadershipMake maximum use of competitive advantages of our membership in theExxonMobil group
» Best practices developed from global experience
» Leverage ExxonMobil’s global presence• Business Centers for administration and
services• Product & semi-product exchanges
Rigorous attention to operating cost efficiency
» Opex reduction about 7% p.a. since merger
Rigorous attention to capital investments» Disciplined approach and long-term
perspective• Renaissance Projects• Express branded self SS• MPF production capacity
» Selected divestment of assets higher value attained through sale
1,3101,4151,6251,808 1,579
0
500
1,000
1,500
2,000
'00 * '01 '02 '03 '04
0
250
500
750
1000
'00 '01 '02 '03 '04
Divestment Capex(100M Yen)
Operating Expense Reduction (Consolidated)
* Tonen+General (unaudited pro forma combined)
(100M Yen)
Cumulative Capex and Divestment of Assets (Consolidated, Book Value basis)
498 Oku Yen reduction in 4 years

7
7
7
Industry-Leading ReturnsSuperior returns measured by ROCE
» Pursue global competitiveness as an integrated downstream and chemicals company
» ROCE orientation• Meaningful to examine company performance over a long-period
• Effective to measure the efficacy of prior investment decisions
» Our goal is not to increase profits at all cost but to increase the efficiency of our profitability
5.4%2.5%
8.4%
15.2%
0.0%
5.0%
10.0%
15.0%
'01 '02 '03 '04
TonenGeneral Major listed oil co. ave.
ROCE: Net income before interest and after tax/(Average shareholders’ equity+Average net debt)
ROCE Trends (TonenGeneral vs Major listed oil co. average)
» Concentrate capital on our core businesses where we have commercial and technical competitive advantages and expertise

8
8
8
Our principles» Company wealth not required in our business should be returned to shareholders» Balance creation of long-term shareholder value and distributions
Superior Shareholder Distributions
From cash flow generated in the last 4 years:
» 72G yen for capex» 185G yen for distributions (85G yen
for dividends and 100G yen for share buy back)
Prudent review of trends in the business environment and analysis of best mix and timing of distributions
Share Buy Back
Dividends
Free Cash Flow & Distributions(Cumulative)
(100M Yen)
‘01 ‘02 ‘03 ‘04
1,000
2,000 Free Cash Flow
9
9
9
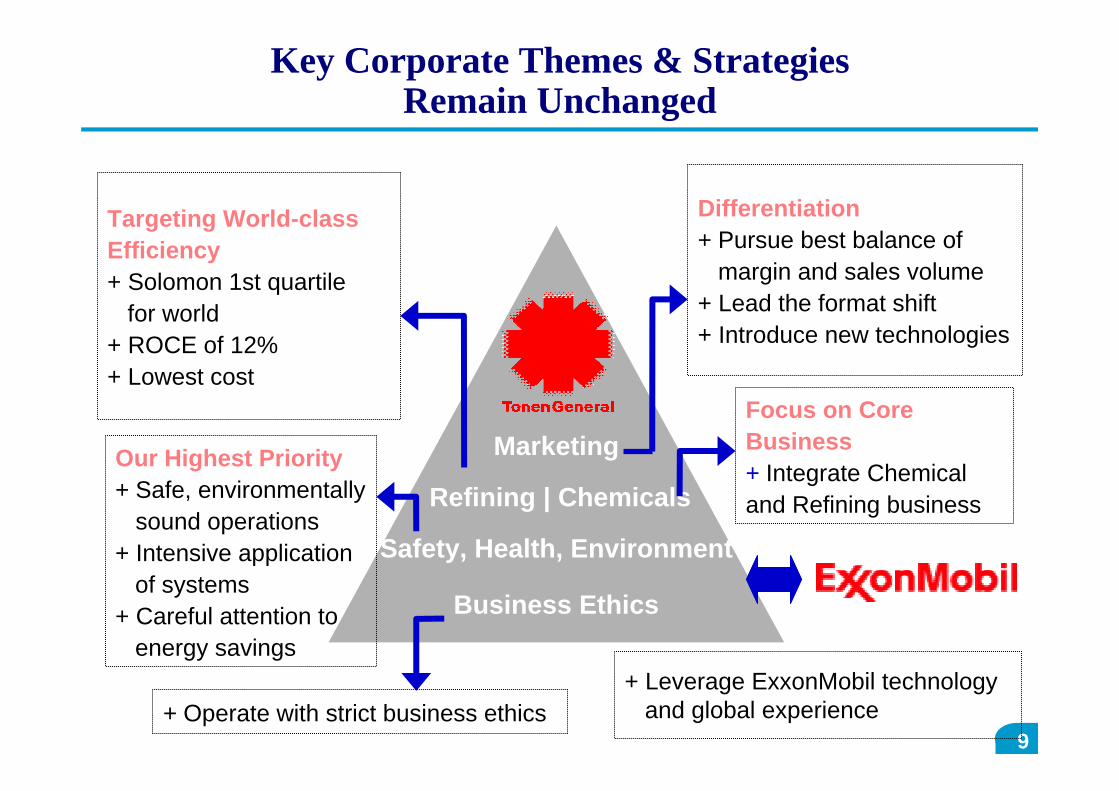
Marketing
Refining | Chemicals
Safety, Health, Environment
Business Ethics
Targeting World-class Efficiency+ Solomon 1st quartile
for world+ ROCE of 12%+ Lowest cost
Our Highest Priority+ Safe, environmentally
sound operations+ Intensive application
of systems+ Careful attention to
energy savings
Key Corporate Themes & Strategies Remain Unchanged
+ Leverage ExxonMobil technologyand global experience+ Operate with strict business ethics
Differentiation + Pursue best balance of
margin and sales volume+ Lead the format shift+ Introduce new technologies
Focus on Core Business+ Integrate Chemical and Refining business

10
1H 2005 Business Results andRevised FY 2005 Financial Forecast
W. J. Bogaty
Director,TonenGeneral Sekiyu K.K.
Representative Director and Vice President,ExxonMobil Y.K.
11
11
11
200
400
600
800
1000
1200
1400
03/7 03/10 04/1 04/4 04/7 04/10 05/1 05/4 05/7
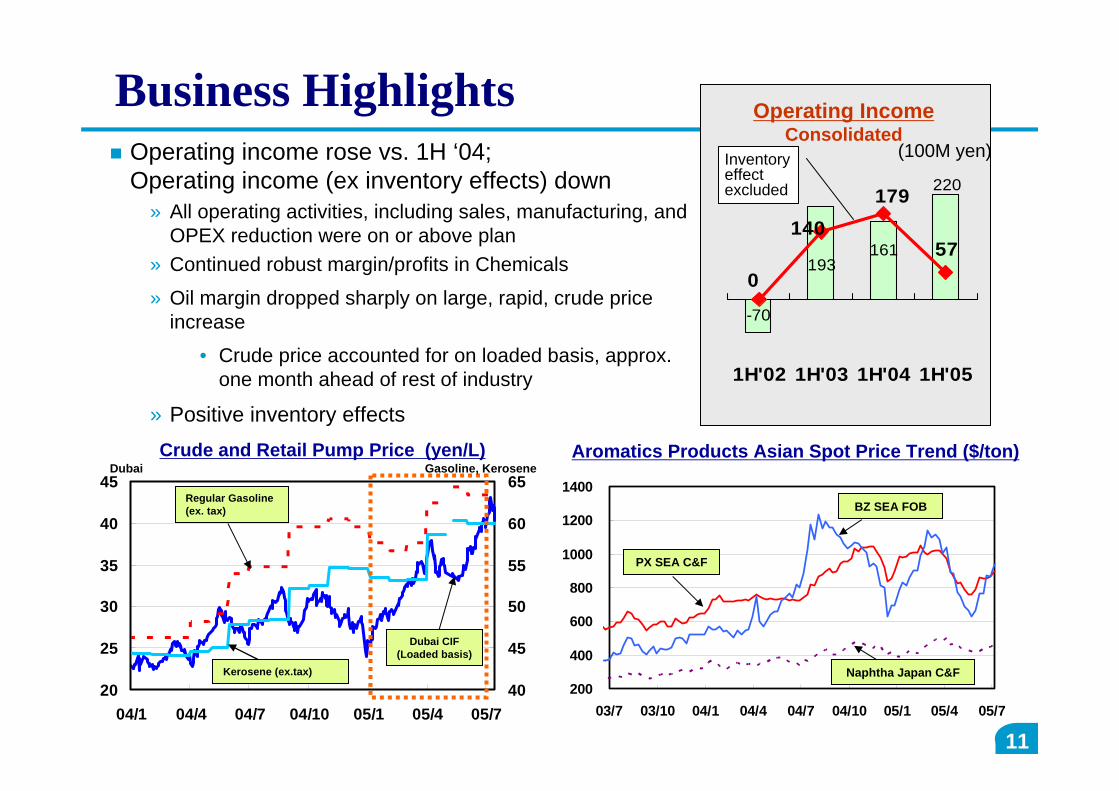
Business HighlightsOperating income rose vs. 1H ‘04;Operating income (ex inventory effects) down
» All operating activities, including sales, manufacturing, and OPEX reduction were on or above plan
» Continued robust margin/profits in Chemicals
» Oil margin dropped sharply on large, rapid, crude price increase
• Crude price accounted for on loaded basis, approx. one month ahead of rest of industry
» Positive inventory effects
220
161193
-70
140
057
179
1H'02 1H'03 1H'04 1H'05
(100M yen)Inventory effect excluded
Operating IncomeConsolidated
20
25
30
35
40
45
04/1 04/4 04/7 04/10 05/1 05/4 05/740
45
50
55
60
65
Aromatics Products Asian Spot Price Trend ($/ton)Crude and Retail Pump Price (yen/L)
Regular Gasoline (ex. tax)
Dubai CIF (Loaded basis)
PX SEA C&F
Naphtha Japan C&FKerosene (ex.tax)
BZ SEA FOB
Dubai Gasoline, Kerosene

12
12
12
(100M yen) 1H '04 1H '05 Inc./Dec.
Sales revenue 10,773 13,249 2,475
Operating income 161 220 59
Ordinary income 177 239 62
Extraordinary gain/loss 24 -1 -25
Net income 124 148 24
Reverse inventory effects +18 -163 -181
Adjusted operating income 179 57 -122
Oil segment 22 -204 -226Chemical segment 157 261 104
Earnings Results [Consolidated]

13
13
13
13
163
161220
122
48
18
-305
1H '04 Results 1H'04Inventory(reverse)
Sales volume* Margin Chemical Operatingexpense**
1H'05Inventory
1H'05 Results
(100M yen)
Factor Analysis of Operating Income[1H '05 Results vs. 1H'04 Results; Consolidated]
Oil * Major products, per VG14** Excluding change of accounting classification

14
14
14Capacity Utilization (Parent/Consoli.) 79%/76% 86%/80% 85%
Industry1H 2004 1H 2005 Inc./Dec. Inc./Dec.
Gasoline 5,696 5,981 5.0% +1.8%Kerosene 2,134 2,649 24.2% +6.4%Diesel fuel 2,203 2,531 14.9% 0.1%Fuel oil A 2,110 2,058 -2.5% -0.7%Fuel oil C 1,709 1,565 -8.4% -3.0%LPG and others 1,734 1,823 5.1% N/A
General (Marketing) 4,162 4,444 6.8%Esso/Mobil/Kygnus 11,424 12,162 6.5%
Sub Total 15,586 16,606 6.5% 1.1%Others* 3,801 3,741 -1.6%G. Total 19,387 20,347 5.0%
Olefins and others (TCC) 942 939 -0.3%Aromatics (TG) 388 401 3.4%Chemical Total 1,329 1,340 0.8%
by
Prod
uct
by
Cha
nnel
Sales Volume/ Capacity Utilization Most fuels increased versus 1H 2004, especially in Kerosene due to colder winter and absence of turn-aroundsCapacity utilization was higher than 1H 2004
(Consolidated, Excluding Barter)
*Others” includes lube, crude, exports, product exchanges within ExxonMobil Japan Group, etc.
Oil Products
Chemical Products
(Kton)
(Consolidated)
(KKL)

15
15
15
One month lag effect of Crude cost / Inventory Effects
860 KKL
Dec. '04 Jun. '05
[Crude & Products]
Current price - LIFO cost
+19 ¥/L to P/L
¥163 oku positive effect
LIFO profit from Draw-down
Acquired in 2004 or earlier
23.0
28.0
33.0
38.0
43.0
48.0
53.0
Dec.04 Jan.05 May 05 Jun. 05
$/B
BL
TG (Loading Base) Industry (Unloading Base)
Difference $20 /bbl
Sharp rise in crude price (in 1H ‘05: $20/bbl Dubai) triggered one month lag and LIFO gain
TG accounts for crude price on loaded base; this recognizes effects of changes in crude prices about one month earlier than rest of industry
“Lag effect” on Dubai basis was approx. ¥260oku
Net ¥163 oku inventory gain in operating income in from draw-down of crude and products
One month lag effects

16
16
16
421 422
1,151 1,054 1,004 908 856228 193
657571 575
507 454
1,8081,625 1,579
1,415
649 615
1,267
652
1,310
0
500
1,000
1,500
2,000
1H '04 1H '05 2H '05 '00 * '01 '02 '03 '04 '05
Marketing/AdminManufacturing
-30% in 5 years
Operating Expenses [Consolidated]* Tonen+General (unaudited pro forma combined)
Payroll -12Pension expense (Non-cash) -17Fixed asset tax - 6Others -13Change of accounting classification 14(100M yen)
- ¥34 oku
Continued reductions in opex; better than February forecast
Feb Fct1,278
17
17
17
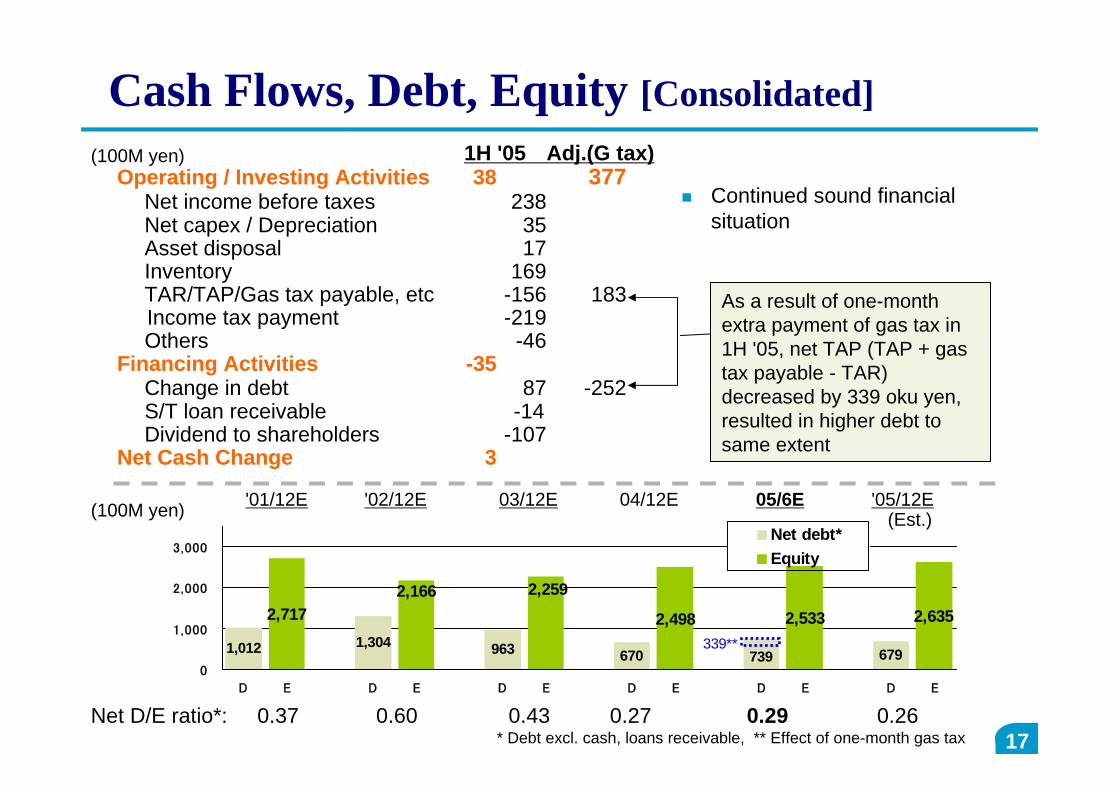
1H '05 Adj.(G tax)Operating / Investing Activities 38 377
Net income before taxes 238Net capex / Depreciation 35Asset disposal 17Inventory 169TAR/TAP/Gas tax payable, etc -156 183Income tax payment -219Others -46
Financing Activities -35Change in debt 87 -252S/T loan receivable -14Dividend to shareholders -107
Net Cash Change 3
Cash Flows, Debt, Equity [Consolidated](100M yen)
As a result of one-month extra payment of gas tax in 1H '05, net TAP (TAP + gas tax payable - TAR) decreased by 339 oku yen, resulted in higher debt to same extent
Continued sound financial situation
2,717 2,498 2,533 2,635
1,012 1,304 963 670 679
2,2592,166
739339**
0
1,000
2,000
3,000
D E D E D E D E D E D E
Net debt*Equity
Net D/E ratio*: 0.37 0.60 0.43 0.27 0.29 0.26
'01/12E '02/12E 03/12E 04/12E 05/6E '05/12E(Est.)
* Debt excl. cash, loans receivable, ** Effect of one-month gas tax
(100M yen)

18
18
18
Revised Assumptions for 2H 2005Fuels Margins Higher than 1H '05 and slightly lower than previous forecast Fuels Sales volumes No change versus previous forecast, slightly higher than 1H’05Chemicals Margins Slightly higher than 1H‘05Chemicals volumes Slightly higher than 1H‘05Operating expense Continuing reduction (No change versus previous forecast)Inventory effects Assume ¥90 oku LIFO gain for full yearCrude cost, FX 52.3 $/BBL(Dubai), 111.6 ¥/$ -- values as of June-end '05
[for sales revenues only]Inventory accounting LIFO/LOCOM
0 12,000KKL
Unit Margin (Fuels)
2H '04 1H '05 2H '05(rev.)
2H '05(prev.)
Sales Volume (Fuels)
2H '04 1H '05 2H '05(rev.)
2H '05(prev.)

19
19
19
(100M yen) '04 act '05 est. 1H act. 2H est.
Sales revenue 23,423 28,150 13,249 14,901
Operating income 632 550 220 330
Ordinary income 686 570 239 331
Extraordinary gain/loss 137 -15 -1 -14
Net income 482 350 148 202
Reverse inventory effects 11 -90 -163 73
Adjusted operating income 643 460 57 403
Oil segment and others 219 -81 -204 123
Chemical segment 424 541 261 280
Revised Earnings Forecast [Consolidated]
632550
340
460
643
297
'03 '04 '05 est
Operating IncomeConsolidated
Inventory effects excluded
(100M yen)
Adjusted operating income for full-year 2005 is projected to decrease by ¥183 oku from 2004Assuming draw-down of inventory from 2004, we anticipate ¥90 oku positive LIFO effect in 2005
20
20
20
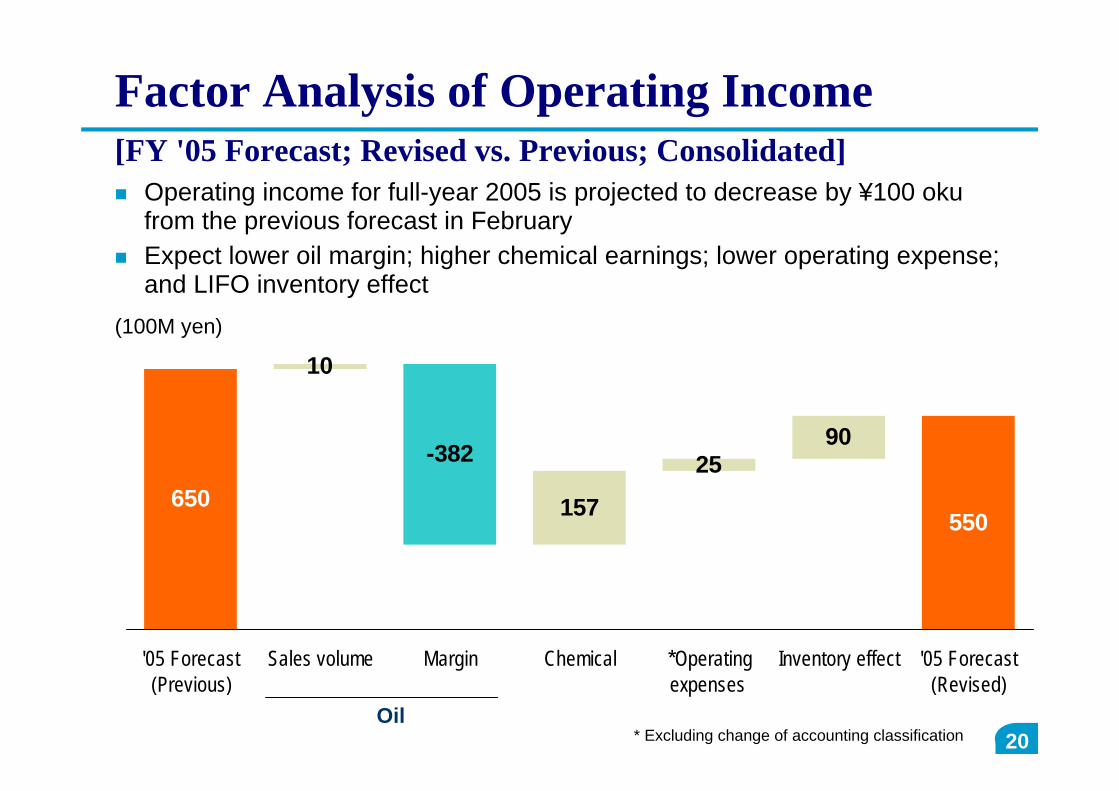
10
157
2590
-382
550650
'05 Forecast(Previous)
Sales volume Margin Chemical *Operatingexpenses
Inventory effect '05 Forecast(Revised)
Oil
Factor Analysis of Operating Income[FY '05 Forecast; Revised vs. Previous; Consolidated]
(100M yen)
Operating income for full-year 2005 is projected to decrease by ¥100 oku from the previous forecast in FebruaryExpect lower oil margin; higher chemical earnings; lower operating expense; and LIFO inventory effect
* Excluding change of accounting classification

21
21
21
Dividend Policy and Projection for 2005Philosophy
» Maintain appropriate capital structure
» Maintain stable dividend payment levels
» Consider free cash flows and needs; net income coverage
» Focus on total return to shareholders
Financial strength and shareholder focus unchanged
» Strong free cash flows and D/E ratio
» Project total dividend of 36 yen per share in 2005
Interim dividend of 18 yen per share and year-end of 18 yen per share
» Continuous close study on various capital structure options in unclear
industry environment

22
Refining & Supply
- Effective Use of ExxonMobil Global Network -
J. Mutoh
Director, Wakayama Refinery ManagerTonen General Sekiyu K.K.
23
23
23
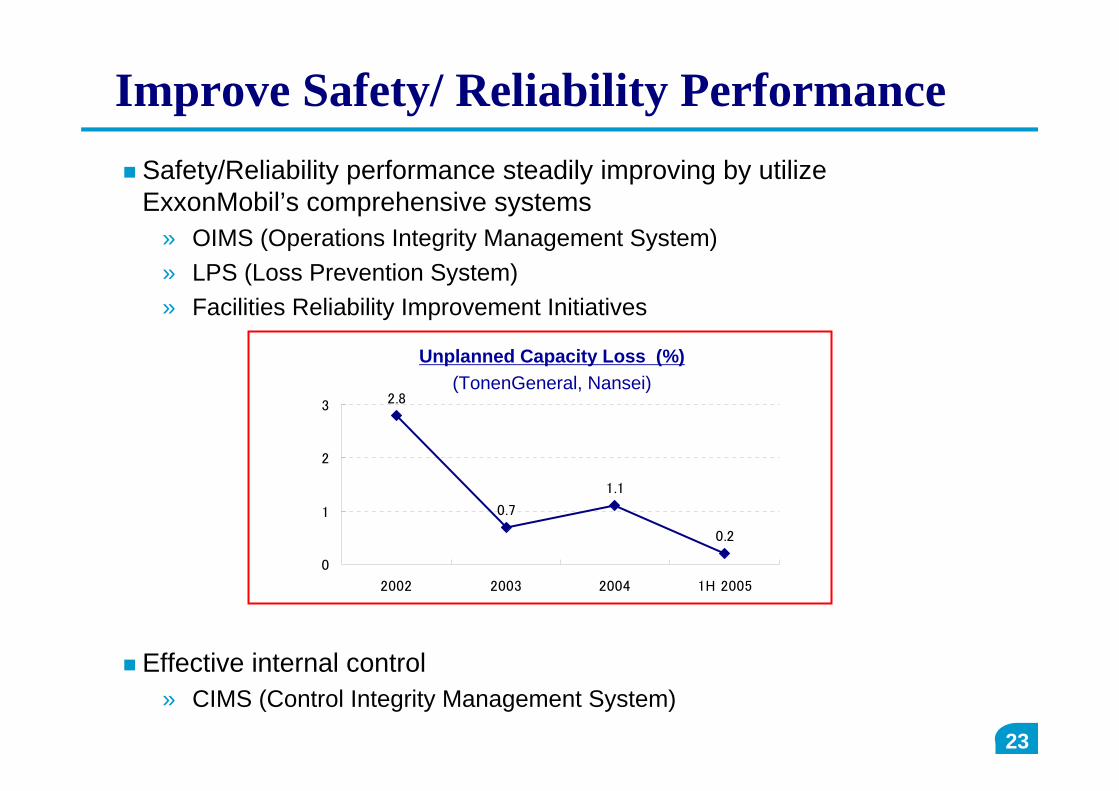
2.8
0.7
1.1
0.2
0
1
2
3
2002 2003 2004 1H 2005
Improve Safety/ Reliability PerformanceSafety/Reliability performance steadily improving by utilize ExxonMobil’s comprehensive systems
» OIMS (Operations Integrity Management System) » LPS (Loss Prevention System) » Facilities Reliability Improvement Initiatives
Effective internal control» CIMS (Control Integrity Management System)
Unplanned Capacity Loss (%)(TonenGeneral, Nansei)

24
24
24
Promote Crude DiversificationUtilize crude supply capability of ExxonMobil
» Crude source diversified to West Africa, Sakhalin, etc» Enjoy supply flexibility of equity crudes
Share knowledge how to process “challenge” crude**)crude oil priced low due to difficulty in processing» Experience of other refineries available» Technical/Engineering support provided
Crude Import Source by Region (FY 2004)
Middle East78%
Middle East89%
Africa15%
Asia, Australia6%
TonenGeneral IndustryOthers
2%
Africa4%
Asia, Australia6%
Others1%
25
25
25
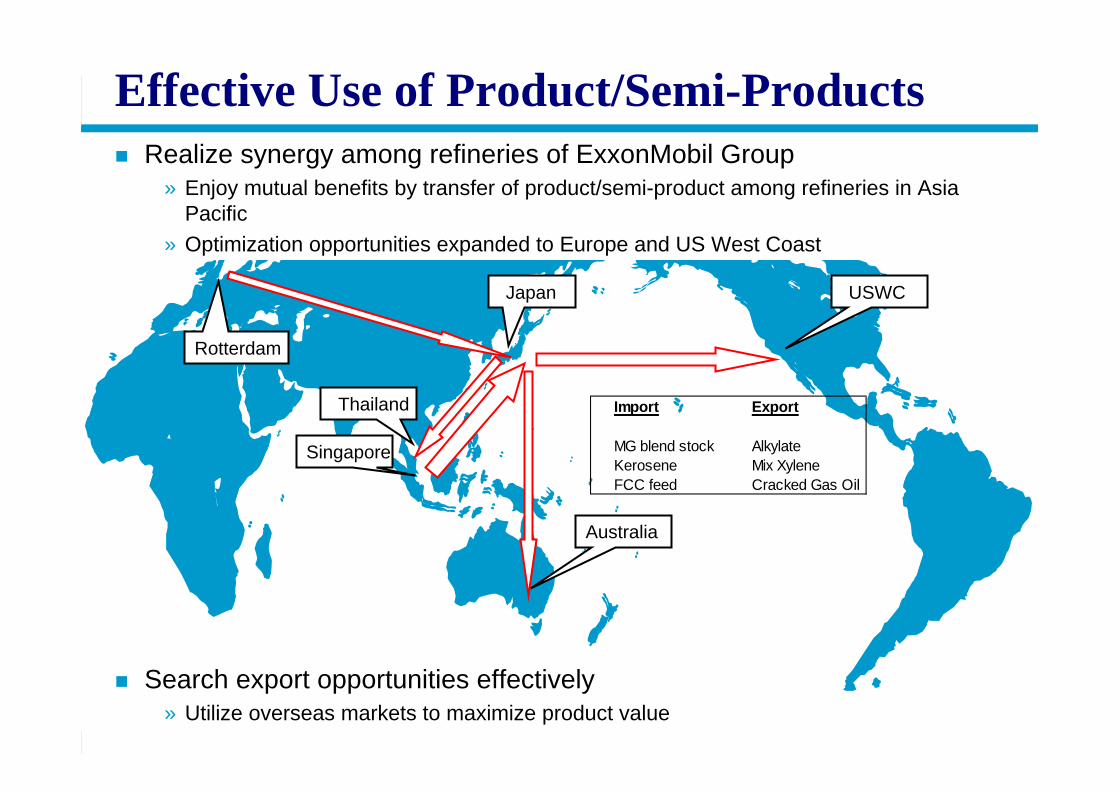
Singapore
USWCJapan
Effective Use of Product/Semi-Products
Thailand
Rotterdam
Realize synergy among refineries of ExxonMobil Group» Enjoy mutual benefits by transfer of product/semi-product among refineries in Asia
Pacific» Optimization opportunities expanded to Europe and US West Coast
Search export opportunities effectively» Utilize overseas markets to maximize product value
Australia
Import Export
MG blend stock AlkylateKerosene Mix XyleneFCC feed Cracked Gas Oil
26
Chemicals
-Specialties Growth and Commodities Optimization-
D.L. Schuessler
Representative Director, President,Tonen Chemical Corp.
Representative Director and Vice President,ExxonMobil Y.K.

27
27
27
Well positioned for the future with specialties investment and commodities optimization
• Grow our specialty business segments-Micro Porous Film, Intermediates, Polyethylene and Adhesives
• Capitalize on strong synergies with downstream operations
• Continuous focus on Cost Management and reliability improvement

28
28
28
Kawasaki -TG/TCC(Aromatics/Olefins)Kawasaki -TG/TCC(Aromatics/Olefins)
Wakayama -TG(Aromatics/Olefins)
Wakayama -TG(Aromatics/Olefins)
Sakai -TG(Aromatics/Olefin)
Sakai -TG(Aromatics/Olefin)
Grow Specialty Business SegmentsProduction Capacity (KTA)
NUC(Polyethylene)NUC(Polyethylene)
Nasu -TCN(Micro Porous Film)
Nasu -TCN(Micro Porous Film)
Commodity
Specialty
Focused on specialty business growth through investments in Micro Porous Film, Intermediates, Specialty Polyethylene and Adhesive business segments
» Micro Porous Film expansion» Intermediates/Adhesives/Polyethylene specialty product debottleneck projects
Sakai-TG(Intermediates)
Sakai-TG(Intermediates)
Kawasaki -TCC(Intermediates/Adhesives)
Kawasaki -TCC(Intermediates/Adhesives)
0
200
400
600
800
1000
1200
1400
1600
Olefins
Arom
atics
Polym
ers
Intermediates
Specialty
Commodity

29
29
29
Capitalized on Strong Synergies with Downstream Operation
Fully utilize Aromatics and Olefins CapacityKawasaki Olefins feed flexibility/optimization projectsWakayama/Sakai Aromatics capacity creep/efficiency projects
» Strategy delivering results -Xylene/Benzene production in 2005 will increase by 13% vs. ’03
ktonXylene /BZ Production
0
100
200
300
400
500
600
01 02 03 04 05 Plan

30
30
30
Continuous Focus on Cost Management
Achieving 5% per year fixed cost reduction through restructuring and refining/chemicals synergies
111
92
100100
90
95
100
105
110
115
2002 ACT 2003 ACT 2004 ACT 2005 OL
Index
TCC Fixed Cost
5% Decline

31
31
31
Strategy has delivered increase in Chemical Earnings
0
10
20
30
40
50
60
2001 2002 2003 2004 05OL
CommoditiesSpecialties
Commodities earnings improved through volume growth, cost reduction, feedstock optimization, and improved market environmentSpecialties earnings growth driven by recent investments in additional capacity
Bil. Yen TonenGeneral/TCC Chemicals Operating Profit Contribution to 2004 Earnings


![Corporate Report 2016[Year ended December 31, 2015 ... · Corporate Report 2016[Year ended December 31, 2015] ENERGIZING THE FUTURE Showa Shell Sekiyu K.K. Business Model Procurement](https://static.fdocuments.in/doc/165x107/5f0b44ef7e708231d42fae69/corporate-report-2016year-ended-december-31-2015-corporate-report-2016year.jpg)


![Corporate Report Year ended December 31, 2012] Powering ......Powering A New Stage of Growth Corporate Report 2013 [Year ended December 31, 2012] Showa Shell Sekiyu K.K. Corporate](https://static.fdocuments.in/doc/165x107/5f83c3b852cc5b481e25b82b/corporate-report-year-ended-december-31-2012-powering-powering-a-new-stage.jpg)
