tolerant kidney transplant recipients€¦ · insight.jci.org 2 ESEACH ATICLE For this purpose, we...
17
Early expansion of donor-specific Tregs in tolerant kidney transplant recipients Thomas M. Savage, … , Yufeng Shen, Megan Sykes JCI Insight. 2018; 3(22):e124086. https://doi.org/10.1172/jci.insight.124086. Allograft tolerance, in which a graft is accepted without long-term immunosuppression, could overcome numerous obstacles in transplantation. Human allograft tolerance has been intentionally induced across HLA barriers via combined kidney and bone marrow transplantation (CKBMT) with a regimen that induces only transient chimerism. Tregs are enriched early after CKBMT. While deletional tolerance contributes to long-term tolerance, the role of Tregs remains unclear. We have optimized a method for identifying the donor- specific Treg repertoire and used it to interrogate the fate of donor-specific Tregs after CKBMT. We expanded Tregs with several different protocols. Using functional analyses and T cell receptor sequencing, we found that expanding sorted Tregs with activated donor B cells identified the broadest Treg repertoire with the greatest potency and donor specificity of suppression. This method outperformed both alloantigen stimulation with CTLA4Ig and sequencing of CFSE lo cells from the primary mixed lymphocyte reaction. In 3 tolerant and 1 nontolerant CKBMT recipients, we sequenced donor-specific Tregs before transplant and tracked them after transplant. Preexisting donor-specific Tregs were expanded at 6 months after CKBMT in tolerant patients and were reduced in the nontolerant patient. These results suggest that early expansion of donor-specific Tregs is involved in tolerance induction following CKBMT. Research Article Immunology Transplantation Find the latest version: http://jci.me/124086/pdf
Transcript of tolerant kidney transplant recipients€¦ · insight.jci.org 2 ESEACH ATICLE For this purpose, we...

Early expansion of donor-specific Tregs intolerant kidney transplant recipients
Thomas M. Savage, … , Yufeng Shen, Megan Sykes
JCI Insight. 2018;3(22):e124086. https://doi.org/10.1172/jci.insight.124086.
Allograft tolerance, in which a graft is accepted without long-term immunosuppression,could overcome numerous obstacles in transplantation. Human allograft tolerance has beenintentionally induced across HLA barriers via combined kidney and bone marrowtransplantation (CKBMT) with a regimen that induces only transient chimerism. Tregs areenriched early after CKBMT. While deletional tolerance contributes to long-term tolerance,the role of Tregs remains unclear. We have optimized a method for identifying the donor-specific Treg repertoire and used it to interrogate the fate of donor-specific Tregs afterCKBMT. We expanded Tregs with several different protocols. Using functional analysesand T cell receptor sequencing, we found that expanding sorted Tregs with activated donorB cells identified the broadest Treg repertoire with the greatest potency and donor specificityof suppression. This method outperformed both alloantigen stimulation with CTLA4Ig andsequencing of CFSElo cells from the primary mixed lymphocyte reaction. In 3 tolerant and 1nontolerant CKBMT recipients, we sequenced donor-specific Tregs before transplant andtracked them after transplant. Preexisting donor-specific Tregs were expanded at 6 monthsafter CKBMT in tolerant patients and were reduced in the nontolerant patient. These resultssuggest that early expansion of donor-specific Tregs is involved in tolerance inductionfollowing CKBMT.
Research Article Immunology Transplantation
Find the latest version:
http://jci.me/124086/pdf

1insight.jci.org https://doi.org/10.1172/jci.insight.124086
R E S E A R C H A R T I C L E
Conflict of interest: EB owns stock in ITB-MED AB Inc. MS is chairman of the scientific advisory board of ITB-MED AB Inc.
License: Copyright 2018, American Society for Clinical Investigation.
Submitted: August 7, 2018 Accepted: October 10, 2018 Published: November 15, 2018
Reference information: JCI Insight. 2018;3(22):e124086. https://doi.org/10.1172/jci.insight.124086.
Early expansion of donor-specific Tregs in tolerant kidney transplant recipientsThomas M. Savage,1 Brittany A. Shonts,1 Aleksandar Obradovic,1 Susan Dewolf,1 Saiping Lau,1 Julien Zuber,1 Michael T. Simpson,1 Erik Berglund,1 Jianing Fu,1 Suxiao Yang,1 Siu-Hong Ho,1 Qizhi Tang,2 Laurence A. Turka,3,4 Yufeng Shen,5 and Megan Sykes1,6,7
1Columbia Center for Translational Immunology, Department of Medicine, Columbia University Medical Center, New
York, New York, USA. 2Department of Surgery, University of California San Francisco, San Francisco, California, USA. 3Center for Translational Sciences, Department of Surgery, Massachusetts General Hospital/Harvard Medical School,
Boston, Massachusetts, USA. 4Immune Tolerance Network, Bethesda, Maryland, USA. 5Center for Computational Biology
and Bioinformatics, Department of Systems Biology, Columbia University, New York, New York, USA. 6Department
of Microbiology & Immunology, Columbia University Medical Center, Columbia University, New York, New York, USA. 7Department of Surgery, Columbia University Medical Center, Columbia University, New York, New York, USA.
IntroductionOutcomes in organ transplantation are currently challenged both by rejection and the toxicities of the immunosuppression used to prevent it. Transplantation without the need for chronic immunosuppres-sion, a state known as tolerance, would overcome both challenges. Human allograft tolerance has been intentionally induced across HLA barriers via combined kidney and non-myeloablative bone marrow transplantation (CKBMT), an approach designed to induce a state of mixed donor and recipient hema-topoietic chimerism. This approach was used in 2 Immune Tolerance Network–sponsored clinical trials (NKDO3 and ITN036ST), each including 5 recipients with haploidentical related donors, and 7 of the 10 patients were tolerant to their allograft for at least 5 years (1–3). In rodent models, mixed chime-rism was durable, and tolerance depended on intrathymic deletion of donor-reactive T cells (4). Mixed chimerism was transient in the human trials (1, 5), however, suggesting that other mechanisms were involved in tolerance.
Treg-mediated suppression of the anti-donor immune response is one possible mechanism. Tregs were enriched after transplant in biopsies of the grafted kidney relative to conventionally grafted kidneys (1) and were strikingly enriched in the circulation early after transplant, comprising up to 75% of circu-lating CD4+ T cells at 2 weeks (6, 7). Furthermore, in vitro data suggested a role for suppression by Tregs in tolerance up to 1 year after transplant but not later (6), when deletional tolerance appeared to play a significant role (8). The precise role and fate of donor alloantigen-specific Tregs, however, was unclear. In this study, we aimed to identify and assess the expansion of donor-specific Tregs following CKBMT.
Allograft tolerance, in which a graft is accepted without long-term immunosuppression, could overcome numerous obstacles in transplantation. Human allograft tolerance has been intentionally induced across HLA barriers via combined kidney and bone marrow transplantation (CKBMT) with a regimen that induces only transient chimerism. Tregs are enriched early after CKBMT. While deletional tolerance contributes to long-term tolerance, the role of Tregs remains unclear. We have optimized a method for identifying the donor-specific Treg repertoire and used it to interrogate the fate of donor-specific Tregs after CKBMT. We expanded Tregs with several different protocols. Using functional analyses and T cell receptor sequencing, we found that expanding sorted Tregs with activated donor B cells identified the broadest Treg repertoire with the greatest potency and donor specificity of suppression. This method outperformed both alloantigen stimulation with CTLA4Ig and sequencing of CFSElo cells from the primary mixed lymphocyte reaction. In 3 tolerant and 1 nontolerant CKBMT recipients, we sequenced donor-specific Tregs before transplant and tracked them after transplant. Preexisting donor-specific Tregs were expanded at 6 months after CKBMT in tolerant patients and were reduced in the nontolerant patient. These results suggest that early expansion of donor-specific Tregs is involved in tolerance induction following CKBMT.

2insight.jci.org https://doi.org/10.1172/jci.insight.124086
R E S E A R C H A R T I C L E
For this purpose, we sought to develop a T cell receptor sequencing–based approach to identifying donor-specific Tregs prior to transplant. Individual T cells have a single T cell receptor β chain (TCRβ) and 1 or 2 α chains. Sequencing of the CDR3 region of the TCRβ chain, therefore, approximates identification of T cell clones, allowing tracking of T cell clones with antigen specificity. Identification of donor-specific Tregs is challenged by the relatively small number of Tregs in the circulating pool, constituting approxi-mately 1%–5% of CD4+ T cells, of which only a small fraction would be expected to have donor specific-ity (9–11). We therefore first optimized identification of the donor-specific Treg repertoire by comparing several methods previously developed to expand donor-reactive T cells or Tregs, namely the CFSE–mixed lymphocyte reaction (CFSE-MLR) (8), culture of sorted Tregs with activated donor B cells (12), and MLRs in the presence of CTLA4Ig (13–15). We then interrogated samples from 4 CKBMT subjects using these methods, and we found that donor-specific Tregs expanded at 6 months after CKBMT in each tolerant subject but were reduced as a proportion of CD4+ T cells in the nontolerant subject studied. These results support a role for early expansion of donor-specific Tregs in the induction of tolerance after CKBMT.
ResultsOptimal identification of a donor-specific Treg repertoire. Since Tregs are present in the circulation at low concen-trations, and the number of these cells in a blood sample is limited, our first goal was to determine whether a method of T cell expansion using allogeneic donor stimulators could optimize identification of the reper-toire of donor-specific Tregs. In 3 healthy controls, we compared several methods of expanding allogeneic donor-specific Tregs, from which we sequenced the TCRβ repertoire (Figure 1). For insight into wheth-er Tregs were preexisting or induced from conventional T cells with each method, we performed TCRβ sequencing on unstimulated FACS-sorted cell populations to define the Treg (CD4+CD25+CD127–) and CD4+non-Treg (CD4+CD25–) repertoires (Figure 1A). We have previously developed a method for identi-fying donor-reactive TCRβ sequences through the pretransplant bulk CFSE-MLR (Figure 1B) that we val-idated in CKBMT patients and intestinal transplant recipients (8, 16): donor-reactive TCRβ sequences are defined as ≥5-fold expanded in the CFSE-MLR compared with the unstimulated CD4 repertoire and have a frequency of ≥10–4 in the CFSElo sample, criteria we chose to exclude possible bystander proliferation of high-frequency T cell clones. Different criteria for defining donor-reactive sequences were explored and did not significantly influence results, so these previously defined criteria (8) were retained. “CFSE-MLR Treg” denotes the sequences that are: (i) identified as CD4 donor-reactive via the CFSE-MLR; and (ii) detected in the unstimulated Treg repertoire (Figure 1B). To expand donor-specific Tregs, we generated activated donor B cells via culture of donor peripheral blood mononuclear cells (PBMCs) with irradiated 3T3 cells expressing CD40L in the presence of cyclosporin A and IL-4 (12). These B cells were used as stimulators in a culture of FACS-sorted Tregs and exogenous IL-2 (12). We performed TCRβ sequencing on sorted CD4+CD8–CD25+CD127– cells from day 16 of the Treg culture (Figure 1C); these cells are termed “Tregs with activated donor B cells.” Finally, CD4+CD25+ cells from a primary MLR under cover of CTLA4Ig (first developed with abatacept and now using belatacept) are being used in Treg infusion trials and have been shown to have donor-specific suppressive activity (13–15). Restimulations enhance the potency of these donor-specific Tregs (13, 14). Thus, we also performed TCRβ sequencing on FACS-sorted recipient CD4+CD8–CD25+CD127– cells following a primary 3-day MLR with CTLA4Ig (“CTLA4Ig MLR”) and after a 5-day donor restimulation without CTLA4Ig (“Restimulated CTLA4Ig MLR”) (Figure 1D).
CTLA4Ig MLR identifies the largest and most diverse Treg TCRβ repertoire, while a limited number of Tregs proliferate in the bulk CFSE-MLR. We compared the size and diversity of the TCRβ repertoires derived from Tregs expanded with each method. Sequencing data for each sample are summarized in Supple-mental Table 1; supplemental material available online with this article; https://doi.org/10.1172/jci.insight.124086DS1. Sequences from each expanded population that were detected within unstimulated Treg and CD4+ non-Treg populations are described as “mapping” to the Treg and non-Treg populations, respectively. The primary CTLA4Ig MLR identified the greatest number of unique TCRβ sequences (n = 57,605; 92,312; 42,189) and the greatest number that mapped to the unstimulated Treg repertoire, while the restimulated CTLA4Ig MLR identified the second greatest number of unique sequences (n = 25,357; 18,513; 22,482) and number that mapped to the unstimulated Treg repertoire (Figure 2, A and B, and Supplemental Table 2). The culture of Tregs with activated donor B cells identified the third great-est number of unique sequences (n = 4,841; 8,211; 3,177) and number that mapped to the unstimulated Treg population. The smallest repertoire was identified via the CFSE-MLR Treg method (n = 8; 43; 21);

3insight.jci.org https://doi.org/10.1172/jci.insight.124086
R E S E A R C H A R T I C L E
the bulk CFSE-MLR identified many more non-Treg sequences than Treg sequences, as expected. Thus, the other Treg expansion methods identified many additional Treg TCRβ sequences not found via the CFSE-MLR. To gain further insight into the origin of the CD4+CD25+CD127– cells in each culture, we summed the frequencies from each culture of sequences that mapped to unstimulated Treg and CD4+ non-Treg populations (Figure 2C). As expected, in the total CD4 donor-reactive repertoire identified through the CFSE-MLR, the sequences mapping to the unstimulated non-Treg population had a higher cumula-tive frequency than those that mapped to the unstimulated Treg population. The TCRβ repertoires iden-tified through culture of Tregs with activated donor B cells and from the primary CTLA4Ig MLR had greater sum frequencies mapped to the Treg than the non-Treg repertoires, suggesting that preexisting
Figure 1. Methods to identify the donor-specific Treg repertoire. (A) TCRβ sequencing was performed on unstimulated Tregs and CD4+ non-Tregs from PBMCs to establish the unstimulated Treg and non-Treg repertoires. (B) Bulk CFSE-MLRs were performed to identify the CD4 donor-reactive repertoire — defined as unique TCRβ sequences expanded ≥5-fold from unstimulated CD4 samples and with frequency ≥10–4 in the CFSElo sample — which was compared with the unstimu-lated Treg repertoire from A to determine the “CFSE-MLR Treg” repertoire. (C) Activated (act.) donor B cells were generated, with representative flow cytometry staining demonstrating activation, then irradiated to culture with sorted Tregs. (D) Primary and restimulated CTLA4Ig MLRs were performed as shown.

4insight.jci.org https://doi.org/10.1172/jci.insight.124086
R E S E A R C H A R T I C L E
Tregs are substantially expanded and enriched using these methods. In contrast, the sum frequency of sequences mapping to the non-Treg population was greater than that mapping to the Treg population in the restimulated CTLA4Ig MLR repertoire, suggesting that considerable induction of Tregs from conventional T cells or expansion of conventional T cells had occurred with this method. We deter-mined repertoire diversity by 3 different measures, including clonality, R20 (the proportion of clones that occupy 20% of the sum frequency when the clones are ordered from highest to lowest frequency;
Figure 2. Comparison of donor-specific TCRβ repertoires in healthy controls. (A) Proportional Venn diagrams of the CFSE-MLR Treg repertoire (yellow), culture of Tregs with activated donor B cells (blue), and restimulated (Restim.) CTLA4Ig MLR (red), where n denotes the number of unique TCRβ sequenc-es identified via each method; for the CFSE-MLR Tregs, n is stated among the total number of CD4 donor-reactive sequences. (B) Number and (C) sum frequency of sequences in stated methods mapping to the unstimulated (Unstim.) Treg and CD4+ non-Treg repertoires. (B and C) “Donor-reactive” refers to the total CD4 donor-reactive repertoire identified through the CFSE-MLR. (D) Clonality and (E) R20 of each method. Clonality ranges from 0 (each sequence has equal frequency) to 1 (a single clone). R20 is the proportion of clones that occupy 20% of the sum frequency when the clones are ordered from highest to lowest frequency; a low R20 indicates clonal dominance. (F–J) Jenson-Shannon divergence (JSD) of the top 100 unique TCRβ sequences ranked by frequency in each method compared with the TCR repertoire identified via (F) unstimulated Tregs, (G) CFSE-MLR Treg repertoire, (H) culture of Tregs with activated donor B cells, (I) primary CTLA4Ig MLR, and (J) restimulated CTLAIg MLR. (A–J) Data from 3 independent healthy controls.

5insight.jci.org https://doi.org/10.1172/jci.insight.124086
R E S E A R C H A R T I C L E
a low R20 indicates clonal dominance), and the slope of the abundance plots (17). The results of all 3 measurements showed reduced diversity and increased clonal dominance in the TCRβ repertoire identified through the Treg culture with activated donor B cells relative to the restimulated CTLA4Ig MLR; both of these were less diverse and more clonally dominated than the unstimulated Treg repertoires and the prima-ry CTLA4Ig MLR repertoires (Figure 2, D and E, and Supplemental Figure 1). Thus, these data indicate that the primary and restimulated CTLA4Ig MLRs provide the largest and most diverse TCRβ repertoires and identify the most preexisting Tregs, but the restimulated CTLA4Ig MLR may also considerably expand conventional T cells and/or induce Tregs from conventional T cells, while the Treg culture with activated donor B cells favors expansion of a more limited repertoire of preexisting Tregs.
The primary CTLA4Ig MLR repertoire resembles that of unstimulated Tregs, while other methods identify largely divergent repertoires. We next sought to distinguish whether the methods identified common dominant clones or whether each expanded different T cell clones. Some TCRβ sequences were common to the CFSE-MLR Tregs, the Tregs expanded with activated donor B cells, and the restimulated CTLA4Ig MLR repertoires, and much of the CFSE-MLR Treg repertoire was detected via the other methods (Figure 2A and Supple-mental Table 3). Common TCRβ sequences, however, were generally of low frequency in each method, although the primary CTLA4Ig MLR and the unstimulated Treg repertoires appeared to share a large num-ber of high-frequency sequences (Supplemental Figure 2). We quantified the divergence of the repertoires to each other and to the unstimulated Treg repertoire using the Jensen-Shannon divergence (JSD), which ranges from 0 for identical samples to 1 for completely different samples. We focused on the top 100 TCRβ sequences ranked by frequency for each method to account for possible divergence due to sampling error. The unstimulated Treg repertoire diverged greatly from the CFSE-MLR Tregs, Treg culture with activated donor B cells, and the restimulated CTLA4Ig MLR repertoires, consistent with donor-specific enrichment, but did not diverge markedly from the primary CTLA4Ig MLR (Figure 2, F and J). The expansion methods identified repertoires that were largely distinct from each other, including substantial divergence between the primary and restimulated CTLA4Ig MLRs (Figure 2, G–J). Finally, we assessed whether there were common dominant sequences. Among the most frequent 10 sequences in each method, shared sequences were only observed between the CFSE-MLR Tregs and the Treg culture with activated donor B cells; 0, 2, and 0 sequences were overlapping between these methods in healthy controls 1, 2, and 3, respectively. Thus, shared dominant sequences were generally not identified across the methods.
Tregs expanded with activated donor B cells are more potent specific suppressors of the anti-donor response than those from the restimulated CTLA4Ig MLR. We characterized the cultures by comparing their phenotype and functionality. We observed lower Foxp3 expression among CD4+CD25+CD127– cells in the restimulated CTLA4Ig MLR than in the other cultures and unstimulated Tregs (Figure 3, A and B), suggesting that Tregs were induced from conventional T cells and/or conventional T cells expanded in this culture, con-sistent with the higher cumulative frequency in these cultures of sequences mapping to the unstimulated non-Treg than Treg populations (Figure 2C).
In vitro suppression assays were carried out using cells generated from healthy control 1 (Figure 3, C and D, and Supplemental Figure 3). Primary CTLA4Ig MLRs were not assayed due to the large cell numbers required, and healthy controls 2 and 3 were not assayed due to limited cell numbers. CD4+CD25+CD127– cells from the culture of Tregs with activated donor B cells and the restimulated CTLA4Ig MLR demon-strated specific suppression of responses to the original stimulating donor but only weak suppression of responses to HLA-mismatched third party (Figure 3C). Both were more potent than unstimulated Tregs in suppressing anti-donor responses, but Tregs expanded with activated donor B cells were more potent than those derived from the restimulated CTLA4Ig MLR (Figure 3D).
Altogether, our healthy control analysis suggests that although the expansion of Tregs with activated donor B cells identifies a less diverse repertoire than the restimulated CTLA4Ig MLR, the former provide more potent donor-specific suppression and include fewer Tregs that convert from conventional T cells during the culture period. Both of these Treg expansion methods identify larger TCR repertoires than that identified via the CFSE-MLR. On this basis, we identified the culture of Tregs with activated donor B cells as the optimal method for detecting the donor-specific Treg repertoire for tracking.
Repertoire comparisons of donor-specific Tregs expanded by different methods in CKBMT recipients are largely sim-ilar to those in healthy controls. We next compared the repertoires from unstimulated sorted Tregs, bulk CFSE-MLRs (8), Tregs expanded with activated donor B cells, and restimulated CTLA4Ig MLRs on pre-transplant samples of 4 ITN036ST CKBMT patients, the only subjects in the 2 trials (NKDO3 and ITN036ST) from

6insight.jci.org https://doi.org/10.1172/jci.insight.124086
R E S E A R C H A R T I C L E
whom samples were available. Subjects 1, 2, and 4 were tolerant, and subject 5 was nontolerant, having reject-ed the graft at 10 months after CKBMT after the withdrawal of immunosuppression. Sequencing data for each sample are summarized in Supplemental Table 4. We did not analyze the primary CTLA4Ig MLRs in the CKBMT patients, as their TCRβ repertoires were expected to be substantially similar to the unstimulated Treg repertoires (Figure 2F), and these assays required large numbers of cells. The restimulated CTLA4Ig MLR again identified the greatest total number of unique TCRβ sequences and the greatest number that mapped to the Treg population (Figure 4, A and B, and Supplemental Table 5). The second greatest number of such sequences was identified among Tregs expanded with activated donor B cells, and the CFSE-MLR Treg method identified the smallest repertoire. As expected, greater numbers of TCRβ sequences mapped to the unstimulated non-Treg than Treg populations in the bulk CFSE-MLR in 3 of 4 subjects (subjects 1, 2, and 4) (Figure 4B). In all Treg expansion methods, greater numbers of TCRβ sequences mapped to the unstimulated Treg than non-Treg repertoires (Figure 4B and Supplemental Table 5). In the total donor- reactive CD4 repertoire identified via the CFSE-MLR, the sum frequency of sequences mapping to the non-Treg population was greater than that mapping to the Treg population in each subject (Figure 4C). With the exception of subject 1, the repertoires identified via culture of Tregs with activated donor B cells and the restimulated CTLA4Ig MLR had greater sum frequencies of sequences mapping to the Treg than non-Treg populations (Figure 4C). In the restimulated CTLA4Ig MLR assays, the percentage of CD4+ cells that were CD25+CD127– was substantially lower in 3 of 4 CKBMT patients (Figure 4D) than in the healthy controls (Figure 3B). Foxp3 expression among CD25+CD127– cells was greater than 60% in 3 of the 4 patients in both the culture of Tregs with activated donor B cells and the restimulated CTLA4Ig MLR (Figure 4D). Thus, while Treg expansion may have been reduced or outcompeted by conventional T cells in the restimulated CTLA4Ig MLRs, the CD25+CD127– cells expanded by both methods included existing Tregs to a greater extent than induced Tregs or expanded conventional T cells.
Figure 3. Tregs cultured with activated donor B cells have higher Foxp3 expression and are more suppressive of donor-specific responses in vitro. (A) Rep-resentative Foxp3 stain of an unstimulated Treg sample prior to FACS sorting, gated on CD3+CD4+CD8– cells. (B) CD25+CD127– percentage among CD4+ cells and Foxp3 expression among CD4+CD25+CD127– cells from 3 independent healthy controls at the end of each assay assessed by flow cytometry. (C) With either donor or HLA-mismatched third-party T cell–depleted PBMC stimulation, inhibition of CFSE-labeled fourth-party CD3+ T cell proliferation by sorted CD4+CD25+CD127– cells from healthy control 1 at the end of each expansion. (D) Comparison of potency of anti-donor suppression as in C, with unstimulated Treg data summa-rizing 3 experiments, including from healthy control 1. (C and D) Mean ± SEM. Experiment performed in triplicate. (D) *P < 0.05, **P < 0.01, ***P < 0.001 for comparison of Tregs with activated (w/ act.) donor B cells to restimulated CTLA4Ig MLR (2-tailed t test).

7insight.jci.org https://doi.org/10.1172/jci.insight.124086
R E S E A R C H A R T I C L E
Figure 4. Repertoire comparisons in CKBMT patients. (A) Proportional Venn diagrams of the repertoires, where n = the number of unique TCRβ sequences in each method; for the CFSE-MLR Tregs, n is stated among the total CD4 donor-reactive repertoire. (B) Number and (C) sum frequency of sequences in stated methods mapping to the unstimulated Treg and CD4+ non-Treg repertoires. (B and C) “Donor-reactive” refers to the total CD4 donor-reactive rep-ertoire identified through the CFSE-MLR. (D) CD25+CD127– percentage among CD4+ cells and Foxp3 expression among CD4+CD25+CD127– cells at the end of each assay. (E) Clonality and (F) R20 of each method. (G–J) JSD of the top 100 unique TCRβ sequences ranked by frequency comparing each method.
8insight.jci.org https://doi.org/10.1172/jci.insight.124086
R E S E A R C H A R T I C L E
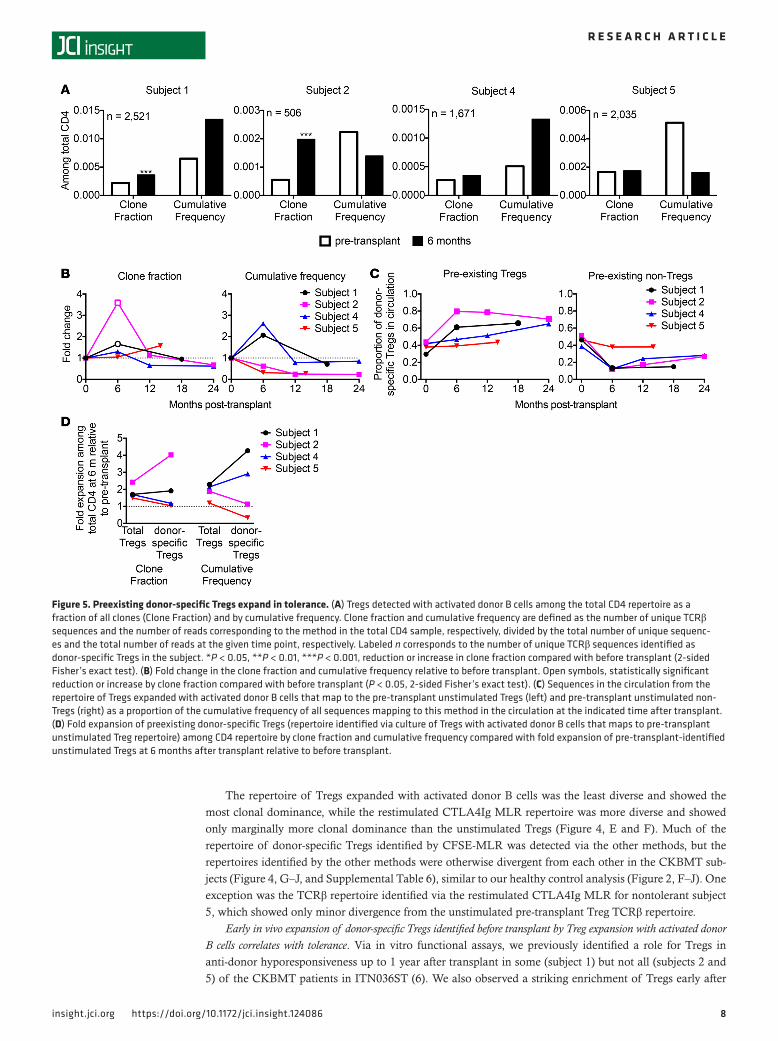
The repertoire of Tregs expanded with activated donor B cells was the least diverse and showed the most clonal dominance, while the restimulated CTLA4Ig MLR repertoire was more diverse and showed only marginally more clonal dominance than the unstimulated Tregs (Figure 4, E and F). Much of the repertoire of donor-specific Tregs identified by CFSE-MLR was detected via the other methods, but the repertoires identified by the other methods were otherwise divergent from each other in the CKBMT sub-jects (Figure 4, G–J, and Supplemental Table 6), similar to our healthy control analysis (Figure 2, F–J). One exception was the TCRβ repertoire identified via the restimulated CTLA4Ig MLR for nontolerant subject 5, which showed only minor divergence from the unstimulated pre-transplant Treg TCRβ repertoire.
Early in vivo expansion of donor-specific Tregs identified before transplant by Treg expansion with activated donor B cells correlates with tolerance. Via in vitro functional assays, we previously identified a role for Tregs in anti-donor hyporesponsiveness up to 1 year after transplant in some (subject 1) but not all (subjects 2 and 5) of the CKBMT patients in ITN036ST (6). We also observed a striking enrichment of Tregs early after
Figure 5. Preexisting donor-specific Tregs expand in tolerance. (A) Tregs detected with activated donor B cells among the total CD4 repertoire as a fraction of all clones (Clone Fraction) and by cumulative frequency. Clone fraction and cumulative frequency are defined as the number of unique TCRβ sequences and the number of reads corresponding to the method in the total CD4 sample, respectively, divided by the total number of unique sequenc-es and the total number of reads at the given time point, respectively. Labeled n corresponds to the number of unique TCRβ sequences identified as donor-specific Tregs in the subject. *P < 0.05, **P < 0.01, ***P < 0.001, reduction or increase in clone fraction compared with before transplant (2-sided Fisher’s exact test). (B) Fold change in the clone fraction and cumulative frequency relative to before transplant. Open symbols, statistically significant reduction or increase by clone fraction compared with before transplant (P < 0.05, 2-sided Fisher’s exact test). (C) Sequences in the circulation from the repertoire of Tregs expanded with activated donor B cells that map to the pre-transplant unstimulated Tregs (left) and pre-transplant unstimulated non-Tregs (right) as a proportion of the cumulative frequency of all sequences mapping to this method in the circulation at the indicated time after transplant. (D) Fold expansion of preexisting donor-specific Tregs (repertoire identified via culture of Tregs with activated donor B cells that maps to pre-transplant unstimulated Treg repertoire) among CD4 repertoire by clone fraction and cumulative frequency compared with fold expansion of pre-transplant-identified unstimulated Tregs at 6 months after transplant relative to before transplant.

9insight.jci.org https://doi.org/10.1172/jci.insight.124086
R E S E A R C H A R T I C L E
transplant by FACS and TCRβ repertoire analysis in all subjects (6, 7). We thus sought to assess the fate of the donor-specific Treg TCRβ sequences identified before transplant in pre- and post-transplant samples.
Within the total CD4 repertoire, the repertoire identified by culture of pre-transplant Tregs with acti-vated donor B cells occupied an increased fraction of circulating unique CD4 clones (“clone fraction”) in tolerant subjects 1 and 2 and an increased sum frequency among circulating CD4 cells (“cumulative fre-quency”) in tolerant subjects 1 and 4 at 6 months after transplant relative to before transplant (Figure 5A). In nontolerant subject 5, in contrast, the clone fraction occupied by this population was unchanged, and the cumulative frequency decreased at 6 months after transplant (Figure 5A). Thus, of the 3 tolerant patients, 3 showed donor-specific Treg expansion by clone fraction and/or cumulative frequency at 6 months, but there was no increase in the nontolerant subject by either measure. This repertoire was represented below pre-transplant levels at later time points in the circulating CD4 pool of tolerant subjects (Figure 5B), when Tregs did not contribute to anti-donor hyporesponsiveness in vitro (6).
Expansion of preexisting Tregs rather than induced Tregs with donor specificity in tolerant patients. We next eval-uated the extent to which donor-specific Tregs in circulation after transplant were preexisting Tregs (map to the pre-transplant unstimulated Tregs) or were among Tregs found to be induced in the in vitro culture methods (map to the pre-transplant unstimulated non-Tregs). In tolerant subjects, the contribution to cir-culating sequences of induced Tregs detected via culture of Tregs with activated donor B cells was reduced after compared with before transplant, while the contribution of preexisting donor-specific Tregs detect-ed with this method increased after transplant (Figure 5C). Similar conclusions applied to Tregs detect-ed among the total CD4 populations, i.e., expansion of preexisting and reduction of Tregs found before transplant to be inducible by activated donor B cells (Supplemental Figure 4). In contrast, the preexisting donor-specific Tregs identified by the B cell expansion method were reduced among total circulating CD4 cells in the nontolerant subject (Supplemental Figure 4A). Together, these data suggest that an expansion of preexisting Tregs with donor specificity, rather than the induction of Tregs from non-Tregs with donor specificity, is associated with tolerance.
Donor-specific Treg expansion is antigen driven and does not only reflect global Treg enrichment after transplant. We next compared the donor-specific Treg repertoire to the total Treg population, which is expanded early after transplant in CKBMT recipients, as we have described previously (6, 7). Among total CD4 cells in circulation, we compared the expansion at 6 months after transplant, relative to before transplant, of pre-existing donor-specific versus total unstimulated pre-transplant sorted Treg sequences. The fold increase in the preexisting donor-specific Tregs was greater than that in total pre-transplant Tregs by clone fraction in subjects 1 and 2 and by cumulative frequency in subjects 1 and 4 (Figure 5D), suggesting antigen-driven expansion of donor-specific Tregs in each of the 3 tolerant patients. Relative numbers of donor-specific Tregs were unchanged by clone fraction and reduced by cumulative frequency in subject 5, while total Tregs detected before transplant occupied an increased proportion of total CD4 cells by both measures.
In summary, preexisting donor-specific Tregs identified via the culture of Tregs with activated donor B cells expanded in the circulating pool early after transplant in tolerant patients beyond the level of global Treg expansion. In the nontolerant subject, donor-specific Tregs were unchanged by clone fraction and reduced by cumulative frequency despite global enrichment of Tregs.
Expansions of Tregs identified by the CFSE-MLR and restimulated CTLA4Ig MLR do not correlate with tol-erance. Our tracking analysis allowed us to interrogate the biological relevance of the TCRβ repertoires identified by the other methods. Within the total CD4 repertoire, the CFSE-MLR Treg repertoire expanded at 6 months after transplant by clone fraction in all subjects and by cumulative frequency in subjects 1, 4, and 5, and was persistently expanded in subject 1 at later time points (Supplemental Figure 5, A and B). The restimulated CTLA4Ig MLR Treg repertoire expanded by clone fraction and cumulative frequency at 6 months in all subjects, returning to pre-transplant levels at later time points (Supplemental Figure 5, C and D), consistent with changes in the total Treg population (7). These data suggest that the fate of the CFSE-MLR Treg and restimulated CTLA4Ig MLR repertoires does not correlate with tolerance, that these methods do not identify the biologically relevant repertoire, and that the restimulated CTLA4Ig MLR rep-ertoire in circulation largely reflects the unstimulated Treg repertoire.
CD4+4-1BB+CD40L– cells among Tregs expanded with activated donor B cells have repertoires similar to the entire population. 4-1BB+CD40L– expression on CD4+ cells has been reported to identify activated antigen-spe-cific Tregs that are highly suppressive in response to alloantigen stimulation (18) and associated with antigen-specific tolerance in humans (19, 20). We detected a CD4+4-1BB+CD40L– population only after

1 0insight.jci.org https://doi.org/10.1172/jci.insight.124086
R E S E A R C H A R T I C L E
restimulating the Treg culture with activated donor B cells (data not shown). This population was Foxp3+ and similarly specific and potent in suppressing the anti-donor response as the CD4+CD25+CD127– cells from the culture (Supplemental Figure 6, A–C). In the CKBMT patients, the CD4+4-1BB+CD40L– cells were purely Foxp3+, while the bulk CD4+CD25+CD127– cells had lower Foxp3 expression (Supplemental Figure 6A). The CD4+4-1BB+CD40L– repertoire was similar to the CD4+CD25+CD127– repertoire from the Treg culture with activated donor B cells in healthy controls and in the CKBMT patients, however (Supplemental Figure 6D). These repertoires were also similar in size as well as measures of diversity and oligoclonality, and the CD4+CD25+CD127– cells similarly had higher sum frequencies of preexisiting Tregs than non-Tregs mapping to the unstimulated repertoire (Supplemental Table 2, Supplemental Table 5, and Supplemental Figure 6, E–G). Tracking this repertoire in circulation of CKBMT recipients yielded results similar to those obtained by analysis of the bulk repertoire of Tregs expanded with activated donor B cells (Supplemental Figure 7). We observed significant expansion by clone fraction in all tolerant subjects of the donor-specific CD4+4-1BB+CD40L– cells (Supplemental Figure 7A), however, while only observing signif-icant expansion by clone fraction in subjects 1 and 2 when analyzing the bulk population (Figure 5A). In sum, these data suggest that the CD4+4-1BB+CD40L– population and the bulk CD4+CD25+CD127– popu-lation in the Treg culture with activated donor B cells provide similar information.
DiscussionDonor-specific Tregs have been shown to promote transplant tolerance in rodent models, but their analysis in tolerant human patients is challenged by the expected small number of alloantigen-specific Tregs sampled in a typical blood specimen. We have attempted to optimize the detection of donor-specific Tregs by deep TCR sequencing and tracked the fate of this repertoire in human CKBMT recipients. Our data point to a role for antigen-driven expansion of donor-specific Tregs early after transplant in tolerant CKBMT recipients.
The optimal donor-specific Treg repertoire was identified via culture of FACS-sorted Tregs with acti-vated donor B cells in healthy controls and in CKBMT patients. While Tregs proliferate in the CFSE-MLR, the repertoire detected with this method is limited by its small size. A substantial fraction of this repertoire, however, overlapped with the other methods of donor-specific Treg identification. Although the restimu-lated CTLA4Ig MLR repertoire was diverse and included the largest number of preexisting Tregs (Figures 2–4), the method appears to induce Tregs from conventional T cells or include conventional T cells, with a significant population showing reduced Foxp3 expression. Tregs detected with this method, moreover, were less potent in suppressing anti-donor responses than those obtained by expanding Tregs with acti-vated donor B cells, consistent with the lower suppressive capabilities of induced Tregs. Furthermore, in the CKBMT subjects, the fate of the restimulated CTLA4Ig MLR Treg repertoire in circulation did not correlate with tolerance, as it expanded and contracted in parallel with the nonspecific total Treg expansion we observed previously (7). The shorter duration of CTLA4Ig MLR cultures compared with the culture of Tregs with activated donor B cells (3 and 8 days versus 16 days) may partially explain the lack of substantial donor-specific enrichment in the former. The TCRβ repertoire detected via culture of Tregs with activated donor B cells identified more preexisting Tregs than non-Tregs, and the cells showed the strongest and most specific suppression of anti-donor responses in vitro. Importantly, post-transplant expansion of this reper-toire in the circulating pool was associated with tolerance. In subject 5, who failed to achieve tolerance on the same protocol, donor-specific Tregs identified by this method occupied a reduced cumulative frequency among total CD4 cells at 6 months after transplant compared with before transplant, despite the overall expansion of Tregs detected by flow cytometry and TCRβ sequencing analysis (6, 7). Collectively, our results suggest that expansion with activated donor B cells identifies the most biologically relevant (in the context of tolerance induction with our protocol) and donor-specific TCRβ repertoire.
A converse 4-1BB upregulation and CD40L downregulation pattern has been reported to identify activated antigen-specific Tregs (18). The repertoire we detected in this population was largely similar to the bulk CD4+CD25+CD127– repertoire expanded with activated donor B cells. Additional approaches using allogeneic B cells for donor-specific Treg expansion include stimulation of naive CD4 T cells (21) or MACS-sorted Tregs (22, 23) with the mTOR inhibitor rapamycin to prevent conventional T cell expansion. Such methods, however, start with a less pure Treg population than that involving FACS-sorted Tregs, as used elsewhere (12) and here. In a liver transplant study, infusion of cells from a 2-week MLR with anti-CD80/CD86 antibody, an approach similar to the CTLA4Ig MLRs performed elsewhere (13–15) and here, promoted tolerance induction in 7 of 10 liver transplant recipients (24). The Treg repertoire associated with

1 1insight.jci.org https://doi.org/10.1172/jci.insight.124086
R E S E A R C H A R T I C L E
this approach was not analyzed, but it may include the induction of Tregs from conventional CD4 cells, as we observed in the healthy control restimulated CTLA4Ig MLRs here.
Sequencing of the T cell receptor is challenged by replication concerns, as results may vary due to tech-nical (sequencing the same sample) and biological (sampling the subject) errors. Our previous studies (8) have demonstrated high reproducibility of the alloreactive repertoire detected against the same donor using blood samples drawn as much as a year apart for normal donors. When comparing the repertoires from each method, we focused on the top 100 TCRβ sequences to minimize sampling error, and observed strik-ing similarity between the primary CTLA4Ig MLR and the unstimulated Treg repertoires despite experi-mental manipulation in the MLR. We sequenced both the bulk CD25+CD127– cells and 4-1BB+CD40L– cells from the culture of Tregs with activated donor B cells, and likewise observed similar results between the repertoires. Although we were unable to directly address biological reproducibility in the current study, these results suggest that technical replication error was minimal.
In the healthy controls, our data suggested induction of Tregs from conventional T cells in the restimulated CTLA4Ig MLRs. We did not observe a similar pattern in the CKBMT patients, however, as Foxp3 expression and sum frequencies mapping to unstimulated Tregs were higher than those map-ping to unstimulated non-Tregs. Our data from the primary CTLA4Ig MLR in healthy controls were consistent with nonspecific expansion of preexisting Tregs. Although these observations may have implications for Treg therapies, our analyses were not aimed at developing or identifying an optimal cell product for infusion.
Our previous studies suggested a role for suppression early after CKBMT in tolerance (6), and in this study we were able to interrogate the possible role of donor-specific Tregs through TCRβ tracking. Preex-isting donor-specific Tregs identified by expansion with activated donor B cells and detected in the sorted pre-transplant Treg repertoire expanded at 6 months after transplant in tolerant patients despite extensive repertoire turnover (8) but were reduced in the nontolerant patient, consistent with a role for donor-spe-cific Tregs in inducing tolerance. The cumulative frequency of these Tregs within the total CD4 repertoire decreased at 6 months after transplant in subject 2, which correlates with our previous failure to detect Treg-mediated suppression early after transplant in this patient (6), but was accompanied by an expansion of donor-specific Tregs by clone fraction. This apparent discrepancy might be explained by donor-specific Treg clonal proliferation, increasing the likelihood of detecting such clones by clone fraction, and entry into the graft, mediating protection but reducing the number of these cells detected in the circulation by cumulative frequency. Preclinical and clinical studies leading to this CKBMT protocol, furthermore, have suggested a role for the kidney allograft in tolerance (6, 25–27), and rodent models identify intragraft accu-mulation of donor-specific Tregs as essential to tolerance (28–31).
Donor-specific Treg expansion could be explained by relative sparing of Tregs during the conditioning for the transplant accompanied by antigen-driven expansion in a lymphopenic host. The T cell–depleting agent used in the conditioning regimen, siplizumab, is a targeted anti-CD2 therapy that spares Tregs relative to memory T cells (M.A. Podestà et al., personal communication), and is thought to contribute to early enrich-ment of Tregs following CKBMT in this regimen (7). We demonstrate here that greater expansion of preex-isting donor-specific Tregs than total Tregs occurred in all 3 tolerant patients, suggesting that antigen-driven expansion of donor-specific Tregs and not just global Treg expansion is responsible for donor-specific Treg enrichment. By focusing on pre-transplant-identified Tregs, our analysis was not confounded by substantial post-transplant de novo generation of Tregs and the post-transplant induction of Tregs from non-Tregs (7). Consistently, we observed that preexisting donor-specific Tregs appear to expand in tolerant patients and did not observe much contribution of Treg induction from conventional donor-reactive T cell clones. The expansion of preexisting donor-specific Tregs in tolerant subjects, therefore, may reflect the relative sparing of preexisting Tregs by siplizumab in the induction protocol (M.A. Podestà et al., personal communication) combined with antigen-driven expansion early after transplant in a lymphopenic recipient. As the T cell reper-toire undergoes extensive turnover and total donor-reactive T cell clones are reduced in tolerant subjects after CKBMT (8), the expansion of donor-specific Tregs is unlikely to be related to T cell turnover. Indeed, the opposite direction of changes in donor-specific total CD4 cells (8) and Tregs at 6 months after transplant sug-gests that there is a markedly reversed donor-specific ratio of Tregs to conventional T cells in tolerant patients.
Donor-specific Tregs may be involved in tolerance following CKBMT in a variety of ways. Tregs promote exhaustion of CD8+ T cells (32), can lyse T effector cells (33–35), and can induce infectious tol-erance to donor antigens in rodent models (29). Our previous results suggested that tolerance in CKBMT

1 2insight.jci.org https://doi.org/10.1172/jci.insight.124086
R E S E A R C H A R T I C L E
recipients involves gradual partial deletion of donor-reactive T cell clones long-term; in contrast, we did not observe reductions in donor-reactive clones in nontolerant subject 5 (8). Taken together, these results suggest that the early expansion of donor-specific Tregs may promote conventional donor-reactive T cell anergy and ultimate deletion, whereas the reduction in preexisting donor-specific Tregs in nontolerant subject 5 allowed the persistence of donor-reactive conventional T cells.
Tracking of the donor-specific Treg repertoire may prospectively identify patients in whom immuno-suppression can be successfully withdrawn. Notably, donor-specific Treg repertoire analyses via culture of Tregs with activated donor B cells distinguished the tolerant and nontolerant subjects at 6 months after transplant, when all subjects were still on immunosuppression (1–3). Furthermore, total donor-reactive T cell clones were not significantly reduced in the circulation of tolerant subject 4 or nontolerant subject 5 at this early time point (8), when donor-specific Treg analyses already distinguished these 2 patients. Total Tregs were shown to be increased in operationally tolerant kidney (36–38) and liver (39) transplant recipients. In particular, memory natural Tregs are increased in operationally tolerant kidney transplant recipients (36), a phenotype that donor-specific Tregs would be expected to acquire after the transplant. Total Tregs are also expanded following a different tolerance induction protocol in HLA-identical kidney transplants (40). In each study, however, it remains unclear whether such cells were donor-specific Tregs; the assay developed here may allow such questions to be addressed.
Our study is limited by the number of patients studied and will require further validation in larger patient populations. The patients studied here all underwent a specific tolerance induction protocol, includ-ing siplizumab, and further analyses in patients undergoing different immunosuppression protocols will be of interest. The lack of expansion of donor-specific Tregs in nontolerant subject 5 despite the overall Treg expansion suggests that Treg sparing is not the only reason for donor-specific Treg expansion in the patients who achieve tolerance. Further exploration of the effects of induction therapy and maintenance immunosuppression on donor-specific Tregs will be of interest, as will the fate of donor-specific Tregs in Treg infusion clinical trials. Further application of the assays described here may be limited by the large number of pre-transplant cells required.
In summary, we have developed an assay to identify the donor-specific Treg repertoire before transplant and then track it in post-transplant blood samples. We obtained evidence for the specific expansion of pre-existing donor-specific Tregs in tolerant subjects, whereas they were reduced in the subject who failed to achieve tolerance. Our approach to identifying donor-specific Tregs prior to transplant avoids dependence on post-transplant functional assays, which have failed to distinguish tolerant and nontolerant subjects (6). This approach has provided mechanistic insights into tolerance achieved via transient mixed chimerism, implicating the early expansion of donor-specific Tregs.
MethodsSample acquisition. Healthy control blood samples were purchased from the New York Blood Center as buffy coats or were obtained from healthy volunteers and processed via a Ficoll density gradient to obtain PBMCs and cryopreserved per the standard laboratory protocol. Laboratory investigations were performed on sub-jects 1, 2, 4, and 5 of study ITN036ST, which included for-protocol PBMC collections before and after trans-plant. The clinical protocol and clinical results for ITN036ST have been described in detail previously (3, 7). Briefly, subjects 1, 2, and 4 were successfully weaned from immunosuppression in the first year after trans-plant and have been maintained immunosuppression-free in the absence of rejection for more than 7 years; subject 5 rejected the graft 10 months after transplant, after the withdrawal of immunosuppression (2, 3).
Flow cytometry. Analytic flow cytometry was performed on a Fortessa or LSR II (BD Biosciences), and FACS was performed on a BD Influx cell sorter. Cultures were assessed for their phenotype with anti-CD3 (clone OKT3; catalog 317324; BioLegend), CD4 (SK3; 563550; BD Biosciences), CD8 (SK1; 557834; BD Biosciences), CD25 (M-A251; 565096; BD Biosciences), CD127 (HIL-7R-M21; 560822; BD Biosciences), CTLA-4 (14D3; 46-1529-41; eBioscience), Foxp3 (236A/37; 12-4777-42; eBioscience), CD40L (24-31; 310820; BioLegend), and 4-1BB (4B4-1; 550890; BD Biosciences) antibodies at the beginning and end of assays. FlowJo software (TreeStar Inc.) was used for analysis. Sorting of unstimulated CD4 and CD8 samples was performed as described previously (8). Unstimulated Treg (CD4+CD25+CD127–) and CD4+ non-Tregs (CD4+CD25–) were sorted as follows: PBMCs were thawed and rested overnight at 37°C with 200 IU/ml IL-2 in CFSE-MLR medium (see CFSE-MLRs below) at a concentration of 3 × 10⁶ cells/ml. In the morning, cells were counted before staining with anti-CD3 (clone OKT3; catalog 552852; BD Biosciences),

1 3insight.jci.org https://doi.org/10.1172/jci.insight.124086
R E S E A R C H A R T I C L E
CD4 (OKT4; 80-0048-t100; Tonbo Biosciences), CD25 (BC96; 302606; BioLegend), CD127 (HIL-7R-M21; 562436; BD Biosciences) and FACS sorting into MLR medium.
DNA isolation and sequencing. Genomic DNA was isolated from sorted cell populations using the QIA-GEN DNeasy Blood and Tissue Kit as per the manufacturer’s instructions. DNA was frozen at –20°C and shipped on dry ice to Adaptive Biotechnologies for high-throughput TCRβ CDR3 sequencing.
CFSE-MLRs. Bulk MLRs, termed here CFSE-MLRs, were performed with CFSE-labeled responder PBMCs and violet V450–labeled stimulator PBMCs as described previously (8). Briefly, whole “recipient” and “donor” PBMCs were thawed and labeled with CFSE and violet V450 dye, respectively. Donor PBMCs were irradiated (35 Gy), and recipient and donor PBMCs were cocultured at a final concentration of 1 × 10⁶ recip-ient and 1 × 10⁶ donor PBMCs per ml CFSE-MLR medium (AIM-V supplemented with 5% AB heat-inacti-vated human serum [Gemini Bio-Products], 0.01 M HEPES, and 50 mM 2-mercaptoethanol) in a humidified 37°C, 5% CO2 incubator. After 6 days, cells were harvested and stained with anti-CD3 (OKT3; BD Bioscienc-es), CD4 (OKT4; Tonbo Biosciences), and CD8 (SK1; BD Biosciences) and FACS-sorted.
Treg culture with activated donor B cells. To generate activated donor B cells, a modified version of a previously published (12) protocol was used. Donor PBMCs were cultured for 10 days with irradiated (46 Gy) human CD40L-expressing 3T3 cells, provided by Qizhi Tang. Donor PBMCs were plated at a concentration of 62,500/ml donor B cells to 250,000/ml irradiated (46 Gy) 3T3-CD40L cells with 1 μg/ml cyclosporin A (Sigma-Aldrich), 8 ng/ml IL-4 (PeproTech), and 5 μg/ml ganciclovir (Sigma-Aldrich) in 2 ml medium (X-Vivo-15 with Recombinant Transferrin Hematopoietic Serum-Free Culture Medium [Thermo Fisher Scientific] supplemented with 100 U/ml human insulin and 10% heat-inactivated human serum) per well in 6-well plates (Thermo Fisher Scientific). Additional medium was added on days 2 and 4 to double the volume, maintaining concentrations of additives. The culture was restimulated on day 7 by harvesting the nonadherent cells and resuspending them at a final concentration of 1 × 10⁶/ml with 100,000/ml irradiated 3T3-CD40L cells and 8 ng/ml IL-4 and 5 μg/ml ganciclovir. Donor B cell cultures were phenotyped with anti-CD19 (clone HIB19; catalog 302224; BioLegend), CD80 (L307.4; 557227; BD Biosciences), CD86 (2331; 555656; BD Biosciences), and HLA-DR (L243; 307644; BioLegend) on days 0 and 10. Unstimulated Treg sorts as described above were then performed on cryopreserved recipient PBMCs using antibodies to CD4, CD25, and CD127, and Tregs were cultured with irradiated (30 Gy) acti-vated donor B cells in the presence of IL-2 (300 IU/ml) in X-VIVO 15 medium (Lonza) supplemented with 10% heat-inactivated human serum, as described previously (12), using the number of Tregs in a previously described plating scheme (41). IL-2 (300 IU/ml) was added to the culture assuming complete consumption on days 2, 5, 7, 9, 11, and 14. The Treg culture was restimulated on day 11 with activated donor B cells (30 Gy) at a concentration of 1 Treg to 4 B cells; to identify the most donor-specific repertoire, we restimulated with activated donor B cells rather than anti-CD3/CD28 beads. On day 16, cells were FACS-sorted into CD4+CD8–CD25+CD127– and CD4+CD8–4-1BB+CD40L– populations using antibodies identified above.
CTLA4Ig MLRs. MLRs under cover of CTLA4Ig were performed as described previously (15). Briefly, recipient and donor PBMCs were thawed, and donor PBMCs were irradiated (35 Gy) and then resuspended 1:1 at 1 × 10⁶ each per ml in medium (RPMI-1640 with l-glutamine [Thermo Fisher Scientific], supplement-ed with 10,000 IU/ml penicillin-streptomycin, 0.01 M HEPES, and 10% heat-inactivated human serum). Following a 72-hour culture with CTLA4Ig (belatacept, McKesson Pharmaceutical) at 40 μg/ml, cells were harvested. For the primary CTLA4Ig MLR, cells were stained and FACS-sorted with anti–HLA-A2 (cat-alog FH0037; One Lambda), HLA-B8 (FH0536A; One Lambda), or HLA-B12 (FH0066; One Lambda), which distinguished donor and recipient cells, and anti-CD4, -CD8, -CD25, and -CD127 as above, and then DNA extraction was performed on recipient+CD4+CD8–CD25+CD127– cells. For the restimulated CTLA4Ig MLR, after the 3-day culture the total cells were washed twice and then restimulated at 1 cell to 1 irradiated donor PBMC (35 Gy) without CTLA4Ig for 5 days, before FACS-sorting of recipient+C-D4+CD8–CD25+CD127– cells and then either DNA extraction or use in a functional suppression assay.
Suppression assays. For stimulator cells, CD3 depletion was performed by MACS as per the manufacturer’s instructions (Miltenyi Biotec) on donor and HLA-mismatched third-party PBMCs. These stimulators were labeled with violet V450 dye as described previously (8) and irradiated (35 Gy). Comparing suppression of proliferation to donor versus third-party stimulation by each method allowed analysis of specificity, while comparing the suppression of proliferation to donor stimulation by each method allowed analysis of potency. For responders, fourth-party T cells were isolated by MACS no touch T cell isolation kit (Miltenyi Biotec) as per the manufacturer’s instructions and labeled with CFSE as described previously (8). The recipient and

1 4insight.jci.org https://doi.org/10.1172/jci.insight.124086
R E S E A R C H A R T I C L E
fourth-party were chosen for differential HLA-A2 expression, and 80,000 fourth-party T cells were placed in each well of a round-bottom 96-well plate. Sorted Tregs were used in varying concentrations. Each well con-tained 80,000 responder fourth-party T cells labeled with CFSE; a corresponding number of Tregs derived from culture of Tregs with activated donor B cells, the restimulated CTLA4Ig MLR, or unstimulated Tregs (40,000 in wells for 1 Treg to 2 responders, 20,000 for 1 Treg to 4 responders, and decreasing with reduced ratios of Tregs to responders); and an equal number of donor or third-party T cell–depleted PBMCs to total T cells in each well, resulting in 1 T cell per 1 antigen-presenting cell (120,000 stimulators for 1 Treg to 2 responders, 100,000 for 1 Treg to 4 responders, and decreasing as number of Tregs decreased) (Supplemental Figure 3). Experiments were plated in triplicate, each well containing 200 μl CFSE-MLR media. Following a 6-day cul-ture, assays were assessed on a BD Fortessa for CFSE dilution of the fourth-party T cells with anti–HLA-ABC APC (clone DX17; catalog 5555555; BD Biosciences), HLA-A2 PE (BB7.2; 558570; BD Biosciences), and CD3, CD4, and CD8 as above.
TCRβ sequencing analysis. The TCRβ sequencing data were retrieved from Adaptive Biotechnologies immunoSEQ software. PCR amplification, read sequencing, and mapping, with bias correction and inter-nal controls, were performed by Adaptive Biotechnologies, returning tabulated read and/or template counts corresponding to unique productive CDR3 sequences across all samples. Sequencing data are available at https://clients.adaptivebiotech.com/pub/savage-2018-jciinsight. Unique productive TCRβ sequences were defined in healthy controls and ITN036ST subject 4 by CDR3 nucleotide sequence, as the same PCR primers were used for sequencing of all samples; and in ITN036ST subjects 1, 2, and 5 by CDR3 amino acid sequence with associated Vβ and Jβ genes, as different PCR primers were used for different samples of the same patient (as Adaptive adjusted its primer pairs over time), preventing com-parison of nucleotide sequences within each patient. From these, sample read or template counts across unique productive TCRβ sequences were normalized to frequency of detection. To account for sorting error and possible ambiguous TCRβ sequences, CD4 and CD8 samples were compared, unstimulated Treg samples were compared with CD4+ non-Treg and CD8 samples, and unstimulated CD4+ non-Treg samples were compared with unstimulated Treg and CD8 samples: sequences present in both popula-tions at a high to low frequency ratio ≤2:1 were removed from analysis. Those present at a ratio >2:1 were assigned to the population with the greater frequency of that sequence. After this adjustment, tables containing clonal expression frequencies were compiled and renormalized. When samples had multiple sequencing runs, the runs were first adjusted individually for sorting error, and then sequences from the multiple runs were pooled. Donor-reactive TCRβ sequences were defined by ≥5-fold expansion in the CFSElo sample compared with unstimulated pre-transplant cells and frequency of ≥0.01% in the CFSElo sample. Diversity was measured by clonality (S ≡ 1 − Hobs/Hmax), where Hmax is the entropy (H ≡ Σpi log2 pi, where pi is the frequency of clone i) of a repertoire with the same number of clones, each having exactly the same frequency. JSD was calculated as described elsewhere (42). TCRβ repertoire analysis was performed in R and Rstudio using standard commands. Slopes of abundance plots were calculated using code adapted from that described previously (17). Scatter plots of repertoire overlap were generat-ed using the Adaptive immunoSEQ analyzer. R codes are available in the file “donor-specific Treg anal-ysis.r” at https://github.com/Aleksobrad/TCR-analysis. Computational and statistical analyses were otherwise performed as described previously (8).
Statistics. Two-tailed t tests and Fisher’s exact tests were used as stated in the figure legends. A P value less than 0.05 was considered significant. Figures were created in GraphPad Prism (GraphPad Software). EulerAPE (43) and Inkscape were used to generate proportional Venn diagrams.
Study approval. Written informed consent was obtained from all participants. The study protocols were approved by the Massachusetts General Hospital and Columbia University Medical Center Insti-tutional Review Boards.
Author contributionsTMS performed experiments, analyzed the data, and wrote the manuscript. BAS performed experiments and analyzed data. AO analyzed TCRβ sequencing data. SD, SL, JZ, MTS, EB and JF performed exper-iments. SY coordinated sample acquisition. SH contributed to the design and performance of FACS. QT provided 3T3-CD40L cells and protocols for the culture of Tregs with activated donor B cells. LAT pro-vided intellectual input. YS contributed to bioinformatic and statistical analyses. MS participated in and oversaw design of all laboratory studies, data analysis and interpretation, and wrote the manuscript.

1 5insight.jci.org https://doi.org/10.1172/jci.insight.124086
R E S E A R C H A R T I C L E
AcknowledgmentsWe thank David Sachs for his helpful review of the manuscript. Research reported in this publication was performed as a project of the Immune Tolerance Network and supported by the National Institute of Allergy and Infectious Diseases of the NIH under Award Number UM1AI109565, and was performed in the CCTI Flow Cytometry Core, supported in part by the Office of the Director, NIH under awards P30CA013696, 5P30DK063608, S10RR027050, and S10OD020056. The content is solely the responsibili-ty of the authors and does not necessarily represent the official views of the NIH.
Address correspondence to: Megan Sykes, Columbia Center for Translational Immunology, Columbia University Medical Center, 650 West 168th Street – Black Building 1512, New York, New York 10032, USA. Phone: 212.304.5696; Email: [email protected].
1. Kawai T, et al. HLA-mismatched renal transplantation without maintenance immunosuppression. N Engl J Med. 2008;358(4):353–361.
2. Kawai T, Sachs DH, Sykes M, Cosimi AB, Immune Tolerance Network. HLA-mismatched renal transplantation without main-tenance immunosuppression. N Engl J Med. 2013;368(19):1850–1852.
3. Kawai T, et al. Long-term results in recipients of combined HLA-mismatched kidney and bone marrow transplantation without maintenance immunosuppression. Am J Transplant. 2014;14(7):1599–1611.
4. Manilay JO, Pearson DA, Sergio JJ, Swenson KG, Sykes M. Intrathymic deletion of alloreactive T cells in mixed bone marrow chimeras prepared with a nonmyeloablative conditioning regimen. Transplantation. 1998;66(1):96–102.
5. LoCascio SA, et al. Mixed chimerism, lymphocyte recovery, and evidence for early donor-specific unresponsiveness in patients receiving combined kidney and bone marrow transplantation to induce tolerance. Transplantation. 2010;90(12):1607–1615.
6. Andreola G, et al. Mechanisms of donor-specific tolerance in recipients of haploidentical combined bone marrow/kidney trans-plantation. Am J Transplant. 2011;11(6):1236–1247.
7. Sprangers B, et al. Origin of enriched regulatory T cells in patients receiving combined kidney-bone marrow transplantation to induce transplantation tolerance. Am J Transplant. 2017;17(8):2020–2032.
8. Morris H, et al. Tracking donor-reactive T cells: evidence for clonal deletion in tolerant kidney transplant patients. Sci Transl Med. 2015;7(272):272ra10.
9. Lin YJ, et al. Suppressive efficacy and proliferative capacity of human regulatory T cells in allogeneic and xenogeneic responses. Transplantation. 2008;86(10):1452–1462.
10. Veerapathran A, Pidala J, Beato F, Yu XZ, Anasetti C. Ex vivo expansion of human Tregs specific for alloantigens presented directly or indirectly. Blood. 2011;118(20):5671–5680.
11. Greenland JR, et al. Donor-reactive regulatory T cell frequency increases during acute cellular rejection of lung allografts. Transplantation. 2016;100(10):2090–2098.
12. Putnam AL, et al. Clinical grade manufacturing of human alloantigen-reactive regulatory T cells for use in transplantation. Am J Transplant. 2013;13(11):3010–3020.
13. Davies JK, Nadler LM, Guinan EC. Expansion of allospecific regulatory T cells after anergized, mismatched bone marrow transplantation. Sci Transl Med. 2009;1(1):1ra3.
14. Davies JK, Barbon CM, Voskertchian A, Nadler LM, Guinan EC. Ex vivo alloanergization with belatacept: a strategy to selec-tively modulate alloresponses after transplantation. Cell Transplant. 2012;21(9):2047–2061.
15. Guinan EC, et al. ex vivo costimulatory blockade to generate regulatory T cells from patients awaiting kidney transplantation. Am J Transplant. 2016;16(7):2187–2195.
16. Zuber J, et al. Bidirectional intragraft alloreactivity drives the repopulation of human intestinal allografts and correlates with clinical outcome. Sci Immunol. 2016;1(4):eaah3732.
17. DeWolf S, et al. Quantifying size and diversity of the human T cell alloresponse. JCI Insight. 2018;3(15):e121256. 18. Schoenbrunn A, et al. A converse 4-1BB and CD40 ligand expression pattern delineates activated regulatory T cells (Treg) and
conventional T cells enabling direct isolation of alloantigen-reactive natural Foxp3+ Treg. J Immunol. 2012;189(12):5985–5994. 19. Bacher P, et al. Antigen-specific expansion of human regulatory T cells as a major tolerance mechanism against mucosal fungi.
Mucosal Immunol. 2014;7(4):916–928. 20. Bacher P, et al. Regulatory T cell specificity directs tolerance versus allergy against aeroantigens in humans. Cell.
2016;167(4):1067–1078.e16. 21. Tu W, et al. Efficient generation of human alloantigen-specific CD4+ regulatory T cells from naive precursors by CD40-activat-
ed B cells. Blood. 2008;112(6):2554–2562. 22. Chen LC, Delgado JC, Jensen PE, Chen X. Direct expansion of human allospecific FoxP3+CD4+ regulatory T cells with allo-
geneic B cells for therapeutic application. J Immunol. 2009;183(6):4094–4102. 23. Landwehr-Kenzel S, et al. Novel GMP-compatible protocol employing an allogeneic B cell bank for clonal expansion of allospe-
cific natural regulatory T cells. Am J Transplant. 2014;14(3):594–606. 24. Todo S, et al. A pilot study of operational tolerance with a regulatory T-cell-based cell therapy in living donor liver transplanta-
tion. Hepatology. 2016;64(2):632–643. 25. Shaffer J, et al. Regulatory T-cell recovery in recipients of haploidentical nonmyeloablative hematopoietic cell transplantation
with a humanized anti-CD2 mAb, MEDI-507, with or without fludarabine. Exp Hematol. 2007;35(7):1140–1152. 26. Gibbons C, Sykes M. Manipulating the immune system for anti-tumor responses and transplant tolerance via mixed hematopoi-
etic chimerism. Immunol Rev. 2008;223:334–360.

1 6insight.jci.org https://doi.org/10.1172/jci.insight.124086
R E S E A R C H A R T I C L E
27. Sachs DH, Kawai T, Sykes M. Induction of tolerance through mixed chimerism. Cold Spring Harb Perspect Med. 2014;4(1):a015529.
28. Graca L, Cobbold SP, Waldmann H. Identification of regulatory T cells in tolerated allografts. J Exp Med. 2002;195(12):1641–1646. 29. Kendal AR, et al. Sustained suppression by Foxp3+ regulatory T cells is vital for infectious transplantation tolerance. J Exp Med.
2011;208(10):2043–2053. 30. Hu M, et al. Infiltrating Foxp3(+) regulatory T cells from spontaneously tolerant kidney allografts demonstrate donor-specific
tolerance. Am J Transplant. 2013;13(11):2819–2830. 31. Baas M, et al. TGFβ-dependent expression of PD-1 and PD-L1 controls CD8(+) T cell anergy in transplant tolerance. Elife.
2016;5:e08133. 32. Penaloza-MacMaster P, et al. Interplay between regulatory T cells and PD-1 in modulating T cell exhaustion and viral control
during chronic LCMV infection. J Exp Med. 2014;211(9):1905–1918. 33. Grossman WJ, Verbsky JW, Barchet W, Colonna M, Atkinson JP, Ley TJ. Human T regulatory cells can use the perforin path-
way to cause autologous target cell death. Immunity. 2004;21(4):589–601. 34. Gondek DC, Lu LF, Quezada SA, Sakaguchi S, Noelle RJ. Cutting edge: contact-mediated suppression by CD4+CD25+ regu-
latory cells involves a granzyme B-dependent, perforin-independent mechanism. J Immunol. 2005;174(4):1783–1786. 35. Cao X, et al. Granzyme B and perforin are important for regulatory T cell-mediated suppression of tumor clearance. Immunity.
2007;27(4):635–646. 36. Braza F, et al. Central Role of CD45RA- Foxp3hi memory regulatory T cells in clinical kidney transplantation tolerance. J Am
Soc Nephrol. 2015;26(8):1795–1805. 37. Louis S, et al. Contrasting CD25hiCD4+T cells/FOXP3 patterns in chronic rejection and operational drug-free tolerance.
Transplantation. 2006;81(3):398–407. 38. Braudeau C, et al. Variation in numbers of CD4+CD25highFOXP3+ T cells with normal immuno-regulatory properties in
long-term graft outcome. Transpl Int. 2007;20(10):845–855. 39. Nafady-Hego H, et al. The generation of donor-specific CD4+CD25++CD45RA+ naive regulatory T cells in operationally tol-
erant patients after pediatric living-donor liver transplantation. Transplantation. 2010;90(12):1547–1555. 40. Leventhal JR, et al. Nonchimeric HLA-identical renal transplant tolerance: regulatory immunophenotypic/genomic biomark-
ers. Am J Transplant. 2016;16(1):221–234. 41. Putnam AL, et al. Expansion of human regulatory T-cells from patients with type 1 diabetes. Diabetes. 2009;58(3):652–662. 42. Manning CD, Schutze H. Foundations of statistical natural language processing. Cambridge, Massachusetts, USA: MIT Press; 1999. 43. Micallef L, Rodgers P. eulerAPE: drawing area-proportional 3-Venn diagrams using ellipses. PLoS One. 2014;9(7):e101717.