TOKYO OHKA KOGYO CO., LTD. Business Results OHKA KOGYO CO., LTD. Business Results ... management...
20
May 11, 2016 TOKYO OHKA KOGYO CO., LTD. Business Results ― Fiscal Year ended March 2016―
Transcript of TOKYO OHKA KOGYO CO., LTD. Business Results OHKA KOGYO CO., LTD. Business Results ... management...

May 11, 2016
TOKYO OHKA KOGYO CO., LTD.Business Results
― Fiscal Year ended March 2016 ―
1
Contents
1. Consolidated Business Results for FY2016
2. Consolidated Performance Forecasts for FY2017
p.2
p.12

Consolidated Business Results for FY2016

3333
Summary(Millions of yen)
FY2015 FY2016
Change %
Net sales 88,086 89,969 +1,882 +2.1
Operating income 13,253 12,438 (814) (6.1)
Ordinary income 14,443 12,684 (1,759) (12.2)Profit attributable to owners of parent 8,818 7,716 (1,101) (12.5)
�Average exchange rate (US$): ¥109.7/$ (FY2015) ⇒⇒⇒⇒ ¥119.3/$ (FY2016)�Net Sales: Began to decline in the fourth quarter a nd did not achieve the revised
forecast (announced Nov. 5, 2015); however, net sal es increased.�Operating Income: Decreased due to the impact of pe rformance decline in the
Equipment Business, etc.�Profit attributable to owners of parent: Decreased due to the decline in operating
income and foreign exchange losses.

4444
Non-operating Expenses or Income / Extraordinary Losses or Income
FY2015 FY2016 YoY
Non-operating expenses or income 1,190 246 (944)
Interest and dividend income +229 +287 +58
(Foreign exchange related losses/gains)Foreign exchange (loss) gainLoss(gain) on valuation of derivatives
(+999)+1,459
(460)
(△371)(642)+270
(1,370)(2,101)
+731
New plant related expenses (496) ― +496
Operating preparation expenses ― (339) (339)
Extraordinary losses or income (141) (906) (764)
Gain on revision of retirement benefit planGain on sale of investment securities
+622―
―
+50(622)
+50
Impairment loss Loss on valuation of investment securities
(622)----
(752)(108)
(87)(108)
(Millions of yen)

5555
Results by Business Segment(Millions of yen)
(Note) Net sales of the Equipment Business are the figures after elimination of inter-segment sales.
FY2015 FY2016
Change %
Net sales 88,086 89,969 +1,882 +2.1
Material business 84,611 87,280 +2,668 +3.2
Electronic functional materials 49,818 51,134 +1,315 +2 .6
High purity chemicals 34,844 35,931 +1,086 +3.1
Other (52) 214 266 ----
Equipment business 3,475 2,689 (786) (22.6)
Operating income 13,253 12,438 (814) (6.1)
Material business 16,355 16,203 (152) (0.9)
Equipment business 20 (423) (443) ----
Eliminations and corporate (3,122) (3,342) (219) ----
6666
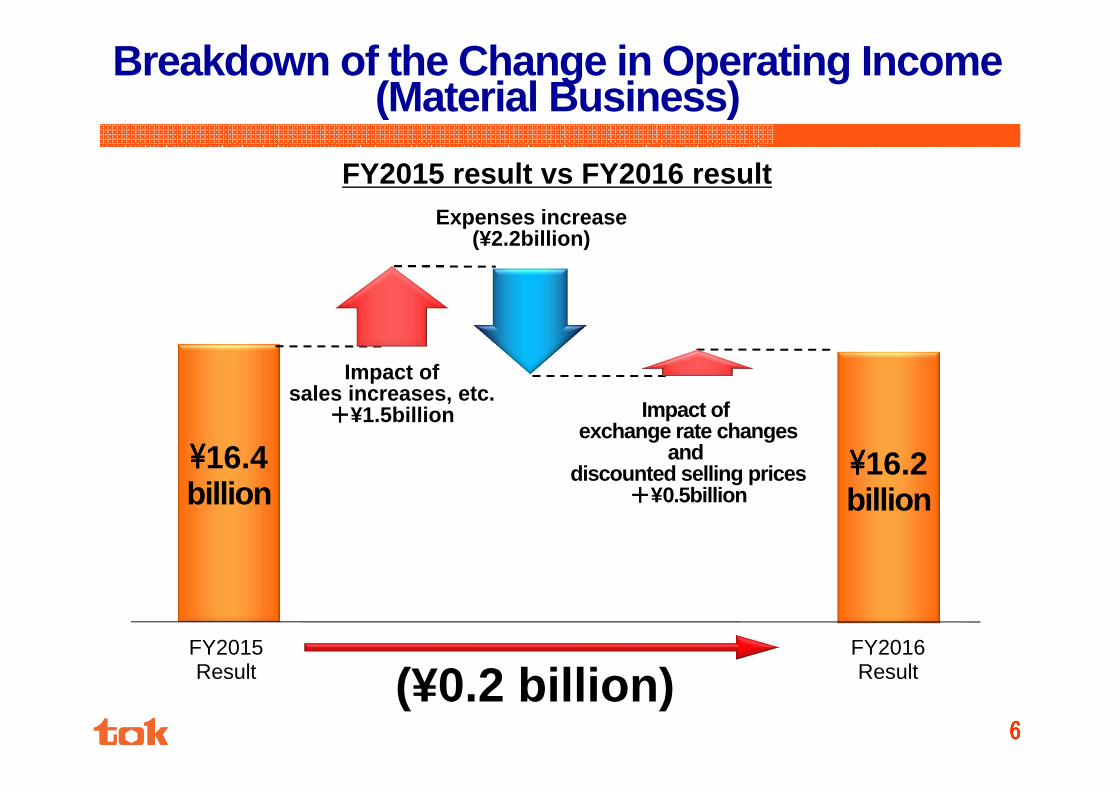
Breakdown of the Change in Operating Income(Material Business)
Impact ofsales increases, etc.
++++¥1.5billion Impact of exchange rate changes
and discounted selling prices
++++¥0.5billion
¥¥¥¥16.4billion
FY2015 result vs FY2016 result
(¥0.2 billion)FY2015Result
Expenses increase(¥2.2billion)
FY2016Result
¥¥¥¥16.2billion

7777
Sales Breakdown of Material BusinessNet Sales
(Millions of yen)
12,873 12,817 12,603 12,817 12,960 12,753
9,198 9,341 9,268 9,041 9,175 8,446
89 115 62
0
5,000
10,000
15,000
20,000
2015/3Q 2015/4Q 2016/1Q 2016/2Q 2016/3Q 2016/4Q
Electronic functional materialsElectronic functional materialsElectronic functional materialsElectronic functional materials High purity chemicalsHigh purity chemicalsHigh purity chemicalsHigh purity chemicals OtherOtherOtherOther
(267) (9) 46
22,248 21,987 21,848 22,18221,261
21,804
FY2016Full-year
result
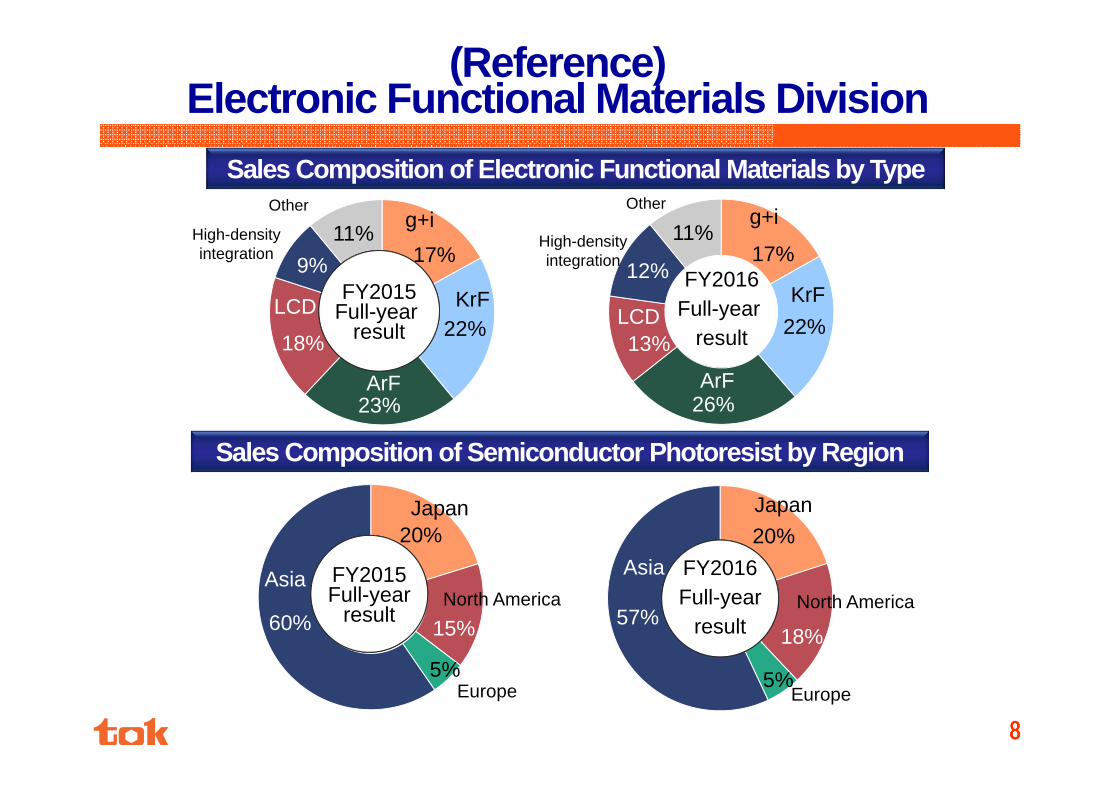
20%
15%
5%
60%
8888
17%
22%
23%
18%
9%
11%17%
22%
26%
13%
12%
11%
20%
18%
5%
57%
(Reference) Electronic Functional Materials Division
Sales Composition of Semiconductor Photoresist by R egion
g+i
KrF
ArF
LCD
High-densityintegration
Otherg+i
KrF
ArF
LCD
High-densityintegration
Other
Japan
North America
Europe
Asia
Japan
North America
Europe
Asia
Sales Composition of Electronic Functional Material s by Type
FY2015Full-year
result
FY2016Full-year
result
FY2015Full-year
result
9999
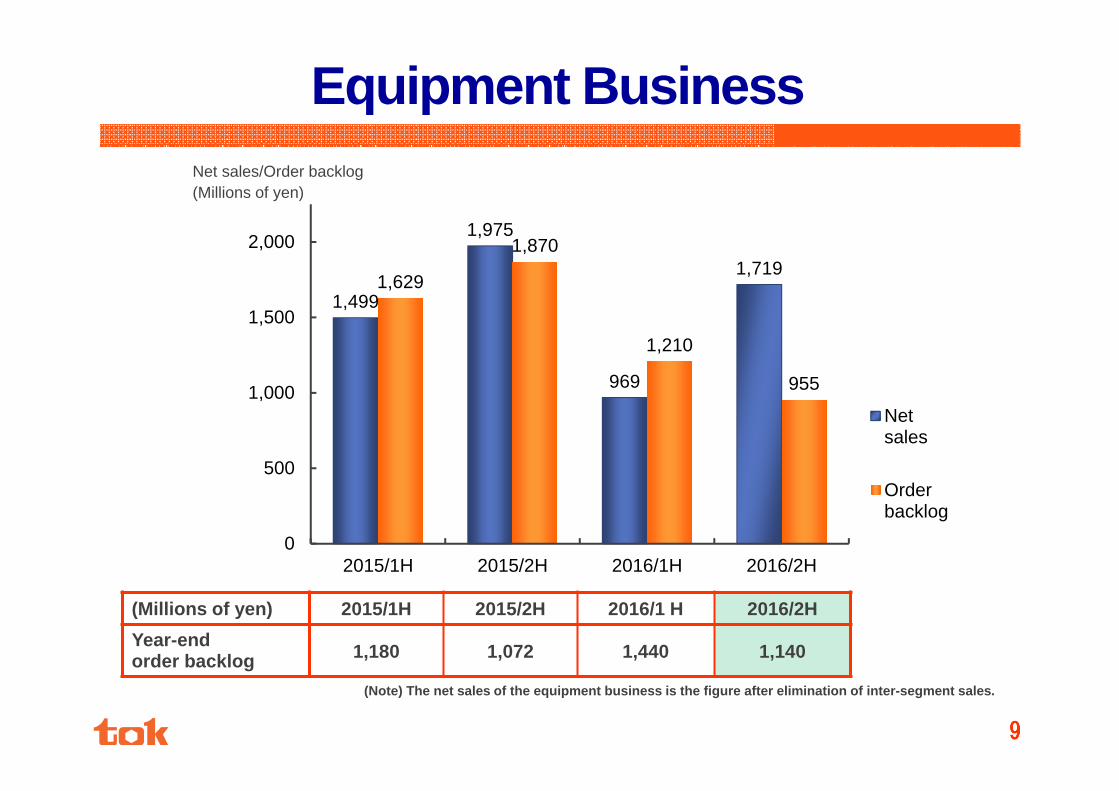
1,499
1,975
969
1,7191,629
1,870
1,210
955
0
500
1,000
1,500
2,000
2015/1H 2015/2H 2016/1H 2016/2H
Netsales
Orderbacklog
Equipment BusinessNet sales/Order backlog(Millions of yen)
(Millions of yen) 2015/1H 2015/2H 2016/1 H 2016/2H
Year-end order backlog 1,180 1,072 1,440 1,140
(Note) The net sales of the equipment business is t he figure after elimination of inter-segment sales.

10101010
Balance Sheets(Millions of yen)
As ofMarch 31,
2016YoY
Current assets 87,114 (3,939)
Cash and deposits
Notes and accounts receivable
Inventories
50,876
17,921
12,999
(3,090)
(1,500)
+1,444
Property, plant and equipment 47,913 (1,458)
Intangible assets 749 (185)
Investments and other assets 31,523 (1,979)
Current liabilities 17,130 (2,164)
Notes and accounts payable 7,787 (2,010)
Non-current liabilities 2,899 (670)
Total net assets 147,270 (4,728)
Total assets 167,300 (7,563)
Buildings and structures +2,190Machinery and equipment (2,354)Tools, furniture and fixtures +1,057Land (107)Construction in progress (2,243)
Retained earnings +858Treasury stock (2,056)Valuation difference on available-for-sale securities (1,043)Remeasurements of defined benefit plans (1,844)

11111111
Cash Flows
FY2015 FY2016
Cash flows from operating activities +13,577 +11,902
Income before income taxes and minority interests +14,301 +11,777
Depreciation +4,276 +5,631Increase (decrease) in allowance for doubtful accounts (94) (18)
Decrease (increase) in trade notes and accounts receivable (2,119) +1,200
Decrease (increase) in inventories (368) (1,755)Decrease (increase) in trade notes and accounts payable +3,121 (1,522)
Increase (decrease) in advances received (692) (5)Income taxes paid (3,935) (4,157)
Cash flows from investing activities (10,197) (4,385)
Cash flows from financing activities (2,110) (9,268)
Translation adjustments +1,138 (298)
Net increase (decrease) in cash and cash equivalents +2,408 (2,049)
(Millions of yen)
Major breakdown:Purchases of treasury stock
(6,304)Cash dividends paid (2,849)(incl. minority shareholders)
Major breakdown:Purchase of property, plant and equipment (5,335)
Consolidated Performance Forecasts for FY2017
13131313
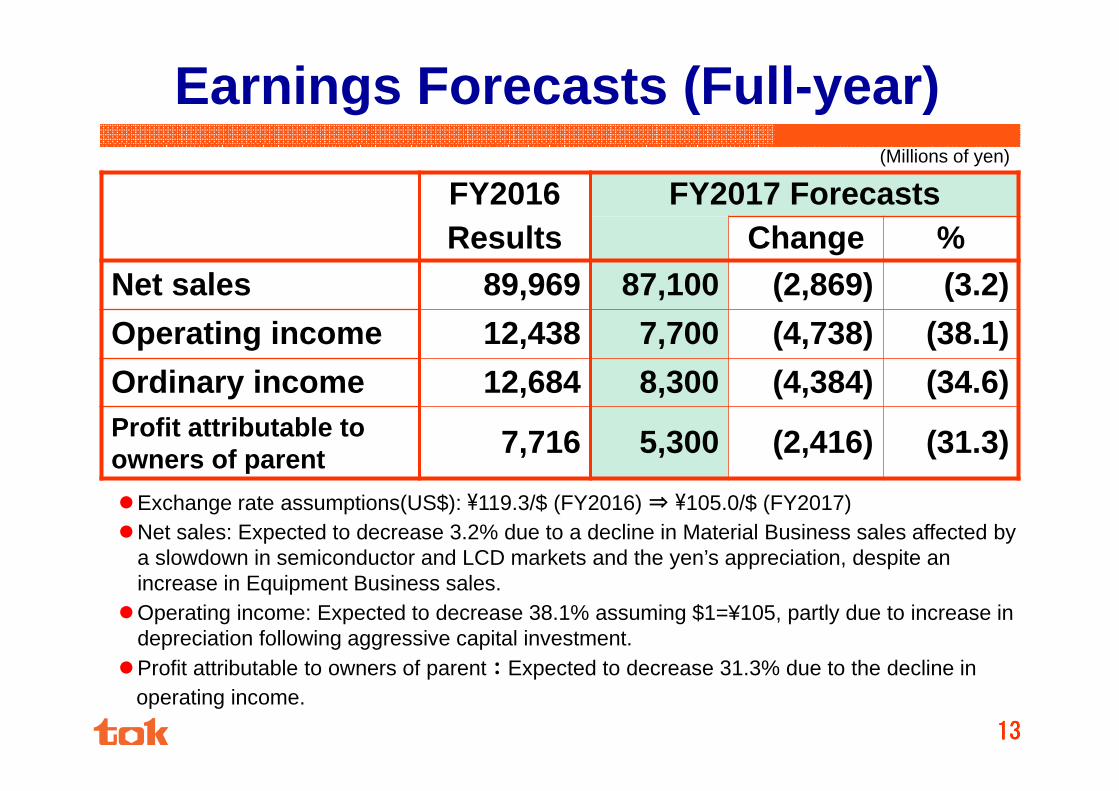
Earnings Forecasts (Full-year)(Millions of yen)
FY2016 FY2017 ForecastsResults Change %
Net sales 89,969 87,100 (2,869) (3.2)
Operating income 12,438 7,700 (4,738) (38.1)
Ordinary income 12,684 8,300 (4,384) (34.6)Profit attributable to owners of parent 7,716 5,300 (2,416) (31.3)
�Exchange rate assumptions(US$): ¥119.3/$ (FY2016) ⇒ ¥105.0/$ (FY2017)�Net sales: Expected to decrease 3.2% due to a decline in Material Business sales affected by
a slowdown in semiconductor and LCD markets and the yen’s appreciation, despite an increase in Equipment Business sales.
�Operating income: Expected to decrease 38.1% assuming $1=¥105, partly due to increase in depreciation following aggressive capital investment.
�Profit attributable to owners of parent:Expected to decrease 31.3% due to the decline in operating income.

14141414
3,162
5,332
14,577
7,276
5,919
11,700
4,038 3,758
2,672
4,276
5,6316,2006,157 6,211 6,389
6,903
7,0158,100
0
2,500
5,000
7,500
10,000
12,500
15,000
12/3 13/3 14/3 15/3 16/3 17/3 (Forecast)
Capital investmentsCapital investmentsCapital investmentsCapital investments DepreciationDepreciationDepreciationDepreciation R&DR&DR&DR&D
Capital Investments/Depreciation/R&D
(Millions of yen)

15151515
Performance Forecasts by Business Segment
FY2016 FY2016 Full-year forecastsFull-year results Change %
Net sales 89,969 87,100 (2,869) (3.2)
Material business 87,280 82,400 (4,880) (5.6)
Electronic functional materials
51,134 50,800 (334) (0.7)
High purity chemicals 35,931 31,500 (4,431) (12.3)
Equipment business 2,689 4,700 +2,010 +74.8
Operating income 12,438 7,700 (4,738) (38.1)
Material business 16,203 11,400 (4,803) (29.6)
Equipment business (423) 0 +423 ----
Eliminations and corporate (3,342) (3,700) (357) ----
(Millions of yen, %)
(Note) The net sales of the equipment business is t he figure after elimination of inter-segment sales.

16161616
Breakdown of the Change in Operating Income (Materi al Business)
FY2016 Result vs FY 2017 Forecast
Expenses increase (¥1.3 billion)
Impact of Exchange rate changes
and discounted selling prices
(¥4.3 billion)¥¥¥¥11.4
billion
(¥¥¥¥4.84.84.84.8 billion)FY2016/3
Full-year resultFY2017/3
Full-year forecast
¥¥¥¥16.4billion
Impact ofsales increases, etc.
+¥0.8 billion

17171717
24,127 25,690 25,420 25,714 25,000 25,800
16,30418,539 18,309 17,621
15,700 15,800
125105
100 0△177△177△177△177 108
0
10,000
20,000
30,000
40,000
50,000
2015/1H 2015/2H 2016/1H 2016/2H 2017/1H(Forecast)
2017/2H(Forecast)
Electronic functional materials High purity chemicals Other
Sales Breakdown of Material Business (Forecast)
Net Sales(Millions of yen)
40,55744,053 43,835 43,444
40,800 41,600
(Note) The second half forecast is obtained by subt racting first-half results from the full-year forec ast.

24%
15%
5%
56%
20%
18%
5%
57%
18181818
17%
23%
25%
10%
15%
10%17%
22%
26%
13%
12%
10%
(Reference) Electronic Functional Materials Divisio n
Sales Composition of Electronic Functional Materials by Type
Sales Composition of Semiconductor Photoresist by Region
g+i
KrF
ArF
LCD
High-densityintegration
Otherg+i
KrF
ArF
LCD
High-densityintegration
Other
North America
Europe
Asia
Japan
North America
Europe
Japan
Asia
FY2016Full-yearforecast
FY2015Full-year
result
FY2015Full-year
result
FY2016Full-yearforecast

http://www.tok.co.jp/eng
(Note)
This presentation material contains forward-looking statements that describe future prospects of TOKYO OHKA KOGYO CO., LTD. (the Company) in terms o f business planning, earnings and management strategies. Such statements are based on management’s judgement, derived from information available to it at the time such inform ation was prepared. Readers are cautioned not to re ly solely on these forward-looking statements, as actu al results and strategies may differ substantially according to changes in the Company’s business envi ronment.