Tokio Marine Group New Mid-Term Business Plan “To Be a ... · Tokio Marine Group New Mid-Term...
68
Tokio Marine Group New Mid-Term Business Plan “To Be a Good Company 2020” May 25, 2018 Tokio Marine Holdings, Inc.
Transcript of Tokio Marine Group New Mid-Term Business Plan “To Be a ... · Tokio Marine Group New Mid-Term...

Tokio Marine GroupNew Mid-Term Business Plan“To Be a Good Company 2020”
May 25, 2018Tokio Marine Holdings, Inc.

Copyright (c) 2018 Tokio Marine Holdings, Inc.
1
Table of Contents
1. Review the Previous Mid-Term Business Plan2. Outline of the New Mid-Term Business Plan3. Priorities of the New Mid-Term Business Plan4. ERM & Shareholder Return Policy5. Group Asset Management
Ⅰ Tokio Marine Group Business Strategy
1. Domestic Non-Life2. Domestic Life3. International Insurance
Ⅱ Business Plan and Strategy by Domain
Reference◆Abbreviations used in this material
TMNF : Tokio Marine & Nichido Fire Insurance Co., Ltd.NF : Nisshin Fire & Marine Insurance Co., Ltd.
TMNL : Tokio Marine & Nichido Life Insurance Co., Ltd.FL : Former Tokio Marine & Nichido Financial Life Insurance Co., Ltd.
TMHCC : Tokio Marine HCCTMK : Tokio Marine KilnTMR : Tokio Millennium Re

Copyright (c) 2018 Tokio Marine Holdings, Inc.
2
Ⅰ Tokio Marine Group Business Strategy
Copyright (c) 2018 Tokio Marine Holdings, Inc.3
1-1. Review the Previous Mid-Term Business Plan (1)Ⅰ Tokio Marine Group Business Strategy
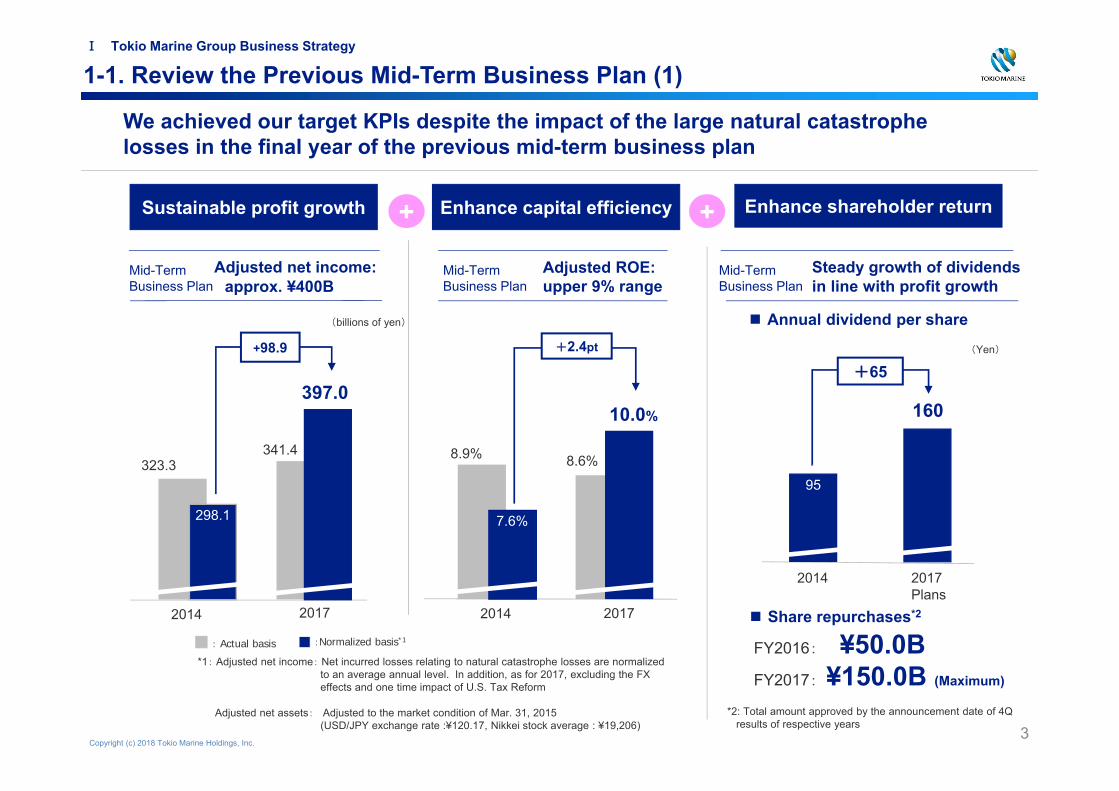
Sustainable profit growth Enhance capital efficiency Enhance shareholder return+ +
Adjusted net income:approx. ¥400B
Mid-Term Business Plan
Adjusted ROE:upper 9% range
2014
95
2017Plans
(billions of yen)
(Yen)
Share repurchases*2
Annual dividend per share
FY2016: ¥50.0BFY2017: ¥150.0B (Maximum)
Steady growth of dividends in line with profit growth
*2: Total amount approved by the announcement date of 4Q results of respective years
We achieved our target KPIs despite the impact of the large natural catastrophe losses in the final year of the previous mid-term business plan
+65
Mid-Term Business Plan
Mid-Term Business Plan
2014
323.3
298.1
341.4
2017
+98.9
397.0
2014
8.9%
7.6%
8.6%
2017
+2.4pt
10.0%
:Normalized basis*1: Actual basis*1: Adjusted net income: Net incurred losses relating to natural catastrophe losses are normalized
to an average annual level. In addition, as for 2017, excluding the FX effects and one time impact of U.S. Tax Reform
Adjusted net assets: Adjusted to the market condition of Mar. 31, 2015 (USD/JPY exchange rate :¥120.17, Nikkei stock average : ¥19,206)
160

Copyright (c) 2018 Tokio Marine Holdings, Inc.4
1-2. Review the Previous Mid-Term Business Plan (2)
Domestic Non-Life Business (TMNF) Domestic Life Business (TMNL) International Insurance Business
Normalized basis *4Normalized basis*1
*1: FX effects are excluded and nat-cat losses are normalized to an average annual level
2014 2017
120.0
*2: MCEV balance basis *3: Figures are before payment of shareholders’ dividends
for FY2015~2017. The figure of after payment of shareholder’s dividends is ¥1,248.7B
(billions of yen) (billions of yen)
99.0
20172014
157.81,037.3
1,322.5*3
113.7
2014 2017
125.0
164.0145.5
CAGR plan:
approx.+3%Plan・CAGR*2 :
approx. +8%・FY17 increase:
¥100.0B
CAGR plan:
approx. +8%+TMHCC
CAGR +9.6% CAGR +9.5%MCEV Growth RateCAGR*2 +8.4%
Increase in MCEV
*4: FX effects are excluded and nat-cat losses are normalized to an average annual level. As for FY 2017, excluding one time impact of U.S. Tax Reform
137.1144.1
■ Business Unit Profits
■ Measures to enhance capital efficiency
• Continuous sales of business-related equities• Strengthen management of natural catastrophe risk• Strengthen control of interest rate risk
• FY2016 ¥50B*• FY2017 ¥150B* (Maximum)
Sustainableprofit growth
Flexible share repurchase
Improving risk portfolioEnhance
quality of capital
Enhance capital
efficiency
• Enhancing life and non-life cross-selling business model• Initiatives to expand and diversify our business portfolio domestically
with specialty insurance products• “Life Insurance Revolution to Protect One’s Living”, promoting sales shift to protection-type
products in domestic life• Strengthen growth strategies by leveraging the expertise of each group company in
international business• Acquisition of TMHCC and smooth PMI, the expansion of group synergies
Ⅰ Tokio Marine Group Business Strategy
(billions of yen)
* : Total amount approved by announcement date of 4Q results of the end of respective years

Copyright (c) 2018 Tokio Marine Holdings, Inc. 5
2-1. Targets of the New Mid-Term Business Plan
*1: The market environment basis at the end of March 2018 (USD/JPY exchange rate:¥106.24, Nikkei Stock Average: ¥21,454)
*2: CAGR based on the FY2017 Results (Normalized basis*3)¥372.0B*3: Adjusted net income: Nat-cat losses are normalized to an average annual level and excluding one time impact of U.S. Tax Reform
Adjusted net assets :Adjusted the market condition (FX and stock price) to the same level as at the end of March 2018
Enhancecapital
efficiency
FY2020 Targets*1
Enhanceshareholder
return
Sustainableprofit growth1
2
3
Adjusted ROE : 10% or more
Adjusted net income : 3 ~ 7% CAGR*2
Ⅰ Tokio Marine Group Business Strategy
• Continuous dividend total increase in accordance with profit growth
• Gradually raise the dividend payout ratio towards the future Group visions
9.4%(normalized basis*3)
FY2017Results
Dividend per share¥160(Plans)
¥372.0B(normalized basis*3)
9.6%
FY2018Projections*1
Dividend per share
¥180(Projections)
¥396.0B

Copyright (c) 2018 Tokio Marine Holdings, Inc. 6
2-2. Vision for the New Mid-Term Business Plan
Significant improvementin profitability
Profit growth through the establishment of earnings base
Increase in shareholder return level
1.3%
8.9%
Adjusted ROE9.4%
FY2011 FY2014 FY2017Normalized
basis
Adjusted net income :
over ¥500.0B
The future Group visions
Progress up to 2017
FY2020Target
New Mid-Term Business Plan (2018~2020)
「To Be a Good Company 2020」 Consistent double-digit ROEHigh level shareholder
return
30.7
323.3
Adjustednet income
¥372.0B
Adjusted ROE10% or more
Adjusted ROE
approx. 12%
3 ~ 7% CAGR
The priorities
• Further diversification of portfolio• Enhancement of business structure• Strengthening aligned group
management
• Optimum portfolio• Strong Group synergies• Lean management system• Global business platform
Ⅰ Tokio Marine Group Business Strategy

Copyright (c) 2018 Tokio Marine Holdings, Inc. 7
2-3. Plan for Each Business Segment Business unit profits
Domestic non-life insurance business(TMNF)
International insurance business
137.1
FY2017 FY2020Plans
144.1
FY2020Plans
FY2017
Year-endMCEV*2 1,248.7 1,284.0 1,417.0
150.0
*2 : Figures of FY2017 are after payment of shareholder’s dividends. Figures of FY2018 Projections and FY2020 Plans are beforepayment of shareholder’s dividends
CAGR +1% or more*1
155.0
MCEV Growth Rate CAGR +4% or more
35.0
165.0
CAGR + approx. 11%*4
FY2018Projections
FY2018Projections
145.0
*1: Including the impact of the consumption tax rise and the revision of law of obligation, approx. – ¥28.0B (after tax) *4 : CAGR excluding impact of U.S. Tax Reform from the
figures of FY2020 plans is approx.8%
Business unit profits*3 99.0 35.0 83.0
*3 : Figures before payment of shareholder’s dividends
Ⅰ Tokio Marine Group Business Strategy
(billions of yen) (billions of yen) (billions of yen)
FY2017 FY2020Plans
FY2018Projections
Normalized basis:FX effects are excluded and nat-catlosses are normalized to an average
annual revelFX effects are excluded and nat- cat losses are normalized to an average annual level. Also, excluding one time impact of U.S. Tax Reform
Normalized basis
Increase in MCEV
Domestic life insurance business(TMNL)

Copyright (c) 2018 Tokio Marine Holdings, Inc.
8
3-1. Priorities of the New Mid-Term Business Plan
• Achieve growth organically as well as through targeted M&A (emerging markets, primarily Asia, as well as advanced markets)
• Appropriately control interest rate risk and natural catastrophe risk along with continuing sales of business-related equities
• Expand specialty insurance in non-life insurance business and protection type products in life insurance business
Further diversification
of portfolio
Enhancement of business
structure
Strengtheningaligned groupmanagement
• Launching innovative products and services which proactively meet the emerging and evolving needs of customers
• Strengthen business platform to enhance sales capabilities through creating new customer contacts by using new technology, etc.
• Use new technology and selected integration to realize more efficientbusiness processes
• Leverage the best practices among our group companies to generate synergies on a global basis
• Promote further talent development across the group and further leverage human resources globally
• Enhancing a sense of group unity by spreading core identity throughout the group
Geographical / Businessdiversification
Appropriate risk control
Continue refinement of product portfolio
Innovativeproducts and services
Enhance and strengthensales channels
Increaseproductivity
Global synergies
Leverage and developglobal talent
Spread group culture“To Be a Good Company”
Ⅰ Tokio Marine Group Business Strategy
8

Copyright (c) 2018 Tokio Marine Holdings, Inc.9
2015.3 2016.3 2017.3 2018.3
*1: Excluding life insurance premiums of variable annuities at FL
2002 2005 2008 2011 2014 Future Group Vision (image)
2017
2008.3 2008.122012.5
2015.10¥4.5Trillion
¥2.3Trillion
96%
3%
2002 44%
10%
45% 2018Projections
Ⅰ Tokio Marine Group Business Strategy
3-2. Further Diversification of Portfolio
Net premiums written+Life insurance premiums *1
■ Domestic non-life■ Domestic life ■ International business
Business unit profits *2
Internationalinsurance
Domesticnon-life
Domesticlife*2
FutureGroupVision(Image)
*2 : Domestic life insurance business;
- FY2002 : TEV basis
- After FY2018 Projections : MCEV basis
Trends of premiums and risk capital *3
(The previous mid-term business plan period)
¥4.5Trillion
Sustainable growth
¥3.3TrillionNet premiums written+Life insurance premiums
¥2.8Trillion
Risk capital
¥2.5Trillion
Disciplinedcontrol
*3 : ESR risk capital

Copyright (c) 2018 Tokio Marine Holdings, Inc.10
3-2. Further Diversification of Portfolio
Change in product portfolio
■ Promote life and non-life cross-selling business model with Super Insurance at the core
Super Insurance, ratio of the number of Super Insurance with either life or third sector coverage
201721%
2020
25%■ Expansion of
specialty insurance
Implementing measures of change in product portfolio and geographical and business diversification while controlling risks properly
Geographical / Business diversification
Appropriate risk control
■ Continued reduction of business-related equity holdings
■ Control of interest rate risks
• Reducing interest-rate risk by promoting sales shift to protection
- type products• Reduce 100 billion yen or more every year
TMNF net premiums
written(FY2017)
Composition of specialty insurance and P.A. insurance
Ⅰ Tokio Marine Group Business Strategy
TMNL protection-type products rate(New policies ANP. Excluding business insurance)
Developed countries *1 Emerging countries
Sustainable growth through competitive products / services
Capture high market growth
High profitability High-growth
Business diversification
Geographical diversification
Market Color
Growth rate *2
Group strategies
Organic growth
Growth rate *3
M&A
Expanding
■ Expansion of protection - type products
2014 2017
43%
84% Continuously focus on the protection–type products
■ Control of nat-cat risks• Advanced risk management
against nat-cat risks
22%
+2% +6%
+4% +6%
*1: Excluding Japan *2: 2018 forecast of direct premiums written in non-life insurance (Source: Swiss Re)*3: CAGR projections of direct premiums written in the Group’s non-life insurance business during new mid-term business plan
(excluding FX effects)
Markets
Copyright (c) 2018 Tokio Marine Holdings, Inc.
Advance
11
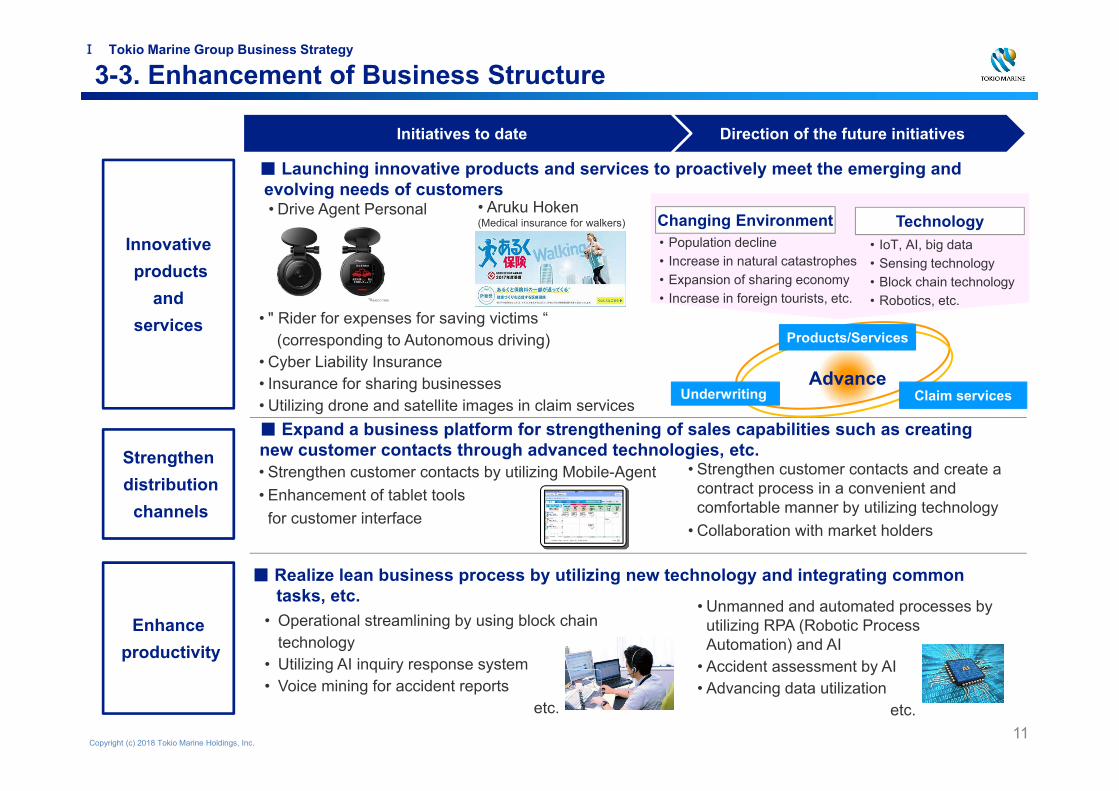
3-3. Enhancement of Business Structure
Direction of the future initiativesInitiatives to date
Innovativeproducts
and services
Strengthendistribution
channels
Enhanceproductivity
• " Rider for expenses for saving victims “(corresponding to Autonomous driving)
• Cyber Liability Insurance• Insurance for sharing businesses• Utilizing drone and satellite images in claim services
• Strengthen customer contacts by utilizing Mobile-Agent• Enhancement of tablet tools
for customer interface
• Strengthen customer contacts and create a contract process in a convenient and comfortable manner by utilizing technology
• Collaboration with market holders
• Operational streamlining by using block chain technology
• Utilizing AI inquiry response system• Voice mining for accident reports
etc.
• Unmanned and automated processes by utilizing RPA (Robotic Process Automation) and AI
• Accident assessment by AI• Advancing data utilization
etc.
• Aruku Hoken(Medical insurance for walkers)
• Drive Agent Personal Changing Environment Technology
■ Launching innovative products and services to proactively meet the emerging andevolving needs of customers
■ Expand a business platform for strengthening of sales capabilities such as creating new customer contacts through advanced technologies, etc.
■ Realize lean business process by utilizing new technology and integrating common tasks, etc.
Ⅰ Tokio Marine Group Business Strategy
• Population decline• Increase in natural catastrophes• Expansion of sharing economy• Increase in foreign tourists, etc.
• IoT, AI, big data• Sensing technology• Block chain technology• Robotics, etc.
Underwriting Claim services
Products/Services

Copyright (c) 2018 Tokio Marine Holdings, Inc.12
3-3. Enhancement of Business Structure
Improve the competitiveness of the group enhancing digital strategies globally
CSSO (Chief Strategy & Synergy Officer)CDO (Chief Digital Officer)Strategy and Synergy Dept., Digital Strategy Div.
Silicon Valley
Houston / New York
BrazilUK
Singapore
Indonesia
・Started proof-of-concept for fraud prevention by utilizing AI.
・Started to sell the system risk coverage insurance forunmanned aircraft system, such as drone・Tie up with Evari, an insure-tech company in Australia
・Establish a special department to plan create direct &digital business strategies.
・Realize quick and efficient insurance payment by utilizingimage recognition technology on mobile application
India
・Capture cutting-edge technology through investment in venture capital・Business tie-up with Cyber risk analysis provider, Cyence Inc.・Tie up with start-up companies
USA
・Started proof –of-concept for advancing underwriting withan AI start-up company
・Started proof-of-concept to improve efficiency of accidentassessment service by utilizing drone
• Know-how sharing at digital round table• Hiring the outside experts• Promote PoC or tie-up by introducing scouted start-
up companies to each Group company etc.
Strengthen cross function Measures across the Group
・Realize operational streamlining through introduction of an automated inquiry response system (Chatbot) by utilizing AI on the intranet
Ⅰ Tokio Marine Group Business Strategy
Copyright (c) 2018 Tokio Marine Holdings, Inc.
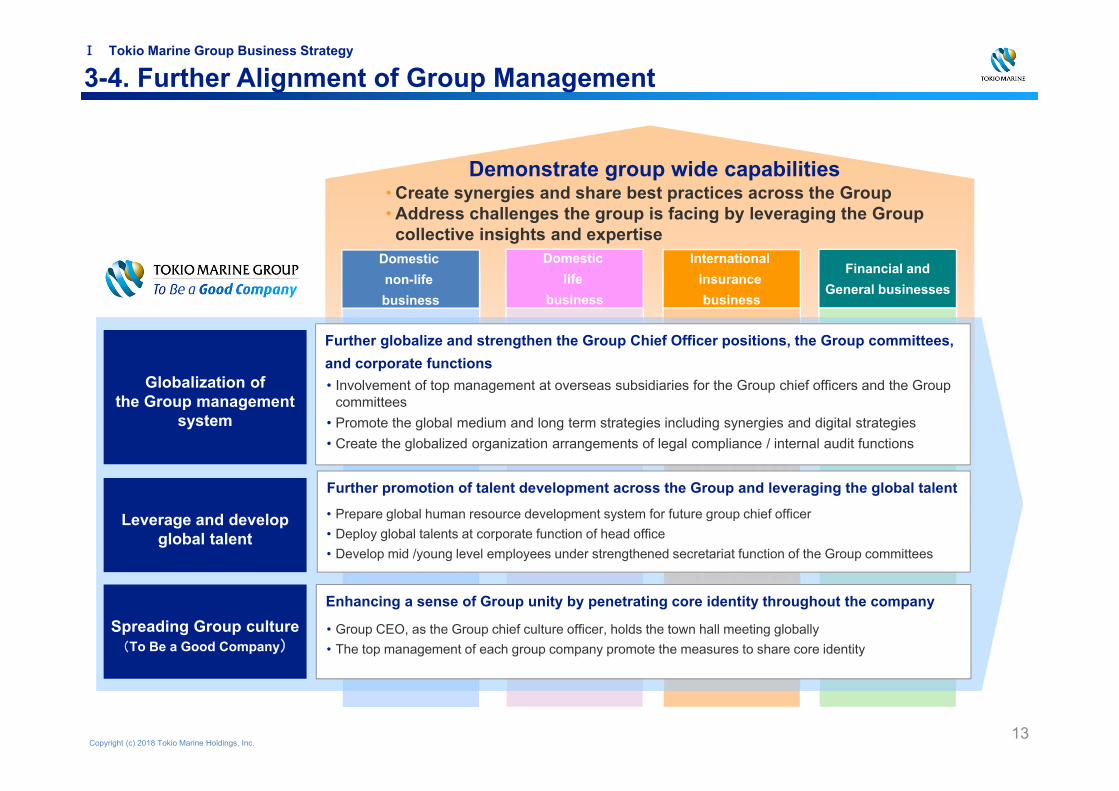
Domestic non-life business
Domestic life
business
International insurance business
Financial andGeneral businesses
Demonstrate group wide capabilities• Create synergies and share best practices across the Group• Address challenges the group is facing by leveraging the Group
collective insights and expertise
13
Spreading Group culture(To Be a Good Company)
Globalization ofthe Group management
system
Leverage and develop global talent
Further promotion of talent development across the Group and leveraging the global talent
Enhancing a sense of Group unity by penetrating core identity throughout the company
Further globalize and strengthen the Group Chief Officer positions, the Group committees,and corporate functions• Involvement of top management at overseas subsidiaries for the Group chief officers and the Group
committees• Promote the global medium and long term strategies including synergies and digital strategies• Create the globalized organization arrangements of legal compliance / internal audit functions
• Prepare global human resource development system for future group chief officer • Deploy global talents at corporate function of head office• Develop mid /young level employees under strengthened secretariat function of the Group committees
• Group CEO, as the Group chief culture officer, holds the town hall meeting globally• The top management of each group company promote the measures to share core identity
Ⅰ Tokio Marine Group Business Strategy
3-4. Further Alignment of Group Management

Copyright (c) 2018 Tokio Marine Holdings, Inc.14
3-4. Further Alignment of Group Management
Pursuing synergies by leveraging the Group’s global footprint, expertise of each group company, and financial strengths, etc.
Cost reduction by both efficient use of the Groupresources and taking advantage of its scale.
Increase investment income making the most of Delphi’s asset management capabilities, etc.
Optimization of retention/reinsurance on a group basis
• Mutually provide specialty insurance among group companies in developed countries and expand specialty insurance market in Japan
• Development of specialty insurance underwriting capability and creating a market through product offering in emerging countries
Revenue Investment
Capital Cost
Expanding Group Synergies
Annual results: USD210Mil
Expand revenue synergies by leveraging our global network
• Strengthening retention capability of each group company by leveraging the group's financial base
• Increasing Group retention through utilizing intra-group reinsurance
• Cost savings through joint purchasing etc.• Streamlining resources by reducting interest rates
on loans
Contribution on after tax basis at the end of Dec. 2017
Ⅰ Tokio Marine Group Business Strategy
• The Group companies entrust part of the assets to Delphi
• The total of entrusted amount to Delphi from the Group companies at the end of FY2017 was USD 7.7 Billion
Copyright (c) 2018 Tokio Marine Holdings, Inc. 15
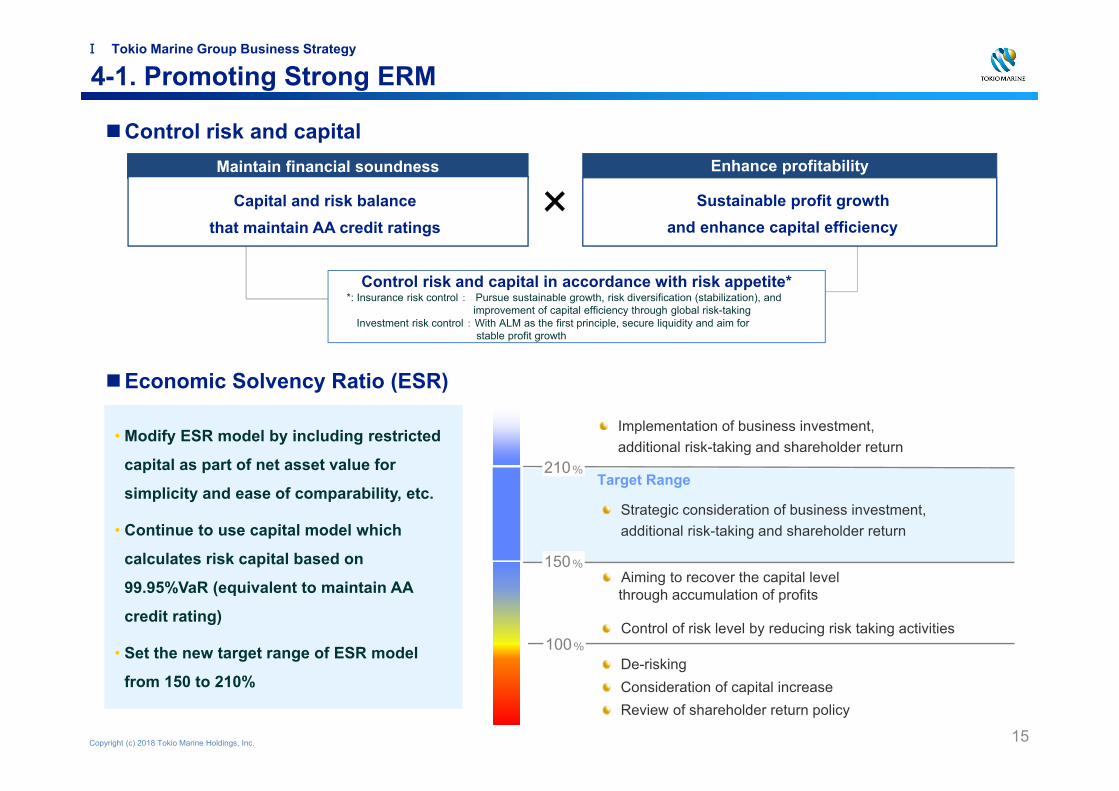
4-1. Promoting Strong ERM
Maintain financial soundness Enhance profitability
×Capital and risk balance that maintain AA credit ratings
Sustainable profit growth and enhance capital efficiency
Control risk and capital
Economic Solvency Ratio (ESR)
• Modify ESR model by including restricted
capital as part of net asset value for
simplicity and ease of comparability, etc.
• Continue to use capital model which
calculates risk capital based on
99.95%VaR (equivalent to maintain AA
credit rating)
• Set the new target range of ESR model
from 150 to 210%
Implementation of business investment, additional risk-taking and shareholder return
Aiming to recover the capital levelthrough accumulation of profits
Control of risk level by reducing risk taking activities100%
210%
150%
Target Range
Ⅰ Tokio Marine Group Business Strategy
Control risk and capital in accordance with risk appetite**: Insurance risk control : Pursue sustainable growth, risk diversification (stabilization), and
improvement of capital efficiency through global risk-taking Investment risk control : With ALM as the first principle, secure liquidity and aim for
stable profit growth
Strategic consideration of business investment, additional risk-taking and shareholder return
De-riskingConsideration of capital increaseReview of shareholder return policy

Copyright (c) 2018 Tokio Marine Holdings, Inc.16
Riskcapital2.4
Trillionyen
Net asset value
5.0Trillion
yen
206% Factors of change in net asset value
Factors of change in risk capital
etc.
Riskcapital2.5
Trillion yen
Netasset value
5.1Trillion
yen
201%
Contribution of 2H FY17 adjusted net income
Increase in unrealized gains of business-related equities
Shareholder return
Sales of business-related equities
Increase in risks of equities due to rise in stock price
Increase in credit risk Decrease in tax effects owing to
U.S. tax reform
Sep. 30, 2017 Mar. 31, 2018
¥20,356 Nikkei Stock Average ¥21,454
(Ref.) Definition of Net Asset ValueNet
Asset Value
Consolidated net asset on
financial accounting basis
Liability of capital nature (catastrophe loss
reserves, price fluctuation reserves, etc.) (after-tax
basis)
= + -Planned
distribution to shareholders
Value of life insurance policies
in-forceGoodwill, etc.
+-
ESR
4-2. ESR (as of Mar. 31, 2018)
ESR sensitivity
Share price: Continue to sell business-related equities given its large impact of market value fluctuation on ESR
Interest rate: Control the impact of interest rate fluctuation through ALM while preparing for future interest rate hike
FX rate: Limited impact on ESR
Mar. 31, 2018
Share price+30%
▲30%
204%
201%
196%
Interest rate+50bp
▲50bp
206%
190%
ESR is 201% due to an increase in risk capital associated with both a decrease in the tax effect owing to U.S. tax reform and an increase in credit risk, offsetting an increase in net asset value by the profit contribution.
FX rate +10%
▲10%
201%
201%
Ⅰ Tokio Marine Group Business Strategy
etc.
Others+
Copyright (c) 2018 Tokio Marine Holdings, Inc. 17
Dividend per share (yen)
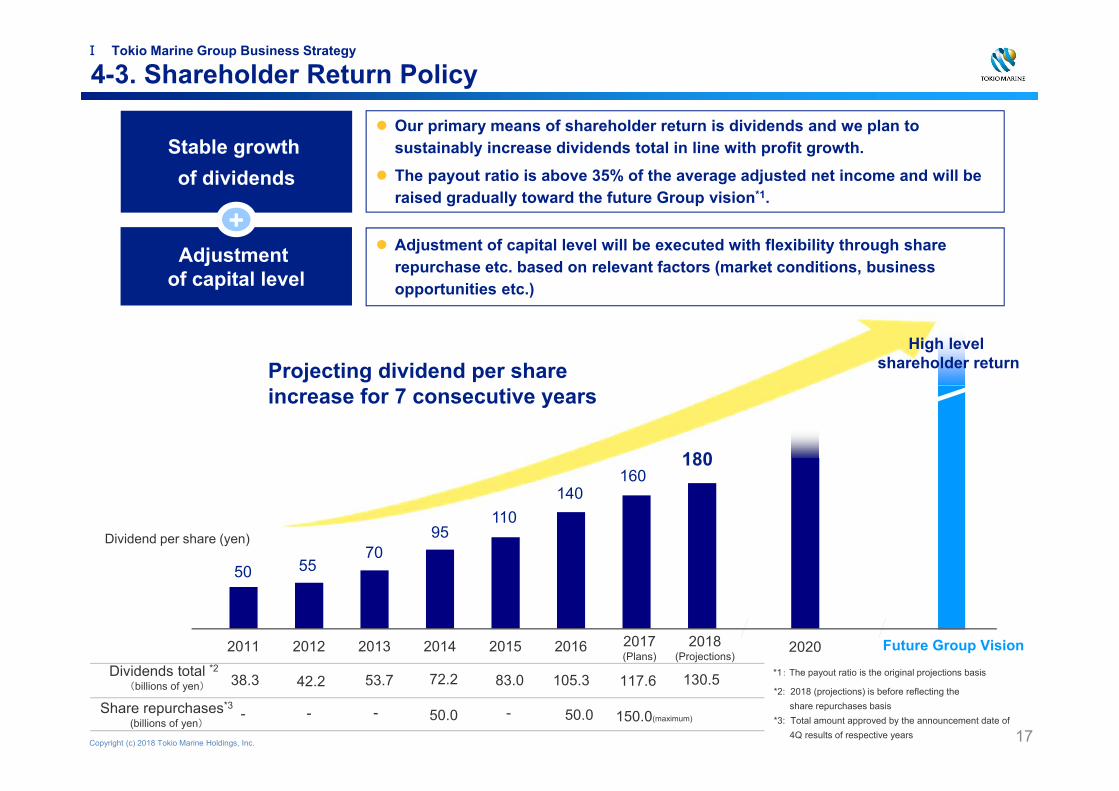
4-3. Shareholder Return Policy
Stable growth of dividends
Our primary means of shareholder return is dividends and we plan to sustainably increase dividends total in line with profit growth.
The payout ratio is above 35% of the average adjusted net income and will be raised gradually toward the future Group vision*1.
Adjustment of capital level
Adjustment of capital level will be executed with flexibility through share repurchase etc. based on relevant factors (market conditions, business opportunities etc.)
+
2020
50 5570
95110
140160
180
Dividends total *2
(billions of yen) 38.3 42.2 53.7 72.2 83.0 105.3 117.6 130.5
2011 2012 2013 2014 2015 2016 2017(Plans)
2018(Projections)
Future Group Vision
High level shareholder returnProjecting dividend per share
increase for 7 consecutive years
Ⅰ Tokio Marine Group Business Strategy
Share repurchases*3
(billions of yen)- - - 50.0 - 50.0 150.0(maximum)
*1: The payout ratio is the original projections basis
*2: 2018 (projections) is before reflecting the share repurchases basis
*3: Total amount approved by the announcement date of 4Q results of respective years

Copyright (c) 2018 Tokio Marine Holdings, Inc.18
4-4. Enhancing Shareholder Value
Transition of total shareholder return *
*Total Shareholder Return(TSR): Capital return after reinvesting dividends
Stock price indexed at 100 on April 1, 2002 341
TOPIX223
as of Apr. 30, 2018
Ⅰ Tokio Marine Group Business Strategy
‘Total Shareholder Return’ has outperformed TOPIX
2002/4 2006/4 2010/4 2014/4 2018/4
Source:Bloomberg

Copyright (c) 2018 Tokio Marine Holdings, Inc.19
5-1. Group Asset Management (1)With asset and liability management (ALM) at the core, aim to secure long - term and stable investment income and efficient liquidity management under the appropriate risk control based on the characteristics of insurance liabilities.
Further strengthen investment capability by enhancing collaboration among group companies in Japan and overseas and promoting global investment diversification
GroupAsset
Management Concept
Measuresto
Mid-Term Business
Plan
Investments managed at Delphi
As of the end of Mar. 2018
total investments : approx. USD 7.7B
Strengthen decision-making and corporate functions across the Group including overseas
Promote the integration of the investment functions in domestic insurance companies
Aggregate U.S. dollar-denominated asset management in domestic insurance companies to Delphi
Aligned group management
Based on the management policy reflecting the characteristics of insurance liabilities, steady accumulation of overseas assets and utilization of alternative investment
The medium and long term profit growth
Ⅰ Tokio Marine Group Business Strategy
Group companies Start of entrustmentPhiladelphia July 2014~
Tokio Millennium Re July 2015~
TMNF Jan. 2016~
TMHCC Mar. 2016~
TMNL Jan. 2017~
NF (Plan) June 2018~

Copyright (c) 2018 Tokio Marine Holdings, Inc.20
5-2. Group Asset Management (2)
Asset composition of TMHD (Consolidated) Group income return
Continue to implement the measures to
investment centered on long-term bonds in Japan
and diversified investment measures by
leveraging the Group’s comprehensive investment
capability
※As of the end of Mar. 2018
3.2%5.5%
38.0%
11.7%
21.8%
0.9%4.4%
14.4%4.5%4.4%
4.3%
4.0%
2.3%2.2%2.3%2.1%
2013 2014 2015 2016
1.6% 1.6% 1.5% 1.4%
4.6%
2.3%
1.5%
2017
Group total
Domestic government bonds (JGB): ¥7.7TMainly bonds for the purpose of ALM by Domestic Life and Non-Life
Total Assets
¥22.9T
■ Domestic bonds ¥8.7T■ Domestic equities
¥2.6T
Mainly local country bonds held by overseas subsidiaries mainly in the U.S. and Europe
Investment by Domestic Non-Life (TMNF) and overseas subsidiaries
Mainly business-related equities held by Domestic Non-Life (TMNF)
■ Cash and deposits ¥0.7T■ Others ¥3.3T
■ Loans ¥1.0T
■ Foreign securities¥5.0T
■ Other securities ¥0.2T
Mainly assets in separate accounts held by Domestic Life
■ Monetary receivables bought ¥1.2T
Ⅰ Tokio Marine Group Business Strategy
Overseassubsidiaries
Domesticsubsidiaries
Mainly tangible fixed assets and intangible fixed assets etc.

Copyright (c) 2018 Tokio Marine Holdings, Inc.21
2002.3E 2007.3E 2018.3E
*2 : Figure at the end of FY2002 is set at index value of 100
Continuous reduction of business-related equities for capital efficiency
Book value of business-related equities*2
• Book value of business-related equities declined to 40% from Mar. 31, 2002 through steady actions
• Sold total amount of approx. ¥2.0T*1 since FY2002• The new mid-term business plan, we will also plan to sell ¥100 billion or more a year
Sales amount
2012.3E
100
82
57
40
*1: Market price at the time of sale
The previous mid-term business plan (2015-2017)
Plan : Sell ¥100.0B or more every year Result: Sold ¥100.0B or more every year
The new mid-term business plan (2018-2020)
Plan : Continue to sell ¥100.0B or more every year
FY Sales amount
2015 ¥122.0B
2016 ¥117.0B
2017 ¥108.0B
3 years total ¥347.0B
5-3. Group Asset Management (3)Ⅰ Tokio Marine Group Business Strategy

Copyright (c) 2018 Tokio Marine Holdings, Inc.22
Ⅱ Business Plan and Strategy by Domain

Copyright (c) 2018 Tokio Marine Holdings, Inc.
1-1. TMNF Main KPIs
Business Unit Profits (billions of yen)
Net Premiums Written(billions of yen)
1,610
Normalized basis*1
2,146.02,144.7
2017 2018Projections
2020Plans
2018Projections
2020Plans
Combined Ratio(Private insurance :E/I basis)
2017 2018Projections
2020Plans
Natural catastrophes normalized to anaverage annual basis
approx. 92~93% *3
155.0
*2: Including the impact of both consumption tax increase and the revision of law of obligation (approx. ¥-28B after-tax)
CAGR +1% or more CAGR +1% or more *2
• Despite the impact of rate reduction in auto insurance, etc., achieve sustainable growth due to steady implementation of growth measures
• We will maintain the Combined Ratio at below 95%, though the impact of consumption tax increase and the revision of law of obligation, etc. are foreseen
*1 : Excluding FX effects, and net incurred losses relatingto natural catastrophe losses are normalized to an average annual level
23
2017
Ⅱ Business Plan and Strategy by Domain
91.3%92.2%
150.0
*3: Including the impact of both consumption tax increase and the revision of law of obligation (approx. 2pt )

Copyright (c) 2018 Tokio Marine Holdings, Inc.
Through relentless pursuit of quality, promote three measures to enhance business structure and achieve “sustainable growth” and “stable profits generation“
24
The best quality products / services(Develop attractive products & services)
The best quality sales channel(Enhance quality and expand
volume of sales channel)
The best quality business process(Enhance productivity through
business process improvement)
Three measures to enhance business structure
• Change product portfolio through the integrated business model for life and non-life and regional revitalization and health & productivity management, etc.
• Advance products and servicescentering on strengthening R&D and utilizing new technology
• Increase sales productivity through enhancement of expertise and consulting ability of agents
• Expand new market by creating new customer contacts through channel mix
• By utilizing the new technologies and ceaseless operational streamlining, enhance productivity through a simple and speedy business process.
1 2 3
1-2. TMNF Concepts of the New Mid-Term Business Plan (challenge to the best quality)
Spreading Group culture “To Be a Good Company” throughout the organization
• Change product portfolio through life and non-life cross-selling business model and regional revitalization and health & productivity management, etc.
• Advance products and servicescentering on strengthening R&D and utilizing technology
• Increase sales productivity through enhancement of expertise and consulting ability of agents
• Expand new market by creating new customer contacts through channel mix
• By utilizing new technologies and ceaseless operational streamlining, enhance productivity through a simple and speedy business process
• Increase sales productivity through enhancement of expertise and consulting ability of agents
• Expand new sales channel by business tie-up with market holders and promoting channel mix, etc.
Ⅱ Business Plan and Strategy by Domain
The best quality human resources (enhance expertise / develop global talents)
Maximize the Group’s comprehensive capability

Copyright (c) 2018 Tokio Marine Holdings, Inc.25
Life and non-life cross-
selling business
model
• We will undertake initiatives to change product portfolio through providing the products/services to prepare for changing environments and enhancing life and non-life cross-selling business model Furthermore, pursue advancing products / services by utilizing new technology
Specialty insurance*4+P.A.net premiums written
(billions of yen)
SME
Social change
Penetration rate of SME’s specialtyinsurance (based on research company data*1)
approx. 65%potential markets
Developedmarkets
• Develop new products for SMEs(income coverage products, etc.)
• Measures of Regional revitalization• Measures of Health & productivitymanagement
Expanding senior generation*2
• Develop nursing care products/services
• Expand income coverage products
• Expand scope of customers eligible
Cyber insurance market size*3 (2016) The response to :• Cyber risks• lot, AI, Big data• Sharing economy• Agricultural risks
1950 1980 2020 2065
4.9%
38.4%28.9%
9.1%
• The diversification of customer needs• Expand customer contact by
various devices / means
• Provide optimum coverages tailored to each customer segmentation• Creating a simple and comfortable insurance procedure• Expansion of services / functions provided to our customers• Advance U/W, pricing, etc.
*4 : “Others” : Excluding fire, marine, P.A., auto, and CALI
2014 2017 2020Plans
432.6
463.5
Futurevision
Super insurance, ratio of the number of Super Insurance with either life or third sector coverage
16%21%
2014 2017 2020 Target
25%
Utilizing technology
Advancing products services
Change our product portfolio
Medical / nursing care
Perspectives Strengthen sectors / measures
1-3. TMNF The Best Quality Products / Services
*1 : Estimated the market size of specialty insurance on an insurance premiums basis based on data and sample questionnaire to 3.2 million SMEs(excluding individual business owners) with 99 employees or less
*2 : Aging rate (proportion of people of 65 years old or more) (Source: An excerpt from “White Pater on Aging society”)*3 : Source OECD, "Japan" is from “Japan Network Security Association”. The figures for "Japan" include insurance lines other than single cyber insurance
(personal information leak insurance, etc.)
Related information
• Further enhancing product attractiveness
• Enhance promotion of multiline sale
Worldwide
¥290.0B
U.S. (¥250.0B) Europe(¥15.0B) Japan(¥13.0B) Others(¥12.0B)
Ⅱ Business Plan and Strategy by Domain

Copyright (c) 2018 Tokio Marine Holdings, Inc.
1-4. TMNF The Best Quality Products / Services• Raise capability of being chosen by customers through efforts to improve quality and efficiency of
agents and initiatives of best channel mix• Increase productivity through new technologies and business process improvement
Sales channelB
usiness process
■ Expansion of new markets by creating new customer contacts through channel mix
■ Provide support to become scaled agents to enhance quality and productivity
■ Increase productivity by utilizing new technology
Collaboration of channels of different strengths and uniqueness Future direction
• Enhance the cooperation with market holders
Operational streamlining by utilizing technology
Reduce office work of 20-30% in the long-term
• Execution of business process reform project
• Promoting easy & comfortable procedures
• Inquiry responses by AI• Voice mining for accident reports
• Utilizing RPA• Advance easy & comfortable procedures• Further utilizing AI, etc.
• Collaboration among corporate agents / financial agents and full-time agents
• Sales expansion of non-life insurance by Life Professionals and tied-up life insurance companies
<Trends of direct net premiums written>
*2 : Total of the members of The General Insurance Association of Japan (excluding TMNF)(Source: The website of The General Insurance Association )
Growth outperforms the market
Competitive business efficiency
<Agents handling premiums ¥0.1B or more>
■ Premium compositionamong full-time agents
2011.3E 2018.3E
60.4%
1,593Agents
83.2%
1,894(+19%)
■ TMNF■ Market *1
CAGR +3.8% (billions of yen)
26
33.5%
<Expense ratio (all lines)>
TMNF(Privateinsurance)
35.1% 32.5%32.7%
30.7%
2010 2016 2017
35.0%
30.8%
32.6%
TMNF Market*2
2010 2012 2014 2016
7,174.9
1,851.4
25.8%Market share
8,611.2
2,322.1
27.0%
CAGR +3.1%CAGR +3.8%
*1: Source: The website of The General Insurance Association of Japan
Ⅱ Business Plan and Strategy by Domain
Copyright (c) 2018 Tokio Marine Holdings, Inc.
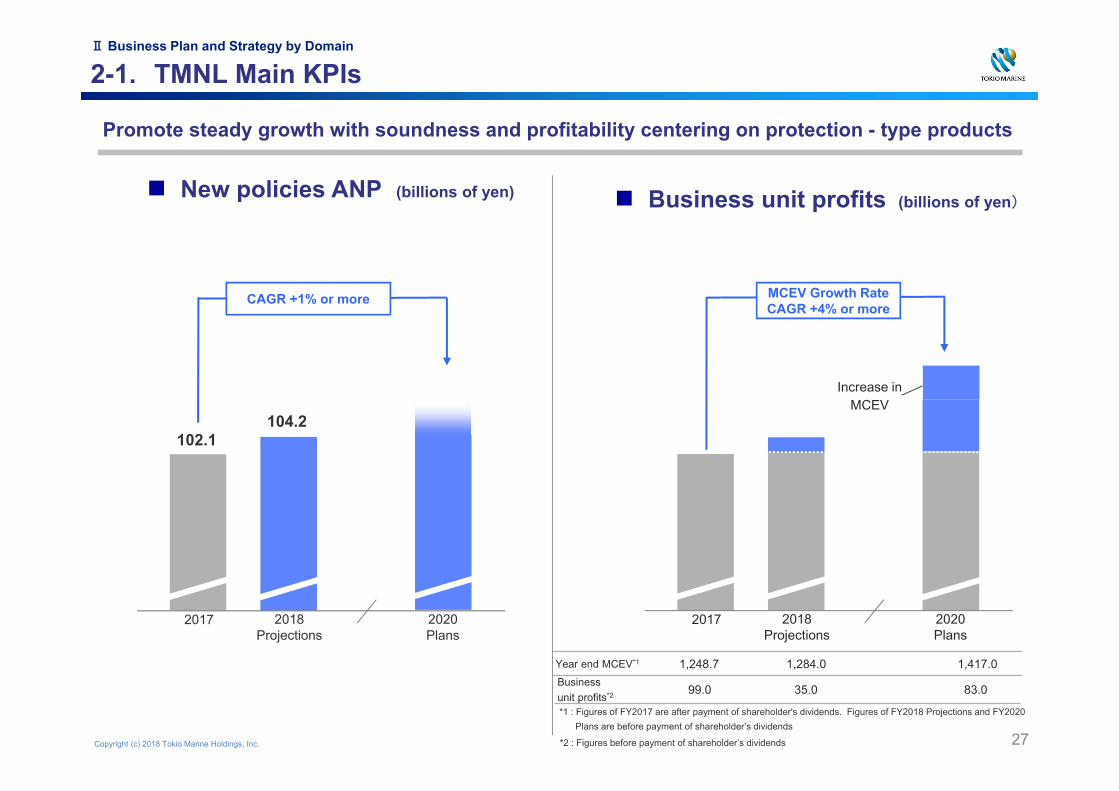
2-1. TMNL Main KPIs
Year end MCEV*1 1,248.7 1,284.0 1,417.0
2017 2018Projections
2020Plans
Promote steady growth with soundness and profitability centering on protection - type products
New policies ANP (billions of yen)
Businessunit profits*2 99.0 35.0 83.0
2017 2018Projections
2020Plans
102.1104.2
27
CAGR +1% or more MCEV Growth RateCAGR +4% or more
Business unit profits (billions of yen)
Increase inMCEV
*1 : Figures of FY2017 are after payment of shareholder's dividends. Figures of FY2018 Projections and FY2020 Plans are before payment of shareholder’s dividends
*2 : Figures before payment of shareholder’s dividends
Ⅱ Business Plan and Strategy by Domain
Copyright (c) 2018 Tokio Marine Holdings, Inc.
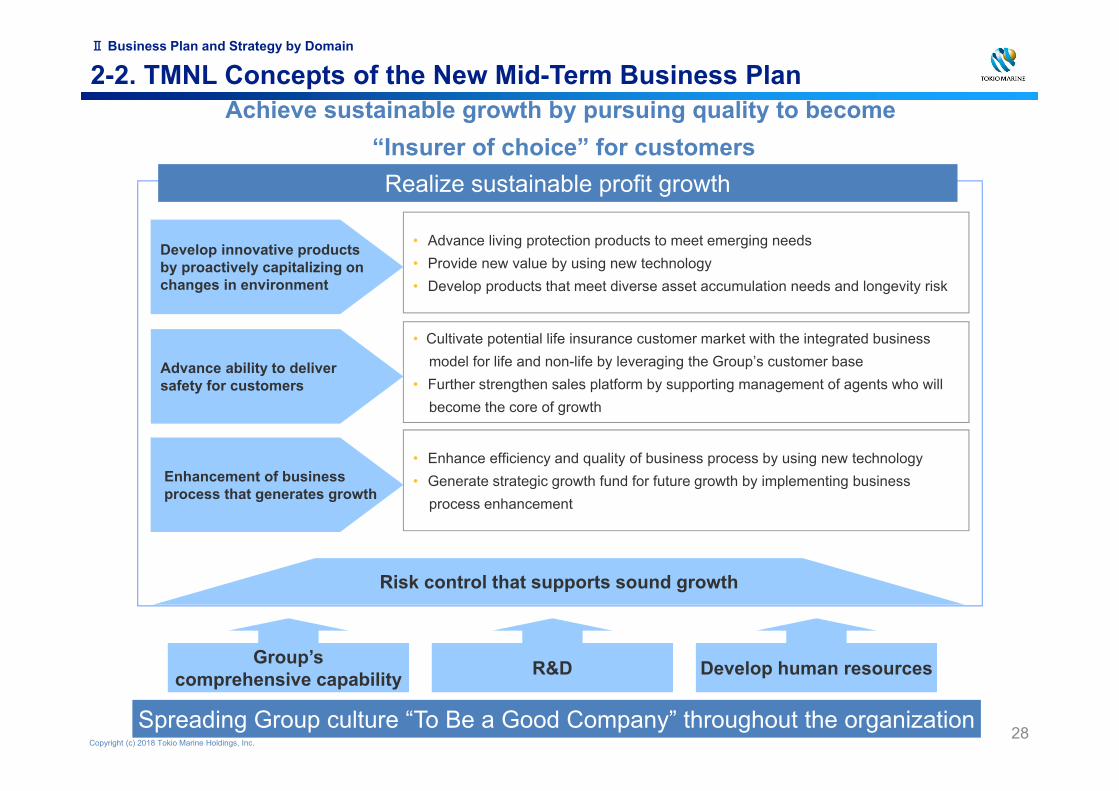
Develop innovative productsby proactively capitalizing onchanges in environment
2-2. TMNL Concepts of the New Mid-Term Business PlanAchieve sustainable growth by pursuing quality to become
“Insurer of choice” for customers
• Advance living protection products to meet emerging needs• Provide new value by using new technology• Develop products that meet diverse asset accumulation needs and longevity risk
• Cultivate potential life insurance customer market with the integrated business model for life and non-life by leveraging the Group’s customer base
• Further strengthen sales platform by supporting management of agents who will become the core of growth
• Enhance efficiency and quality of business process by using new technology• Generate strategic growth fund for future growth by implementing business
process enhancement
Realize sustainable profit growth
Advance ability to deliversafety for customers
Enhancement of business process that generates growth
Group’scomprehensive capability Develop human resourcesR&D
Risk control that supports sound growth
Spreading Group culture “To Be a Good Company” throughout the organization 28
Ⅱ Business Plan and Strategy by Domain

Copyright (c) 2018 Tokio Marine Holdings, Inc.
2-3. TMNL Products and Services StrategiesDevelop innovative products by proactively capitalizing on changes in environment, and thoroughly pursuing quality to be “Insurer of choice" for customers
Demographic change(Aging society/
a single-person household)
Technology advancement(AI・Robot・IT)
Advance in medical technology
Becoming health-conscious
Increasing competition of protection - type products
Business environment
Advance living protection products
• Product development to support presymptomatic disease / prevention / enhancing health
• Continue to launch highly unique protection -type products, expecting advancing medical technology
• Expecting expansion of senior citizen, advance underwriting so that we can provide coverages to as many our customers as possible
Utilizing technology
Further utilization of sensing technology and living pattern data such as the number of steps and sleeping
Respond to asset accumulation needs and longevity risks
Unique product lineup
• R series (medical/cancer insurance)
• Household Income Term Insurance NEO
• Aruku Hoken (medical insurance)
Exceeded 1 Million
• Market link(Variable insurance with installment plans)
R series
Receive a high external evaluation
29
Aruku Hoken
• Considering products, a different type from existing products, to respond to asset accumulation needs of based on expanding “longevity risk"
Medical and cancerinsurance
Insurance Comparison Site "Insurance Market", " The most selected insurance last year” in 2018
20122013~2015
2017
2015
2016
~ Launched life insurance revolution toprotect one's living ~
• Cancer Treatment Support Insurance NEO• Medical Kit NEO
Ⅱ Business Plan and Strategy by Domain

Copyright (c) 2018 Tokio Marine Holdings, Inc.
The Growth rate of protection - type product*
(in-force policies basis)
(ten thousands of policies)
30
Achieve further growth by promoting business process enhancement and enhancing the ability to provide safety to customers worldwide
Improve efficiency and quality of business processes
• Shift the provided staff into growing fields to strengthen a competitive edge
2-4. TMNL Sales and Business Structure Process
Advanced capabilities for delivery
Enhancing business process
• Utilizing the Group's customer base, cultivate the market with the integrated business model for life and non-life
Life Partners (direct)approx. 10%
Bancassuranceapprox. 5%
Life Professionalsapprox. 25%
• Transition of business processes of the sales such as office administrative work and inquiry responses to back office
• Automate part of the office work by utilizing the latest technology
(Measures implemented)
• Supporting management of agents who will become the core of growth
• Generate further synergy effect by amalgamating the distribution channels
Vast customer base
×Non-lifeAgents
approx. 60%
Channel Composition(life insurance premiums on managerial accounting basis as of the end of Mar.
2018)
• Spreading use of easy & comprehensive procedure
Non-life Agents(Market holders such as
corporates, card, and mailorder company, etc.)
Life Professionals Life Partners
High level of expertise
Deep cultivation of the potential life insurance customer market
Non-life Agents
・ Develop know-how (Training for sales agents /Internal control) gained through business support to the direct capital agents*,expand them to other agencies and strengthen relationship
* : TMNL 100% owned agents (Tokio Marine Anshin Agency)
FY2014 FY2017 FY2020Projections
320
CAGR+ approx. 8%
240
*:Medical/Cancer/Household Income Term/Longlife Support Whole Life
Providing personnelin the growth field
Ⅱ Business Plan and Strategy by Domain

Copyright (c) 2018 Tokio Marine Holdings, Inc. 31
3-1. International Insurance: Main KPI’sPursue global opportunities to enhance growth and continue building a diversified business portfolio as the Group’s growth driver
Net premiums written (billions of yen) Business unit profits (billions of yen)
*1 : FX when converting to yen is adjusted to FX of Mar. 31, 2018.(Regarding International Insurance, the same applies hereinafter)
Applied FX rate
(USD/JPY)
Applied FX rate
(USD/JPY)Normalized
basis *1
Mar.31, 2018¥106.2
*2 : FX when converting to yen is adjusted to FX of Mar. 31, 2018.Excluding the impact of FX gains/losses at major overseas subsidiaries. Nat-cat losses are normalized to an average annual level.Excluding one time impact of U.S. Tax Reform.
(Regarding International Insurance, the same applies hereinafter)
*3 : CAGR excluding the impact of the US tax reform from 2020 plans isapprox. +8%
Normalized basis*2
Ⅱ Business Plan and Strategy by Domain
2017 2020Plans
145.0
165.0
CAGR +approx. 11% *3
2018Projections
95% level96%
C/R
Mar.31, 2018¥106.2
2017 2020Plans
1,648.01,713.0
CAGR +approx. 5%
2018Projections
98%(Normalized basis)

Copyright (c) 2018 Tokio Marine Holdings, Inc.
3-2. International Insurance: Concepts of the New Mid-Term Business Plan
Seek new business opportunities in both developed and emerging markets for sustainable, profitable growth and diversification of the group, while maintaining discipline
Enhance “Integrated Group Management”
Spreading Group culture “To Be a Good Company” throughout the organization
•Be the driver of diversification and sustainable profit growth of the Group•Pursue balanced, sustainable growth in both developed and emerging markets organically and through strategic M&A•Strengthen “Integrated Group Management" through globalization and enhancement of business support functions
IT platform developmentGlobal HR development and talent utilization
Capture sustainable profit growth of Group Companies・Pursue global synergies・Strengthen support for Japanese clients through collaboration between domestic and international businesses
Promote innovation through new technology・Operational efficiency improvement and sophistication・Business model innovation
Sustainable Organic Growth
Globalize and enhance Corporate Functions / Promote Enterprise Risk Management (ERM)
Strategic M&A
32
Ⅱ Business Plan and Strategy by Domain
Copyright (c) 2018 Tokio Marine Holdings, Inc.
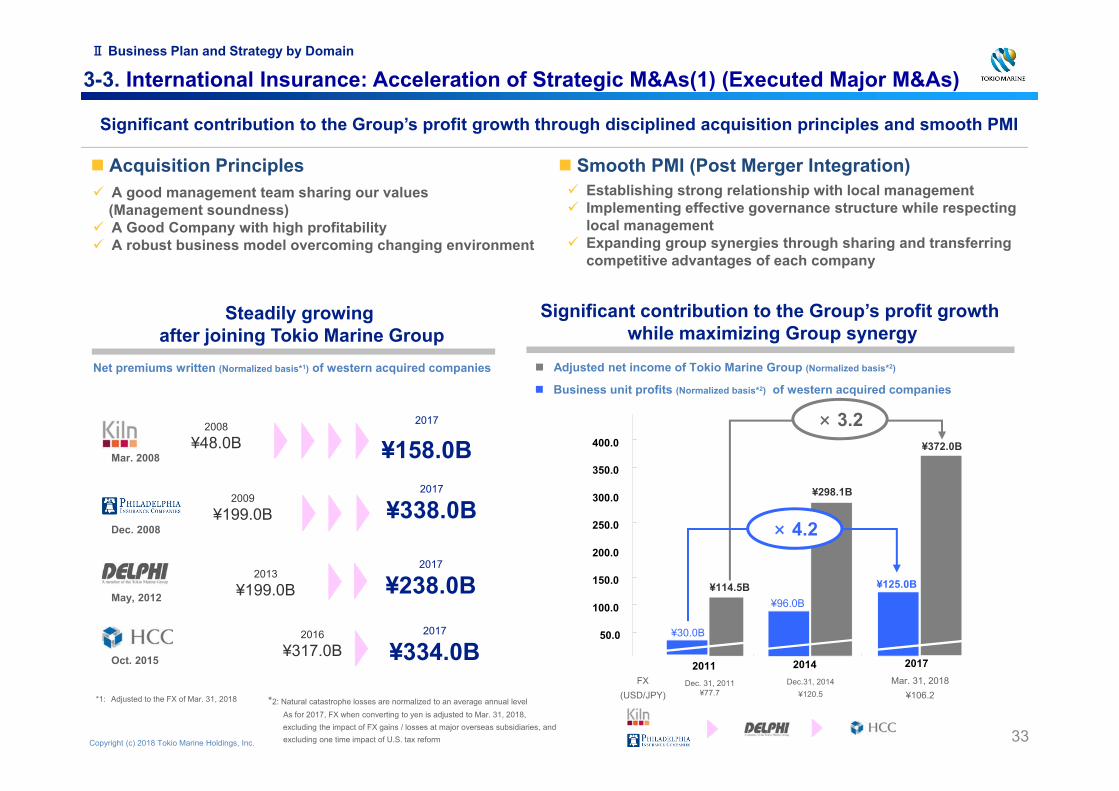
3-3. International Insurance: Acceleration of Strategic M&As(1) (Executed Major M&As)
Significant contribution to the Group’s profit growth through disciplined acquisition principles and smooth PMI
Business unit profits (Normalized basis*2) of western acquired companies
Ⅱ Business Plan and Strategy by Domain
Acquisition Principles A good management team sharing our values
(Management soundness) A Good Company with high profitability A robust business model overcoming changing environment
Smooth PMI (Post Merger Integration) Establishing strong relationship with local management Implementing effective governance structure while respecting
local management Expanding group synergies through sharing and transferring
competitive advantages of each company
Steadily growing after joining Tokio Marine Group
Significant contribution to the Group’s profit growthwhile maximizing Group synergy
Net premiums written (Normalized basis*1) of western acquired companies
Mar. 2008
Dec. 2008
May, 2012
Oct. 2015
2017
¥158.0B2017
¥338.0B
2008¥48.0B
2009¥199.0B
2013¥199.0B
2016¥317.0B
2017
¥238.0B2017
¥334.0B
Adjusted net income of Tokio Marine Group (Normalized basis*2)
*1: Adjusted to the FX of Mar. 31, 2018
33
2011 2014
¥298.1B
2017
50.0
100.0
150.0
200.0
250.0
300.0
350.0
400.0
¥114.5B
¥372.0B
¥30.0B
¥96.0B
¥125.0B
*2: Natural catastrophe losses are normalized to an average annual levelAs for 2017, FX when converting to yen is adjusted to Mar. 31, 2018,excluding the impact of FX gains / losses at major overseas subsidiaries, andexcluding one time impact of U.S. tax reform
FX(USD/JPY)
Mar. 31, 2018¥106.2
Dec.31, 2014¥120.5
Dec. 31, 2011¥77.7
× 3.2
× 4.2

Copyright (c) 2018 Tokio Marine Holdings, Inc.
3-3. International Insurance: Acceleration of Strategic M&As(2) (our focus)Ⅱ Business Plan and Strategy by Domain
34
Emerging countries’ markets growth*1
*1: Trend of non-life direct premiums written, FY2012 is set at index value of 100
(Source)Swiss Re Institute: Global insurance review 2017 and outlook 2018/19
major products
Promote strategic M&A targeting emerging countries (primarily Asia, etc.) and developed countries with the aim to establish a well-balanced business portfolio that delivers stable and profitable growth
Emerging Countries Emerging countries’ business unit
profits constitutes just under 10 percent of the international business
Further promote geographical diversification through implementing M&A in emerging markets where high growth is expected in the mid to long term
Developed Countries In developed countries market where
North America accounts for approx. 80% of business unit profits, risks are well-diversified thanks to a wide range of specialty insurance product
Aim to further expand specialty franchise through M&A including bolt-on
Human ServicesReal EstateDisabilityExcess W/C Property & Liability
MarineMedical Stop-loss
AgricultureD&OUS Liability
CAGR +6.2%
100
120
140
160
2012 2017E 2018F 2019F2016
FY2018Business Unit Profits*2
composition(Projections)
Philadelphia
24%
Delphi
28%
TMHCC
25%
North Americaother 2%
South & Central America
Asia & Middle East Reinsurance
5%
Europe6%
5%
1%Life
3%
*2: Denominator: Total of Business Unit Profits of international insurance business on a before adjustment of head office expenses basis
FY2017Premium composition
by line
Lloyd’s business

Copyright (c) 2018 Tokio Marine Holdings, Inc. 35
3-4. International Insurance: North America (1)
Aim for sustainable profit growth while pursuing synergies between group companies
Business Unit Profits (billions of yen)Net Premiums Written (billions of yen)
Ⅱ Business Plan and Strategy by Domain
US Commercial P&C Market Share (2017)
94% level95% 95%C/R
NorthAmerica
2017 2020Plans
985.01,027.0
CAGR +approx. 4%
2018Projections
2017 2020Plans
132.0
CAGR +approx. 7%
2018Projections
2.1%*
3rd Liberty Mutual
1st Chubb Ltd.2nd Travelers Companies Inc.
10th Tokio Marine Group9th Hartford Financial Services
11th American Financial Group Inc.
8th Nationwide Mutual Group
(Source) SNL Financial
4th Zurich Insurance Group5th American International Group6th CNA Financial Corp.7th Berkshire Hathaway Inc.
・・・ *: Market share in all lines of US P&C is 1.1% (17th place)
Normalized basis
132.0 137.0

Copyright (c) 2018 Tokio Marine Holdings, Inc.
80%
90%
100%
110% US P&C market average
Philadelphia
36
95% level94%96%C/R
Combined Ratio
Strengths of Philadelphia Future initiatives Maintain and enhance high renewal ratio and rate
increases through improving productivity of franchise network and products focused on niche markets
Create a competitive business model focused on niche markets and a robust franchise network
Channel compositions(FY2017)
Product compositions(FY2017)
2017 2020Plans
40.042.0
CAGR +approx. 5%
2018Projections
2017 2020Plans
338.0347.0
CAGR +approx. 3%
2018Projections
PreferredAgent
National/Global Broker
PHLY Select*2
Open Brokerage
Direct Sales 3.3%Wholesalers 2.5% Other 0.3%
35.4%
20.4%12.3%
10.2%
HumanServices
Real Estate
Public Service 7.4%
Mgmt & Prof.
Sports & Rec.
Other
32.8%
18.5%11.9%
19.2%
Renewal ratio
25.7%
*2: Candidates for the future preferred agents
*1: Local management accounting basis
2016
88.7%
2017
89.0%
2015
88.7%
Philadelphia 3.6% 1.8% 1.5%
Market average*3 Approx.1%
Approx.0%
Approx.1% *3: (Source)
Willis Towers Watson
Normalized basis
Rate increases
Ⅱ Business Plan and Strategy by Domain
3-4. International Insurance: North America (2) (Philadelphia)
Maintain growth and profitability outperforming the market through underwriting discipline and action
Net Premiums Written(billions of yen)
Business Unit Profits(billions of yen)
*1
Copyright (c) 2018 Tokio Marine Holdings, Inc.
80%
90%
100%
110% US P&C market average
Delphi
37
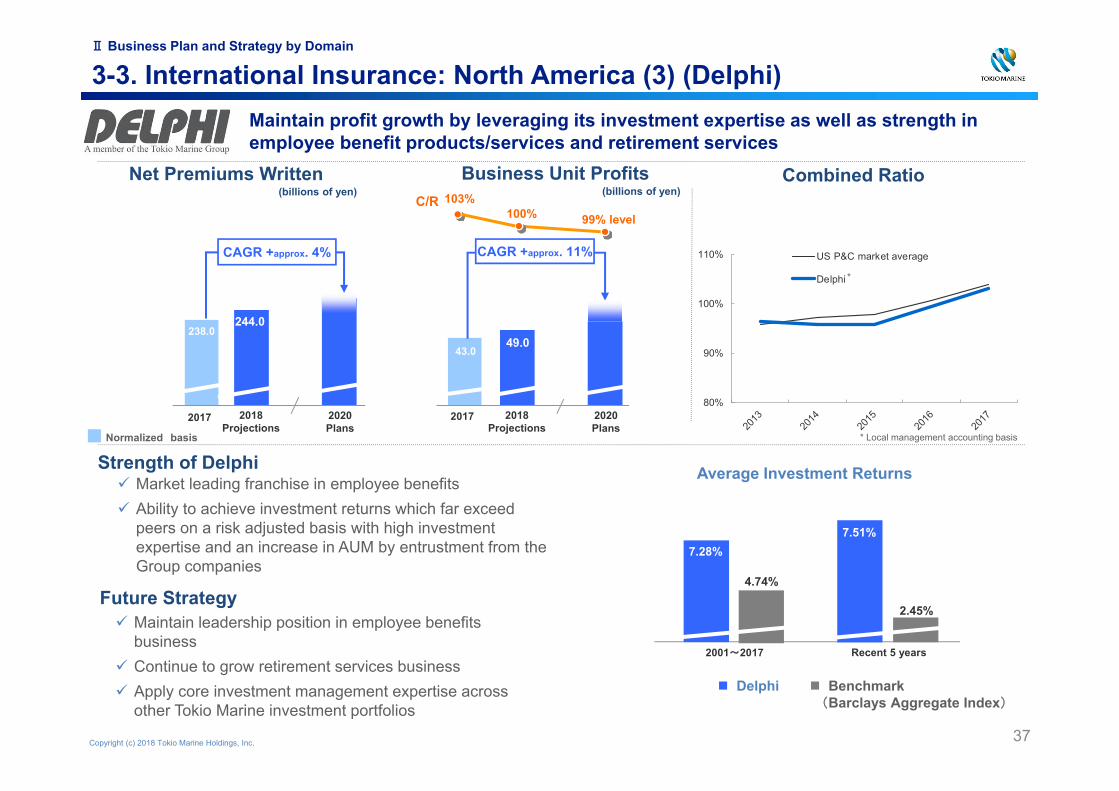
3-3. International Insurance: North America (3) (Delphi)
Business Unit Profits (billions of yen)
Net Premiums Written(billions of yen)
Ⅱ Business Plan and Strategy by Domain
Combined Ratio
Maintain profit growth by leveraging its investment expertise as well as strength in employee benefit products/services and retirement services
Strength of Delphi
Maintain leadership position in employee benefits business
Continue to grow retirement services business Apply core investment management expertise across
other Tokio Marine investment portfolios
Market leading franchise in employee benefits Ability to achieve investment returns which far exceed
peers on a risk adjusted basis with high investment expertise and an increase in AUM by entrustment from the Group companies
2017 2020Plans
238.0244.0
CAGR +approx. 4%
2018Projections
2017 2020Plans
43.049.0
2018Projections
CAGR +approx. 11%
99% level103%
100%C/R
* Local management accounting basis
Future Strategy2.45%
4.74%
Average Investment Returns
Recent 5 years
7.51%
2001~2017
7.28%
Delphi Benchmark (Barclays Aggregate Index)
Normalized basis
*
Copyright (c) 2018 Tokio Marine Holdings, Inc.
ProAssuranceRLI TMHCC
AlleghanyChubb LtdArch
American FinancialAXISPartnerRe
Travelers
Everest Re
W.R. Berkley
Aspen
XL
MarkelBaldwin & Lyons
Navigators CNA
HartfordGlobal Indemnity Argo Group
C/Rdecade average
C/R changesHighest
Lowest
Highest
Lowest
80%
90%
100%
110%US P&C market average
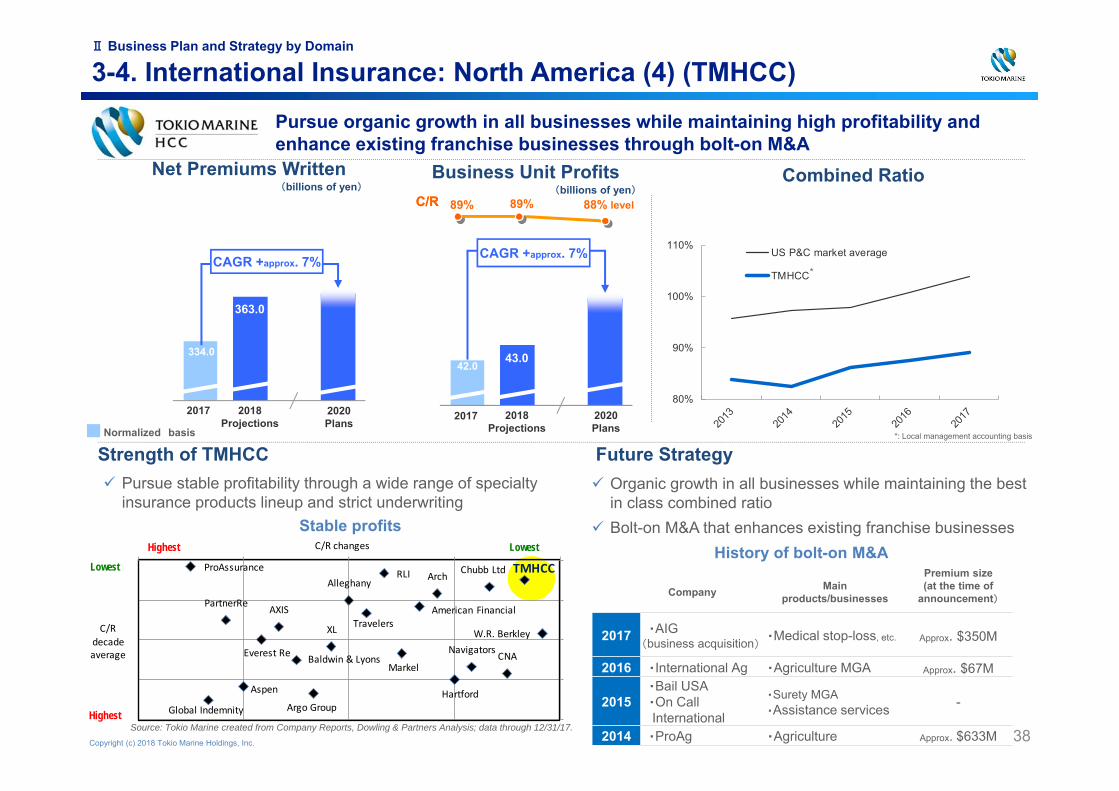
TMHCC
38
3-4. International Insurance: North America (4) (TMHCC)Pursue organic growth in all businesses while maintaining high profitability and enhance existing franchise businesses through bolt-on M&A
Business Unit Profits(billions of yen)
Net Premiums Written(billions of yen)
History of bolt-on M&A
Combined Ratio
Source: Tokio Marine created from Company Reports, Dowling & Partners Analysis; data through 12/31/17.
Strength of TMHCC Future Strategy Pursue stable profitability through a wide range of specialty
insurance products lineup and strict underwriting
C/R
2017 2020Plans
334.0
363.0
CAGR +approx. 7%
2018Projections 2017 2020
Plans
42.0 43.0
CAGR +approx. 7%
2018Projections
Organic growth in all businesses while maintaining the best in class combined ratio
Bolt-on M&A that enhances existing franchise businesses
Company Mainproducts/businesses
Premium size (at the time of
announcement)
2017 ・AIG (business acquisition)
・Medical stop-loss, etc. Approx. $350M
2016 ・International Ag ・Agriculture MGA Approx. $67M
2015・Bail USA・On Call International
・Surety MGA・Assistance services -
2014 ・ProAg ・Agriculture Approx. $633M
88% levelC/R 89%89%
Stable profits
*: Local management accounting basisNormalized basis
*
Ⅱ Business Plan and Strategy by Domain
Copyright (c) 2018 Tokio Marine Holdings, Inc.
80%
90%
100%
110%
120%Lloyd's market average
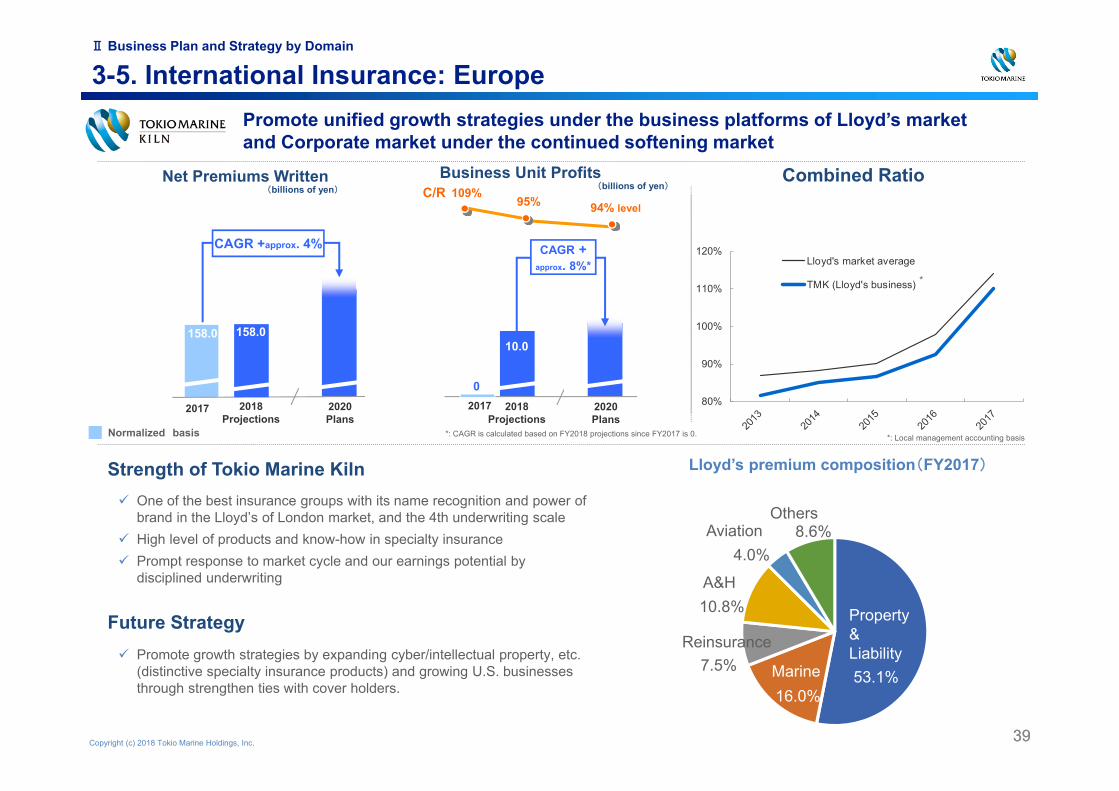
TMK (Lloyd's business)
39
3-5. International Insurance: Europe
Combined Ratio
Strength of Tokio Marine Kiln One of the best insurance groups with its name recognition and power of
brand in the Lloyd’s of London market, and the 4th underwriting scale High level of products and know-how in specialty insurance Prompt response to market cycle and our earnings potential by
disciplined underwriting
Promote unified growth strategies under the business platforms of Lloyd’s market and Corporate market under the continued softening market
Lloyd’s premium composition(FY2017)
Net Premiums Written(billions of yen)
Business Unit Profits(billions of yen)
Future Strategy
2017 2020Plans
2018Projections
10.0
2017 2020Plans
158.0 158.0
CAGR +approx. 4%
2018Projections
94% level109%
95%C/R
0
39
Property &Liability
Marine
Reinsurance
A&H
AviationOthers
53.1%16.0%
7.5%
10.8%
4.0%8.6%
Promote growth strategies by expanding cyber/intellectual property, etc. (distinctive specialty insurance products) and growing U.S. businesses through strengthen ties with cover holders.
*: Local management accounting basisNormalized basis
CAGR +approx. 8%*
*: CAGR is calculated based on FY2018 projections since FY2017 is 0.
*
Ⅱ Business Plan and Strategy by Domain

Copyright (c) 2018 Tokio Marine Holdings, Inc.40
3-6. International Insurance: Reinsurance / South & Central America
South &Central America
Continue profit growth by providing products and services which meet the needs of customers through high quality operation
Business Unit Profit(billions of yen)
Net Premiums Written(billions of yen)
Maintain stable profit by promoting geographical and product line diversification under the continued softening marketReinsurance
Future Strategy
Promote globalization for geographical diversification
Promote diversifying product lines (business expansion of the non nat-cat risks)
Execution of growth strategies focusing on strengthening sales of new products in auto and life insurance fields
2017 2020Plans
138.0145.0
CAGR +approx. 1%
2018Projections
98% level
114%99%C/R
20172020Plans
- 3.0
9.0
2018Projections
CAGR +approx. 8%*1
2017 2020Plans
139.0145.0
CAGR +approx. 4%
2018Projections
2017 2020Plans
5.0 5.0
CAGR +approx. 8%
2018Projections
99% level99% 100%C/R
5.9%
Average of competing groups*2
13.6%<
HIM net incurred losses in net premiums written
*1: Calculate CAGR from FY 2018 projections because FY 2017 is negative.*2: Arch, Aspen, Axis, Everest Re, Markel, Ren Re, ValidusNormalized basis
Normalized basis
Ⅱ Business Plan and Strategy by Domain

Copyright (c) 2018 Tokio Marine Holdings, Inc.41
3-7. International Insurance: Asia & Middle East
41
Achieve growth mainly in the retail market by expanding distribution channels and generating group synergies
Non-life
Life
Build unique business model that is unrivaled in the industry by rolling out the best practices across the Group, personnel exchanges, and utilizing technology.
Establish a profit-generating model for Japanese businesses.
Expansion of agency network and enhance productivity
Shift to the products with low burden of capital
Further progress of life and non-life cross-selling business model in Asia
Future Strategy
Asia &MiddleEast
2017 2020Plans
139.0145.0
CAGR +approx. 7%
2018Projections
2017 2020Plans
89.093.0
CAGR +approx. 10%
2018Projections
CAGR - approx. 8%
2017 2020Plans
12.0* 9.0
CAGR +approx. 3%
2018Projections
97% level95%
99%C/R
2017 2020Plans
6.0*
2.0
2018Projections
*: Excluding the temporary impact of reserve takedown in FY2017,we projected CAGR +11% toward FY2020 plans
*: Excluding the impact of interest rate fluctuation in FY2017, we projected CAGR +21% toward FY2020 plans
Normalized basis
Normalized basis
Net Premiums Written(billions of yen)
Business Unit Profit(billions of yen)
Ⅱ Business Plan and Strategy by Domain

Copyright (c) 2018 Tokio Marine Holdings, Inc.42
Reference•Tokio Marine Holdings Key Statistics
•Return to Shareholders
•FY2017 Results Overview (Consolidated)
•FY2018 Projections Overview (Consolidated)
•Reconciliation of Business Unit Profits and Adjusted Net Income
•Adjusted Net Income and Business Unit Profit
•Definition of Adjusted Net Income, Adjusted Net Assets, Adjusted ROE, and Business Unit Profits
•Reconciliation of Adjusted Net Income and Adjusted Net Assets
•Reconciliation of Business Unit Profits
•Modified ESR Model
•Risk Capital as of Mar. 31, 2018
•Basic Information (Domestic Non-Life)
•Basic Information (Domestic Life)
•Basic Information (International Insurance)
•Group Management Framework
•Globalize and Strengthen Group Management Structure
•Our Initiatives to Support Enhancing Corporate Value
• Impact of FX Rate Change on the Group’s Financial Results
•Asset Portfolio

Copyright (c) 2018 Tokio Marine Holdings, Inc.43
Tokio Marine Holdings Key Statistics
FY2007 FY2008 FY2009 FY2010 FY2011 FY2012 FY2013 FY2014 FY2015 FY2016 FY2017
Net income (billions of yen) *1 108.7 23.1 128.4 71.9 6.0 129.5 184.1 247.4 254.5 273.8 284.1Shareholders' equity after tax(billions of yen) 2,563.5 1,627.8 2,169.0 1,886.5 1,839.6 2,340.7 2,712.7 3,578.7 3,484.7 3,542.1 3,805.1
EPS (yen) 133 29 163 92 7 168 239 323 337 363 382
BPS (yen) 3,195 2,067 2,754 2,460 2,399 3,052 3,536 4,742 4,617 4,722 5,245
ROE 3.6% 1.1% 6.8% 3.5% 0.3% 6.2% 7.3% 7.9% 7.2% 7.8% 7.7%
PBR 1.15 1.16 0.96 0.90 0.95 0.87 0.88 0.96 0.82 0.99 0.90
Adjusted net income (billions of yen) - - - - 30.7 163.1 243.7 323.3 351.9 406.7 341.4
Adjusted net assets (billions of yen) - - - - 2,301.6 2,746.5 3,172.5 4,103.4 3,599.3 3,812.4 4,086.4
Adjusted EPS (yen) - - - - 40 212 317 423 466 539 459
Adjusted BPS (yen) - - - - 3,001 3,580 4,135 5,437 4,769 5,082 5,633
Adjusted ROE - - - - 1.3% 6.5% 8.2% 8.9% 9.1% 11.0% 8.6%
Adjusted PBR - - - - 0.76 0.74 0.75 0.83 0.80 0.92 0.84
Domestic non-life insurance business 99.4 5.1 46.2 20.4 -26.1 48.3 34.0 122.5 126.0 167.6 144.3
Domestic life insurance business 15.1 -57.2 52.0 27.5 15.9 110.3 104.5 139.8 -188.1 373.5 98.4
International insurance business 29.7 20.8 76.5 24.8 -11.9 69.2 136.9 145.5 131.8 169.5 144.1
Financial and general businesses -1.0 -21.1 -9.4 -0.7 2.6 -18.7 2.5 4.0 7.3 6.6 7.2
60 50 95 187 206 115 109 112 122 117 108
2008/3E 2009/3E 2010/3E 2011/3E 2012/3E 2013/3E 2014/3E 2015/3E 2016/3E 2017/3E 2018/3E
*3 802,231 787,562 787,605 766,820 766,928 767,034 767,218 754,599 754,685 750,112 725,433
2,960.6 1,926.8 2,118.3 1,789.3 1,827.1 2,039.2 2,383.9 3,438.0 2,878.6 3,536.2 3,541.9
3,680 2,395 2,633 2,224 2,271 2,650 3,098 4,538.5 3,800.0 4,696.0 4,735.0
- 15.6% - 34.9% 9.9% - 15.5% 2.1% 16.7% 16.9% 46.5% - 16.3% 23.6% 0.8%
1,212.96 773.66 978.81 869.38 854.35 1,034.71 1,202.89 1,543.11 1,347.20 1,512.60 1,716.30
- 29.2% - 36.2% 26.5% - 11.2% - 1.7% 21.1% 16.3% 28.3% - 12.7% 12.3% 13.5%
*1: From FY2015: The figure is "Net income attributable to owners of the parent"*2: Until FY2014: The figures are "Adjusted earnings" (Former KPI), domestic life insurance business is presented on an TEV (Traditional Embedded Value) basis*3: All figures exclude the number of treasury shares held from the total number of the shares issued
Financialaccountingbasis
KPI
Business UnitProfits*2
(billions of yen)
Sales of business-related equity holdings(billons of yen)
Market capitalization (billions of yen)
Share price (yen)
Percentage change
(Reference) TOPIX
Percentage change
Adjusted number of issued and outstanding shares(thousands of shares)

Copyright (c) 2018 Tokio Marine Holdings, Inc.
FY2007 FY2008 FY2009 FY2010 FY2011 FY2012 FY2013 FY2014 FY2015 FY2016 FY2017 FY2018Projections
48yen 48yen 50yen 50yen 50yen 55yen 70yen 95yen 110yen 140yen 160yen(plan) 180yen
38.7bn yen 38.0bn yen 39.4bn yen 38.6bn yen 38.3bn yen 42.2bn yen 53.7bn yen 72.2bn yen 83.0bn yen 105.3bn yen 117.6bn yen 130.5bn yen*4
90.0bn yen 50.0bn yen - 50.0bn yen - - - 50.0bn yen - 50.0bn yen 150.0bn yen(Maximun) TBD
128.7bn yen 88.0bn yen 39.4bn yen 88.6bn yen 38.3bn yen 42.2bn yen 53.7bn yen 122.2bn yen 83.0bn yen 155.3bn yen 267.6bn yen TBD
30.7bn yen 163.1bn yen 243.7bn yen 323.3bn yen 351.9bn yen 406.7bn yen 341.4bn yen 396.0bn yen
220.0bn yen 295.0bn yen 330.0bn yen 360.0bn yen
38% 36% 36% 36%*4
<Reference1 : Financial accounting basis>
108.7bn yen 23.1bn yen 128.4bn yen 71.9bn yen 6.0bn yen 129.5bn yen 184.1bn yen 247.4bn yen 254.5bn yen 273.8bn yen 284.1bn yen 320.0bn yen
36% 165% 31% 54% 639% 33% 29% 29% 33% 39% 42% 41%
<Reference2 : Former KPI>
143.2bn yen - 52.5bn yen 165.4bn yen 72.0bn yen - 19.5bn yen 209.1bn yen 278.1bn yen 412.0bn yen
128.1bn yen 4.7bn yen 113.4bn yen 44.5bn yen - 35.4bn yen 98.8bn yen 173.6bn yen 272.2bn yen
100.0bn yen 80.0bn yen 85.0bn yen 80.0bn yen 80.0bn yen 85.0bn yen 110.0bn yen 155.0bn yen
39% 48% 46% 48% 48% 50% 49% 47%
*1: Total amount approved by the announcement date of 4Q results of respective years*2: Until FY2014: payout ratio to average adjusted earnings (excluding EV) From FY2015: payout ratio to average adjusted net income*3: Excludes effects from the Great East Japan Earthquake and Thai Flood*4: Before reflecting the share repurchses basis
Payout ratio*2
Payout ratio
Net income(Consolidated)
Total distributions to shareholders
Payout ratio*2
Adjusted net income
Averageadjusted net income
Average adjusted earnings(excluding EV)*3
Adjusted earnings
Adjusted earnings (excluding EV)
Dividends total
Dividends per share
Share repurchases*1
44
Return to shareholders
Adjusted net income was adopted as a new KPI in FY2015.
(Figures from FY2011 to FY2014 were calculated as a reference)
Key Statistics from FY2007 to FY2014 are shown in Reference 2 table.

Copyright (c) 2018 Tokio Marine Holdings, Inc.
FY2017 Results Overview (Consolidated)
45
(billions of yen, except for %)
■Ordinary income (TMHD Consolidated) 5,232.6 5,399.1 166.5 + 3.2%
Net premiums written (TMHD Consolidated) 3,480.4 3,564.7 84.2 + 2.4%Life insurance premiums (TMHD Consolidated) 904.4 953.0 48.5 + 5.4%
■Ordinary profit (TMHD Consolidated) 387.6 344.9 - 42.7 - 11.0%
Tokio Marine & Nichido 312.4 325.8 13.4 + 4.3%Nisshin Fire 9.0 7.5 - 1.4 - 16.0%Tokio Marine & Nichido Life 13.2 23.5 10.2 + 77.6%Overseas subsidiaries 174.1 126.2 - 47.9 - 27.5%Financial and general 6.2 7.4 1.2 + 19.4%
Elimination of dividends received by Tokio Marine & Nichido from subsidiaries etc. - 64.4 - 92.6 - 28.2Purchase method adjustments - 3.8 - 3.1 0.6Amortization of goodwill and negative goodwill - 51.1 - 43.8 7.3Others (Consolidation adjustments, etc.) - 7.9 - 6.0 1.9
■Net income attributable to owners of the parent 273.8 284.1 10.3 + 3.8%
Tokio Marine & Nichido 248.6 253.8 5.2 + 2.1%Nisshin Fire 6.5 5.3 - 1.2 - 18.7%Tokio Marine & Nichido Life 8.7 15.5 6.7 + 77.1%Overseas subsidiaries 135.6 145.3 9.7 + 7.2%
Impact of U.S. Tax Reform - 57.8 57.8Financial and general 4.0 5.0 1.0 + 24.8%
Elimination of dividends received by Tokio Marine & Nichido from subsidiaries etc. - 64.4 - 92.6 - 28.2Purchase method adjustments - 4.4 - 2.4 2.0Amortization of goodwill and negative goodwill - 51.1 - 43.8 7.3Others (Consolidation adjustments, etc.) - 9.7 - 2.1 7.5
【KPI for the Group Total】■ Adjusted net income 406.7 341.4 -65.3 - 16.1%
FY2016 FY2017 %Change
YoY

Copyright (c) 2018 Tokio Marine Holdings, Inc.
FY2018 Projections Overview (Consolidated)
46
(billions of yen, except for %)
■Ordinary income (TMHD Consolidated) 5,399.1
Net premiums written (TMHD Consolidated) 3,564.7 3,530.0 - 34.7 - 1.0%Life insurance premiums (TMHD Consolidated) 953.0 950.0 - 3.0 - 0.3%
■Ordinary profit (TMHD Consolidated) 344.9 450.0 105.0 + 30.5%
Tokio Marine & Nichido 325.8 328.0 2.1 + 0.7%Nisshin Fire 7.5 7.6 0.0 + 0.3%Tokio Marine & Nichido Life 23.5 31.3 7.7 + 33.0%Overseas subsidiaries 126.2 168.0 41.7 + 33.1%Financial and general 7.4 5.8 - 1.6 - 22.4%
Elimination of dividends received by Tokio Marine & Nichido from subsidiaries etc. - 92.6 - 44.9 47.7Purchase method adjustments - 3.1 - 3.0 0.1Amortization of goodwill and negative goodwill - 43.8 - 33.2 10.6Others (Consolidation adjustments, etc.) - 6.0 - 9.6 - 3.5
■ Net income attributable to owners of the parent 284.1 320.0 35.8 + 12.6%
Tokio Marine & Nichido 253.8 242.0 - 11.8 - 4.7%Nisshin Fire 5.3 5.6 0.2 + 4.7%Tokio Marine & Nichido Life 15.5 21.0 5.4 + 34.8%Overseas subsidiaries 145.3 138.0 - 7.3 - 5.1%
Excluding Impact of U.S. Tax Reform 87.5 126.0 38.4 + 43.9%Impact of U.S. Tax Reform 57.8 12.0 - 45.8 - 79.3%
Financial and general 5.0 3.9 - 1.1 - 23.4%
Elimination of dividends received by Tokio Marine & Nichido from subsidiaries etc. - 92.6 - 44.9 47.7Purchase method adjustments - 2.4 - 2.1 0.3Amortization of goodwill and negative goodwill - 43.8 - 33.2 10.6Others (Consolidation adjustments, etc.) - 2.1 - 10.3 - 8.1
【KPI for the Group Total】■ Adjusted net income 341.4 396.0 54.6 + 16.0%
FY2017Results
FY2018Projections %Change
YoY
Copyright (c) 2018 Tokio Marine Holdings, Inc.47
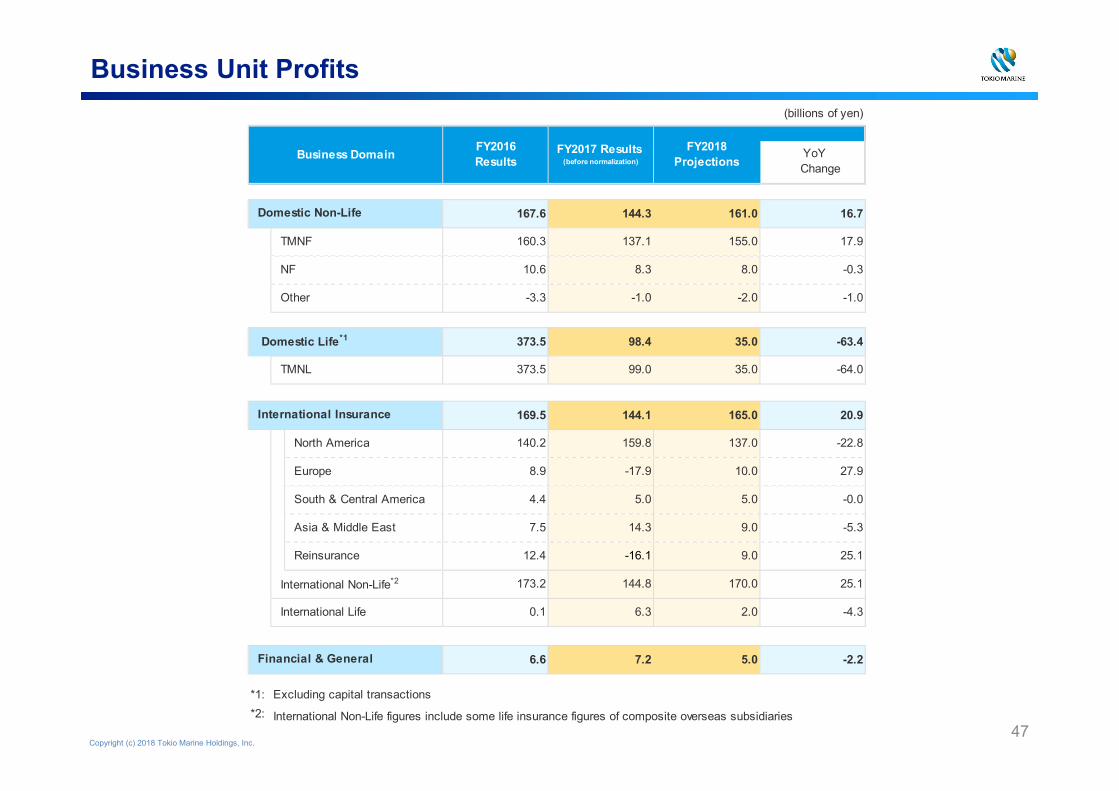
Business Unit Profits(billions of yen)
167.6 144.3 161.0 16.7
TMNF 160.3 137.1 155.0 17.9
NF 10.6 8.3 8.0 -0.3
Other -3.3 -1.0 -2.0 -1.0
373.5 98.4 35.0 -63.4
TMNL 373.5 99.0 35.0 -64.0
169.5 144.1 165.0 20.9
North America 140.2 159.8 137.0 -22.8
Europe 8.9 -17.9 10.0 27.9
South & Central America 4.4 5.0 5.0 -0.0
Asia & Middle East 7.5 14.3 9.0 -5.3
Reinsurance 12.4 -16.1 9.0 25.1
International Non-Life*2 173.2 144.8 170.0 25.1
International Life 0.1 6.3 2.0 -4.3
6.6 7.2 5.0 -2.2
*1: *2:
FY2017 Results (before normalization)
International Non-Life figures include some life insurance figures of composite overseas subsidiaries
Financial & General
Domestic Life*1
Excluding capital transactions
FY2016ResultsBusiness Domain
International Insurance
FY2018Projections
Domestic Non-Life
YoY Change

Copyright (c) 2018 Tokio Marine Holdings, Inc. 48
Business unit profits Adjusted net income
+56.4396.0
- 14.0- 12.4
Reconciliation of Business Unit Profits / Adjusted Net Income
35.0(10%)
Total ¥366.0B*
161.0(44%)
165.0(45%)
International insurance business
Domestic non-life
Business unit profitsFY2018
Projections
Domestic life
Domestic non-life161.0
Domestic life
35.0
International insurance165.0
Financial /general
5.0
Gains relating to sales of business-
related equities
Domestic Life
Difference between financial
accounting and MCEV
Other adjustments,
etc.
(billions of yen)
* :Total of Business unit profits of domestic non-life, domestic life, international insurance business, and financial/general businesses

Copyright (c) 2018 Tokio Marine Holdings, Inc.
Adjusted Net Income and Business Unit Profit
Adjusted Net Income (Group total) Business Unit Profits
For each business domain, “Business Unit Profits” is used from the perspective of accurately assessing corporate value including economic value, etc. for the purpose of long-term expansion
Use MCEV (market-consistent embedded value) for domestic life, which reflects the economic value of the business more accurately
For the Group total, “Adjusted Net Income” based on financial accounting is used from the perspective of enhancing transparency and comparability as well as linking with shareholder returns
Profit indicator for the Group total as the base for calculating capital efficiency (adjusted ROE) and source of dividends
<Main differences>
Adjusted Net Income Business Unit Profits
Domestic non-life Gains or losses on sales ofbusiness-related equities Included Excluded
Provision for reserves of capitalnature, etc. Excluded Excluded
Domestic life Adjust the financial accountingbasis net income
Increase in MCEVduring the current fiscal year
Other than the above Amortization of goodwill andother intangible fixed assets Excluded Excluded
Creating long-term corporate valueEnhancing transparency and comparability /Linking with shareholder returns
49
Copyright (c) 2018 Tokio Marine Holdings, Inc.
Definition of Adjusted Net Income / Adjusted Net Assets / Adjusted ROE / Business Unit Profits
*1: Each adjustment is on an after-tax basis*2: Net income attributable to owners of the parent*3: In case of reversal, it is subtracted from the equation*4: ALM: Asset Liability Management. Excluded since it is counter balance of ALM
related liabilities*5: Average balance basis
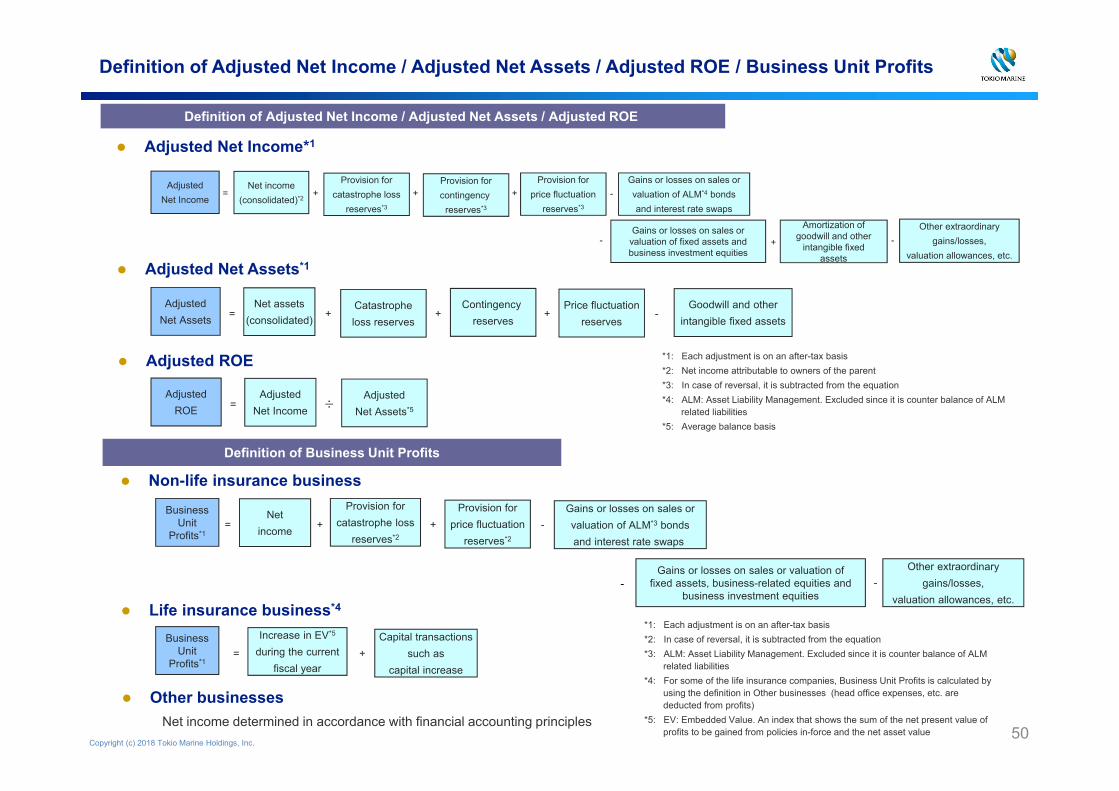
Adjusted Net Income*1
Adjusted Net Assets*1
Adjusted ROE
Definition of Adjusted Net Income / Adjusted Net Assets / Adjusted ROE
AdjustedNet Income
Net income(consolidated)*2
Provision forcatastrophe loss
reserves*3
Provision forcontingency
reserves*3
Provision forprice fluctuation
reserves*3
Gains or losses on sales orvaluation of ALM*4 bondsand interest rate swaps
= + + + -
Amortization of goodwill and other
intangible fixed assets
Gains or losses on sales or valuation of fixed assets and business investment equities
Other extraordinarygains/losses,
valuation allowances, etc.+- -
AdjustedNet Assets
Net assets(consolidated)
Catastropheloss reserves
Contingency reserves
Price fluctuationreserves
= + + + -Goodwill and other
intangible fixed assets
AdjustedROE
AdjustedNet Income
AdjustedNet Assets*5= ÷
*1: Each adjustment is on an after-tax basis*2: In case of reversal, it is subtracted from the equation*3: ALM: Asset Liability Management. Excluded since it is counter balance of ALM
related liabilities*4: For some of the life insurance companies, Business Unit Profits is calculated by
using the definition in Other businesses (head office expenses, etc. are deducted from profits)
*5: EV: Embedded Value. An index that shows the sum of the net present value of profits to be gained from policies in-force and the net asset value
Life insurance business*4
Non-life insurance business
Other businessesNet income determined in accordance with financial accounting principles
Definition of Business Unit Profits
Business Unit
Profits*1
Netincome
Provision forcatastrophe loss
reserves*2
Provision forprice fluctuation
reserves*2
Gains or losses on sales orvaluation of ALM*3 bondsand interest rate swaps
= + + -
Gains or losses on sales or valuation of fixed assets, business-related equities and
business investment equities
Other extraordinarygains/losses,
valuation allowances, etc.- -
Increase in EV*5
during the currentfiscal year
Capital transactions such as
capital increase= +
Business Unit
Profits*1
50

Copyright (c) 2018 Tokio Marine Holdings, Inc.
Adjusted Net Income*1 Adjusted Net Assets*1 Adjusted ROE
(billions of yen)
Reconciliation of Adjusted Net Income / Adjusted Net Assets
*1: Each adjustment is on an after-tax basis*2: In case of reversal, it is subtracted from the equation*3: ALM: Asset Liability Management. Excluded since it is counter balance of ALM related
liabilities
51
FY2017Results
FY2018Projections
YoYChange
3,805.1 3,896.9 91.8
Catastrophe lossreserves +836.5 +842.2 5.7
Contingency reserves +39.6 +40.6 1.0
Price fluctuation reserves +72.2 +77.3 5.1
Goodwill and otherintangible fixed assets -667.2 -691.9 -24.7
4,086.4 4,165.2 78.8
Net assets(consolidated)
Adjusted Net Assets
FY2017Results
FY2018Projections
YoYChange
284.1 320.0 35.8
3,673.6 3,851.0 177.4
7.7% 8.3% 0.6pt
FY2017Results
FY2018Projections
YoYChange
341.4 396.0 54.6
3,949.4 4,120.0 170.6
8.6% 9.6% 1.0pt
* average balance basis
* average balance basis
Net income(consolidated)
Financial acccountingbasis ROE
Net assets(consolidated)*
Adjusted ROE
Adjusted Net Assets*
Adjusted Net Income
FY2017Results
FY2018Projections
YoYChange
284.1 320.0 35.8
Provision for catastrophe loss reserves*2 +25.6 +4.0 -21.6
Provision for contingency reserves*2 +3.3 +1.0 -2.3
Provision for price fluctuation reserves*2 +4.9 +5.0 0.1
Gains or losses on sales or valuation of ALM*3 bondsand interest rate swaps -5.5 +0.0 5.5
Gains or losses on sales or valuation of fixed assetsand business investment equities +1.5 +0.0 -1.5
Amortization of goodwill and other intangible fixedassets +73.7 +67.0 -6.7
Other extraordinary gains/losses,valuation allowances, etc. -46.4 -1.0 45.4
341.4 396.0 54.6
Net income attributable to owners of the parent(consolidated)
Adjusted Net Income
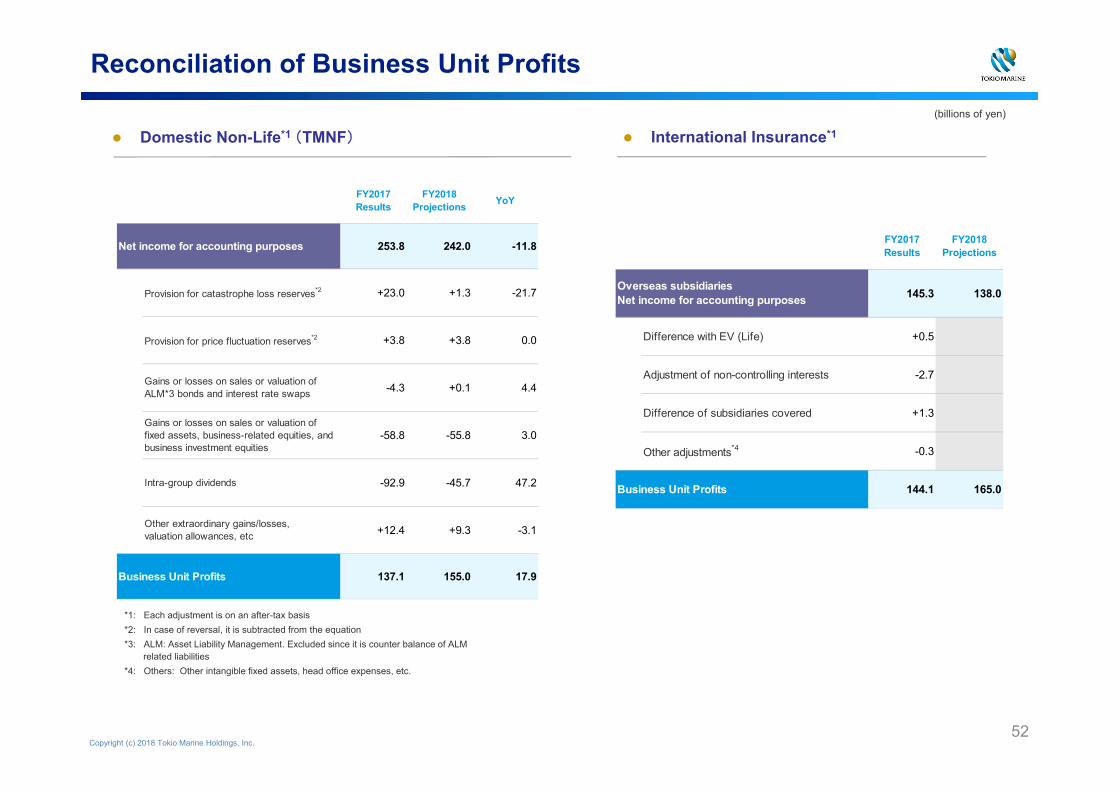
Copyright (c) 2018 Tokio Marine Holdings, Inc.
Domestic Non-Life*1 (TMNF) International Insurance*1
Reconciliation of Business Unit Profits
52
*1: Each adjustment is on an after-tax basis*2: In case of reversal, it is subtracted from the equation*3: ALM: Asset Liability Management. Excluded since it is counter balance of ALM
related liabilities*4: Others: Other intangible fixed assets, head office expenses, etc.
FY2017Results
FY2018Projections YoY
253.8 242.0 -11.8
Provision for catastrophe loss reserves*2 +23.0 +1.3 -21.7
Provision for price fluctuation reserves*2 +3.8 +3.8 0.0
Gains or losses on sales or valuation ofALM*3 bonds and interest rate swaps -4.3 +0.1 4.4
Gains or losses on sales or valuation offixed assets, business-related equities, andbusiness investment equities
-58.8 -55.8 3.0
Intra-group dividends -92.9 -45.7 47.2
Other extraordinary gains/losses,valuation allowances, etc +12.4 +9.3 -3.1
137.1 155.0 17.9Business Unit Profits
Net income for accounting purposes FY2017Results
FY2018Projections
145.3 138.0
+0.5
-2.7
+1.3
-0.3
144.1 165.0
Other adjustments*4
Business Unit Profits
Overseas subsidiariesNet income for accounting purposes
Difference with EV (Life)
Adjustment of non-controlling interests
Difference of subsidiaries covered
(billions of yen)

Copyright (c) 2018 Tokio Marine Holdings, Inc.53
Modified ESR Model
Mar. 31, 2018
Riskcapital2.4Trillion
yen
Net asset value
3.4Trillion
yen
141%
Riskcapital2.4Trillion
yen
Net asset value
5.0Trillion
yen
206%
Factors of change in net asset value
Factors of change in risk capital
etc.
Riskcapital2.5Trillion
yen
Net asset value
5.1Trillion
yen
201% Contribution of 2H FY17
adjusted net income Increase in unrealized
gains of business-related equities
Shareholder return
Sep. 30, 2017 Mar. 31, 2018Sep. 30, 2017
¥20,356 Nikkei Stock Average ¥21,454
•Modify ESR model by including restricted capital as part of net asset value for simplicity and ease of comparability, etc.
•ESR with 99.95%VaR (equivalent to maintain AA credit rating) is 201% as of Mar. 31, 2018
Sep. 30, 2017
Impact to Net asset value
Include restricted capital
Old Model Modified Model Modified Model
Sales of business-related equities
Increase in risks of equities due to rise in stock price
Increase in credit risk Decrease in tax effects
owing to U.S. tax reform
(Ref.) Definition of Net Asset Value (Modified Model)
Net
Asset
Value
Consolidated net asset on
financial accounting basis
Liability of capital nature (catastrophe loss reserves, price fluctuation reserves,
etc.) (after-tax basis)
= + - Goodwill, etc.Planned
distribution to shareholders
Value of life insurance policies
in-force
+-Others+
etc.

Copyright (c) 2018 Tokio Marine Holdings, Inc.54
Risk capital as of Mar. 31, 2018
Effect of diversification
47%
99.95%VaR, after tax basis “Others” includes Financial and General businesses, and FX risk
derived from net capital investment, etc.
5.0 Trillion yen
Domestic non-life
(underwriting)21%
Domestic non-life
(underwriting)24%
Domestic non-life
(investment)33%
Domestic non-life
(investment) 31%
Domestic life
21%Domestic
life15%
International insurance
14%International
insurance20%
Others10% Others
11%Effect of diversification
44%
Riskcapital56%
2.8Trillion
yen
Riskcapital53%
2.5Trillion
yen
4.8 Trillion yen
Before diversification After diversification
Mar. 31, 2015 Mar. 31, 2018Previous Mid-term business plan period
■ International InsuranceFurther diversification associatedwith business expansion
■ Domestic Life Control of interest rate riskShift to protection-type products
■ Domestic Non-Life(Investment)Reduction of business-related equities risk
■ Domestic Non-Life(Underwriting)Control of natural catastrophes risk
Measures for Risk Diversification
Before diversification After diversification
Risk diversification enhanced mainly through the ongoing expansion of business diversification and progress in business-related equities sales over the period of previous mid-term business plan

Copyright (c) 2018 Tokio Marine Holdings, Inc.
Basic Information (Domestic Non-Life 1) - TMNF
(FY2017 managerial accounting basis)
(FY2016 net premiums written basis)
(FY2017 net premiums written basis)
*1: Net E/I C/R=E/I loss ratio + W/P expense ratio
C/R(Private Insurance W/P Basis) Net Premiums Written(All lines, billions of yen)
(excluding reinsurance companies)
Others14.3%
Financial institutions3.3%
Auto repairshop8.9%
Autodealership
20.3%
Corporate25.7%
Full-timeagents27.4%
Marine2.8%
NF1.7%
21.6%
Specialty *2+ P.A.
*2 : Categorized as “Others” in Summary of Financial Statements
Auto49.6%
CALI13.2%
Fire12.8%
Direct insurer*3
4.3%TMNF26.1%
*3: Sony, American home, AXA, Mitsui Direct, Saison, E. design, SBI, Sonpo 24Source Insurance Statistics (Sonpo Toukeigo) 55
FY2011 FY2012 FY2013 FY2014 FY2015 FY2016 FY2017 FY2018Projections
Net E/I C/R*1 103.8% 99.6% 97.2% 90.6% 92.7% 90.4% 93.9% 91.3%
E/I loss ratio 69.8% 66.8% 65.0% 58.5% 60.1% 57.7% 61.4% 58.7%
(Excludingnaturalcatastrophes
61.3% 62.8% 60.1% 56.9% 56.0% 54.8% 57.0% 56.0%
Expense ratio 34.0% 32.8% 32.2% 32.2% 32.6% 32.7% 32.5% 32.7%
93.1%
99.4%97.9% 97.2%
103.3%
97.4%
91.2%89.8% 89.2% 89.6%
92.0% 90.8%
(Projections)
1,912.11,813.4
1,736.0 1,742.7 1,783.01,869.6
1,966.32,036.7
2,128.3 2,116.1 2,144.7 2,146.0
2007 2008 2009 2010 2011 2012 2013 2014 2015 2016 2017 2018
Statistics of combined ratio and loss ratio (private insurance E/I Basis)
Trend of net premiums written and combined ratio Premium composition by line
Premium composition by sales channel
Market share

Copyright (c) 2018 Tokio Marine Holdings, Inc.
98.5%
103.6% 102.9% 103.8%102.6%
98.5%
94.0%91.5%
90.1% 89.4% 90.3%
93.3%
2007 2008 2009 2010 2011 2012 2013 2014 2015 2016 2017 2018
Basic Information (Domestic Non-Life 2) - TMNF
Efforts to decrease business expenses such as operational streamlining
Product and rate revisions Introduction of age-bracket rate plans Revisions of the Grade Rating System Other measures to improve underwriting
result
<Measures to improve profitability> Increase in senior drivers with high accident
frequency Decrease in per-policy premiums owing to the
progress of the average discount rate under the Grade Rating System
Increasing trend in unit repair cost
<Factors of profitability deterioration>
*: Net E/I C/R =E/I loss ratio + W/P expense ratio
Projections
56
FY2011 FY2012 FY2013 FY2014 FY2015 FY2016 FY2017 FY2018Projections
Policyrenewal ratio 95.1% 95.3% 95.6% 95.6% 95.7% 95.9% 95.8% -
Net E/I C/R* 102.9% 100.2% 95.7% 91.6% 91.4% 91.0% 91.8% 94.0%
E/I L/R 70.7% 69.4% 65.3% 61.1% 60.5% 60.2% 60.8% 62.8%
Trend of auto insurance policy renewal ratio, E/I basis combined ratio and loss ratio
Trend of underwriting results in auto insurance (W/P basis combined ratio)

Copyright (c) 2018 Tokio Marine Holdings, Inc. 57
23 41 5787 106
134160
187219
256283
317349
378405
438470
Through development of product strategies focusing on “life insurance to protect one‘s living” in response to customer needs, TMNL achieved 5.70 million in-force policies in FY2017, significantly exceeding the market growth
Basic Information (Domestic Life 1) - TMNL
(unit: ten thousands of policy)
500
【Composition of number of in-force policies】
(Individual insurance basis, total of Japanese life insurance market)
(unit: millions of policy)
Others Medical & Cancer
FY2016
FY2000
35.3%
20.2%
0 50 100 150
Average of Japanese life insurance market +2.9%
TMNL +12.2%
【CAGR of in-force policies from FY2000 to FY2016】(Total of individual insurance and individual annuities)
530
1996 1997 1998 1999 2000 2001 2002 2003 2004 2005 2006 2007 2008 2009 2010 2011 2012 2013 2014 2015 2016
8
200
・The source of figures regarding Japanese life insurance market is “The Life Insurance Association of Japan”
・The figures of TMNL are after merger basis between TMNL and former FL
2017
555570
Number of in-force policies at TMNL (total of individual insurance and individual annuities)
Market stats: Growing "Medical & Cancer" market Growth rate of number of in-force policies at TMNL
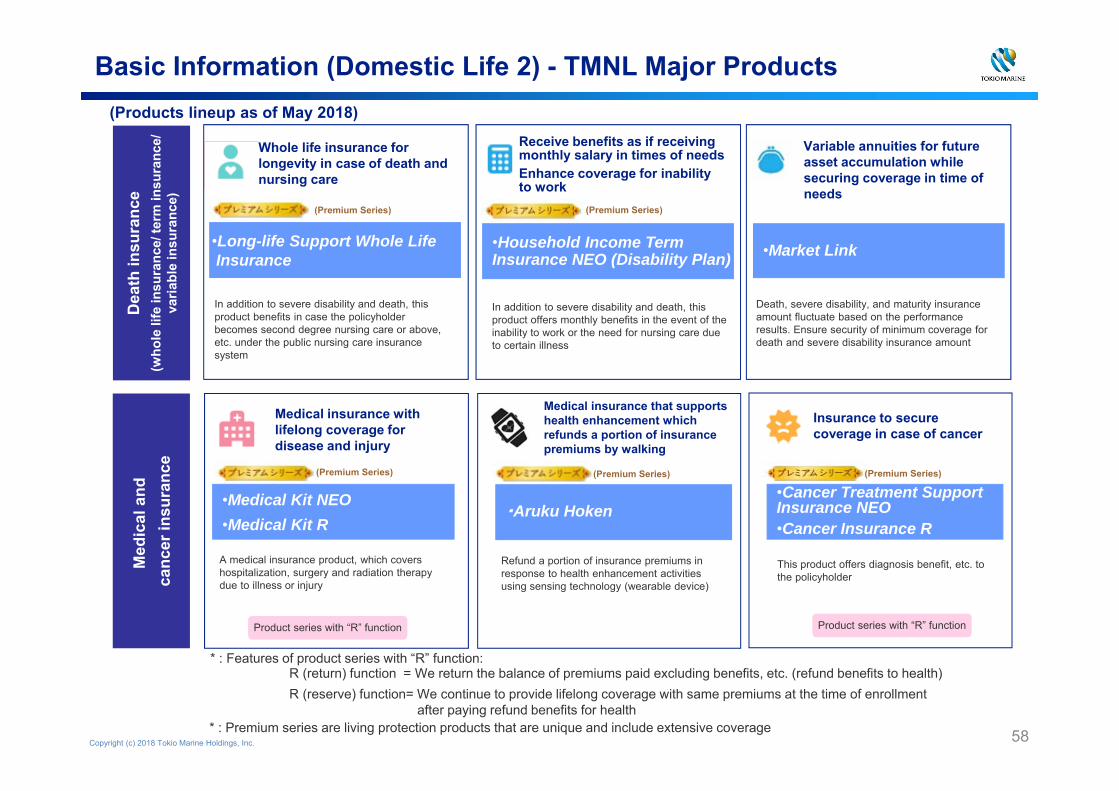
Copyright (c) 2018 Tokio Marine Holdings, Inc. 58
Variable annuities for future asset accumulation while securing coverage in time of needs
Med
ical
and
ca
ncer
insu
ranc
e
In addition to severe disability and death, this product offers monthly benefits in the event of the inability to work or the need for nursing care due to certain illness
In addition to severe disability and death, this product benefits in case the policyholder becomes second degree nursing care or above, etc. under the public nursing care insurance system
This product offers diagnosis benefit, etc. tothe policyholder
A medical insurance product, which covers hospitalization, surgery and radiation therapy due to illness or injury
Death, severe disability, and maturity insurance amount fluctuate based on the performance results. Ensure security of minimum coverage for death and severe disability insurance amount
* : Premium series are living protection products that are unique and include extensive coverage
R (return) function = We return the balance of premiums paid excluding benefits, etc. (refund benefits to health)R (reserve) function= We continue to provide lifelong coverage with same premiums at the time of enrollment
after paying refund benefits for health
* : Features of product series with “R” function:
Basic Information (Domestic Life 2) - TMNL Major Products
•Market Link
Dea
th in
sura
nce
(who
le li
fe in
sura
nce/
term
insu
ranc
e/
varia
ble
insu
ranc
e)
•Medical Kit NEO•Medical Kit R
•Cancer Treatment Support Insurance NEO•Cancer Insurance R
•Long-life Support Whole LifeInsurance
•Household Income Term Insurance NEO (Disability Plan)
Medical insurance with lifelong coverage for disease and injury
Insurance to secure coverage in case of cancer
Receive benefits as if receiving monthly salary in times of needsEnhance coverage for inability to work
Whole life insurance for longevity in case of death and nursing care
(Products lineup as of May 2018)
Product series with “R” function
(Premium Series)
(Premium Series)
(Premium Series)
(Premium Series)
Product series with “R” function
Refund a portion of insurance premiums in response to health enhancement activities using sensing technology (wearable device)
・Aruku Hoken
Medical insurance that supports health enhancement which refunds a portion of insurance premiums by walking
(Premium Series)

Copyright (c) 2018 Tokio Marine Holdings, Inc. 59
Pursue growth opportunities globallyas the profit growth driver of the Group
2000 2007 2011 2015
Pursue balanced growth in bothdeveloped and emerging markets through
“organic growth” and “strategic M&A”
Pursue to establish adiversified business portfolio
Developed Footholds in Non-Japanese Business
Established Material Presence in Lloyd's (UK) and the US
Further Expansion in High Growth
Markets
(~2000)business
development focused on Japanese
clients
P&CEmergingMarkets
Life EmergingMarkets
IndianLife Business
Further Growth, Diversification and Capital Efficiency
Basic Information (International Insurance 1) : Strategic Expansion

Copyright (c) 2018 Tokio Marine Holdings, Inc.60
104.2 118.1 119.1 114.1 91.0 92.1 81.4 77.7 86.5 105.3 120.5 120.6 116.4 113.0 106.2USD/JPYFX*1
240.2319.5
413.9 362.6
544.0 526.5 499.7
734.3
1,074.5
1,302.6 1,304.0
1,654.41,741.0
118.7
Basic Information (International Insurance 2) : Net Premiums Written
0
200.0
400.0
600.0
800.0
1,000.0
1,200.0
1,400.0
1,600.0
1,800.0
2004 2005 2006 2007 2008 2009 2010 2011 2012 2013 2014 2015 2016 2017 2018(Projections)
1,713.0Life
Reinsurance
North America
Europe*2
South & Central America
Asia &Middle East *2
(billions of yen)
*1: FX rates are as of Dec. 31 of each year(FX rate for FY2018 Projections is as of Mar. 31, 2018)
*2: Up to FY2015, Middle East is included in Europe.From FY2016, Middle East is included in Asia
Net premiums written in international insurance business

Copyright (c) 2018 Tokio Marine Holdings, Inc. 61
Basic Information (International Insurance 3) FY2018 Projections by regions
As of end- Dec. 2017
As of end- Mar. 2018
¥113.0 ¥106.2 -6%
¥151.9 ¥148.8 -2%
¥34.1 ¥32.1 -6%
¥27.8 ¥27.5 -1%
(GBP / JPY)
(Malaysian Ringgit / JPY)
(USD / JPY)
(Brazilian Real / JPY)
Applied FX rateFY2017
YoYChange
FY2018 Projections
North America*1 95% 95%
Philadelphia 94% 96%
Delphi 103% 100%
TMHCC 89% 89%
Europe*2 117% 95%
South & CentralAmerica 99% 100%
Asia &Middle East 94% 99%
98% 96%
Reinsurnace*4 121% 99%
100% 96%
- -
100% 96%Total
FY2018ProjectionsC/R
Total PrimaryNon-Life*3
Total Non-Life*3
FY2017
Life
*1: North American figures include European and Reinsurance businesses of TMHCC, but not include North American business of TMK*2: European figures include North American business of TMK, but not include European and Reinsurance businesses of TMHCC*3: Total Primary Non-Life and Total Non-Life figures include some life insurance figures of composite overseas subsidiaries*4: Reinsurance figures are those of TMR and other Reinsurance companies*5: In Net Premiums Written, FX when converting to yen is adjusted to FX of Mar. 31, 2018 and in Business Units Profits, FX when converting to yen is adjusted to FX of Mar. 31, 2018, Excluding the impact of FX gains / losses on major overseas subsidiaries, Nat-cat losses are normalized to an average annual level, Excluding one time impact of U.S. tax reform*6: After adjustment of head office expenses
Change % Change %
North America*1 1047.0 1027.0 -20.0 -2% 42.0 4%
Philadelphia 359.7 347.0 -12.7 -4% 9.0 3%
Delphi 252.6 244.0 -8.6 -3% 6.0 3%
TMHCC 354.7 363.0 8.2 2% 29.0 9%
Europe*2 161.9 158.0 -3.9 -2% - -0%
South & CentralAmerica 148.0 145.0 -3.0 -2% 6.0 4%
Asia &Middle East 145.9 145.0 -0.9 -1% 6.0 4%
1503.0 1475.0 -28.0 -2% 54.0 4%
Reinsurnace*4 146.2 145.0 -1.2 -1% 7.0 5%
1649.2 1620.0 -29.2 -2% 61.0 4%
91.7 93.0 1.2 1% 4.0 5%
1741.0 1713.0 -28.0 -2% 65.0 4%
Total Non-Life*3
Excluding effects*5
YoY
Total PrimaryNon-Life*3
Total
Life
Net Premiums Written(billions of yen) FY2017 YoYFY2018
Projections
Change % Change %
North America*1 159.8 137.0 -22.8 -14% 5.0 4%
Philadelphia 39.2 42.0 2.7 7% 2.0 5%
Delphi 73.0 49.0 -24.0 -33% 6.0 14%
TMHCC 45.1 43.0 -2.1 -5% 1.0 2%
Europe*2 -17.9 10.0 27.9 - 10.0 -
South & CentralAmerica 5.0 5.0 -0.0 -1% - 0%
Asia &Middle East 14.3 9.0 -5.3 -37% -3.0 -25%
161.0 161.0 -0.0 -0% 12.0 8%
Reinsurnace*4 -16.1 9.0 25.1 - 12.0 -
144.8 170.0 25.1 17% 24.0 16%
6.3 2.0 -4.3 -68% -4.0 -67%
144.1 165.0 20.8 14% 20.0 14%
Total Non-Life*3
Total PrimaryNon-Life*3
YoYExcluding effects*5
Total*6
Life
Business Units Profits(billions of yen)
YoYFY2018ProjectionsFY2017

Copyright (c) 2018 Tokio Marine Holdings, Inc.62
Group Management Framework
Efficient deployment of capitalSustainable profit growth
Invest for growth Invest in new business with diversification
effects Prior investment to establish future profit
base(new products/new technology)
Risk reduction/control Continuing sales of business - related
equities, control of the risk of nat-cat losses and interest rates
Shareholder return Raise level of shareholder dividend Adjustment to the appropriate level of capital
via flexible share repurchase, etc.
Generate profits
Enterprise Risk
Management(ERM)
Profit growth Enhancement of shareholder return
Maintain financial soundness
Based on ERM (Enterprise Risk Management), realize profit growth while maintaining financial soundness and strategically allocating capital
Domestic non-life insurance business Sustainable growth as the Group core
business Change our portfolio by sales expansion of
specialty insurance.Domestic life insurance business Expand corporate value based on the
economic value as a growth driver contributing to the long-term profit for the Group.
Increase in protection - type productsInternational insurance business Realize high organic growth and
implement new business investment as a growth driver of the Group.
The Group total Generate further synergy effect Appropriate control of business expenses
Strategic capital allocation

Copyright (c) 2018 Tokio Marine Holdings, Inc. 63
Globalize and Strengthen Group Management Structure
Domestic Non-life
DomesticLife
International Insurance
Financial and
General
Globalize and Strengthen
• Create synergies across the group and roll out best practice
• Converge knowledge of the Group to solve issues across the Group
• Involvement in the Group management by overseas talent
Maximize the Group’s comprehensive capabilities
Group CEO / CCOChief Culture Office
Committees
•Focus on group management•Initiatives to spread Group culture
ERM Committee
International Executive Committee (IEC)
Global Investment Strategy Committee (GISC)
Global Retention Strategy Committee (GRSC)
Global Information Technology Committee (GITC)
In April 2016, globalized and strengthened Group management system by establishing Group Chief Officer positions and committees as well as strengthening those functions
Involvement of top management at overseas subsidiaries in solving Group management issues with their expertise
More focus by the Group CEO on Group management and promote initiatives for spreading Group culture
Strategy and Synergy
Financial PlanningCorporate Planning
Global Retention StrategyHuman
Resources
IT Planning
Top management both in Japan and overseasdiscuss various Group management issues
Group chief officers(by order of organization) Dept. in charge
Risk Management
IT Planning
CSSOStrategy and Synergy
CDODigital
CIOInvestment
CFOFinancial
CRSORetention Strategy
CHROHuman Resources
CITOInformation Technology
CISOInformation Security
CRORisk
Strategy and Synergy

Copyright (c) 2018 Tokio Marine Holdings, Inc.
Initiatives to Support Corporate Value Enhancement
Initiatives and external acknowledgments etc.
Mangrove tree planting
Disaster Prevention LessonTeaching how to prepare for natural disasters in elementary schools, etc.
CO2 emissions and fixation/reduction effects
Business continuity plan (BCP)workshops for SMEs
Earthquake-risk awareness brochure (Think again about possible earthquake and its countermeasures)BCP planning sheet (Easy, Understandable BCP Planning Sheet)
80 or more workshops held and800 or more companies have participated
Distributed 73,000 or more brochures to companies, local governments andchambers of commerce
CO2 emissions CO2 fixation/reduction effectsInitiatives to achieve “carbon neutral” throughmangrove tree planting
2015.3E 2018.3E2000.3E
(thousand tons)
Supporting the youth and the challenged1989- Japan Swimming Federation
(official sponsor)
2005- Special Olympics Nippon Foundation(friendship sponsor)
2016- Japanese Para-Sports Association(official sponsor)
Japan Inclusive Football Federation(partner)
2017- Career Development Program for Junior High and High School Students “Group Work on Managing Risks and Opportunities” expanded throughout Japan
“Carbon neutral” for four consecutive years
Approx. 30,000 people have attended
Diversity on aglobal scale
Culture that facilitates the active participation and growth of female employees and other diverse human resources
Implementing a PDCA cycle to enhance the health of employeesHealth & productivity
management is the base for creating a“Good Company” Support our customers’ health &
productivity management by leveraging the know-how accumulated in the Group
8,99410,400
(total of planted area in hectares)
JapanResilience Award
EnvironmentalCommunication Award
Health and ProductivityAward
2013 2014 2015
87 100 98 113 122 133
2016
119163
64
(FY2017 results)
(Total of FY2016 / FY2017)
(As of the end of FY2017)
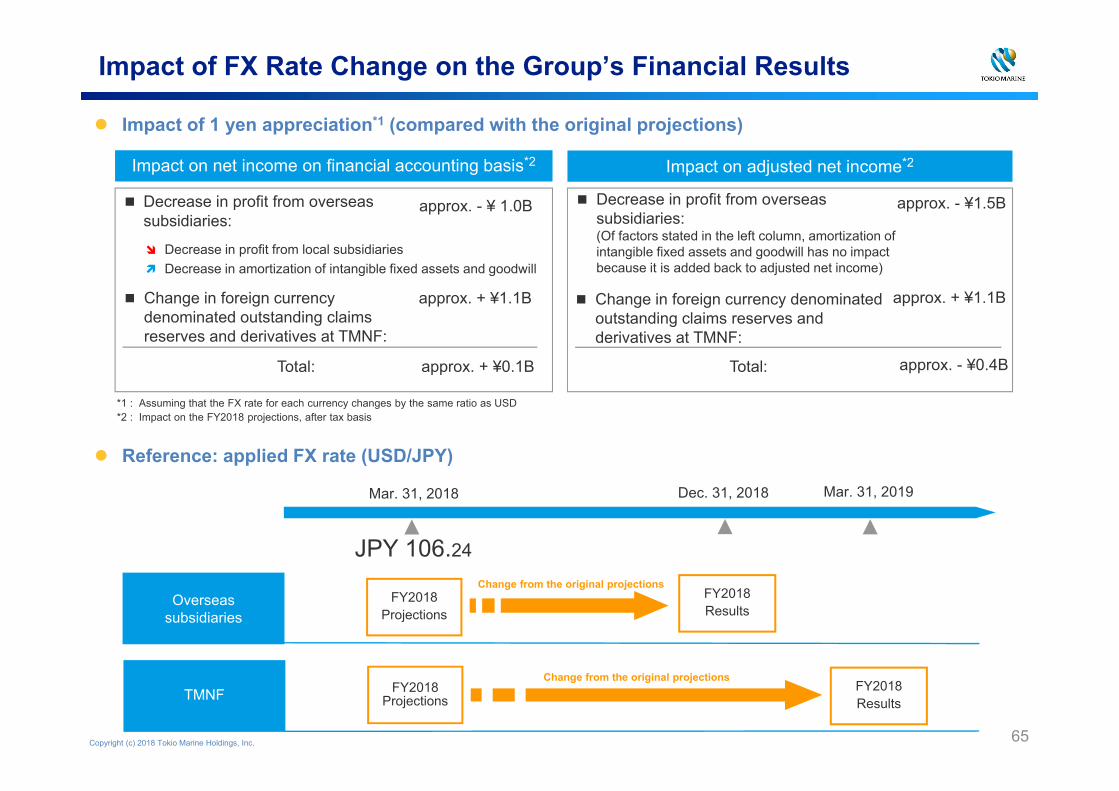
Copyright (c) 2018 Tokio Marine Holdings, Inc. 65
Mar. 31, 2018
Impact of FX Rate Change on the Group’s Financial Results
Impact of 1 yen appreciation*1 (compared with the original projections)
Reference: applied FX rate (USD/JPY)
Overseas subsidiaries
TMNF
JPY 106.24
FY2018Projections
FY2018Projections
Dec. 31, 2018 Mar. 31, 2019
FY2018Results
FY2018Results
Change in foreign currency denominated outstanding claims reserves and derivatives at TMNF:
Decrease in profit from overseas subsidiaries:
Impact on net income on financial accounting basis*2 Impact on adjusted net income*2
*1 : Assuming that the FX rate for each currency changes by the same ratio as USD*2 : Impact on the FY2018 projections, after tax basis
approx. - ¥ 1.0B
Change from the original projections
Change from the original projections
approx. + ¥1.1B
approx. + ¥0.1BTotal:
Change in foreign currency denominated outstanding claims reserves and derivatives at TMNF:
Decrease in profit from overseas subsidiaries:(Of factors stated in the left column, amortization of intangible fixed assets and goodwill has no impact because it is added back to adjusted net income)
approx. - ¥1.5B
approx. + ¥1.1B
approx. - ¥0.4BTotal:
Decrease in profit from local subsidiaries Decrease in amortization of intangible fixed assets and goodwill

Copyright (c) 2018 Tokio Marine Holdings, Inc. 66
Domestic Life (TMNL)
Business-related equities
Others
Continue to reduce holdings
17%
With regard to assets backing insurance liabilities, we aim to enhance capital / cash efficiency, and increase long-term and stable investment income under the ALM management
With regard to assets in deposit-type insurance account, we aim a stable increase in the value of surplus by appropriately controlling the interest rate risk based on strict ALM investments
Excluding assets in separate accounts, most assets are assets for backing long-term insurance liabilities. We aim a stable increase in the value of surplus by controlling the interest rate risk based on ALM investments
27%
12%
Under the ALM management, enhance capital and cash efficiency and increase long-term and stable investment income
Domestic Non-Life (TMNF)
Appropriately control interest rate risks of life insurance liability
Assets backing insurance liabilities
7%
3%
90%
OthersShort-term investments, etc.
66
22%
Assets backing insurance liabilities
22%
Assets in separate accounts
Appropriately control yen-denominated interest rate risks of long-term insurance liabilities with yen-denominated fixed income assets under strict ALM investments
Assets in deposit-type insurance accounts
Asset Portfolio
Investments in subsidiaries and affiliates, etc.
Real estate for own use,non-investment assets, etc.
TMNF Total Assets ¥9.6T (as of end of Mar. 2018) TMNL Total Assets ¥7.2T (as of end of Mar. 2018)
DisclaimerThese presentation materials include business projections and forecasts relating to
expected financial and operating results of Tokio Marine Holdings and certain of its affiliates in current and future periods. All such forward looking information is based on information and assumptions available to Tokio Marine Holdings when the materials were prepared and is subject to a range of inherent risks and uncertainties. Actual results may vary materially from those estimated, anticipated, expected or projected in the accompanying materials and no assurances can be given that any such forward looking information will prove to have been accurate. Investors are cautioned not to place undue reliance on forward looking statements in these materials. Tokio Marine Holdings undertakes no obligation to update or revise any of this forward looking information, whether as a result of new information, recent or future developments, or otherwise.
These presentation materials do not constitute an offering of securities in anyjurisdiction. To the extent distribution of these presentation materials or theinformation included herein is restricted by law, persons receiving these materials must inform themselves of and observe any such restrictions.
For further information...
Investor Relations Group, Corporate Planning Dept.
Tokio Marine Holdings, Inc.
E-mail: URL : www.tokiomarinehd.comTel : +81-3-3285-0350
201808072130