TOF -MS: a Recent Challenge in GC Residue Analysis and a ... · p,p-DDD 2.4 bromopropylate 4.5...
46
INSTITUTE OF CHEMICAL TECHNOLOGY, Department of Food Chemistry and Analysis Prague, Czech Republic Jana HAJŠLOVÁ Jana HAJŠLOVÁ jana jana . . hajslova hajslova @ @ vscht vscht . . cz cz TOF TOF - - MS: a MS: a Recent Recent Challenge Challenge in GC in GC Residue Residue Analysis Analysis and and a a Strategy Strategy for for Obtaining Obtaining Accurate Accurate Data Data 1 1 st st CRL/NRL Pesticide CRL/NRL Pesticide Residue Residue Training Training Workshop Workshop , , Stuttgart, Stuttgart, Germany Germany , 2006 , 2006
Transcript of TOF -MS: a Recent Challenge in GC Residue Analysis and a ... · p,p-DDD 2.4 bromopropylate 4.5...

INSTITUTE OF CHEMICAL TECHNOLOGY, Department of Food Chemistry and Analysis Prague, Czech Republic
Jana HAJŠLOVÁJana HAJŠLOVÁjanajana ..hajslovahajslova @@vschtvscht ..czcz
TOFTOF--MS: a MS: a RecentRecent ChallengeChallenge in GC in GC ResidueResidue AnalysisAnalysis andand a a StrategyStrategy forfor
ObtainingObtaining AccurateAccurate DataData
11stst CRL/NRL Pesticide CRL/NRL Pesticide ResidueResidue TrainingTraining WorkshopWorkshop , , Stuttgart, Stuttgart, GermanyGermany , 2006, 2006

�� SAMPLE PREPSAMPLE PREP:: partition followed by dispersive SPE - QuEChERSQuEChERS
�� SAMPLE INTRODUCTIONSAMPLE INTRODUCTION: : dirtydirty matrixmatrix introductionintroduction injectorinjector -- DMIDMI
�� SEPARATIONSEPARATION: : -- llowow pressurepressure chromatographychromatography -- LPLP--GCGC
-- orthogonalorthogonal chromatographychromatography -- GCGC××GCGC
DETECTIONDETECTION: : timetime --ofof --thethe --flightflight massmass analyzeranalyzer -- TOFTOF--MS MS
�� QUALITY ASSURANCEQUALITY ASSURANCE:: ANALYTICAL PROTECTANTSANALYTICAL PROTECTANTS
SuggestionsSuggestions for for implementationimplementation ofofNOVEL APPROACHES IN GCNOVEL APPROACHES IN GC --BASED BASED MRMsMRMs

StrategiesStrategies to to examineexamine foodfood
samplessamples forfor occurrenceoccurrence ofof
pesticide pesticide residuesresidues
TARGET ANALYSISTARGET ANALYSIS
�������� thethe list list ofof analytesanalytes specifiedspecified
NONNON--TARGET SEARCHTARGET SEARCH
�������� „„ unknownsunknowns “ to “ to bebe determineddetermined

GCGC--MS MS systemssystems conceivableconceivableforfor ((multimulti ))residueresidue analysisanalysis
Mass analyserMass analyser Mass ResolutionMass Resolution Acquisition rateAcquisition rate Detection limitsDetection limits
QUADRUPOLEQUADRUPOLE 0.5 amu peak width(R = 2m,10% valley)
15–33 scans/sfor mass range 300 amu
pg - fg
(SIM mode -limited by chemical noise, further improvementin MS/MS)
ION TRAPION TRAP 1 amu peak width(R = m,10% valley)
SECTORSECTOR Up to 80,000(10% valley)
0.15 s/decade0.15 s/decade fg (SIM mode)
hshshshshshshshs--------TOFTOFTOFTOFTOFTOFTOFTOF 1,400 FWHM1,400 FWHM 11––500 spectra/s500 spectra/s pgpg
hrhrhrhrhrhrhrhr--------TOFTOFTOFTOFTOFTOFTOFTOF 7,000 FWHM7,000 FWHM 11––220 spectra/s0 spectra/s pgpg
K. Maštovská, S.J.Lehotay: Practical approaches to fast gas chromatography–mass spectrometry.J. Chromatogr. A 1000 (2003) 153–180
19 scans/sfor mass range 300 amu
Ionsseparated in
electrical electrical
or magnetic magnetic
field
Ionsseparated in
fieldfield--free free
tubetube

(A) (B)(C1)
(C2)(D1)
(D2)
BLANK
SMĚSNÝSTANDARD
GC-ECD
NonNon--targettarget searchsearch::
�������� FullFull spectralspectral informationinformation neededneeded forfor identificationidentification
ofof unknownunknown signalssignals
ComplexComplexmatrixmatrix
�������� AchieveAchieve goodgood spectralspectral resolutionresolution !!!!!!!!
�������� ImproveImprove chromatographicchromatographic resolutionresolution !!!!!!!!

→→→→→→→→ extractionextraction ofof spectralspectral informationinformation →→→→→→→→……....
→→→→→→→→ librarylibrary searchsearch
deconvolutiondeconvolution softwaresoftware
SpectralSpectral resolutionresolution ofof coco--elutingeluting compoundscompounds
12 s
How many compoundscompose this record
TICTICTICTICTICTICTICTIC

…. extraction of signals from complex mixture
At least fourcomponentspresent
WhatWhat isis deconvolutiondeconvolution...?...?
Source:: Agilent Technologies

Component 1
Component 2
Component 3
TIC
AMDISAMDISAMDISAMDISAMDISAMDISAMDISAMDIS: : Automatic Mass spectral DeconvolutionIdentification System
TIC & SPEKTRUM DECONVOLUTED PEAKS & THEIR SPECTRA
matrixmatrix
ANALYTEANALYTE
interferenceinterference

Cause:Cause: changing concentration of analyte in MS sourceduring peak elution
SCAN: SCAN: highhigh �������� lowlow m/zm/z
ScanningScanning MS MS detectordetector -- spectralspectral skskewew

Before removing skew(MSD)
Skew removed & apexes interpolated
(AMDIS)
19.18 19.20 19.22 19.24 19.26 19.28 19.30 19.32 19.34 19.36 19.38
Ion 97.00 : 25_ISTD.DIon 314.00: 25_ISTD.D
Shift of ions apexes during scan of single
compound
Identical
AMDIS: deAMDIS: de--skewskew functionfunction

�������� LIMITATION LIMITATION whenwhen usingusing conventionalconventional MSDMSD
HighHigh LODsLODs in TICin TIC
LVILVI--PTVPTV
More coMore co--extractsextracts
introducedintroduced intointo
GC GC systemsystem
MATRIX EFFECTS ?

Comparison of Comparison of massmass analyzersanalyzers ssensitivityensitivity --
acquisitionacquisition ofof fullfull spectralspectral informationinformation
TOF
Ion Trap
Mass Range
Sensitivity
0 500
Quadrupole

UNIQUE FEATURES UNIQUE FEATURES UNIQUE FEATURES UNIQUE FEATURES UNIQUE FEATURES UNIQUE FEATURES UNIQUE FEATURES UNIQUE FEATURES OF BOTH APPROACHESOF BOTH APPROACHESOF BOTH APPROACHESOF BOTH APPROACHESOF BOTH APPROACHESOF BOTH APPROACHESOF BOTH APPROACHESOF BOTH APPROACHES::
Permanent acquisition of full mass spectraPermanent acquisition of full mass spectra
Absence of spectral skew Absence of spectral skew (deconvolution function)
HighHigh mass analyser efficiency mass analyser efficiency upup to to 25% 25% (comparedto 0.05% for the quadrupole) over the mass rangeof a 500 amu
HR TOFHR TOF-- exact mass measurementexact mass measurement-- conventionalconventional and fast GCand fast GC
fastfast TOFTOF-- fastfast , ultra , ultra fastfast GCGC-- GC x GC GC x GC
Pegasus IV , Leco
GCT, Waters
5.00 6.00 7.00 8.00 9.0010.0011.0012.0013.0014.0015.0016.0017.0018.0019.00
500000
1000000
1500000
2000000
2500000
3000000
3500000
4000000
4500000
5000000
5500000
6000000
6500000
7000000
7500000
Time-->
Abundance
TIC: F05.D
5.86
6.10
7.27
7.57
8.03
8.21
8.97
9.03
9.58 9.70
10.20
10.87
11.06
11.42
12.52
12.87 13.94
14.31
14.89
15.23
15.62
18.79
5.00 6.00 7.00 8.00 9.0010.0011.0012.0013.0014.0015.0016.0017.0018.0019.00
120000
140000
160000
180000
200000
220000
240000
260000
280000
300000
320000
340000
360000
Time-->
Abundance
TIC: F06.D
6.18
7.29
8.06
8.23 9.03
9.61
10.23 10.87
11.42
12.53
12.92 13.98
14.33
14.89
15.23
15.62
6.00 7.00 8.00 9.0010.0011.0012.0013.0014.0015.0016.0017.0018.0019.00
100000
110000
120000
130000
140000
150000
160000
170000
180000
190000
200000
210000
220000
Time-->
Abundance
TIC: F07.D
8.07
12.55
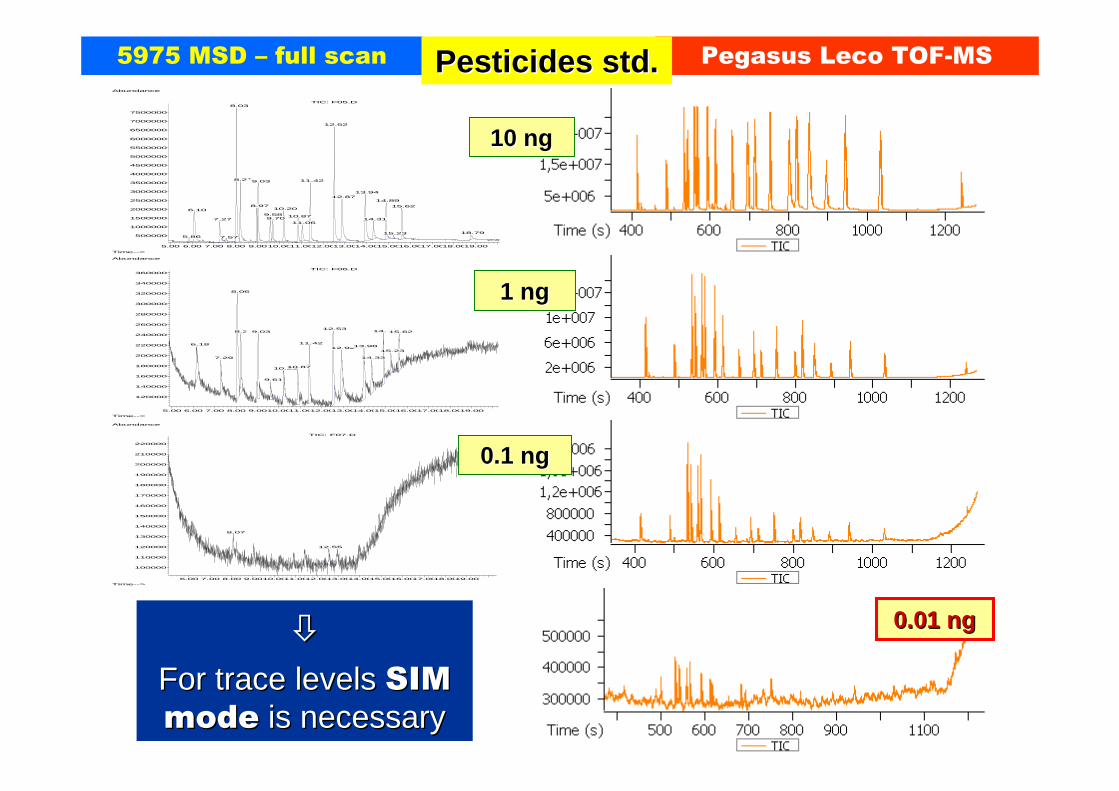
10 10 ngng
1 1 ngng
0.1 0.1 ngng
0.01 0.01 ngng
5975 MSD – full scan Pegasus Leco TOF-MS
��
ForFor tracetrace levelslevels SIMSIM
modemode isis necessarynecessary
PesticidesPesticides stdstd ..

GCGC--TOF MS TOF MS iinstrumentsnstruments availableavailable atat thethe marketmarket
Instrument
(Manufacturer)
Mass Range
(Da)
Mass
Resolution Acquisition
Rate (spectra/s)
Registration
of Ions
Ionisation
Mode
Pegasus (Leco)
<1,000 Unit mass 1–500 ADC EI
Tempus (Thermo)
<1,000 Unit mass 2–60 ADC EI, CI
Kronus (Scientific Analysis
Instruments)
<2,000 Unit mass 1–100 ADC EI
GCT (Waters)
<1,500 7,000 FWHM 1–10 TDC EI, CI, FI
GCT Premier (Waters)
<1,500 7,000 FWHM 1–20 TDC EI, CI, FI
JMS-T100GC (JEOL)
<2,000 5,000 FWHM 1–25 ADC EI, CI, FI

Principle of Principle of oaoa--TOF MSTOF MS
Formation of fragment Formation of fragment ionsions in the ion in the ion source (EI, CI)source (EI, CI)
(1) Ion source
Energy focusingEnergy focusing using using reflectronreflectron
(3)
Reflectron
DDetectionetection of “ion of “ion events”events”
(4)Multi channelplate detectorEjection of a part of Ejection of a part of
focused ion beam focused ion beam into a mass analyserinto a mass analyser
(2)
ANALYZERANALYZER
Pusher

zeEmvEk == 2
21
Cz
mt ;⋅=
ReflectronReflectron functionfunction
Ek1 > Ek2 Ek1
Ek2
( )
REFLECTRON
DispersionDispersion ofof EEkk
compensatedcompensated

ExampleExample ::MatrixMatrix --matched standard of applematched standard of apple
AnalyteAnalyte : PHOSALONE: PHOSALONE , c, concentrationoncentration : 0.013 mg/kg: 0.013 mg/kg
Low-resolution
S/N (PtP) = 5:1Mass window: 1 1 DaDa
m/z 1820
100
%
11.18
10.4810.77
13.15
11.96
11.4912.98
12.5012.03 12.6013.24 13.63
Mass window: 0.02 0.02 DaDa
m/z 182.002
TIC
HighHigh --resolutionresolution
S/N (S/N (PtPPtP) = 61:1) = 61:1
Significant elimination of background Significant elimination of background interferentsinterferents from chromatogramfrom chromatogram
ImprovedImproved detectabilitydetectabilityofof analytesanalytes , , lowlow LODsLODs
1 mg of original matrix injected1 mg of original matrix injected11.00 12.00 13.00
0
100
%
0
100
%
11.18
11.11
10.48 10.95
12.9812.58
11.9611.21 12.08 12.82
13.15
13.7313.58
NarrowNarrow massmass windowwindow settingsetting
..
HRHR--TOFTOF--MSMS

15.00 20.00 25.00 30.00 35.00 40.00 45.00 50.00 55.00 60.00 65.00 70.0015.00 20.00 25.00 30.00 35.00 40.00 45.00 50.00 55.00 60.00 65.00 70.00
Conventional GCConventional GC––MS (SIM)MS (SIM)
Time2.00 2.50 3.00 3.50 4.00 4.50 5.00
%0
100 5.183.19
2.33
1.75 2.31
2.06
2.76
2.61
3.10
4.28
3.983.60
3.57 4.61
5.09
4.68 5.40
LPLP--GCGC--HRHR--TOF MSTOF MS
74 min74 min
Dichlorvos tR = 17.6 min
Azoxystrobin tR = 72.8 min
ExampleExample:: aanalysisnalysis of 100 pesticides in baby foodof 100 pesticides in baby food
((bufferedbuffered QUeCHERSQUeCHERS extractextract))
7 min
7 min
Dichlorvos tR = 1.7 min
Azoxystrobin tR = 5.1 min
FastFast run run -- lowlow pressurepressure GC/MSGC/MS
1. Čajka T., Hajšlová J.: J. Chromatogr. A 1058, 251–261 (2004).

�������� FFull capabilities of library reference spectra search ull capabilities of library reference spectra search -- identificationidentification// confirmationconfirmation even at very low concentrationseven at very low concentrations
Librarysearch
J-MSTD6
100 200 300 400 500 600 700m/z0
100
%
167.037
139.042
71.050
290.074
276.059
213.076305.099
306.109
327.074 475.167 603.085 639.965
m/z 70–700
7.20 7.40 7.60 7.80 8.00 8.20 8.400
100
%
0
100
%
7.38
7.46
7.227.10 7.34 7.59 7.86 8.138.07 8.278.35
Pirimiphos-methyl
0.010 mg/kgm/z 290.074Mass window: 0.02 Da
TIC
AcquisitionAcquisition ofof fullfull massmass spectraspectra

Library spectrum
Deconvoluted
spectrum
potentialpotential forfor nonnon --targettarget creeningcreening
0.00.05 5 mg/kgmg/kg CHLORPYRIFOS in CHLORPYRIFOS in peachpeach , , acquisitionacquisition raterate 5 5 spectraspectra /sec/sec
ExactExact massmass deconvolutiondeconvolution , , librarylibrary searchsearch

1 spectrum s–1 2 spectra s–1 3 spectra s–1 4 spectra s–1 5 spectra s–1
12.05 12.10 12.15 12.20 12.25 12.30 12.35 12.40 12.45 12.50 12.55
TOF MS EI+ 182.002 0.05Da
12.32
12.05 12.10 12.15 12.20 12.25 12.30 12.35 12.40 12.45 12.50 12.55
TOF MS EI+ 182.002 0.05Da
12.32
MSTD_50_4SPSEC
12.00 12.05 12.10 12.15 12.20 12.25 12.30 12.35 12.40 12.450
100
%
MSTD_50_4SPSEC
12.32
MSTD_50_4SPSEC
12.00 12.05 12.10 12.15 12.20 12.25 12.30 12.35 12.40 12.450
100
%
MSTD_50_4SPSEC
12.32
MSTD_50_5SPSEC
12.00 12.05 12.10 12.15 12.20 12.25 12.30 12.35 12.400
100
%
MSTD_50_5SPSEC
12.32
MSTD_50_5SPSEC
12.00 12.05 12.10 12.15 12.20 12.25 12.30 12.35 12.400
100
%
MSTD_50_5SPSEC
12.32
12.15 12.20 12.25 12.30 12.35 12.40 12.45 12.50 12.55Time
TOF MS EI+ 182.002 0.05Da
2.43e3
12.33
12.15 12.20 12.25 12.30 12.35 12.40 12.45 12.50 12.55Time
TOF MS EI+ 182.002 0.05Da
2.43e3
12.33
12.30 12.35 12.40 12.45 12.50 12.55Time
TOF MS EI+ 182.002 0.05Da
2.43e312.33
12.30 12.35 12.40 12.45 12.50 12.55Time
TOF MS EI+ 182.002 0.05Da
2.43e312.33
12.05 12.10 12.15 12.20 12.25 12.30 12.35 12.40 12.45 12.50 12.55
TOF MS EI+ 182.002 0.05Da
12.32
12.05 12.10 12.15 12.20 12.25 12.30 12.35 12.40 12.45 12.50 12.55
TOF MS EI+ 182.002 0.05Da
12.32
MSTD_50_4SPSEC
12.00 12.05 12.10 12.15 12.20 12.25 12.30 12.35 12.40 12.450
100
%
MSTD_50_4SPSEC
12.32
MSTD_50_4SPSEC
12.00 12.05 12.10 12.15 12.20 12.25 12.30 12.35 12.40 12.450
100
%
MSTD_50_4SPSEC
12.32
MSTD_50_5SPSEC
12.00 12.05 12.10 12.15 12.20 12.25 12.30 12.35 12.400
100
%
MSTD_50_5SPSEC
12.32
MSTD_50_5SPSEC
12.00 12.05 12.10 12.15 12.20 12.25 12.30 12.35 12.400
100
%
MSTD_50_5SPSEC
12.32
12.15 12.20 12.25 12.30 12.35 12.40 12.45 12.50 12.55Time
TOF MS EI+ 182.002 0.05Da
2.43e3
12.33
12.15 12.20 12.25 12.30 12.35 12.40 12.45 12.50 12.55Time
TOF MS EI+ 182.002 0.05Da
2.43e3
12.33
12.30 12.35 12.40 12.45 12.50 12.55Time
TOF MS EI+ 182.002 0.05Da
2.43e312.33
12.30 12.35 12.40 12.45 12.50 12.55Time
TOF MS EI+ 182.002 0.05Da
2.43e312.33
peakpeak widthwidth cca 5 seccca 5 sec
timetime neededneeded to to obtainobtain 1 1 massmass spectrumspectrum((m/zm/z upup to 750): to 750): approxapprox . 33 . 33 µµss
�� acqacq. . speedspeed ⇒⇒
�� pointspoints//peakpeak ⇒⇒
�� LODLODGoodGood repeatabilityrepeatability ofof signalsignal eveneven atatlowestlowest speedspeed i.e. 1 i.e. 1 spectrumspectrum ss––11
((contrarycontrary to to scanningscanning instrumentsinstruments ))
ChangingChanging acquisitionacquisition speedspeed
1 point = sum (1 point = sum ( averageaverage ) ) ofof3333,,000 000 primaryprimary spectraspectra /s/s

LOQs expressed as Lowest Calibration Levels (LCL), RSD 8 RSD 8 RSD 8 RSD 8 –––– 12%12%12%12%
Pesticide Pesticide residuesresidues in in applesapples : : LOQsLOQs ((µg/kg)endosulfan-SO4 1.1 o,p-DDD 2.8 endrin 5.3 methamidophos 9.6penconazole 1.3 p,p-DDT 3.0 chlorpyrifos-methyl 5.4 mevinphos 9.8vinclozolin 1.4 procymidone 3.1 cypermethrin I 5.4 acephate 10chlorothalonil 1.7 cyprodinyl 3.5 cypermethrin II 5.4 fenthion 10tetraconazole 2.0 ethion 3.5 cypermethrin III 5.4 folpet 11triadimefon 2.0 endosulfan-beta 3.6 methidathion 5.5 cypermethrin IV 11kresoxim-methyl 2.0 etrimfos 3.7 phosmet 5.5 ometoate 12pyridaben 2.0 fenitrothion 4.0 triazophos 5.7 phosphamidone I 12beta-cyfluthrin I 2.0 beta-cyfluthrin II 4.0 diazinon 5.8 phosphamidone II 12tetradifon 2.1 endosulfan-alfa 4.1 azinfos-Me 5.8 carbaryl 12tolylfluanid 2.2 chlorpyrifos 4.3 deltamethrin 5.9 captan 13p,p-DDE 2.3 fenarimol 4.3 tebuconazol 6.1 iprodione 13bifenthrin 2.3 dichlofluanid 4.4 azinfos-Et 6.1 chlorfenvinphos II 15HCH-γ (lindane) 2.4 dichlorvos 4.5 phosalone 6.4 hexythiazox 15p,p-DDD 2.4 bromopropylate 4.5 malathion 7.0 imazalil 15HCH-α 2.5 pirimiphos-methyl 4.8 heptenophos 7.2 fenoxycarb 15heptachlor 2.5 difenylamin 4.9 monocrotophos 7.2 propham 24aldrin 2.5 parathion 5.0 trifloxystrobin 7.2 metalaxyl 30o,p-DDT 2.6 triazamate 5.0 cyhalothrin-λ 7.4 chlorfenvinphos I 30HCH-β 2.7 dieldrin 5.0 methacrifos 7.5 chlorpropham 32HCH-δ 2.7 permethrin I 5.0 dimethoate 7.8 difenoconazole-I 32HCB 2.8 permethrin II 5.0 bupirimate 7.8 difenoconazole-II 32quinalphos 2.8 parathion-methyl 5.2 pirimicarb 9.1 fenvalerate I 48o,p-DDE 2.8 tolclofos-methyl 5.2 thiabendazole 9.3 fenvalerate II 48

�� Detection / identification / quantification of Detection / identification / quantification of very narrow peaks difficult very narrow peaks difficult –– not enough data not enough data points per peapoints per pea kk
FastFast TOFTOF
Limitations of hrLimitations of hr --TOF MSTOF MS
PeakPeak 150 150 msms
widewide atat thethe
basebase
““INVISIBLE“INVISIBLE“

ExampleExample::
TOFTOF--MS MS detectiondetection ofof coco--elutedeluted
chorpyrifoschorpyrifos + + parathionparathion peakspeaks
4 Hz4 Hz 10 Hz 15 Hz15 Hz15 Hz15 Hz15 Hz15 Hz15 Hz15 Hz
Peak width: 2 s
30 30 spectraspectra per per peakpeak neededneeded forfordeconvolutiondeconvolution

ExampleExample::Separation of target Separation of target analyteanalyte ((dichlorvosdichlorvos. 0.01 mg/kg). 0.01 mg/kg)
from cofrom co--extractextract
no spectral match no spectral match with with NISTNIST librarylibrary
INTERFERENCE:INTERFERENCE:INTERFERENCE:INTERFERENCE:INTERFERENCE:INTERFERENCE:INTERFERENCE:INTERFERENCE:
•• m/zm/z 109109 (quantification)(quantification)•• m/zm/z 7979 (identification)(identification)
J. Zrostlíková, J. Hajšlová, T. Čajka: J. Chromatogr. A 1019 (2003) 173–186.
????
1D1D1D1D----GCGCGCGC

VAPOUR PRESSURE (V
OLATILITY)
VAPOUR PRESSURE (V
OLATILITY)
SPECIFIC SPECIFIC INTERACTIONSINTERACTIONS
SPECIFIC SPECIFIC INTERACTIONSINTERACTIONS
SPECIFIC SPECIFIC INTERACTIONS INTERACTIONS
SPECIFIC SPECIFIC INTERACTIONS INTERACTIONS
SPECIFIC SPECIFIC INTERACTIONSINTERACTIONS
SPECIFIC SPECIFIC INTERACTIONSINTERACTIONS
SPECIFIC SPECIFIC INTERACTIONS INTERACTIONS
SPECIFIC SPECIFIC INTERACTIONS INTERACTIONS
2nd dimension
2nd dimension
1st dimension1st dimension
2nd dimension
2nd dimension
1st dimension1st dimension
COMPREHENSIVE CHROMATOGRAPHY:
COMPREHENSIVE CHROMATOGRAPHY:
dram
aticdram
aticincrease
increase
ofofchromato
grap
hic
chromato
grap
hicreso
lution
resolution

11stst dimendimensionsionTypicaly narrow bore non polar column
(30 m ×××× 0,25 mm I.D. ×××× 0,25 µm film)
Modulator
22ndnd dimensiondimensionTypically microbore polar column
(1 m ×××× 0,1 mm I.D. ×××× 0,1 µm film)
Injector
Detector
�������� twotwo columnscolumns withwith differingdiffering selectivityselectivityconnectedconnected via via modulatormodulator
OrthogonalOrthogonal GC (GCGC (GC××××××××GC) setGC) set--upup

TwoTwo -- dimensionaldimensional chromatogramchromatogram

H it N a m e R e ve rse C A S
1 P h o s p h o r ic a c id , 2 ,2 -d ic h lo ro v in y l d im e th y l e s te r 9 4 0 6 2 -7 3 -7
2 P h o sp h o ric a c id , 2 ,2 -d ich lo ro v in y l d im e th y l e s te r 7 2 9 6 2 -7 3 -7
3 P h o sp h o ric a c id , 2 ,2 -d ich lo ro v in y l d im e th y l e s te r 7 0 7 6 2 -7 3 -7
4 P h o sp h o ric a c id , 2 ,2 -d ich lo ro v in y l d im e th y l e s te r 7 0 4 6 2 -7 3 -7
5 P h o sp h o ric a c id , 2 ,2 -d ich lo ro v in y l d im e th y l e s te r 7 0 0 6 2 -7 3 -7
HMF
Separated coextract
DichlorvosDichlorvos reliably identified and quantifiedreliably identified and quantified
→→→→→→→→ result of increased result of increased GC GC peak capacitypeak capacity
GC××××GC
ExampleExample::Separation of target Separation of target analyteanalyte ((dichlorvosdichlorvos. 0.01 mg/kg). 0.01 mg/kg)
from cofrom co--extractextract

Hit Name Reve rs e S imilarity CAS1 Metamidophos 841841841841 836836836836 10265-92-6
2 Phos pho ramido thio ic ac id, O,S-dime thyl es te r ( mainlib ) 829 823 0-00-03 Phos pho ramido thio ic ac id, O,S-dime thyl es te r 829 82310265-92-64 1H-Pyrro le , 2,3-dime thyl- 818 656 600-28-2
METHAMIDOPHOS
in GPC purified
peach extract
(10 pg injected)
2D2D2D2D
1D:
spectral match
611 (only)
2D:
very good
spectral
match
DifficultDifficult pesticidespesticides

Hit Name Revers e S imilarity CAS1 Acephate 810 746 30560-19-1
2 Acephate 821 738 30560-19-13 Acephate ( mainlib ) 804 734 0-00-04 Acephate 804 734 30560-19-15 Dis ulfide , e thyl 1-me thyle thyl 697 573 53966-36-2
ACEPHATE
in GPC purified
peach extract
(10 pg injected) 2D2D2D2D

RESULTSRESULTS::
AnalysisAnalysis ofof 91 91 pesticidespesticides by by highhigh speedspeed GCxGCGCxGC/TOF/TOF--MSMS
The latest eluting
deltamethrin at 10.3 min
TOTAL ANALYSIS TIMETOTAL ANALYSIS TIME: : 11 MIN11 MINImazalilp,p’-DDE
Dieldrin
o,p’-DDD
BupirimateKresoxim-Me
LODsLODs << 0.01 mg/kg, RSD 5 0.01 mg/kg, RSD 5 –– 24% 24% atat 0.02 mg/kg 0.02 mg/kg levellevel))

1D1D1D1D 2D2D2D2D pesticide
m/z
noise S/N LODLODLODLOD noise S/N LODLODLODLOD
methamidophos 94 400 43.7 6666 60 28 2222
dichlorvos 109 3000 24 10101010 50 261 0.20.20.20.2
acephate 136 400 25 10101010 40 30 2222
dimethoate 125 1000 62 4444 60 40 1.31.31.31.3
lindane 181 1000 16.4 15151515 30 66 0.80.80.80.8
carbaryl 144 1200 37.2 6.76.76.76.7 50 78 0.60.60.60.6
methiocarb 168 600 35.2 7.17.17.17.1 40 34 1.51.51.51.5
heptachlor 272 210 29.5 9999 20 45 1.51.51.51.5
pirimiphos-Me 290 300 24.8 10101010 40 22.5 2.22.22.22.2
chlorpyrifos 197 200 47 5.35.35.35.3 40 30 1.71.71.71.7
procymidone 96 3000 17 15151515 80 71.25 0.70.70.70.7
thiabendazole 202 300 43.3 2.2.2.2.3333
captan 149 600 6 30303030 40 7.5 7777
endosulfan I 241 200 13.5 18181818 30 10.6 5555
endosulfan II 241 200 10.2 24242424 30 5 10101010
endosulfan-SO4 272 150 19 13131313 30 6 7.57.57.57.5
phosalone 182 400 10.7 23232323 40 8 6.36.36.36.3
propargite 173 250 13 19191919 30 7.3 7777
permethrin I* 183 400 6.7 37373737 30 8.3 30303030
permethrin II* 183 400 10.7 23232323 30 25 10101010
deltamethrin** 181 300 3.5 150150150150 20 5 100100100100
LODsLODs ((ugug/kg)/kg)in 2D in 2D ��llowerower
by by factorfactor2 2 -- 50 50
PROBLEM:
late eluting broadpeaks of pyrethroids
�6 - 7 segments /peak
� higher LODs
* estimated from the analysis of peach matrix-matched standard at 50 mg/ml for both techniques** estimated from the analysis of peach matrix-matched standard at 100 mg/ml for both techniques

GCGCxxGC/GC/HSHS--TOFTOF--MS: MS: A A powerfulpowerful tooltool for for nonnon --targettarget analysisanalysis
Example
� TomatoTomato samplesample fromfrom thethe EU EU ProficiencyProficiency Test Test containingcontaininga a widewide rangerange ofof pesticide pesticide residuesresidues
�The aim - testing the ability to detect pesticidesin complex matrix
No No informationinformation aboutabout targettarget analytesanalytesprovidedprovided in in advanceadvance

RESULTS OF RESULTS OF NONNON--TARGET SCREENINGTARGET SCREENING
Oxydemethon-Me
Imidacloprid
Acrinatrin
These pesticides were not
present in the used library
version nor in standard
Contour plot of
tomato sample
Pesticide Similarity Pesticide Similarity
Dimethoate 895 Endosulphan I 883
Diazinon 929 Imazalil 568
Chlorothalonil 855 Endosulphan II 882
Metalaxyl 837 Bromopropylate 854
Procymidone 808 Azoxystrobin 758
Thiabendazole 834
IDENTIFIED PESTICIDES IDENTIFIED PESTICIDES
(NIST (NIST librarylibrary) ) –– deconvoluteddeconvoluted::

�� Unit Unit resolutionresolution
�� HighHigh sensitivitysensitivity
�� VeryVery fastfast data data acquisitionacquisition
�� HighHigh massmass accuracyaccuracy
�� VeryVery highhigh sensitivitysensitivity
�� FastFast data data acquisitionacquisition
�������� FullFull spectralspectral informationinformation availableavailable eveneven atat lowlow levelslevels
WHAT ARE THE CHALLENGES WHAT ARE THE CHALLENGES
OFFERED BY TOF MS? OFFERED BY TOF MS?
hsTOFhsTOF
hrTOFhrTOF
e
-- UNKNOWNS IDENTIFICATION / ONUNKNOWNS IDENTIFICATION / ON --LINE CONFIRMATIONLINE CONFIRMATION
-- RELIABLE, UNBIASED QUANTIFICATIONRELIABLE, UNBIASED QUANTIFICATION
Hajšlová J., Čajka T.: In: Food Toxicant Analysis, Y. Picó (editor) , Elsevier, Oxford, UK ( in press ), ISBN: 0-444-52843-1

Main requirements and expectations Main requirements and expectations in analysis of pesticide residuesin analysis of pesticide residues
ADDITIONAL ADDITIONAL FEATURESFEATURESREQUIREDREQUIRED
�������� Low limits of detectionLow limits of detection�������� GOOD ACCURACYGOOD ACCURACY
�������� High degree of confirmationHigh degree of confirmation�������� RobustnessRobustness
�� Short analysis timeShort analysis time�� BroadBroad MRM scopeMRM scope�� Affordable costAffordable cost
RequirementsRequirements

MATRIX EFFECTSMATRIX EFFECTS: :
truenesstrueness issueissue bothboth in LC in LC andand GCGC
Change of a chromatographic peak intensitypeak intensity and shapeshape of affected compounds when they are injected
in the presence of a complex matrix
J. J. HajHajššlovlov áá andand J. J. ZrostlZrostl ííkovkov áá, J. , J. ChromatogrChromatogr . A 1000 (2003) 181. A 1000 (2003) 181
Response Response enhancementenhancement
Response Response diminishmentdiminishment

standard in standard in netnet solventsolvent
RealReal lifelife samplesample
ExampleExample::
GC/MS GC/MS analysisanalysis ((splitlesssplitless injjectioninjjection) ) ofof pesticide pesticide residuesresidues
(0.02 mg/kg) in (0.02 mg/kg) in appleapple extractextract (A) (A) andand netnet solventsolvent (B)(B)

8.60 8.70 8.80 8.90 9.00 9.10 9.20 9.30 9.40050010001500200025003000350040004500500055006000650070007500800085009000950010000105001100011500120001250013000
Time-->
9.03
8.60 8.70 8.80 8.90 9.00 9.109.20 9.30 9.400Time
-->
9.26
.
ExampleExample ::GC/MS (SIM, m/z 87) sGC/MS (SIM, m/z 87) s ppll itlessitless injectioninjection 5 5 pgpg
dimethoatedimethoate in in crudecrude plantplant extractextract(1.5 µL, 2.5g matrix /ml)
50th injection
1stinjection
Abundance 1203106.D
m/z 87

Elimination Elimination vs.vs. ccompensationompensation for for mmatrixatrix eeffectsffects
Impossible Impossible
in practicein practice
Impractical Impractical
for routinefor routine
CHALLENGE!CHALLENGE!��AnalyteAnalyte protectantsprotectants
�������� ELIMINATIONELIMINATION�No active sites in GC system
�No matrix compounds
�������� COMPENSATIONCOMPENSATION�Standard additionStandard addition
��MatrixMatrix --matched standardsmatched standards
��IsotopicallyIsotopically labeled internal standardslabeled internal standards

GENERAL CONCEPT: Replacement of laborious matrix-matched
standardsstandards by addition of compounds simulating (mimicking) addition of compounds simulating (mimicking) matrix to standard in pure solventmatrix to standard in pure solvent
� �
Stock
solution
of APs
STD in pure
solventSTD in pure
solvent with APs
Real sample
with APs
Real sample
ANALYTE PROTECTANTSANALYTE PROTECTANTS
Compounds Compounds sstronglytrongly interactinteractinging with with active sites active sites inin the GC systemthe GC system
M. Anastassiades et al.,
J. Chromatogr. A 1015 (2003) 63

USE OF ANALYTE PROTECTANSUSE OF ANALYTE PROTECTANS
→→→→→→→→ oobtainingbtaining more accuratemore accurate datadata
matrix matrix + APssolvent solvent + APs
0.0045 mg/kg0.022 mg/kg
0.005 mg/kg,apple
PHOSALON

0
100
200
300
400
500
Dichlor
vos
Mevinpho
sOmethoate
Pirimica
rbVinc
lozolin
Metalaxyl
Pirimipho
s-methyl
Methiocarb
Chlorpy
rifos
Tolylf lu
anidPro
cymidone
Thiabend
azole
Endosu
lfan I
Imaza
lil
Parathio
n-methyl
Bromop
ropy
latePhos
alone
Cyhalot
hrin-l
Deltamethrin
Azoxy
strobin
Re
lativ
e in
ten
sity
(%
)
CComparisonomparison of Generated Data of Generated Data
Accurate data over a broad Accurate data over a broad analyteanalyte spectrum spectrum !!
3-ethoxy-1,2-propandiol (4 mg/mL)
L-gulonic acid γ-lactone (1 mg/mL)
D-glucitol (1 mg/mL)
Baby food0.015 mg/kg
���� Without analyte protectants ���� With analyte protectants
1340%1340% 1450%1450%

1D 2D
EnjoyEnjoy movingmoving aheadahead …..…..