Today’s “Game Plan” Two Trial-Runs of a new deemed measure review process – Deemed measure...
26
-
Upload
helen-hudson -
Category
Documents
-
view
216 -
download
2
Transcript of Today’s “Game Plan” Two Trial-Runs of a new deemed measure review process – Deemed measure...
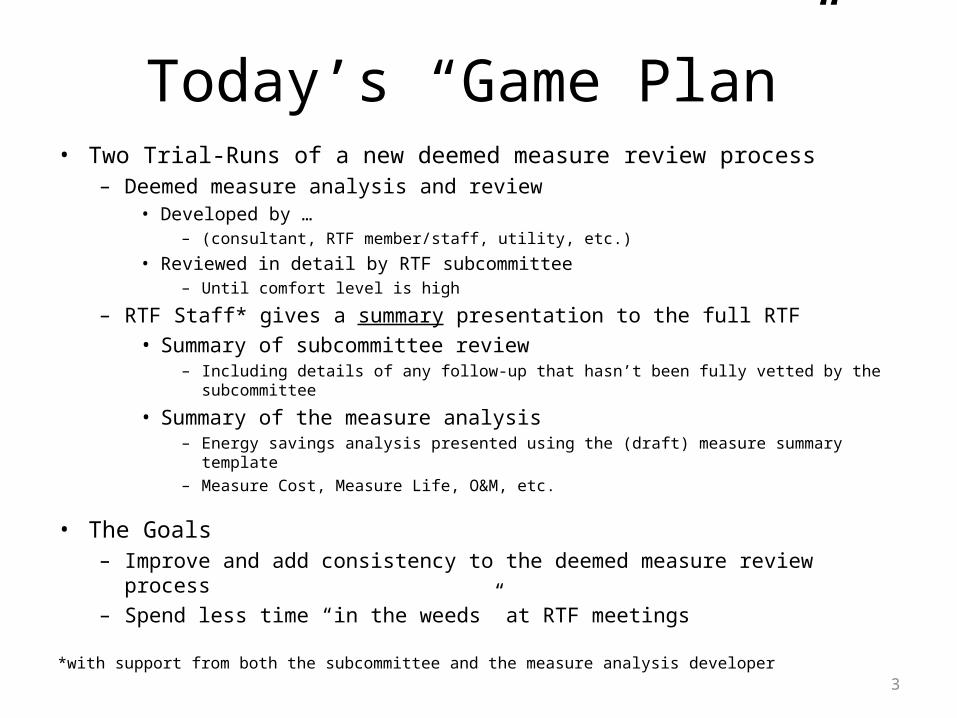
Today’s “Game Plan”• Two Trial-Runs of a new deemed measure review process
– Deemed measure analysis and review• Developed by …
– (consultant, RTF member/staff, utility, etc.)
• Reviewed in detail by RTF subcommittee– Until comfort level is high
– RTF Staff* gives a summary presentation to the full RTF• Summary of subcommittee review
– Including details of any follow-up that hasn’t been fully vetted by the subcommittee
• Summary of the measure analysis– Energy savings analysis presented using the (draft) measure summary template– Measure Cost, Measure Life, O&M, etc.
• The Goals– Improve and add consistency to the deemed measure review process– Spend less time “in the weeds” at RTF meetings
*with support from both the subcommittee and the measure analysis developer3
LED Lighting in Vertical and Semi-Vertical Open Display Cases
Deemed Measure Proposal
Regional Technical ForumSeptember 28, 2010
Analysis Prepared By: PECI (Eric Mullendore and Michele Friedrich)
RTF Subcommittee Review? Yes (Sept 2, 2010)
RTF Staff Review? Yes (Adam Hadley)
Presentation Prepared By: RTF Staff (Adam Hadley)
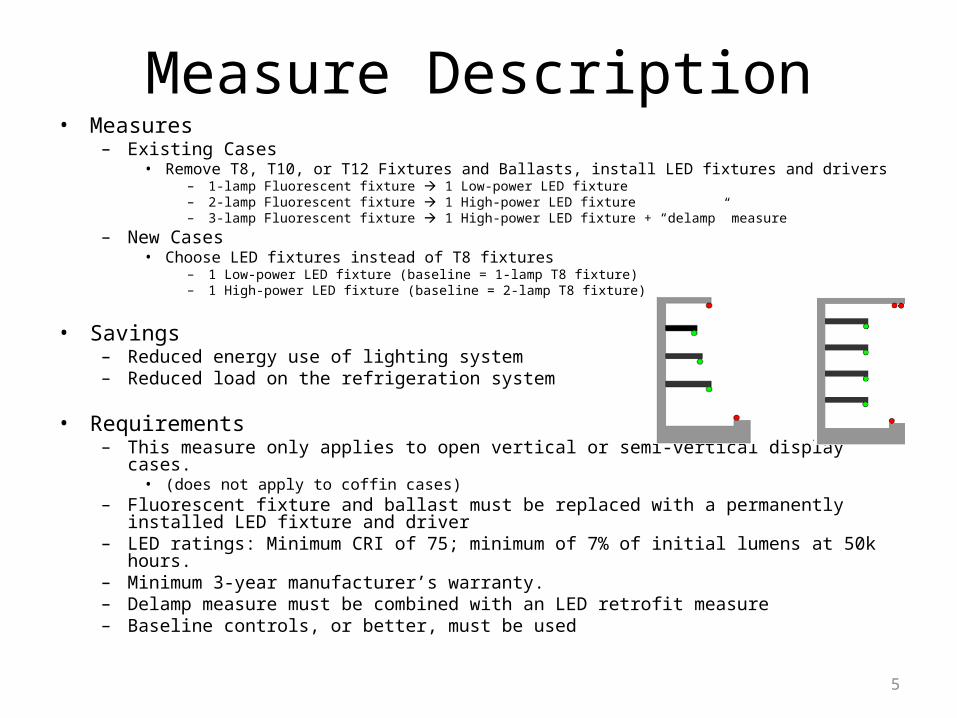
• Measures– Existing Cases
• Remove T8, T10, or T12 Fixtures and Ballasts, install LED fixtures and drivers – 1-lamp Fluorescent fixture 1 Low-power LED fixture– 2-lamp Fluorescent fixture 1 High-power LED fixture– 3-lamp Fluorescent fixture 1 High-power LED fixture + “delamp” measure
– New Cases• Choose LED fixtures instead of T8 fixtures
– 1 Low-power LED fixture (baseline = 1-lamp T8 fixture)– 1 High-power LED fixture (baseline = 2-lamp T8 fixture)
• Savings– Reduced energy use of lighting system– Reduced load on the refrigeration system
• Requirements– This measure only applies to open vertical or semi-vertical display cases.
• (does not apply to coffin cases)– Fluorescent fixture and ballast must be replaced with a permanently installed LED fixture and
driver– LED ratings: Minimum CRI of 75; minimum of 7% of initial lumens at 50k hours.– Minimum 3-year manufacturer’s warranty.– Delamp measure must be combined with an LED retrofit measure– Baseline controls, or better, must be used
Measure Description
5

Subcommittee Review• Meeting held September 2, 2010
(meeting notes available at: http://www.nwcouncil.org/rtf/subcommittees/grocery/meetings/meetings.htm )
– Attendees• PECI: Lagan Todd, Jen Shafter, Dustin Bailey, Ben Cartwright, Paul Schertz, Ben Wright,
Michele Friedrich• RTF/Other: Diwanshu Shekhar, Charlie Grist, Eric Brateng, Tim Steele, Adam Hadley,
David Baylon• Meeting Summary:
– PECI generated the analysis and presented its proposal to the subcommittee– The group reviewed key input parameters and supporting data sources in
detail– Conclusion: PECI’s savings calculation approach and input assumptions are
reasonable. The only follow-up needed is review of the assumption on number of ballasts per lamp.
• Meeting Follow-up (not reviewed by subcommittee):– Ballasts/drivers per lamp is not addressed directly. The calculation
determines energy use of the ballast/driver based on a fixed percentage of the lamp power draw.
6
7
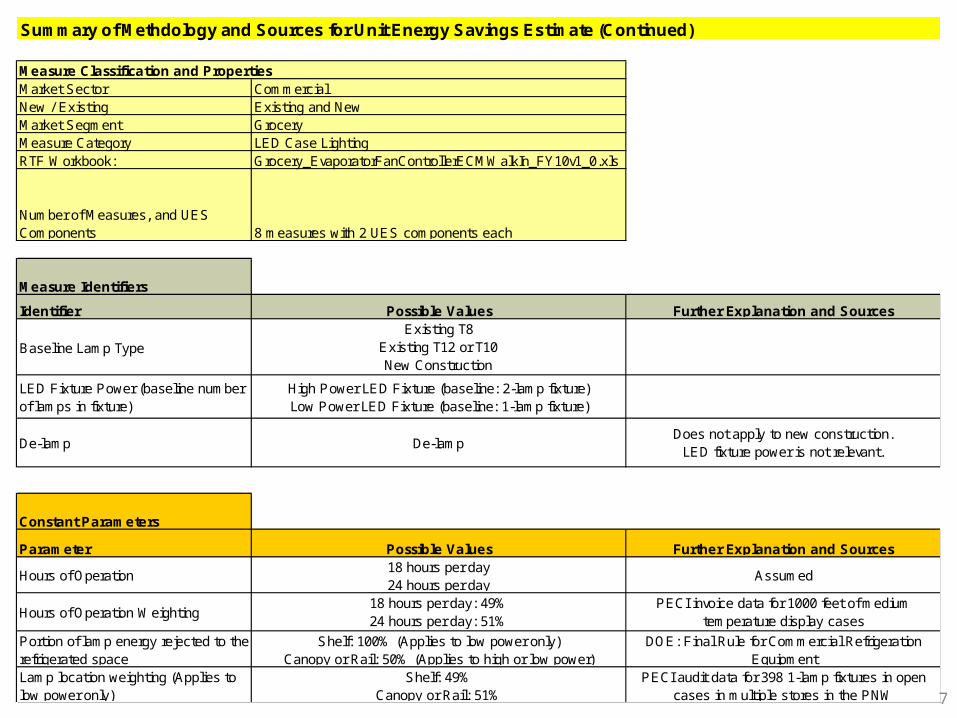
Summary of Methdology and Sources for Unit Energy Savings Estimate (Continued)
Measure Classification and PropertiesMarket Sector CommercialNew / Existing Existing and NewMarket Segment GroceryMeasure Category LED Case LightingRTF Workbook: Grocery_EvaporatorFanControllerECMWalkIn_FY10v1_0.xls
Number of Measures, and UES Components 8 measures with 2 UES components each
Measure Identifiers
Identifier
Baseline Lamp Type
LED Fixture Power (baseline number of lamps in fixture)
De-lamp
Constant Parameters
Parameter
Hours of Operation
Hours of Operation Weighting
Portion of lamp energy rejected to the refrigerated spaceLamp location weighting (Applies to low power only)
18 hours per day24 hours per day
Assumed
Possible Values Further Explanation and SourcesExisting T8
Existing T12 or T10New Construction
Possible Values Further Explanation and Sources
Shelf: 49%Canopy or Rail: 51%
PECI audit data for 398 1-lamp fixtures in open cases in multiple stores in the PNW
High Power LED Fixture (baseline: 2-lamp fixture)Low Power LED Fixture (baseline: 1-lamp fixture)
De-lampDoes not apply to new construction.
LED fixture power is not relevant.
Shelf: 100% (Applies to low power only)Canopy or Rail: 50% (Applies to high or low power)
18 hours per day: 49%24 hours per day: 51%
PECI invoice data for 1000 feet of medium temperature display cases
DOE: Final Rule for Commercial Refrigeration Equipment

Summary of Methdology and Sources for Unit Energy Savings Estimate (Continued)
8
Unit Energy Savings (UES) Estimation Method, Parameters and SourcesMeasure Type UES
ComponentAnalysis approach Primary
Parameter / Adjustment Factor
Baseline Description
Efficient Case
Description
Baseline Source Efficient Case Source
Lamp Power Use (per linear foot)
T-8 1-lamp: 8 watts 2-lamp: 16 watts
T-12/10 1-lamp: 10 watts 2-lamp: 20 watts
High Power7 watts
Low Power4 watts
Grainger Catalog32W T840W T12
Manufacturers' Specifications
Ballast/Driver Power Use
T-8: 5% of fixture power
T-12/10: 15% of fixture power
10% of fixture power
Grainger CatalogManufacturers' Specifications
Refrigeration system savings due to reduced heat load from direct lighting energy savings
The approach applies the EER of the refrigeration system to the portion of direct lamp energy savings that would have been
rejected to the refrigerated space. Portion of lamp energy rejected to the refrigerated space is based on
lamp location within the case. Savings are calculated for two
hours of operation scenarios and weighted. For 1-lamp fixture
baseline measures, savings are also calculated for two lamp
location scenarios and weighted.
EER
Direct lighting energy savings
Savings is calculated as the difference between the energy use of the baseline and replacement
lighting system. Energy use of the lighting systems is calculated as the sum of the lamp energy use and ballast (driver) energy use. Lamp and ballast (driver) energy use are both calculated by the
product of their hours of operation and their power draw. Savings are
calculated for two hours of operation scenarios and weighted.
Replace fluorescent
fixture in open display cases
with LED fixture
10.9DOE2.2R Model from GrocerSmart
3.0
9
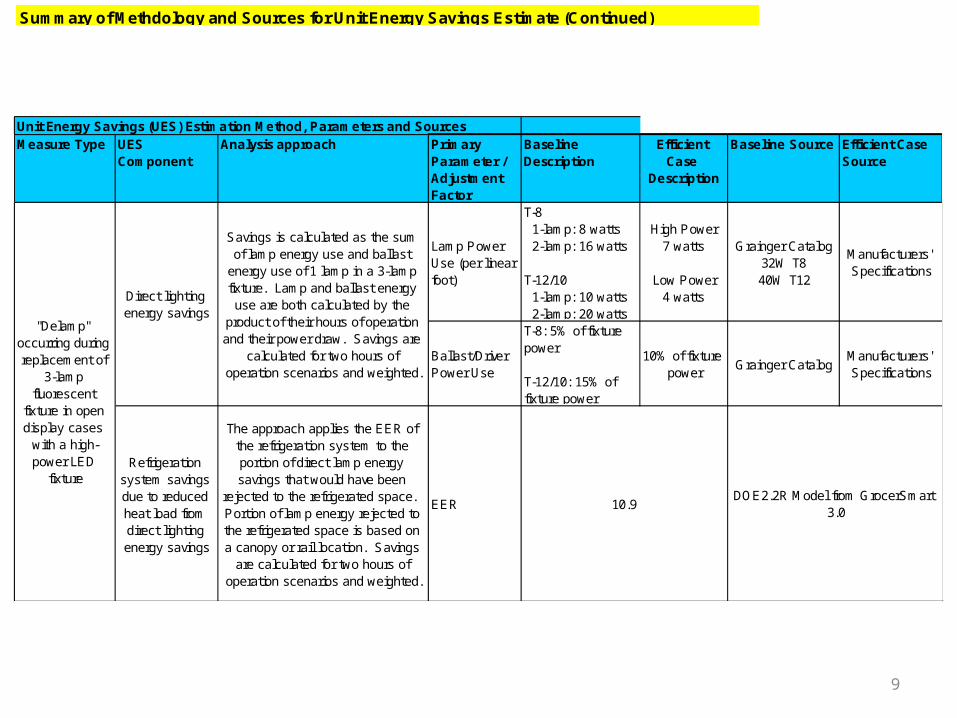
Summary of Methdology and Sources for Unit Energy Savings Estimate (Continued)
Unit Energy Savings (UES) Estimation Method, Parameters and SourcesMeasure Type UES
ComponentAnalysis approach Primary
Parameter / Adjustment Factor
Baseline Description
Efficient Case
Description
Baseline Source Efficient Case Source
Lamp Power Use (per linear foot)
T-8 1-lamp: 8 watts 2-lamp: 16 watts
T-12/10 1-lamp: 10 watts 2-lamp: 20 watts
High Power7 watts
Low Power4 watts
Grainger Catalog32W T840W T12
Manufacturers' Specifications
Ballast/Driver Power Use
T-8: 5% of fixture power
T-12/10: 15% of fixture power
10% of fixture power
Grainger CatalogManufacturers' Specifications
Refrigeration system savings due to reduced heat load from direct lighting energy savings
The approach applies the EER of the refrigeration system to the portion of direct lamp energy savings that would have been
rejected to the refrigerated space. Portion of lamp energy rejected to the refrigerated space is based on a canopy or rail location. Savings
are calculated for two hours of operation scenarios and weighted.
EER
Direct lighting energy savings
"Delamp" occurring during replacement of
3-lamp fluorescent
fixture in open display cases
with a high-power LED
fixture
Savings is calculated as the sum of lamp energy use and ballast
energy use of 1 lamp in a 3-lamp fixture. Lamp and ballast energy use are both calculated by the
product of their hours of operation and their power draw. Savings are
calculated for two hours of operation scenarios and weighted.
10.9DOE2.2R Model from GrocerSmart
3.0
10
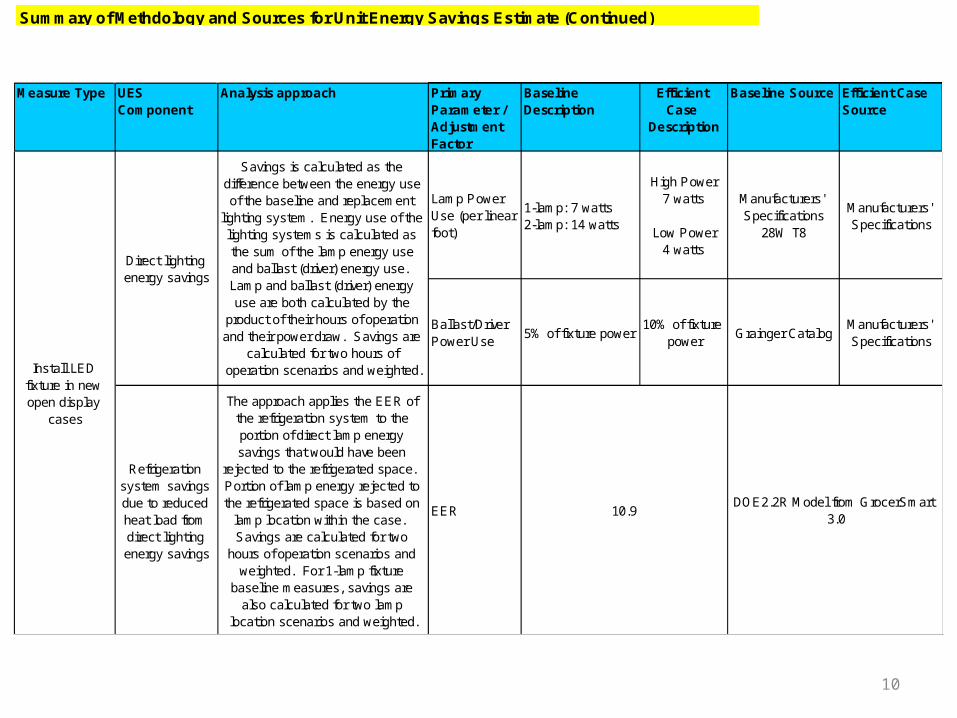
Summary of Methdology and Sources for Unit Energy Savings Estimate (Continued)
Measure Type UES Component
Analysis approach Primary Parameter / Adjustment Factor
Baseline Description
Efficient Case
Description
Baseline Source Efficient Case Source
Lamp Power Use (per linear foot)
1-lamp: 7 watts2-lamp: 14 watts
High Power7 watts
Low Power4 watts
Manufacturers' Specifications
28W T8
Manufacturers' Specifications
Ballast/Driver Power Use
5% of fixture power10% of fixture
powerGrainger Catalog
Manufacturers' Specifications
Refrigeration system savings due to reduced heat load from direct lighting energy savings
The approach applies the EER of the refrigeration system to the portion of direct lamp energy savings that would have been
rejected to the refrigerated space. Portion of lamp energy rejected to the refrigerated space is based on
lamp location within the case. Savings are calculated for two
hours of operation scenarios and weighted. For 1-lamp fixture
baseline measures, savings are also calculated for two lamp
location scenarios and weighted.
EER
Install LED fixture in new open display
cases
Direct lighting energy savings
Savings is calculated as the difference between the energy use of the baseline and replacement
lighting system. Energy use of the lighting systems is calculated as the sum of the lamp energy use and ballast (driver) energy use. Lamp and ballast (driver) energy use are both calculated by the
product of their hours of operation and their power draw. Savings are
calculated for two hours of operation scenarios and weighted.
10.9DOE2.2R Model from GrocerSmart
3.0
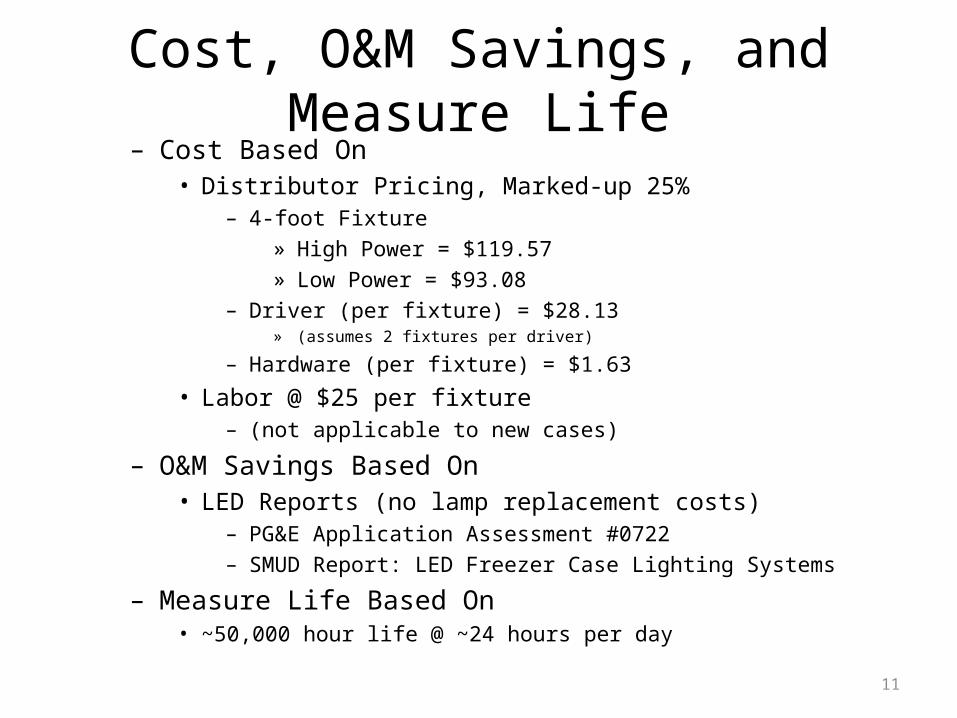
Cost, O&M Savings, and Measure Life– Cost Based On
• Distributor Pricing, Marked-up 25%– 4-foot Fixture
» High Power = $119.57» Low Power = $93.08
– Driver (per fixture) = $28.13 » (assumes 2 fixtures per driver)
– Hardware (per fixture) = $1.63
• Labor @ $25 per fixture – (not applicable to new cases)
– O&M Savings Based On• LED Reports (no lamp replacement costs)
– PG&E Application Assessment #0722– SMUD Report: LED Freezer Case Lighting Systems
– Measure Life Based On• ~50,000 hour life @ ~24 hours per day
11
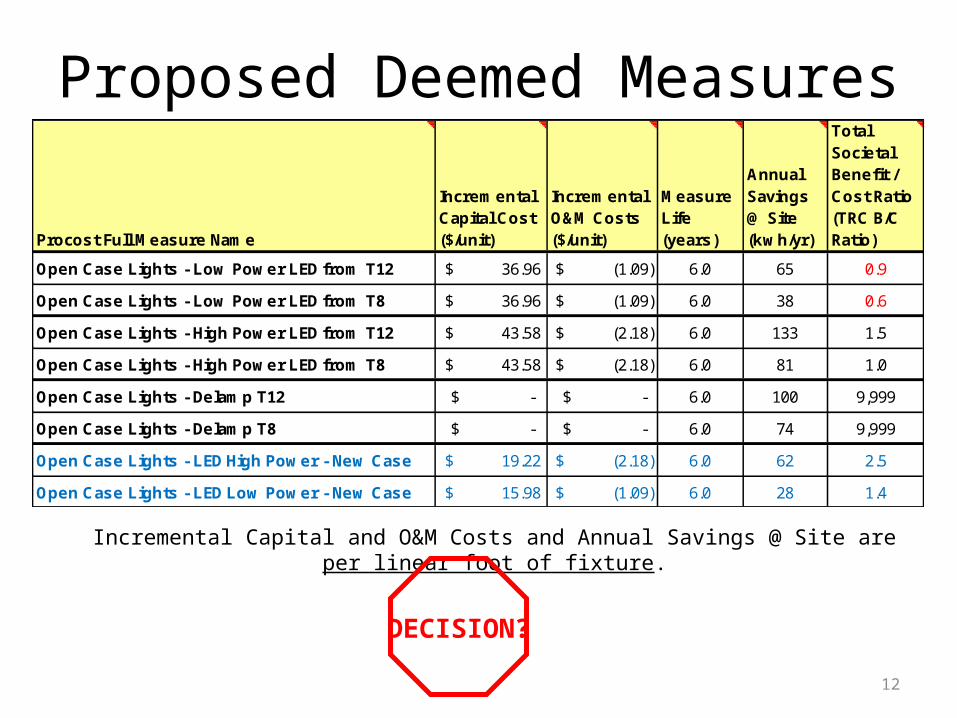
Proposed Deemed Measures
12
Incremental Capital and O&M Costs and Annual Savings @ Site are per linear foot of fixture.
Procost Full Measure Name
Incremental Capital Cost ($/unit)
Incremental O&M Costs ($/unit)
Measure Life (years)
Annual Savings @ Site (kwh/yr)
Total Societal Benefit / Cost Ratio (TRC B/C Ratio)
Open Case Lights - Low Power LED from T12 $ 36.96 $ (1.09) 6.0 65 0.9
Open Case Lights - Low Power LED from T8 $ 36.96 $ (1.09) 6.0 38 0.6
Open Case Lights - High Power LED from T12 $ 43.58 $ (2.18) 6.0 133 1.5
Open Case Lights - High Power LED from T8 $ 43.58 $ (2.18) 6.0 81 1.0
Open Case Lights - Delamp T12 $ - $ - 6.0 100 9,999
Open Case Lights - Delamp T8 $ - $ - 6.0 74 9,999
Open Case Lights - LED High Power - New Case $ 19.22 $ (2.18) 6.0 62 2.5
Open Case Lights - LED Low Power - New Case $ 15.98 $ (1.09) 6.0 28 1.4
DECISION?
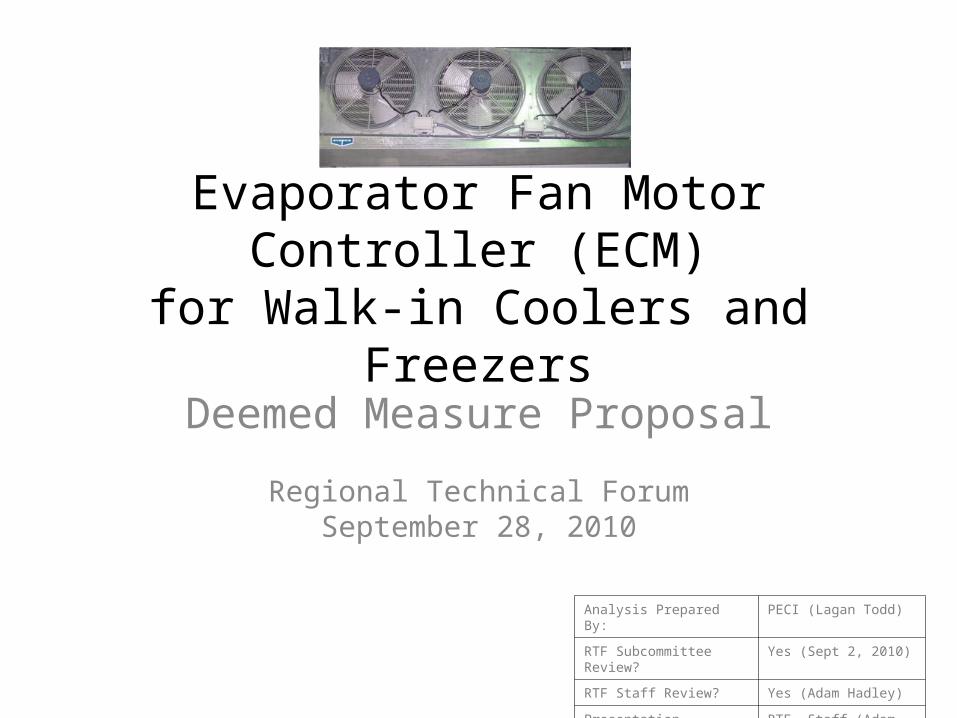
Evaporator Fan Motor Controller (ECM)for Walk-in Coolers and Freezers
Deemed Measure Proposal
Regional Technical ForumSeptember 28, 2010
Analysis Prepared By: PECI (Lagan Todd)
RTF Subcommittee Review? Yes (Sept 2, 2010)
RTF Staff Review? Yes (Adam Hadley)
Presentation Prepared By: RTF Staff (Adam Hadley)
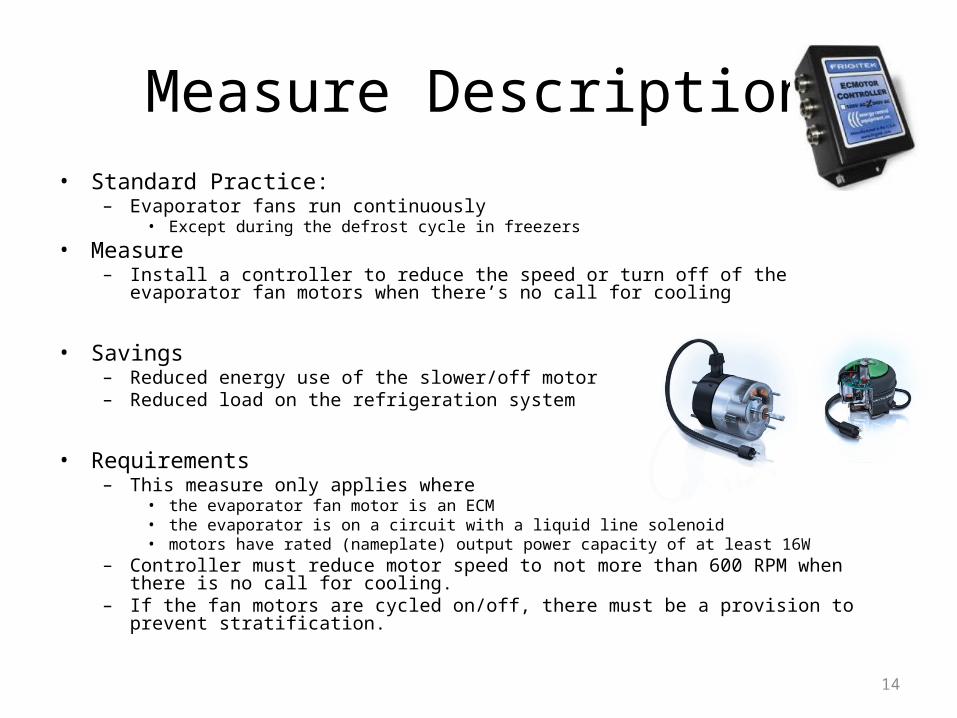
• Standard Practice:– Evaporator fans run continuously
• Except during the defrost cycle in freezers• Measure
– Install a controller to reduce the speed or turn off of the evaporator fan motors when there’s no call for cooling
• Savings– Reduced energy use of the slower/off motor– Reduced load on the refrigeration system
• Requirements– This measure only applies where
• the evaporator fan motor is an ECM• the evaporator is on a circuit with a liquid line solenoid• motors have rated (nameplate) output power capacity of at least 16W
– Controller must reduce motor speed to not more than 600 RPM when there is no call for cooling.
– If the fan motors are cycled on/off, there must be a provision to prevent stratification.
Measure Description
14
Subcommittee Review• Meeting held September 2, 2010
(meeting notes available at: http://www.nwcouncil.org/rtf/subcommittees/grocery/meetings/meetings.htm )
– Attendees• PECI: Lagan Todd, Jen Shafter, Dustin Bailey, Ben Cartwright, Paul
Schertz, Ben Wright, Michele Friedrich, Jamie Anthony• RTF/Other: Diwanshu Shekhar, Charlie Grist, Eric Brateng, Tim Steele,
Adam Hadley, David Baylon• Meeting Summary:
– PECI generated the analysis and presented its proposal to the subcommittee
– The group reviewed key input parameters and supporting data sources in detail
– Conclusion: PECI’s savings calculation approach is reasonable. With a few revisions to input assumptions, this measure could be deemed.
15
Subcommittee Meeting Follow-upPECI’s follow-up was emailed to the Subcommittee on Sept 16th
• Measures are now disaggregated by motor size and case temperature – (previously, one weighted savings value was proposed)
• Refrigeration system savings make up:– 27% of the total savings for Medium Temp– 47% of the total savings for Low Temp
• Recommend the following assumptions based on a field study of condenser/compressor runtimes of 5 LT and 7 MT walk-ins
– Low Temp• Evaporator Fan at Full Speed: 68%• Evaporator Fan at Low Speed: 32%
– Medium Temp• Evaporator Fan at Full Speed: 58%• Evaporator Fan at Low Speed: 42%
• Recommend using 2.5 for the exponent in the fan law calculation – (savings more conservative than when using 2.7)
• Allow on/off type controllers. – Savings are only slightly lower (~5%) than full speed/low speed type controllers
• 1 minute on / 7 minutes off assumed as the control strategy for on/off type controller• EER values based on PECI’s extensive audit data, filtered for eligible applications (nearly 8000
systems)
16
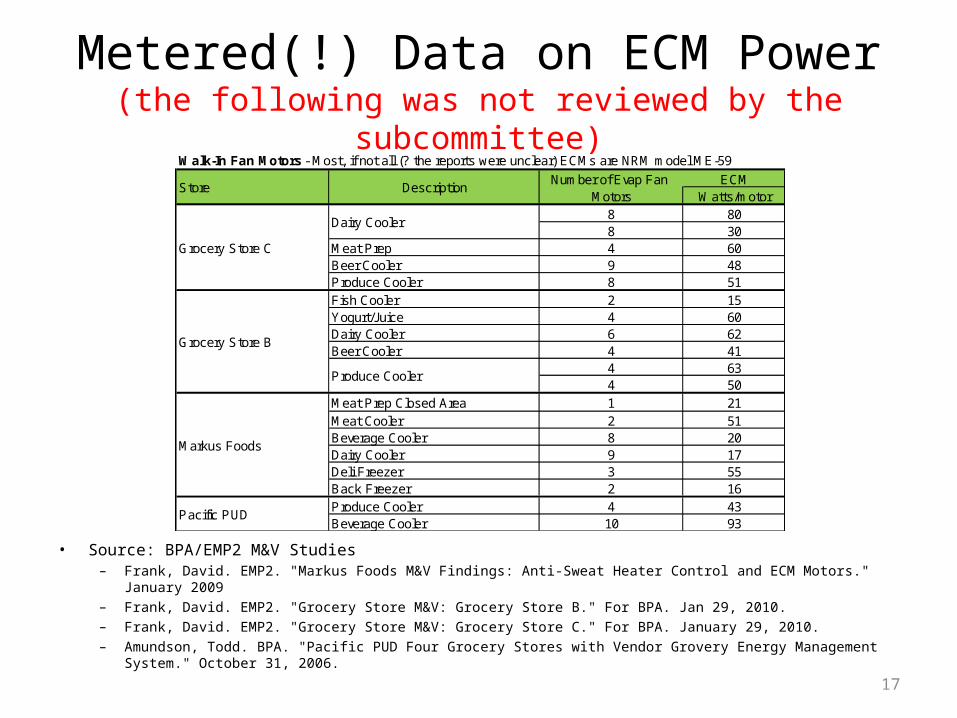
Metered(!) Data on ECM Power(the following was not reviewed by the subcommittee)
• Source: BPA/EMP2 M&V Studies– Frank, David. EMP2. "Markus Foods M&V Findings: Anti-Sweat Heater Control and ECM Motors." January 2009– Frank, David. EMP2. "Grocery Store M&V: Grocery Store B." For BPA. Jan 29, 2010.– Frank, David. EMP2. "Grocery Store M&V: Grocery Store C." For BPA. January 29, 2010.– Amundson, Todd. BPA. "Pacific PUD Four Grocery Stores with Vendor Grovery Energy Management System." October
31, 2006.17
Walk-In Fan Motors - Most, if not all (? the reports were unclear) ECMs are NRM model ME-59
Watts/motor8 808 30
Meat Prep 4 60Beer Cooler 9 48Produce Cooler 8 51Fish Cooler 2 15Yogurt/Juice 4 60Dairy Cooler 6 62Beer Cooler 4 41
4 634 50
Meat Prep Closed Area 1 21Meat Cooler 2 51Beverage Cooler 8 20Dairy Cooler 9 17Deli Freezer 3 55Back Freezer 2 16Produce Cooler 4 43Beverage Cooler 10 93
Markus Foods
Pacific PUD
Store Description
Grocery Store B
Produce Cooler
Number of Evap Fan Motors
ECM
Grocery Store C
Dairy Cooler
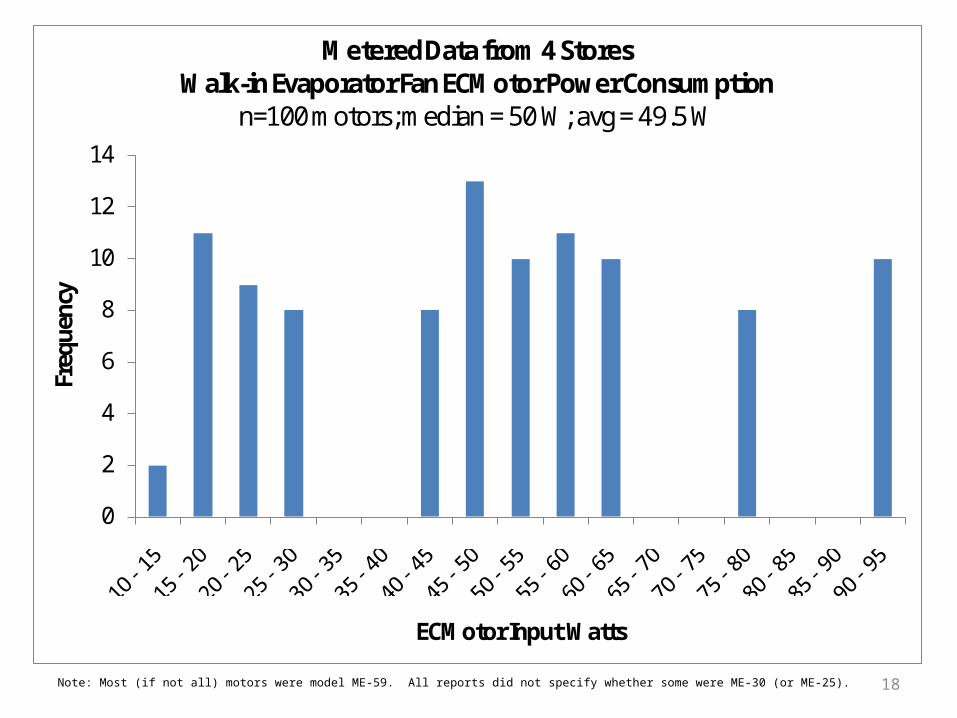
Note: Most (if not all) motors were model ME-59. All reports did not specify whether some were ME-30 (or ME-25). 18
0
2
4
6
8
10
12
14
Freq
uenc
y
ECMotor Input Watts
Metered Data from 4 StoresWalk-in Evaporator Fan ECMotor Power Consumption
n=100 motors; median = 50 W; avg = 49.5 W
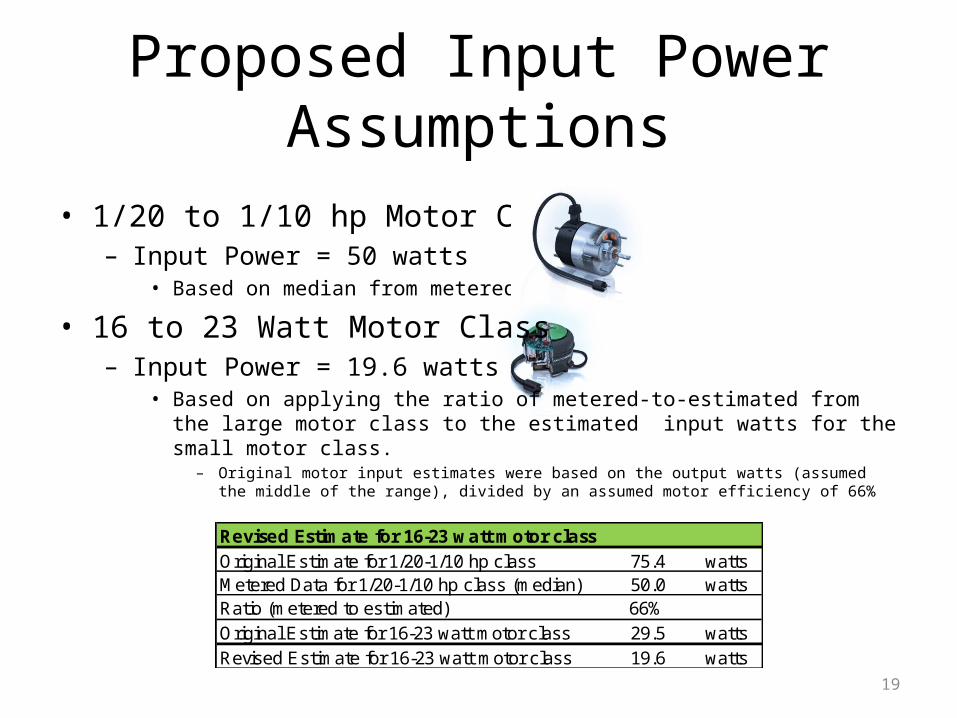
• 1/20 to 1/10 hp Motor Class– Input Power = 50 watts
• Based on median from metered data
• 16 to 23 Watt Motor Class– Input Power = 19.6 watts
• Based on applying the ratio of metered-to-estimated from the large motor class to the estimated input watts for the small motor class.
– Original motor input estimates were based on the output watts (assumed the middle of the range), divided by an assumed motor efficiency of 66%
Proposed Input Power Assumptions
19
Revised Estimate for 16-23 watt motor classOriginal Estimate for 1/20-1/10 hp class 75.4 wattsMetered Data for 1/20-1/10 hp class (median) 50.0 wattsRatio (metered to estimated) 66%Original Estimate for 16-23 watt motor class 29.5 wattsRevised Estimate for 16-23 watt motor class 19.6 watts

Summary of Methdology and Sources for Unit Energy Savings Estimate
Measure Classification and PropertiesMarket Sector CommercialNew / Existing ExistingMarket Segment GroceryMeasure Category Evaporator Fan ECMotor Controller on Walk-insRTF Workbook: Grocery_EvaporatorFanControllerECMWalkIn_FY10v1_0.xlsNumber of Measures, and UES 4 measures with 2 UES components each
Measure Identifiers
IdentifierMotor Size Either:
a. within the range of 1/10 to 1/20 horsepower; orb. within the range of 16 to 23 Watts
Case Temperature
Possible Values
Low TemperatureMedium Temperature
20
Constant Parameters
Parameter
Fan Law Exponent
Fan Speed at full speed
Fan Speed at low speed
Performance Degradation Factor
1550 RPM is the most common rotational speed of WI evaporator fan motors
Possible Values Further Explanation and Sources
Assumed. Theoretical value is 3. Reduced to 2.5 to adjust for losses.
An average of two industry-recommended low speed settings (500 and 600)
PECI assumption from GrocerSmart software
2.5
1550 rpm
550 rpm
98%
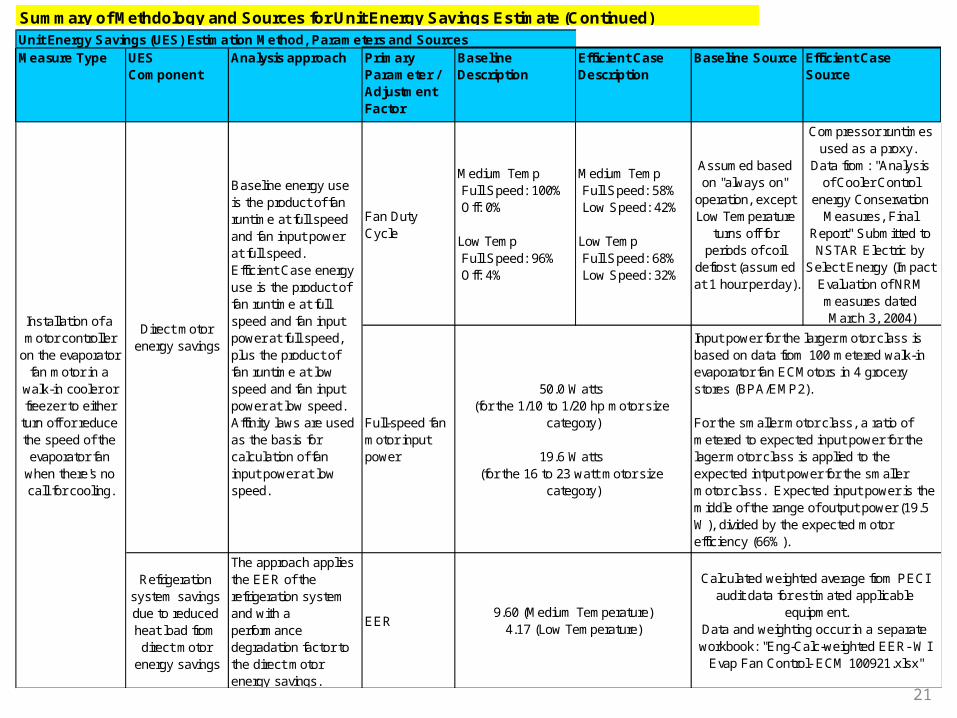
Summary of Methdology and Sources for Unit Energy Savings Estimate (Continued)
21
Unit Energy Savings (UES) Estimation Method, Parameters and SourcesMeasure Type UES
ComponentAnalysis approach Primary
Parameter / Adjustment Factor
Baseline Description
Efficient Case Description
Baseline Source Efficient Case Source
Fan Duty Cycle
Medium Temp Full Speed: 100% Off: 0%
Low Temp Full Speed: 96% Off: 4%
Medium Temp Full Speed: 58% Low Speed: 42%
Low Temp Full Speed: 68% Low Speed: 32%
Assumed based on "always on"
operation, except Low Temperature
turns off for periods of coil
defrost (assumed at 1 hour per day).
Compressor runtimes used as a proxy.
Data from: "Analysis of Cooler Control
energy Conservation Measures, Final
Report" Submitted to NSTAR Electric by
Select Energy (Impact Evaluation of NRM measures dated March 3, 2004)
Full-speed fan motor input power
Refrigeration system savings due to reduced heat load from direct motor
energy savings
The approach applies the EER of the refrigeration system and with a performance degradation factor to the direct motor energy savings.
EER
Installation of a motor controller
on the evaporator fan motor in a
walk-in cooler or freezer to either
turn off or reduce the speed of the evaporator fan
when there's no call for cooling.
Direct motor energy savings
Baseline energy use is the product of fan runtime at full speed and fan input power at full speed. Efficient Case energy use is the product of fan runtime at full speed and fan input power at full speed, plus the product of fan runtime at low speed and fan input power at low speed. Affinity laws are used as the basis for calculation of fan input power at low speed.
50.0 Watts (for the 1/10 to 1/20 hp motor size
category)
19.6 Watts (for the 16 to 23 watt motor size
category)
Input power for the larger motor class is based on data from 100 metered walk-in evaporator fan ECMotors in 4 grocery stores (BPA/EMP2).
For the smaller motor class, a ratio of metered to expected input power for the lager motor class is applied to the expected intput power for the smaller motor class. Expected input power is the middle of the range of output power (19.5 W), divided by the expected motor efficiency (66%).
9.60 (Medium Temperature)4.17 (Low Temperature)
Calculated weighted average from PECI audit data for estimated applicable
equipment.Data and weighting occur in a separate workbook: "Eng-Calc-weighted EER- WI
Evap Fan Control- ECM 100921.xlsx"
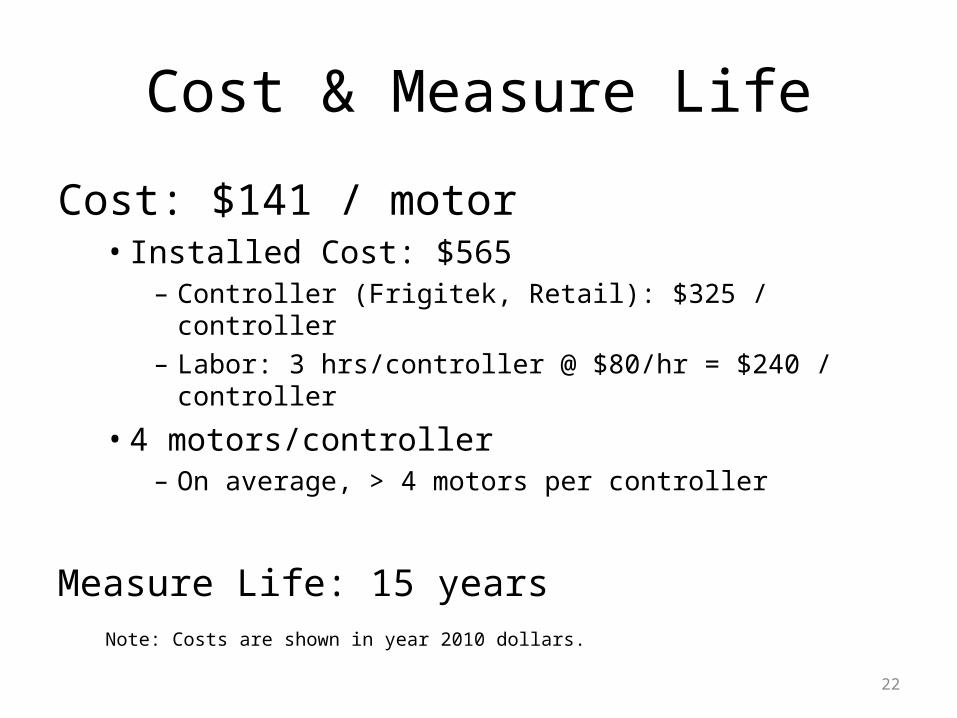
Cost & Measure Life
Cost: $141 / motor• Installed Cost: $565
– Controller (Frigitek, Retail): $325 / controller– Labor: 3 hrs/controller @ $80/hr = $240 / controller
• 4 motors/controller– On average, > 4 motors per controller
Measure Life: 15 years
22
Note: Costs are shown in year 2010 dollars.
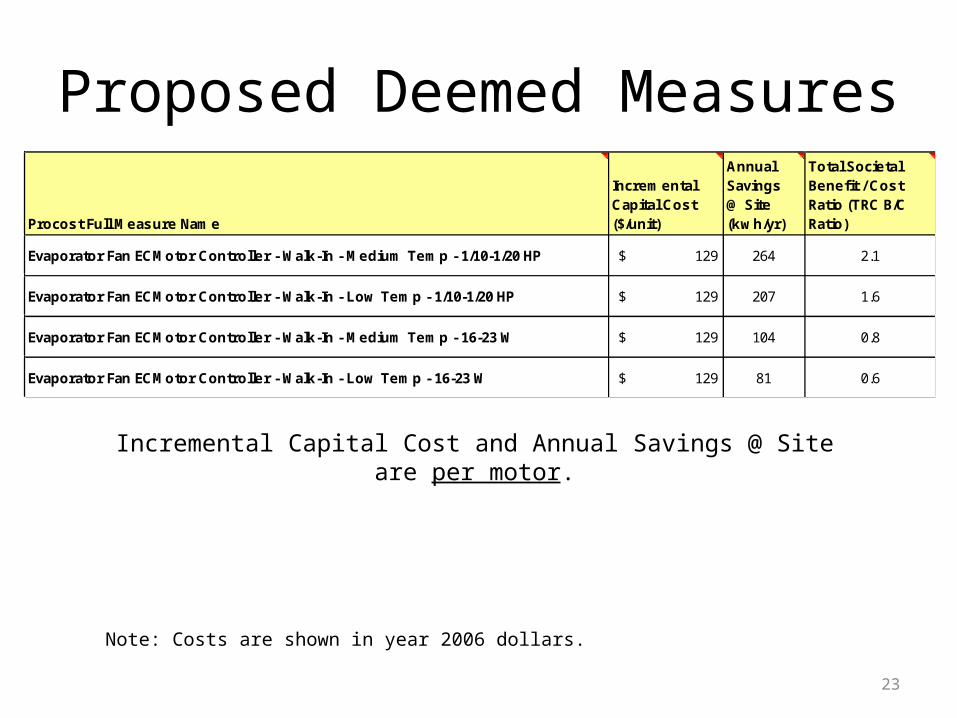
Proposed Deemed Measures
23
Note: Costs are shown in year 2006 dollars.
Incremental Capital Cost and Annual Savings @ Site are per motor.
Procost Full Measure Name
Incremental Capital Cost ($/unit)
Annual Savings @ Site (kwh/yr)
Total Societal Benefit / Cost Ratio (TRC B/C Ratio)
Evaporator Fan ECMotor Controller - Walk-In - Medium Temp - 1/10-1/20 HP $ 129 264 2.1
Evaporator Fan ECMotor Controller - Walk-In - Low Temp - 1/10-1/20 HP $ 129 207 1.6
Evaporator Fan ECMotor Controller - Walk-In - Medium Temp - 16-23 W $ 129 104 0.8
Evaporator Fan ECMotor Controller - Walk-In - Low Temp - 16-23 W $ 129 81 0.6
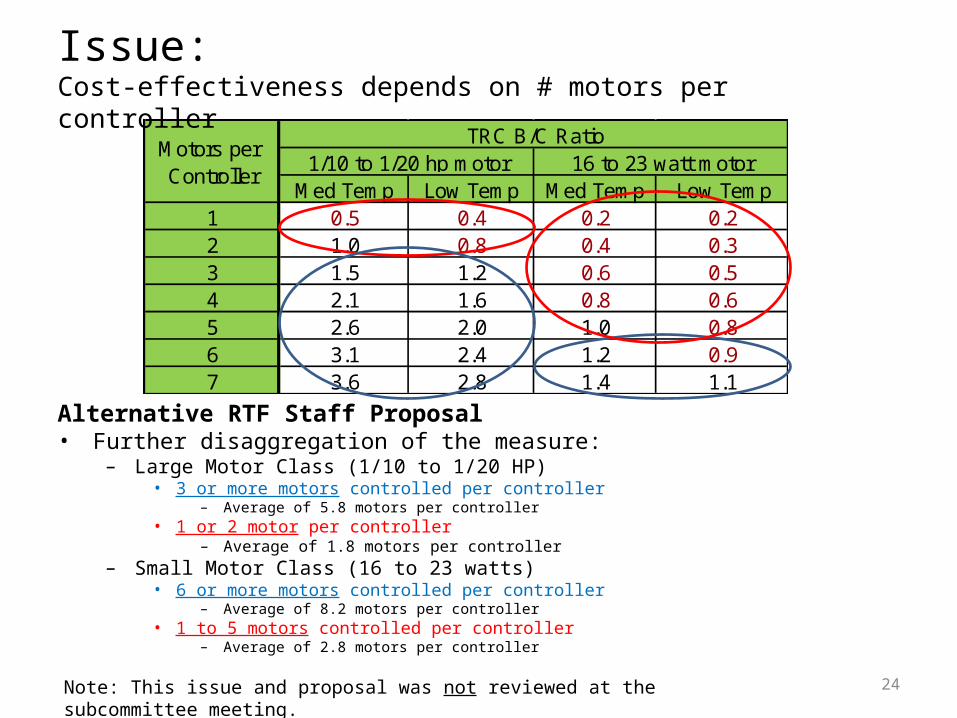
Med Temp Low Temp Med Temp Low Temp1 0.5 0.4 0.2 0.22 1.0 0.8 0.4 0.33 1.5 1.2 0.6 0.54 2.1 1.6 0.8 0.65 2.6 2.0 1.0 0.86 3.1 2.4 1.2 0.97 3.6 2.8 1.4 1.1
TRC B/C Ratio1/10 to 1/20 hp motor
Motors per Controller
16 to 23 watt motor
Issue: Cost-effectiveness depends on # motors per controller
24
Alternative RTF Staff Proposal• Further disaggregation of the measure:
– Large Motor Class (1/10 to 1/20 HP)• 3 or more motors controlled per controller
– Average of 5.8 motors per controller• 1 or 2 motor per controller
– Average of 1.8 motors per controller– Small Motor Class (16 to 23 watts)
• 6 or more motors controlled per controller– Average of 8.2 motors per controller
• 1 to 5 motors controlled per controller– Average of 2.8 motors per controller
Note: This issue and proposal was not reviewed at the subcommittee meeting.
25
0
500
1000
1500
2000
2500
0 1 2 3 4 5 6 7 8 9 10 11 12 13 14 15 16 17 18 19 >20
Nu
mb
er o
f W
alk
-in
s w
ith
Qty
X F
ans
Number of Fans
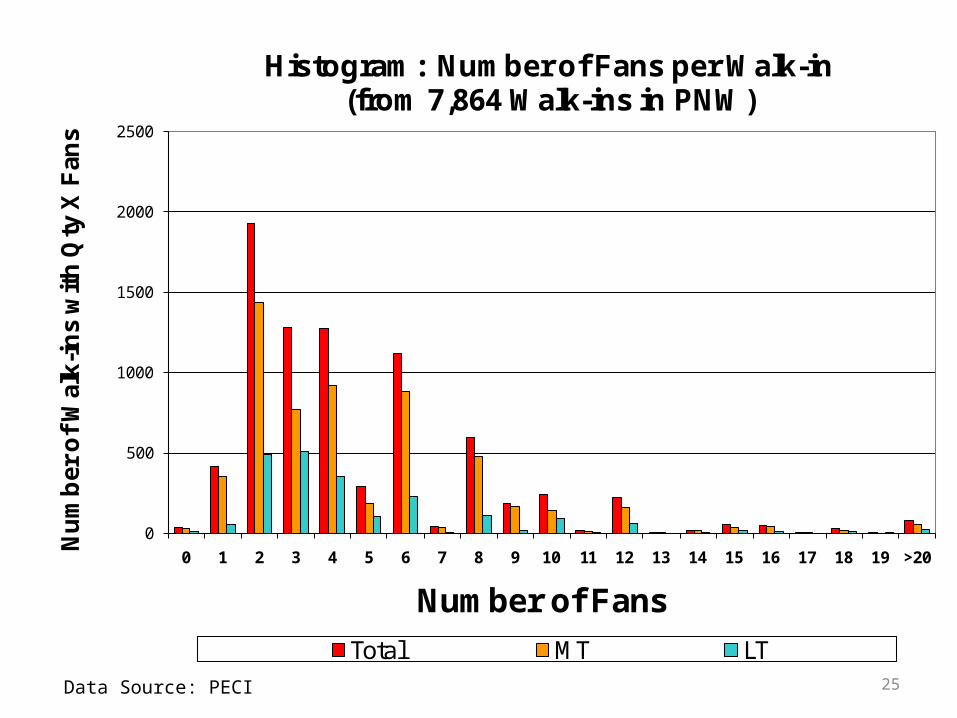
Histogram: Number of Fans per Walk-in (from 7,864 Walk-ins in PNW)
Total MT LT
Data Source: PECI
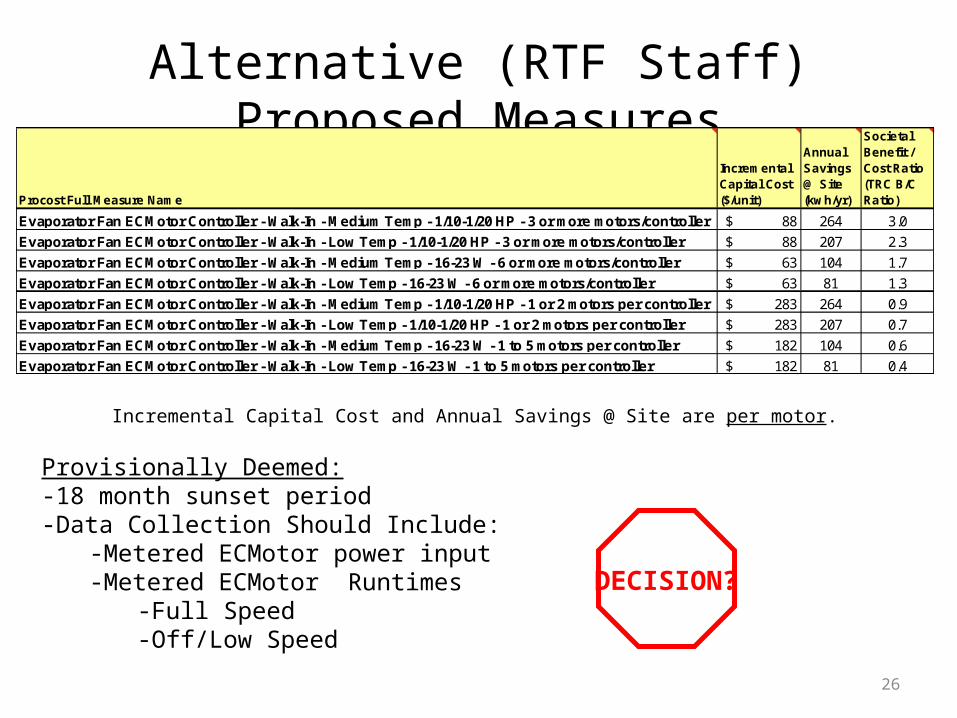
Alternative (RTF Staff) Proposed Measures
26
Incremental Capital Cost and Annual Savings @ Site are per motor.
DECISION?
Provisionally Deemed:-18 month sunset period-Data Collection Should Include:
-Metered ECMotor power input-Metered ECMotor Runtimes
-Full Speed-Off/Low Speed
Procost Full Measure Name
Incremental Capital Cost ($/unit)
Annual Savings @ Site (kwh/yr)
Total Societal Benefit / Cost Ratio (TRC B/C Ratio)
Evaporator Fan ECMotor Controller - Walk-In - Medium Temp - 1/10-1/20 HP - 3 or more motors/controller $ 88 264 3.0
Evaporator Fan ECMotor Controller - Walk-In - Low Temp - 1/10-1/20 HP - 3 or more motors/controller $ 88 207 2.3
Evaporator Fan ECMotor Controller - Walk-In - Medium Temp - 16-23 W - 6 or more motors/controller $ 63 104 1.7
Evaporator Fan ECMotor Controller - Walk-In - Low Temp - 16-23 W - 6 or more motors/controller $ 63 81 1.3
Evaporator Fan ECMotor Controller - Walk-In - Medium Temp - 1/10-1/20 HP - 1 or 2 motors per controller $ 283 264 0.9
Evaporator Fan ECMotor Controller - Walk-In - Low Temp - 1/10-1/20 HP - 1 or 2 motors per controller $ 283 207 0.7
Evaporator Fan ECMotor Controller - Walk-In - Medium Temp - 16-23 W - 1 to 5 motors per controller $ 182 104 0.6
Evaporator Fan ECMotor Controller - Walk-In - Low Temp - 16-23 W - 1 to 5 motors per controller $ 182 81 0.4