ESRC Conference on Diversity in Macroeconomics Behavioral Macroeconomics
Upload
georgina-milesCategory
view
216download
1
Today’s Economic Situation:Today’s Economic Situation:The Great Recession, The The Great Recession, The
Recovery, Where We (May Be) Recovery, Where We (May Be) Going?Going?
Principles of MacroeconomicsPrinciples of Macroeconomics7/20/127/20/12

Today’s AgendaToday’s Agenda

Today’s AgendaToday’s Agenda
Where We Are TodayWhere We Are Today Historical PerspectiveHistorical Perspective Reasonable Expectations for the Reasonable Expectations for the
FutureFuture SummarySummary

HeadlinesHeadlines

Historical PerspectiveHistorical Perspective
Recession Year
Peak Unemployment
Trough of GDP change
Duration (months)
2001 6.4 -0.6% 8
1990 7.1 -1.2% 8
1981 10.8 -3.4% 16
1980 7.8 -2.4% 6
1973 9.0 -4.3% 16
Average 7.0 -2.3% 10.8

The The GreatGreat Recession Recession
Worst since the Great Depression.Worst since the Great Depression. Duration: 18 months (Dec 2007-Duration: 18 months (Dec 2007-
June 2009)June 2009) 7 months longer than average7 months longer than average
Peak Unemployment: 10.2%Peak Unemployment: 10.2% 3.2% worse than average3.2% worse than average
Trough GDP change: -4.1%Trough GDP change: -4.1% 1.8% worse than average1.8% worse than average


NY Times Headline

9
Great Recession vs. Great Depression
Great Depression
(1929 – 1933)
Great Recession(2007 –2009)
GDP Growth (%) -29% -4.2%Unemployment (%) 25% 10.2%
Inflation (%) -25% +2%
DJIA Change (%) -89% -54%
Bank Failures (#) 9,096(50% of total)
137(1% of total)

The Recession is over?

The Recession is over?
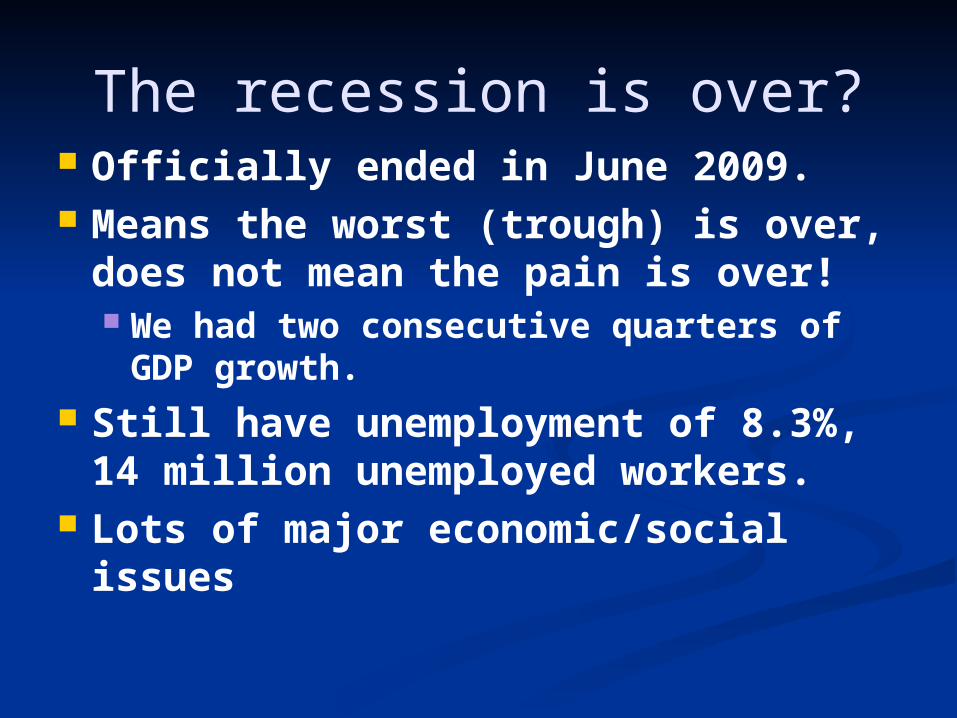
The recession is over? Officially ended in June 2009. Means the worst (trough) is over,
does not mean the pain is over! We had two consecutive quarters of
GDP growth. Still have unemployment of 8.3%,
14 million unemployed workers. Lots of major economic/social
issues

Total Private Total Private Employment – U.S.Employment – U.S.

Total Private Total Private Employment - OhioEmployment - Ohio

Employment - % ChangeEmployment - % Change

Unemployment Unemployment Ohio/NationalOhio/National

Unemployment Unemployment Youngstown/U.S.Youngstown/U.S.

Unemployment by level Unemployment by level of educationof education

How large is the output How large is the output gap?gap?

Jobless Recovery?Jobless Recovery?

ManufacturingManufacturing

ExportsExports
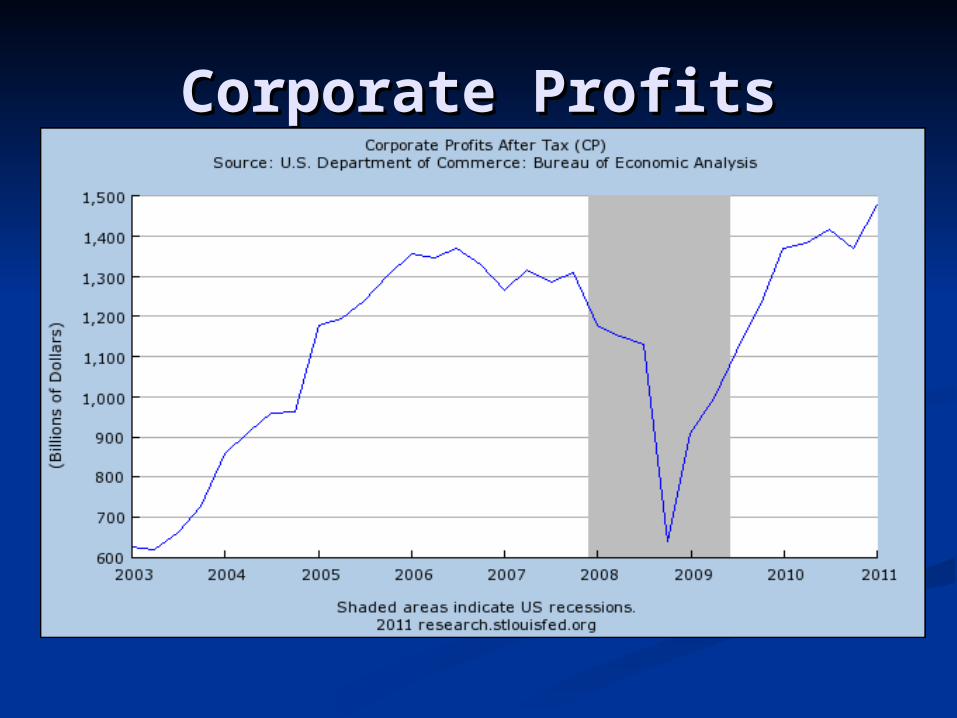
Corporate ProfitsCorporate Profits

Stock MarketStock Market

Encouraging Sign for the Encouraging Sign for the FutureFuture

What has not rebounded:What has not rebounded:Housing PricesHousing Prices

What has not rebounded:What has not rebounded:Construction SpendingConstruction Spending

What has not rebounded:What has not rebounded:Firm borrowingFirm borrowing

Household DebtHousehold Debt

Real WagesReal Wages

Productivity
Productivity Trend1947-1973
11
12
13
14
15
Me
an
Ye
ars
of E
duca
tion
100
150
200
250
Tota
l F
acto
r P
rod
uctivity
Year
Total Factor Productivity
Productivity
Productivity Trend1947-1973
11
12
13
14
15
Me
an
Ye
ars
of E
duca
tion
100
150
200
250
Tota
l F
acto
r P
rod
uctivity
Year
Total Factor Productivity
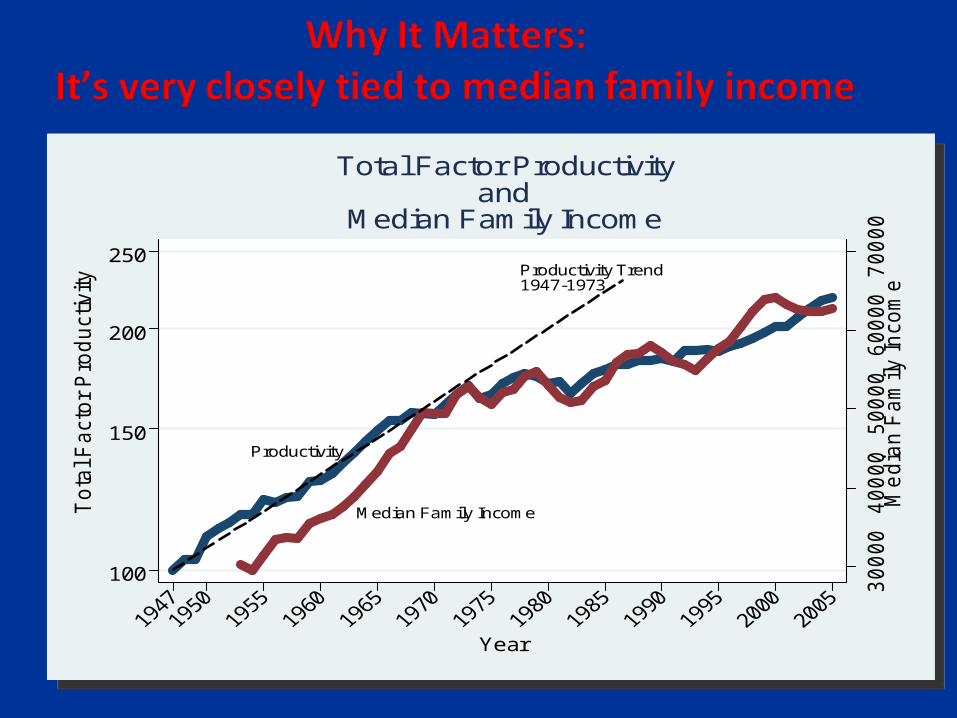
TFP–Measure of output changes not caused by observable inputs (labor and capital). Tells us how economy changes as a result of technology
Productivity
Median Family Income
Productivity Trend1947-1973
300
00
400
00
500
00
600
00
700
00
Me
dia
n F
am
ily In
com
e
100
150
200
250
Tota
l F
acto
r P
rod
uctivity
Year
Total Factor Productivityand
Median Family Income
Productivity
Median Family Income
Productivity Trend1947-1973
300
00
400
00
500
00
600
00
700
00
Me
dia
n F
am
ily In
com
e
100
150
200
250
Tota
l F
acto
r P
rod
uctivity
Year
Total Factor Productivityand
Median Family Income

Source: Bureau of Economic Analysis Federal Reserve Board, FOMC Minutes ,

Projections for the Projections for the future: Employmentfuture: Employment

Inflation ProjectionsInflation Projections

Good News for You!Good News for You!

SummarySummary Recovery is not as strong as we would like, but many Recovery is not as strong as we would like, but many
encouraging signs. encouraging signs. Leading indicators remain strong. Manufacturing, Exports, Leading indicators remain strong. Manufacturing, Exports,
and Investments have all grown substantially. Consumer and Investments have all grown substantially. Consumer debt has declined.debt has declined.
Inflation is not an issue.Inflation is not an issue. Projections for solid GDP Projections for solid GDP and and employment growth.employment growth.
Real GDP growth between 3-4%/yr., unemployment declines Real GDP growth between 3-4%/yr., unemployment declines between 1.5-2%/yr.between 1.5-2%/yr.
Recoveries take time (especially after a financial crisis).Recoveries take time (especially after a financial crisis). This recovery is stronger than previous (2003) recovery This recovery is stronger than previous (2003) recovery
If history is a guide, the growth during the recovery If history is a guide, the growth during the recovery will be greater than the decline during the Recession.will be greater than the decline during the Recession.

LEST WE FORGET THE LEST WE FORGET THE TREND!TREND!
U.S. Per Capita Income past U.S. Per Capita Income past 100 years100 years

World GDPPer Capita
100
1000
2000
4000
6000W
orld
GD
P P
er
Cap
ita
-100
0000
-100
00
-100
0 150
010
0015
0017
5018
0018
5019
0019
5020
00
YearNote: GDP per capita shown on ratio scale. Time axis is not to scale.Source: World GDP Per Capita from Bradford DeLong (1998).
World GDP Per Capita is Increasing