Today w Shifts in MC, ATC, and AVC curves. w Production and cost in the long run.
30
Today Shifts in MC, ATC, and AVC curves. Production and cost in the long run.
-
Upload
myron-sydney-davidson -
Category
Documents
-
view
220 -
download
1
Transcript of Today w Shifts in MC, ATC, and AVC curves. w Production and cost in the long run.

Today
Shifts in MC, ATC, and AVC curves. Production and cost in the long run.

Shifting the Short Run Cost Curves of the Firm They shift when:
• The price of an input changes.• There is a change in the level of the fixed
inputs (a change in plant size).• There is a change in the state of technology
(meaning know-how).

Example: Wages rise
Q
$/Q MC
ATCATC’
MC’
Variable costs rise at all levels of output. MC shifts up. ATC shifts up. AVC (not shown) shifts up.

Improvements in Technology
Q
$/QMC
ATC
ATC’
MC’
Improvements in technology lead to lower costs. (Could save only fixed costs, but usually MC will fall.)

Different Plant Sizes
Changing the short-run situation of the firm is best studied in the context of production and costs in the long-run.

Production and Costin the Long Run

Long Run
The firm’s planning horizon in which it can choose any combination of inputs. It is not locked into past decisions in its plans for the long run.
Firms can “lock-in” to any short-run situation in the long run.

Choice of Inputs
Goods can be produced using many different combinations of inputs.• Examples: cleaning, building a house
How does a firm decide which to use?• Look at range of available production
techniques for a given level of output.• Calculate which costs least, given particular
input prices.

Plant size
Small plants achieve their lowest average total cost at a low level of output.
Large plants achieve their lowest average total cost at a high level of output.
In the SR, a firm is stuck with its current plant size.
In the LR, a firm may choose any plant size (then it will be stuck at that one for future SR scenarios).

Average Costs for Various Plant Sizes
q
$/Q SRAC0SRACSRAC11
SRAC2
SRAC3
SRAC4
In the SR, this firm is using plant size 1. In the LR it could choose any of these plant sizes.

ATC in the SR and the LR
q
$/Q SRAC0SRACSRAC11
SRAC2
SRAC3
SRAC4
In the SR, what is its AC of producing qA? qB?
In the LR, what is its AC of producing qA? qB?
qA qB
a
b
c
d
e
f

Long Run Average Cost
For any level of output, in the long run the firm will choose the plant size that gives the lowest possible average cost.
At every q, LRAC SRAC. (why?) The LRAC curve is thus the lower envelope
of the SRAC curves.
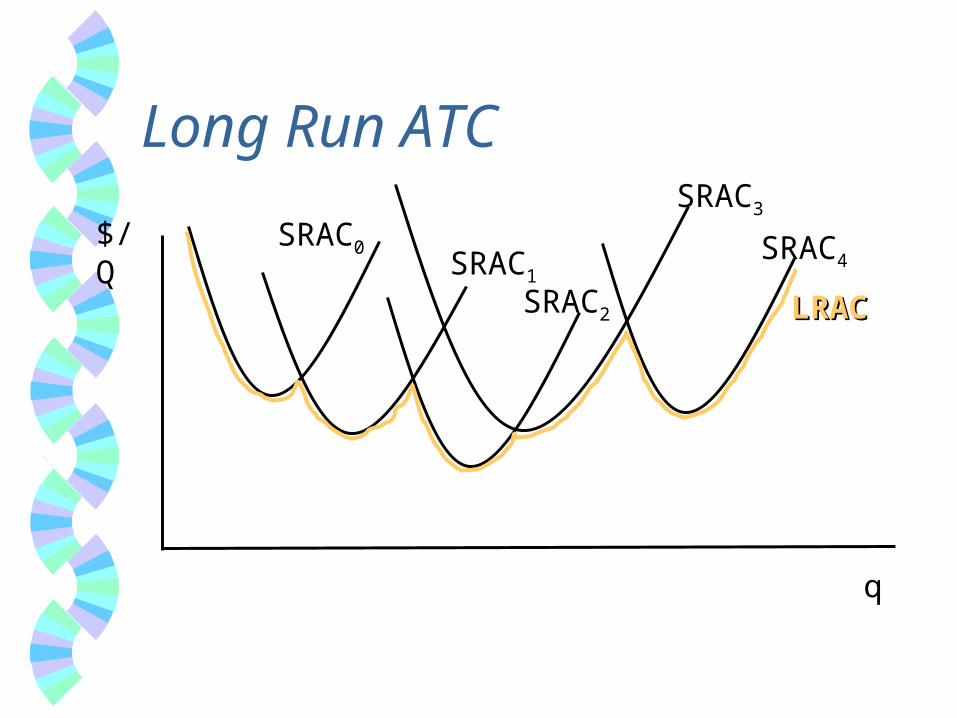
Long Run ATC
q
$/Q SRAC0SRAC1
SRAC2
SRAC3
SRAC4
LRACLRAC

With an Infinite Variety of Plant Sizes
q
$/Q
LRACLRAC

Economies of Scale
How do you make cars differently if you plan to produce 100 cars per year
compared to 500,000?

Very Small Auto Plants
Assembly line too costly, uses too much K. Use proportionately more labor Keep fixed costs low

Large Auto Plant
Assembly line, lots of machines and automation.
High fixed costs, but spread over lots of units.
The large plant can get the lowest average cost if it produces enough units.

Economies of Scale, Continued
There are Economies of Scale when the LRAC of making a good falls as output grows.
If you double output, total cost increases by less than double, average cost falls.
OR—If you double all inputs, you get more than double the output.
Also called Increasing Returns to Scale. Downward-sloping portion of LRAC curve.

Examples of EOS
Almost all products have EOS at low levels of output. Which ones have EOS even at large levels of output?• Auto manufacturing
• Coal mining
• Electricity generation & distribution
• Retailing? (Wal-Mart)
If small firms cannot compete against big ones, probably economies of scale are at work.

Constant Returns to Scale
You can produce, say, 20% more and your costs go up 20%.
LRAC stays the same Sometimes called constant costs. Horizontal LRAC You should see firms of different sizes in
the market.

Diseconomies of scale
Expanding output by 20% will increase costs by, say, 25%.
LRAC is rising. Also called Decreasing Returns to Scale or
increasing costs. Intuition: The firm is so large it is inefficient. Firms this big will go out of business or scale
down.

The Saucer-Shaped LRAC curve
q
$/q
q0 q1
Between 0 and q0: Economies of Scale Between q0 & q1: Constant returns to scaleBetween q1 and : Diseconomies of Scale
LRAC

Be Sure to Know the Difference Between: Decreasing Returns to Scale: increasing all
inputs by an equal % results in increasing average costs, and
Diminishing Marginal Returns: holding one or more important factors constant, increasing the other factors by equal increments will eventually result in decreasing MP (increasing MC).

Shifting LRAC
LRAC will shift any time there is• a change in input prices• a change in technology (know-how)
Does the LRAC curve shift when plant size changes?

Example: Wages fall
q
$/q
Why would we expect the downward shift will not be parallel?
LRAC
LRAC’LRAC’

Coming Up
Begin study of profit maximization in the context of perfect competition.

Group Work
Apply economies of scale to movie theaters.

More Screens
The average number of movie screens per cinema has increased over the last several years. This seems to suggest there are increasing returns to scale: that increasing the number of screens at each location leads to a lower average cost.

Increasing Returns to Scale at the Cinema List several reasons why a firm’s average
costs would fall as the number of screens at the same location rises.
Hint:• Comparing a cinema with 1 screen to one with
2 screens, are all costs doubled?

Decreasing Returns to Scale at the Cinema? Even though the average number of screens
per cinema has been rising, cinemas rarely have 20 or 30 screens each, even in highly populated, urban areas. This seems to be evidence that the LRAC for a cinema eventually turns upward.
List some reasons why a cinema would have difficulty it were to grow that large.