Today Continue demand –shifts in demand Supply. Recall: The Demand Curve What is measured on each...
37
Today • Continue demand – shifts in demand • Supply
-
date post
20-Dec-2015 -
Category
Documents
-
view
216 -
download
0
Transcript of Today Continue demand –shifts in demand Supply. Recall: The Demand Curve What is measured on each...
Today
• Continue demand– shifts in demand
• Supply

Recall: The Demand Curve
• What is measured on each axis?4
3
2
1
00 100 200 300 400
D

Shifts in Demand
• A Change in Average Household Income
• A Change in the Price of Another Good
• A Change in Tastes or Preferences
• A Change in Consumer Expectations
• A Change in Demographics

A Change in Average Household Income
• The usual case:– An increase in income increases demand– A decrease in income decreases demand– Called a “normal good”– People tend to buy more of most things as they
get richer.
Inferior Goods
• The odd case:– An increase in income decreases demand– A decrease in income increases demand– Called an “inferior good”– Ex: rice, beans, potatoes, riding buses, using a
laundromat, eating hamburger

A Change in the Price of Another Good
• 2 types of relevant goods: substitutes and complements.
• Substitute goods: goods one might use instead of cheese.– When the price of the substitute rises, there will
be an increase in demand for cheese.

Complements
• Complementary goods: goods one tends to use along with cheese.– When the price of the complement rises, there
will be an decrease in demand for cheese.

A Change in Tastes or Preferences
• If consumers like cheese more than before, then demand for cheese will increase.
• If consumers like cheese less than before, then demand for cheese will fall.

A Change in Consumer Expectations
• Expectations about price: – If expect the price will rise, buy more now,
demand rises.– If expect the price will fall, wait to buy, current
demand falls.
• Expectations about income:– If expect income to rise, demand may rise.– If expect income to fall, demand may fall.

A Change in Demographics
• Increased population in Richmond will increase demand for cheese.
• Other demographics, age, #children, ethnic groups, etc.
The Supply of Cheese
• Quantity Supplied: The number of pounds of cheese that sellers are willing & able to sell each week in Richmond at a given price.
• Supply: The various amounts of cheese that sellers are willing & able to sell each week in Richmond at all possible prices.

Determinants of Quantity Supplied
• Price of cheese
• Prices of factors of production (inputs)
• Technology
• Price of other goods produced using a similar technology
• Expected future prices
• The number of sellers
The Supply Curve
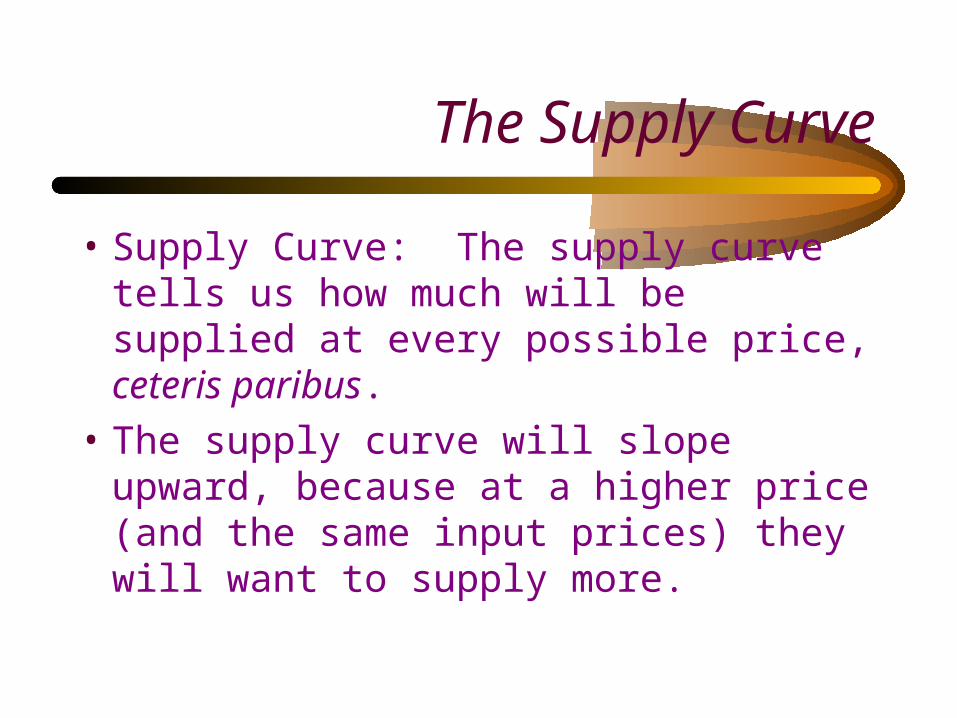
• Supply Curve: The supply curve tells us how much will be supplied at every possible price, ceteris paribus.
• The supply curve will slope upward, because at a higher price (and the same input prices) they will want to supply more.

The Supply Curve
• Only P changes as we move along this supply curve.
Quantity(lb.per week)
Price($/lb.)
4
3
2
1
00 100 200 300 400
S

Moving Along the Supply Curve
• Changes in the price of cheese move us along the supply curve for cheese.
• Called a “change the quantity supplied”.

Shifts in Supply
• Changes in other factors affecting supply will shift the supply curve.
• Called a “change in the supply of cheese”.

Increase in Supply
• The quantity supplied QS is higher at every possible price.
• Shifts rightward.
Price($/lb.)
4
3
2
1
00 100 200 300 400
SS’
Quantity(lb.per week)

Decrease in Supply
• The QS is lower at every possible price.
• Shifts leftward.
Price($/lb.)
4
3
2
1
00 100 200 300 400
SS’
Quantity(lb.per week)

Shifts in Supply
• A change in the price of a factor of production
• A change in technology
• A change in the price of other goods produced using a similar technology
• A change in expected future prices
• A change in the number of sellers

Factor Prices
• Examples of factor (or input) prices: – labor wages – capital interest rate– land rent– energy price of oil, electricity, etc. – raw materials price of the raw material

A change factor prices
• When a factor price rises, supply decreases (shifts left). – Higher factor prices make costs rise. At a
given price, it will be less profitable to produce, so firms supply less.
• When a factor price falls, supply increases (shifts right).

A change in technology
• Improvements in technology increase supply (shift right)
• Better technology makes it more profitable to produce at a given price, so supply more.

A change in the price of other goods
• Refers to goods produced using similar production techniques.
• Ex: garden hoses & hula hoops
• Ex: autos & jeeps
• Ex: yogurt & cheese
• When the price of one of these goods rises, the supply of the other will fall.

A change in expected future prices
• Could increase or decrease supply.
• Expect price to rise, might build factory now, increasing current supply.
• For storable goods, expect price to rise, might delay selling good, decreasing current supply.

A change in the number of sellers
• A larger number of sellers will increase supply.
• A smaller number will decrease supply.

Coming Up
• Market Equilibrium
• How changes in demand and supply affect market equilibrium.

Group Work
• Exercises with supply
• Exercises with demand

Exercises with Supply
• Draw a properly labeled supply curve and show either a movement along the supply curve, or a shift in the curve for each change.
• Do not try to combine these exercises with the previous demand ones.

Supply of Beef
• The price of cattle feed rises.

Supply of Tomatoes
• A new, square variety is invented which allows for easier shipment to market.
• (Fits onto a Wendy’s burger better, too.)

Supply of Cabernet Sauvignon
• The price of merlot (another variety) rises as Americans discover this slightly sweet table wine.

Supply of Toilet Paper
• Falling profits in the TP industry lead firms to exit the market.

Exercises with Demand
• Draw a properly labeled demand curve and show either a movement along the demand curve, or a shift in the curve for each change.

Demand for Meat
• Dr. Atkin’s diet book, proclaiming weight loss through high protein, low carb diet, becomes wildly popular.

Demand for Tomatoes
• Summer abundance leads to a fall in the price of this popular vegetable.

Demand for Cabernet Sauvignon (Red Wine)
• The price of cheese rises.

Demand for Toilet Paper
• A rumor circulates that stores are about to run out of toilet paper—panic ensues.