Tobias Adrian and Markus K. Brunnermeier · 1. Externalities “stability is a public good” 1....
34
Tobias Adrian and Markus K. Brunnermeier 1
Transcript of Tobias Adrian and Markus K. Brunnermeier · 1. Externalities “stability is a public good” 1....
Tobias Adrian and Markus K. Brunnermeier
1
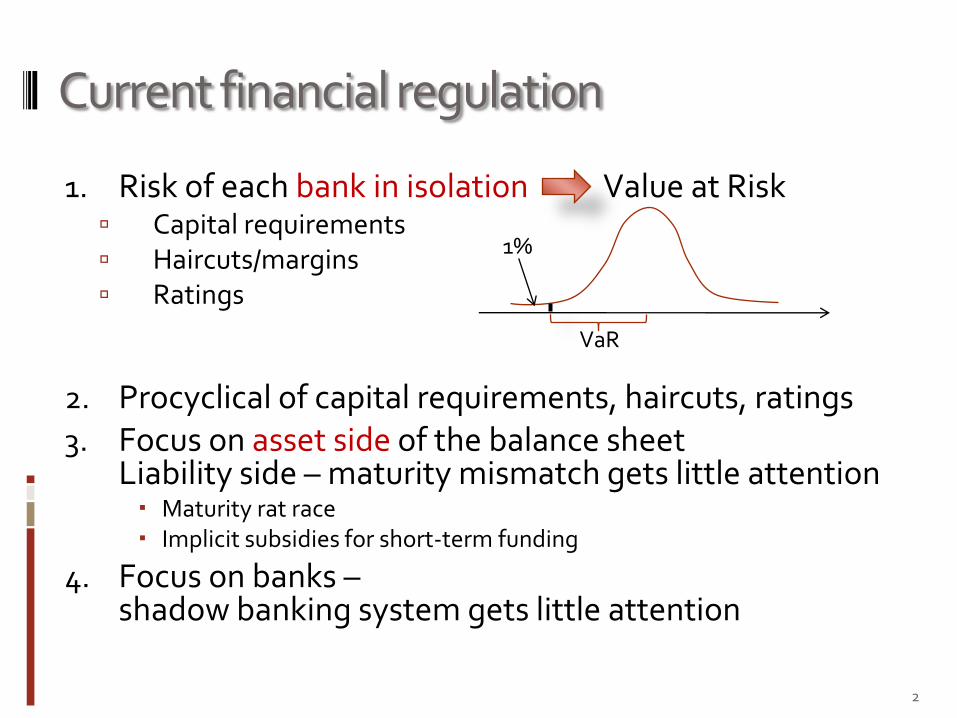
Current financial regulation
1. Risk of each bank in isolation Value at Risk Capital requirements Haircuts/margins Ratings
2. Procyclical of capital requirements, haircuts, ratings3. Focus on asset side of the balance sheet
Liability side – maturity mismatch gets little attention Maturity rat race Implicit subsidies for short-term funding
4. Focus on banks –shadow banking system gets little attention
2
VaR
1%
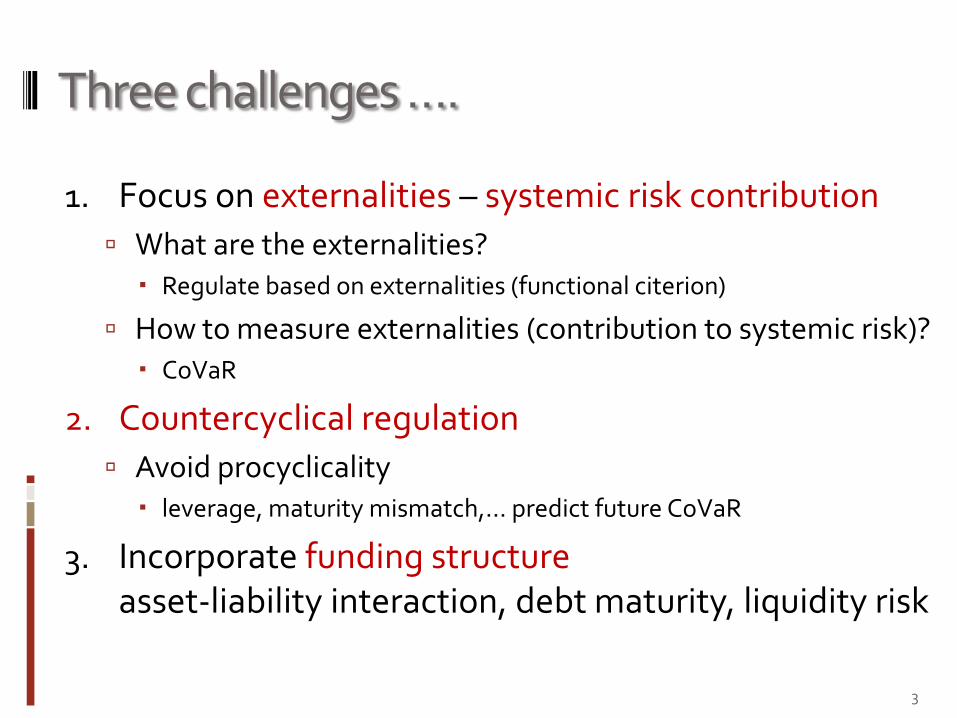
Three challenges ….
1. Focus on externalities – systemic risk contribution
What are the externalities? Regulate based on externalities (functional citerion)
How to measure externalities (contribution to systemic risk)? CoVaR
2. Countercyclical regulation
Avoid procyclicality leverage, maturity mismatch,… predict future CoVaR
3. Incorporate funding structureasset-liability interaction, debt maturity, liquidity risk
3
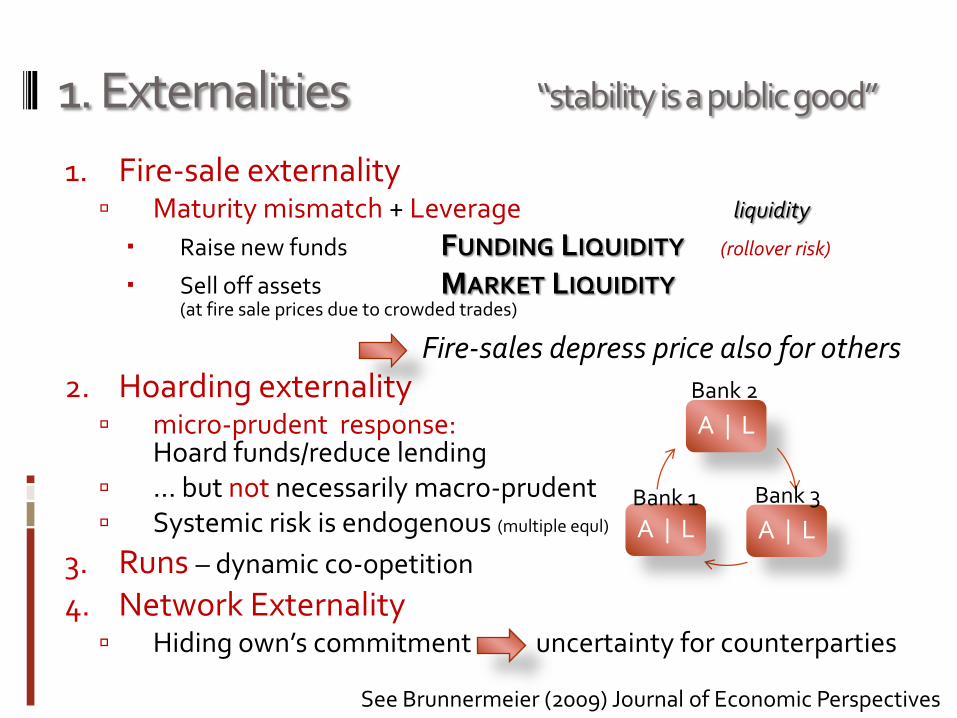
1. Externalities “stability is a public good”
1. Fire-sale externality Maturity mismatch + Leverage liquidity
Raise new funds FUNDING LIQUIDITY (rollover risk)
Sell off assets MARKET LIQUIDITY(at fire sale prices due to crowded trades)
2. Hoarding externality micro-prudent response:
Hoard funds/reduce lending … but not necessarily macro-prudent Systemic risk is endogenous (multiple equl)
3. Runs – dynamic co-opetition
4. Network Externality Hiding own’s commitment uncertainty for counterparties
1. Fire-sales depress price also for others
A | L
A | LA | L
Bank 2
Bank 3Bank 1
See Brunnermeier (2009) Journal of Economic Perspectives
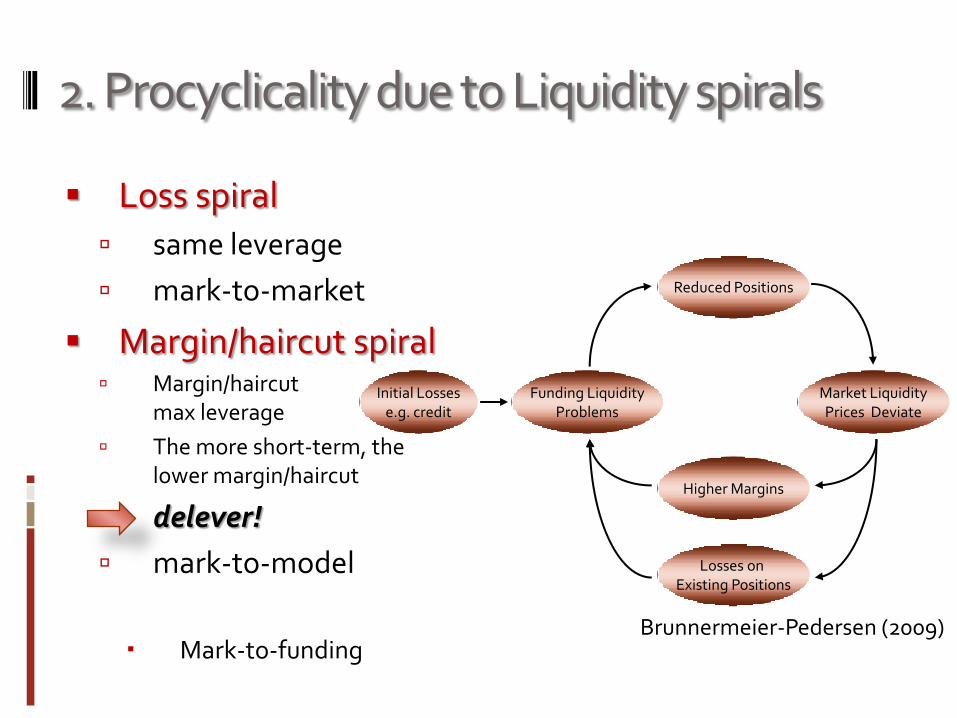
2. Procyclicality due to Liquidity spirals
Loss spiral
same leverage
mark-to-market
Margin/haircut spiral Margin/haircut
max leverage
The more short-term, the lower margin/haircut
delever!
mark-to-model
Mark-to-funding
Reduced Positions
Higher Margins
Market LiquidityPrices Deviate
Funding LiquidityProblems
Losses on Existing Positions
Initial Lossese.g. credit
Brunnermeier-Pedersen (2009)
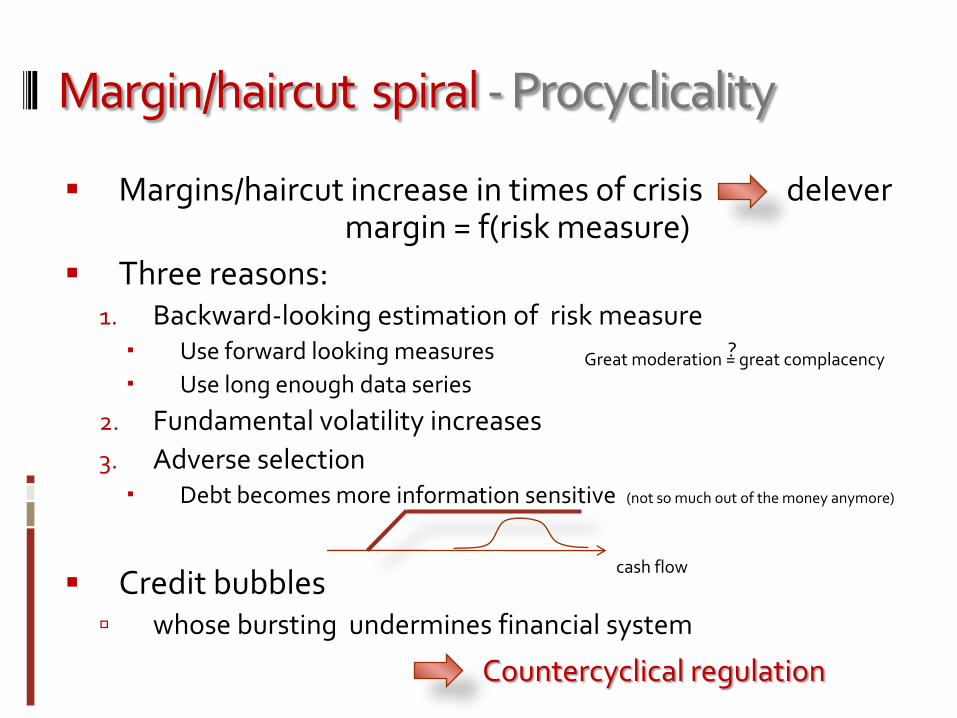
Margin/haircut spiral - Procyclicality
Margins/haircut increase in times of crisis delevermargin = f(risk measure)
Three reasons:1. Backward-looking estimation of risk measure Use forward looking measures
Use long enough data series
2. Fundamental volatility increases
3. Adverse selection Debt becomes more information sensitive (not so much out of the money anymore)
Credit bubbles whose bursting undermines financial system
Countercyclical regulation
cash flow
Great moderation = great complacency?

Margin/haircut spiral - Procyclicality
Margins/haircut increase in times of crisis delevermargin = f(risk measure)
Three reasons:1. Backward-looking estimation of risk measure Use forward looking measures
Use long enough data series
2. Fundamental volatility increases
3. Adverse selection Debt becomes more information sensitive (not so much out of the money anymore)
Credit bubbles whose bursting undermines financial system
Countercyclical regulation
cash flow
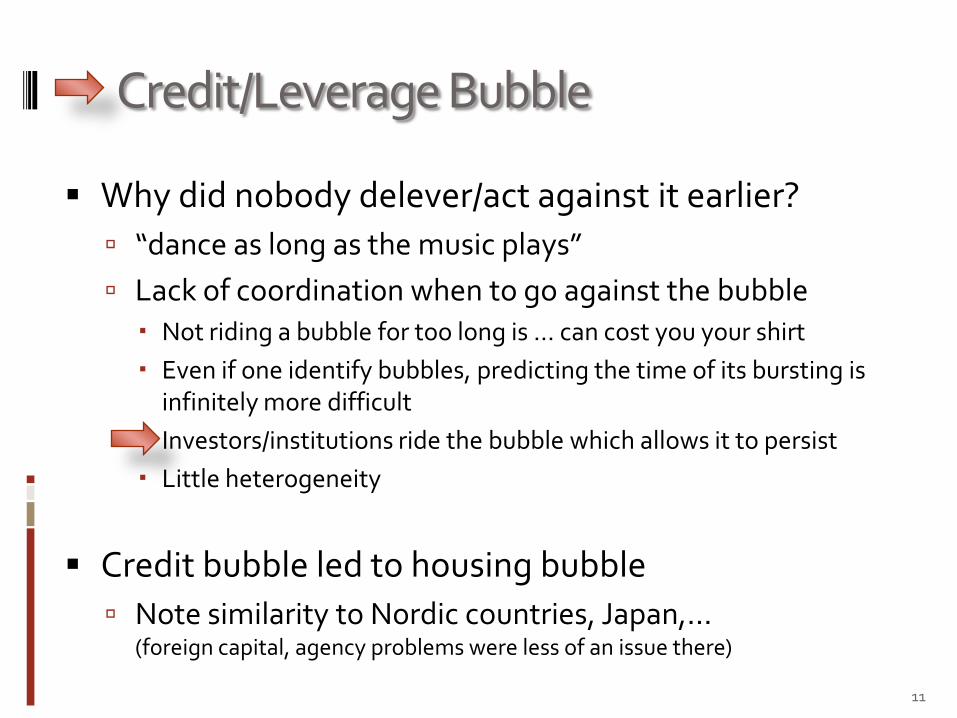
Credit/Leverage Bubble
Why did nobody delever/act against it earlier?
“dance as long as the music plays”
Lack of coordination when to go against the bubble Not riding a bubble for too long is … can cost you your shirt
Even if one identify bubbles, predicting the time of its bursting is infinitely more difficult
Investors/institutions ride the bubble which allows it to persist
Little heterogeneity
Credit bubble led to housing bubble
Note similarity to Nordic countries, Japan,…(foreign capital, agency problems were less of an issue there)
11
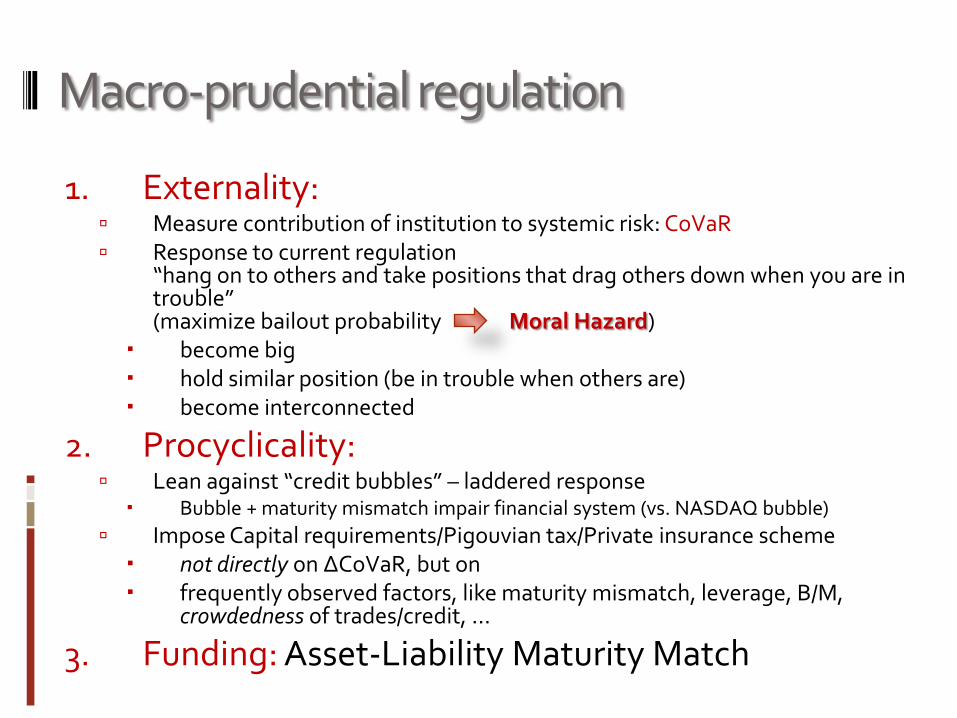
1. Externality: Measure contribution of institution to systemic risk: CoVaR Response to current regulation
“hang on to others and take positions that drag others down when you are in trouble” (maximize bailout probability Moral Hazard)
become big hold similar position (be in trouble when others are) become interconnected
2. Procyclicality: Lean against “credit bubbles” – laddered response Bubble + maturity mismatch impair financial system (vs. NASDAQ bubble)
Impose Capital requirements/Pigouvian tax/Private insurance scheme not directly on ∆CoVaR, but on frequently observed factors, like maturity mismatch, leverage, B/M,
crowdedness of trades/credit, …
3. Funding: Asset-Liability Maturity Match
Macro-prudential regulation
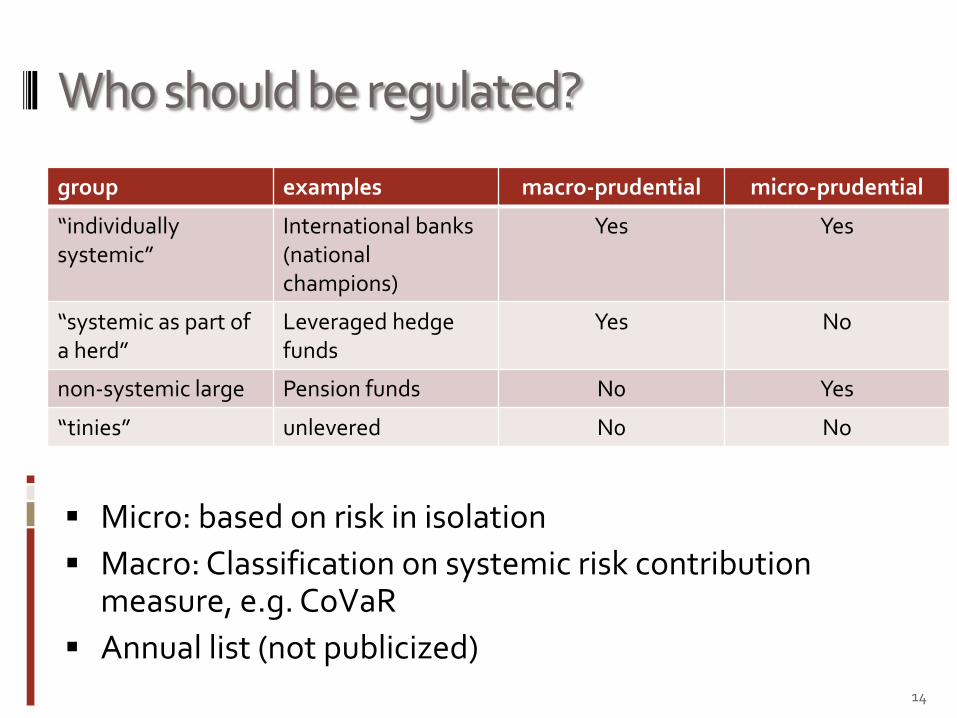
Who should be regulated?
Micro: based on risk in isolation
Macro: Classification on systemic risk contribution measure, e.g. CoVaR
Annual list (not publicized)14
group examples macro-prudential micro-prudential
“individually systemic”
International banks(national champions)
Yes Yes
“systemic as part of a herd”
Leveraged hedge funds
Yes No
non-systemic large Pension funds N0 Yes
“tinies” unlevered N0 No
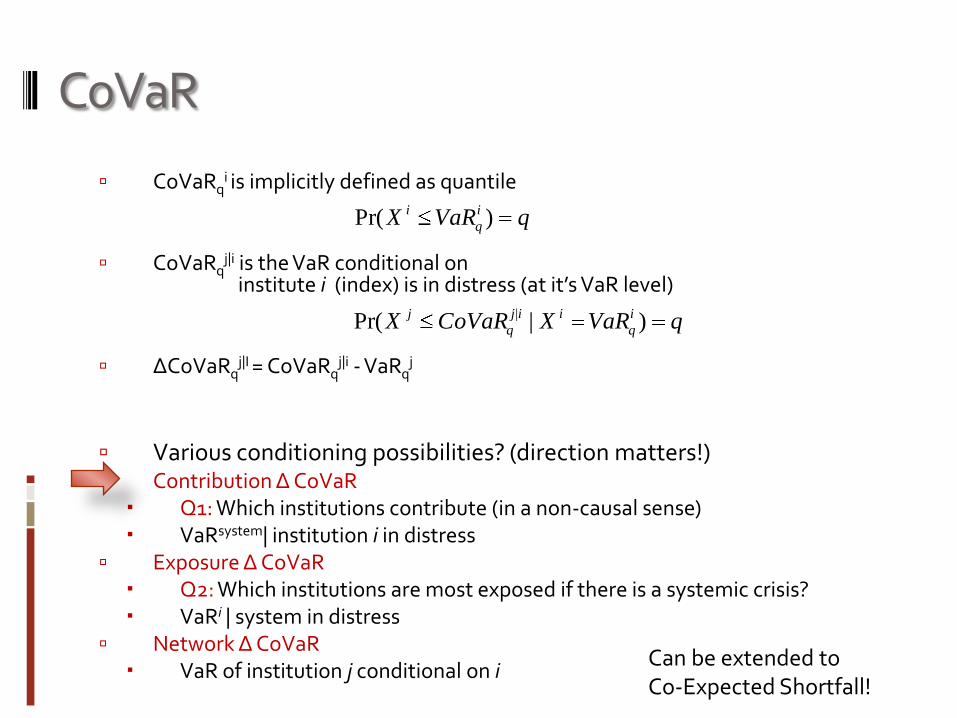
CoVaR
CoVaRqi is implicitly defined as quantile
CoVaRqj|i is the VaR conditional on
institute i (index) is in distress (at it’s VaR level)
ΔCoVaRqj|I = CoVaRq
j|i - VaRqj
Various conditioning possibilities? (direction matters!) Contribution Δ CoVaR Q1: Which institutions contribute (in a non-causal sense) VaRsystem| institution i in distress
Exposure Δ CoVaR Q2: Which institutions are most exposed if there is a systemic crisis? VaRi | system in distress
Network Δ CoVaR VaR of institution j conditional on i
qVaRX i
q
i )Pr(
qVaRXCoVaRX i
q
iij
q
j )|Pr( |
Can be extended to Co-Expected Shortfall!
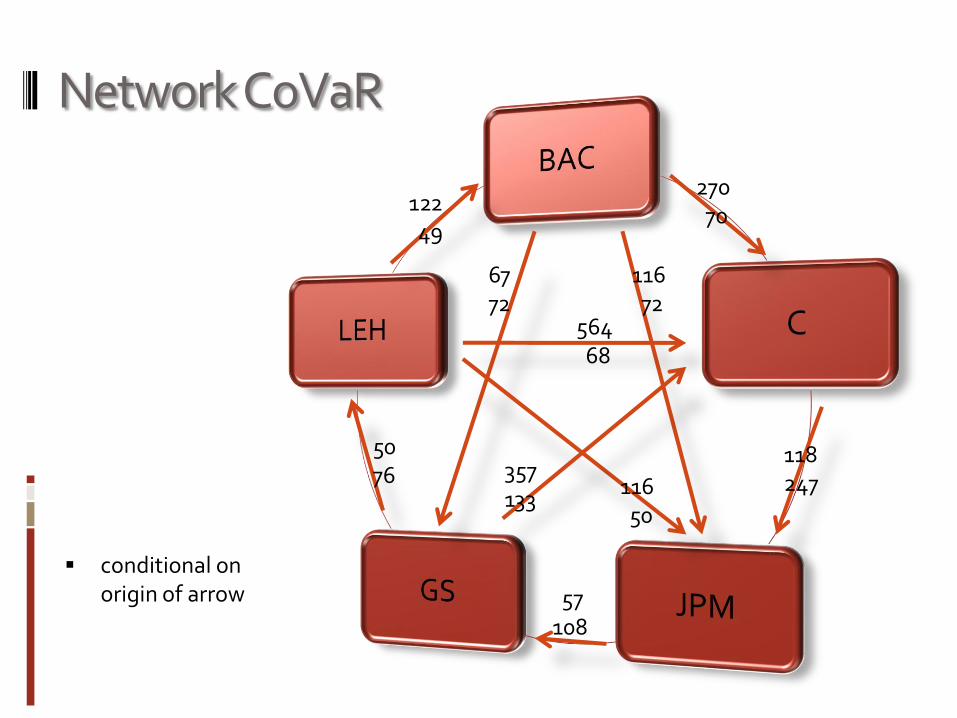
Network CoVaR
conditional onorigin of arrow
27070
118247
57108
11650
357133
11672
6772
12249
5076
56468
Overview
Challanges
Measuring Systemic Risk Spillover/Externalities
One Method: Quantile Regressions
CoVaR vs. VaR
Addressing Procyclicality
Predict using institutions’ characteristics Balance sheet variables
Market variables (CDS, implied vol.,…)
18
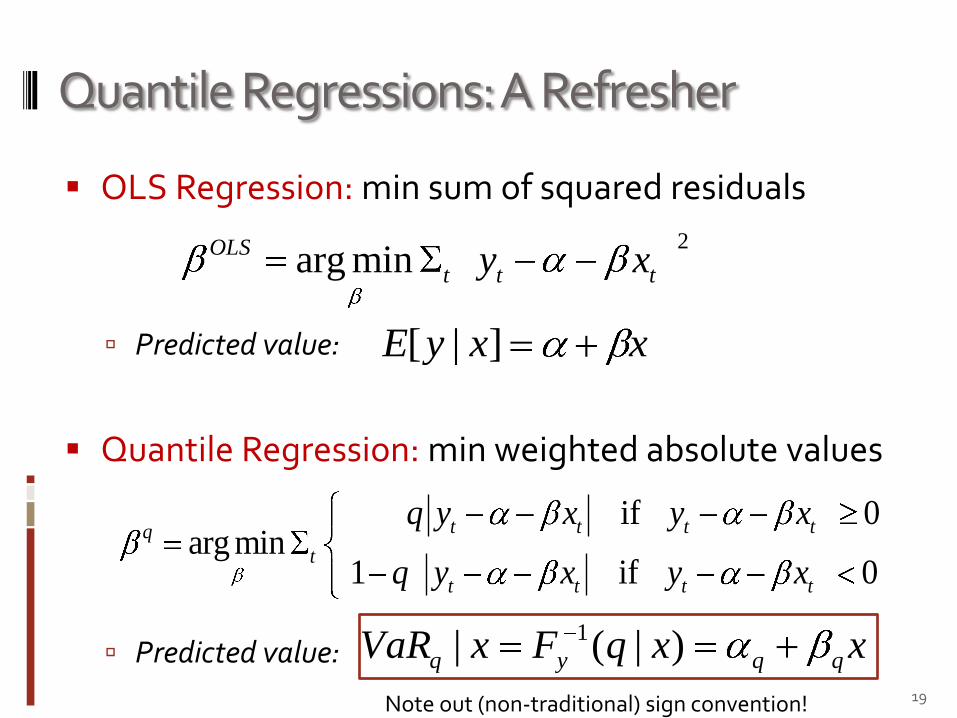
Quantile Regressions: A Refresher
OLS Regression: min sum of squared residuals
Predicted value:
Quantile Regression: min weighted absolute values
Predicted value:19
2arg minOLS
t t ty x
if 0arg min
1 if 0
t t t tq
t
t t t t
q y x y x
q y x y x
xxqFxVaR qqyq )|(| 1
xxyE ]|[
Note out (non-traditional) sign convention!
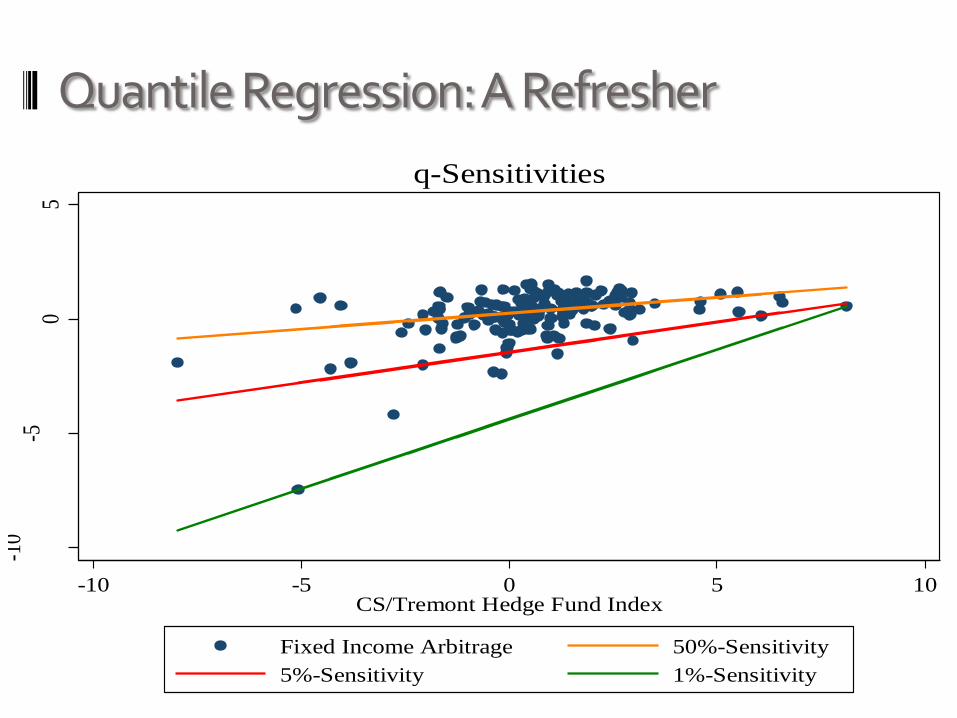
Quantile Regression: A Refresher
20
-10
-50
5
-10 -5 0 5 10CS/Tremont Hedge Fund Index
Fixed Income Arbitrage 50%-Sensitivity
5%-Sensitivity 1%-Sensitivity
q-Sensitivities
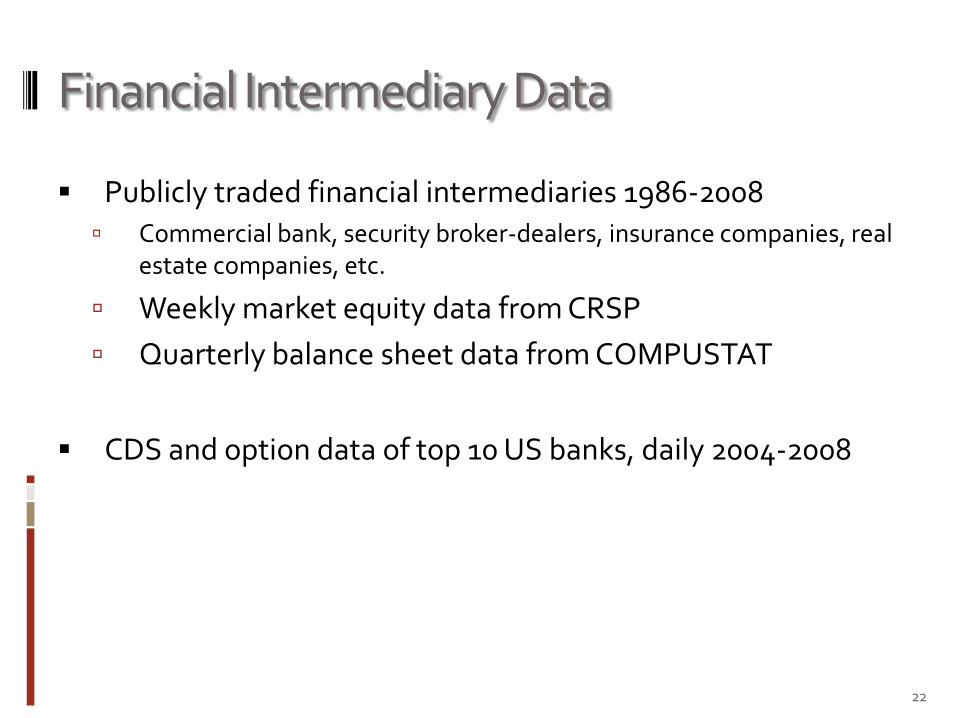
Financial Intermediary Data
Publicly traded financial intermediaries 1986-2008 Commercial bank, security broker-dealers, insurance companies, real
estate companies, etc.
Weekly market equity data from CRSP
Quarterly balance sheet data from COMPUSTAT
CDS and option data of top 10 US banks, daily 2004-2008
22
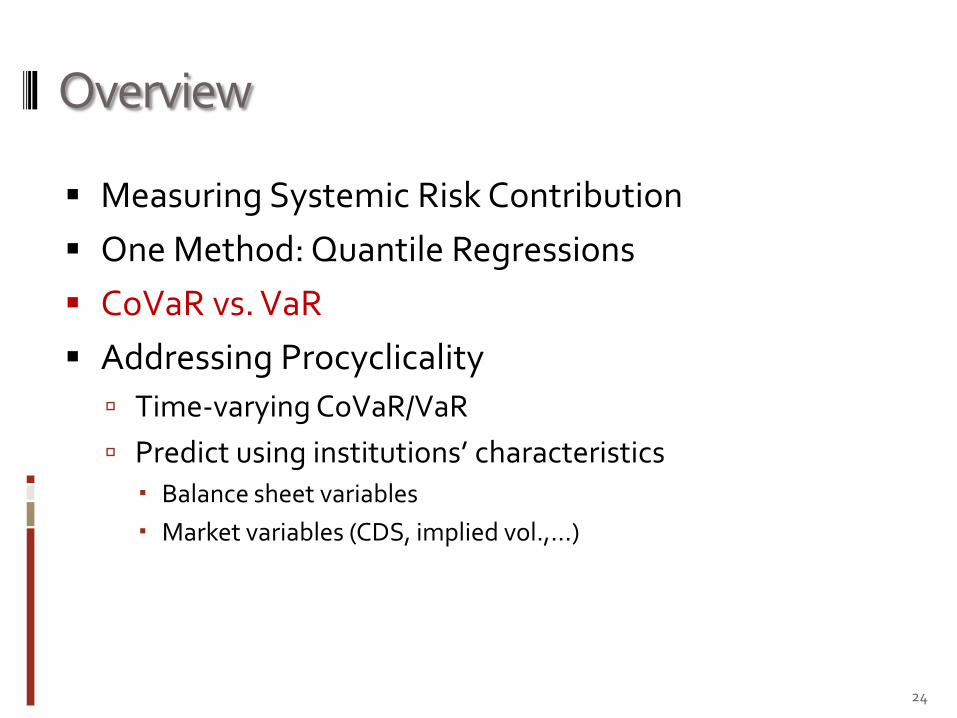
Overview
Measuring Systemic Risk Contribution
One Method: Quantile Regressions
CoVaR vs. VaR
Addressing Procyclicality
Time-varying CoVaR/VaR
Predict using institutions’ characteristics Balance sheet variables
Market variables (CDS, implied vol.,…)
24
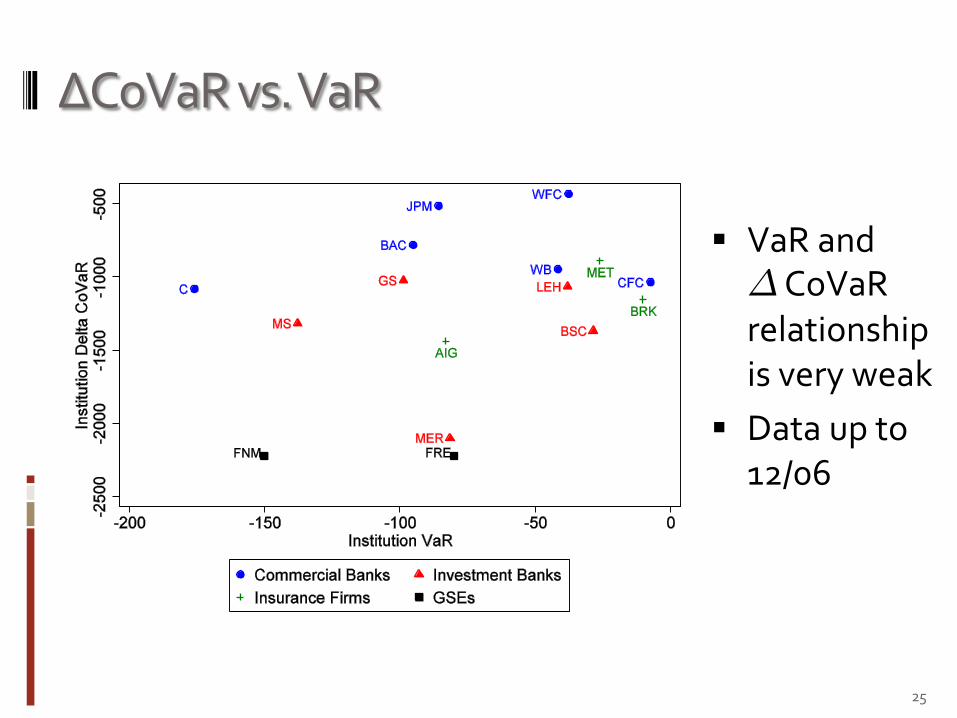
ΔCoVaR vs. VaR
VaR and ¢CoVaRrelationship is very weak
Data up to 12/06
25
Overview
Challanges
Measuring Systemic Risk Contribution
One Method: Quantile Regressions
CoVaR vs. VaR
Addressing Procyclicality
Step 1: Time-varying CoVaRs
Step 2: Predict CoVaR using institution characteristics Balance sheet variables
(leverage, maturity mismatch, + interdependence, …)
Market variables (CDS, implied vol.,…)
28
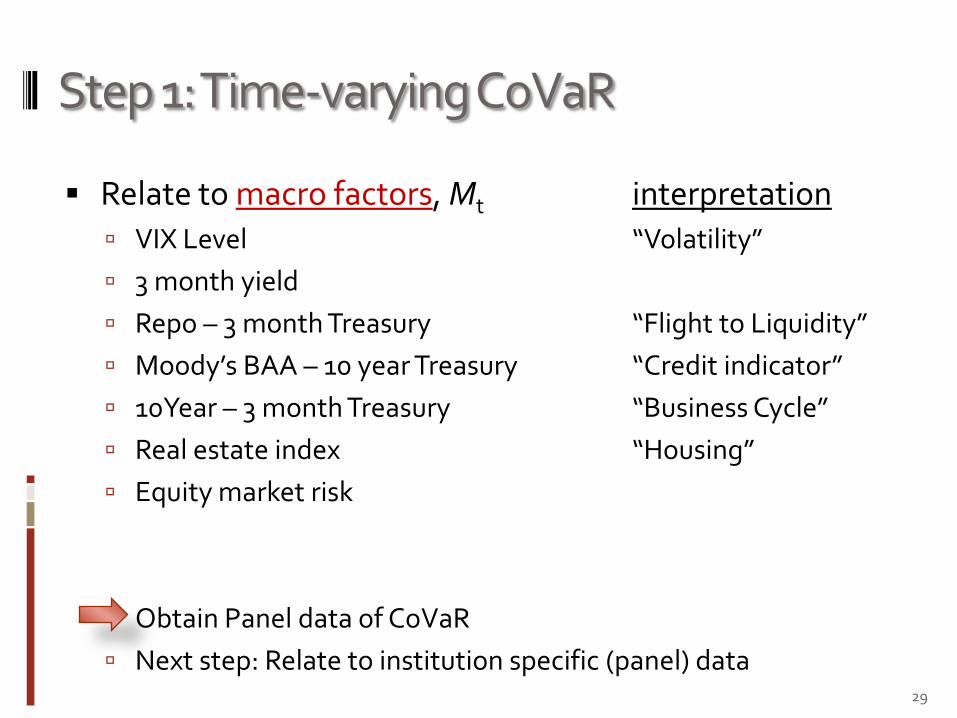
Step 1: Time-varying CoVaR
Relate to macro factors, Mt interpretation
VIX Level “Volatility”
3 month yield
Repo – 3 month Treasury “Flight to Liquidity”
Moody’s BAA – 10 year Treasury “Credit indicator”
10Year – 3 month Treasury “Business Cycle”
Real estate index “Housing”
Equity market risk
Obtain Panel data of CoVaR
Next step: Relate to institution specific (panel) data29
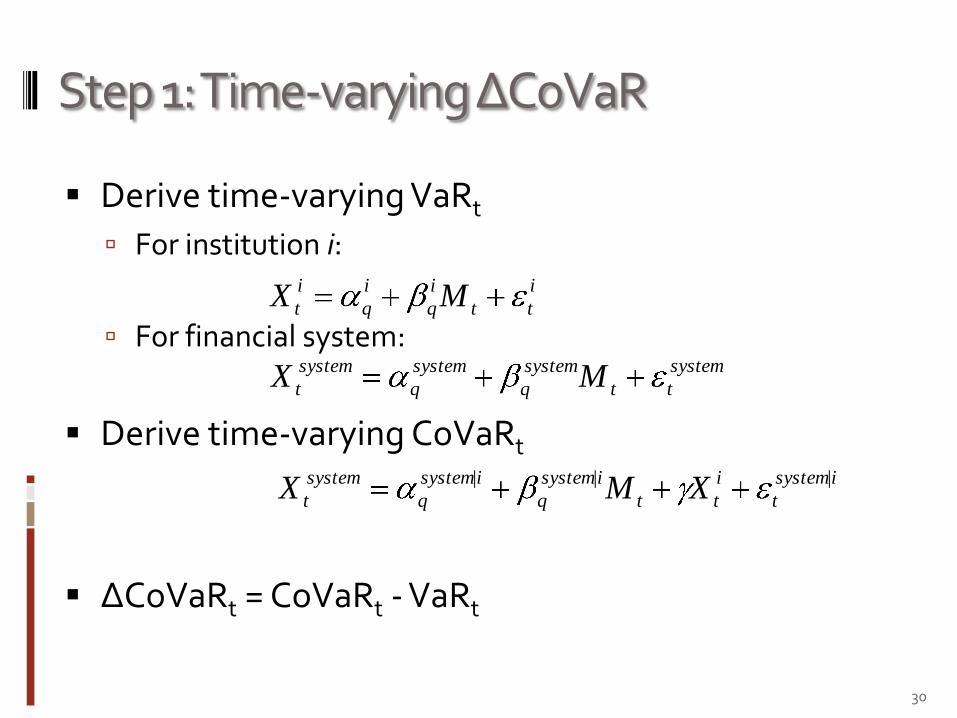
Step 1: Time-varying ΔCoVaR
Derive time-varying VaRt
For institution i:
For financial system:
Derive time-varying CoVaRt
ΔCoVaRt = CoVaRt - VaRt
30
i
tt
i
q
i
q
i
t MX
system
tt
system
q
system
q
system
t MX
isystem
t
i
tt
isystem
q
isystem
q
system
t XMX |||

Table 2: Average Exposures to Risk Factors
31
INSTITUTIONS
COEFFICIENT VaRsystem VaRi CoVaRsystem|i
Repo spread (lag) -1163*** -0.60 -877.94***
Credit spread (lag) -107.75 -0.47 -226.75**
Term spread (lag) 128.71 0.64 18.80
VIX (lag) -68.97*** -0.16*** -43.35***
3 Month Yield (lag) 118.73 0.42 15.95*
Market Return (lag) 242.74*** 0.50*** 196.00***
Housing (lag) 5.63 0.03 5.17
*** p< 0.01
** p< 0.05
* p< 0.1
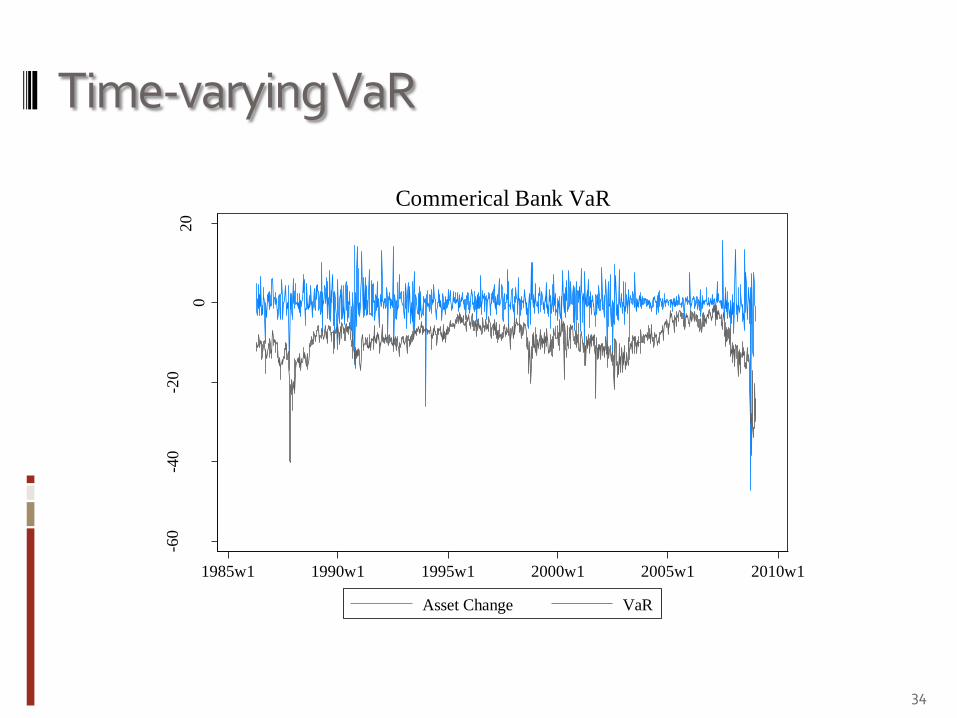
Time-varying VaR
-60
-40
-20
02
0
Ass
et C
han
ge,
VaR
1985w1 1990w1 1995w1 2000w1 2005w1 2010w1
Asset Change VaR
Commerical Bank VaR
34
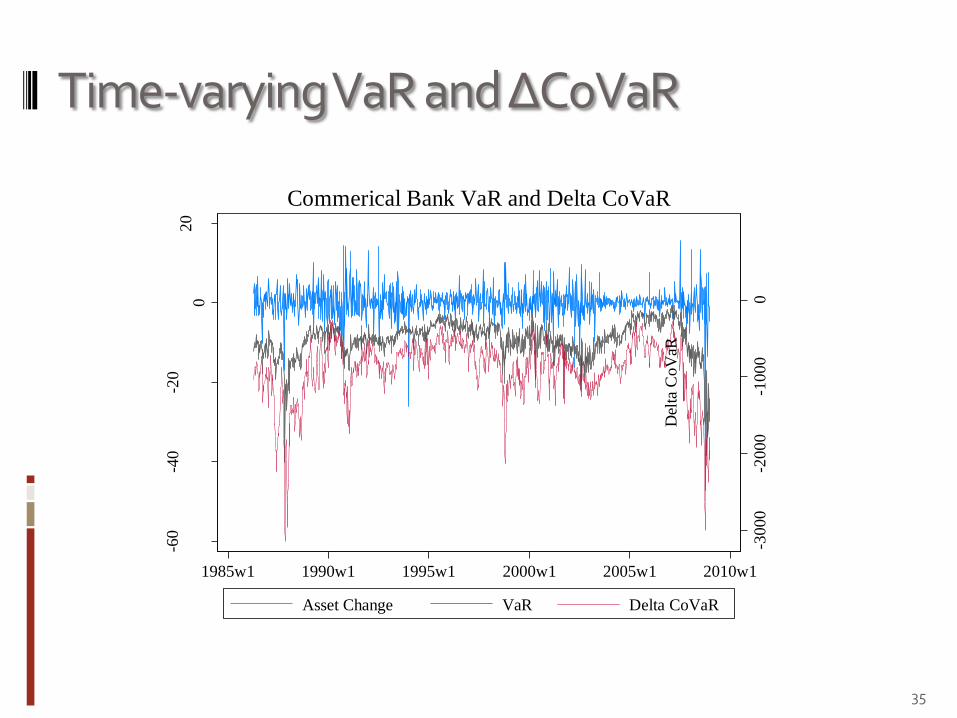
Time-varying VaR and ΔCoVaR
-3000
-2000
-1000
0
Del
ta C
oV
aR
-60
-40
-20
02
0
Ass
et C
han
ge,
VaR
1985w1 1990w1 1995w1 2000w1 2005w1 2010w1
Asset Change VaR Delta CoVaR
Commerical Bank VaR and Delta CoVaR
35
Step 2a: Portfolios Sorted on Characteristics
Institutional characteristics matter
… but individual financial institutions have changed the nature of their business over time
Form decile portfolios, each quarter, according to previous quarter’s data:1. Leverage2. Maturity mismatch3. Size4. Book-to-Market
Add 4 industry portfolios1. Banks2. Security broker-dealers3. Insurance companies4. Real estate companies
36
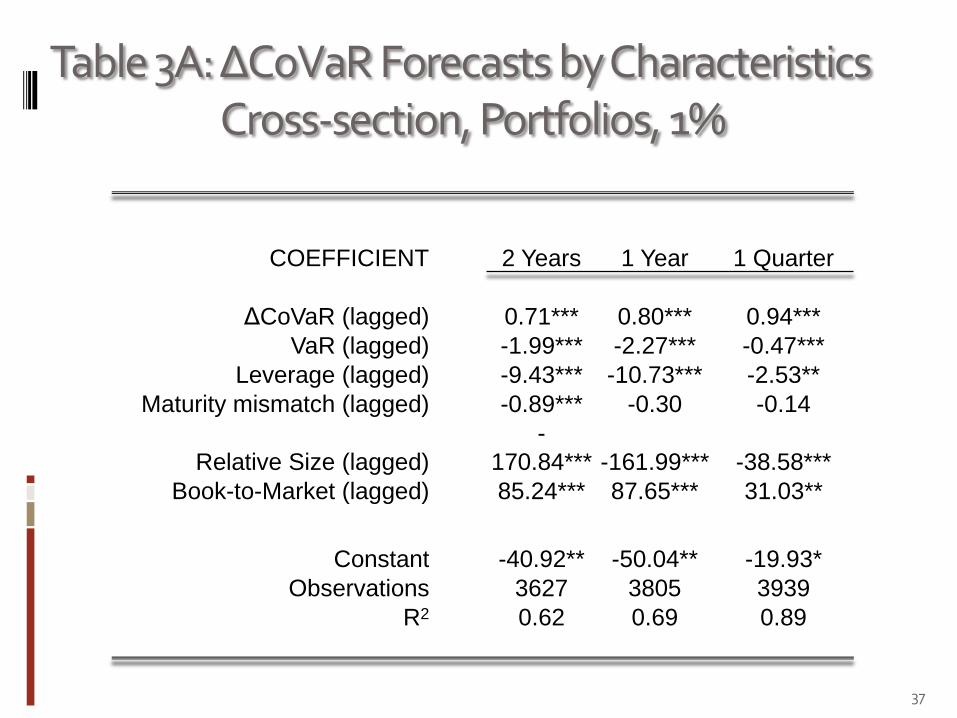
Table 3A: ΔCoVaR Forecasts by CharacteristicsCross-section, Portfolios, 1%
37
COEFFICIENT 2 Years 1 Year 1 Quarter
ΔCoVaR (lagged) 0.71*** 0.80*** 0.94***
VaR (lagged) -1.99*** -2.27*** -0.47***
Leverage (lagged) -9.43*** -10.73*** -2.53**
Maturity mismatch (lagged) -0.89*** -0.30 -0.14
Relative Size (lagged)
-
170.84*** -161.99*** -38.58***
Book-to-Market (lagged) 85.24*** 87.65*** 31.03**
Constant -40.92** -50.04** -19.93*
Observations 3627 3805 3939
R2 0.62 0.69 0.89
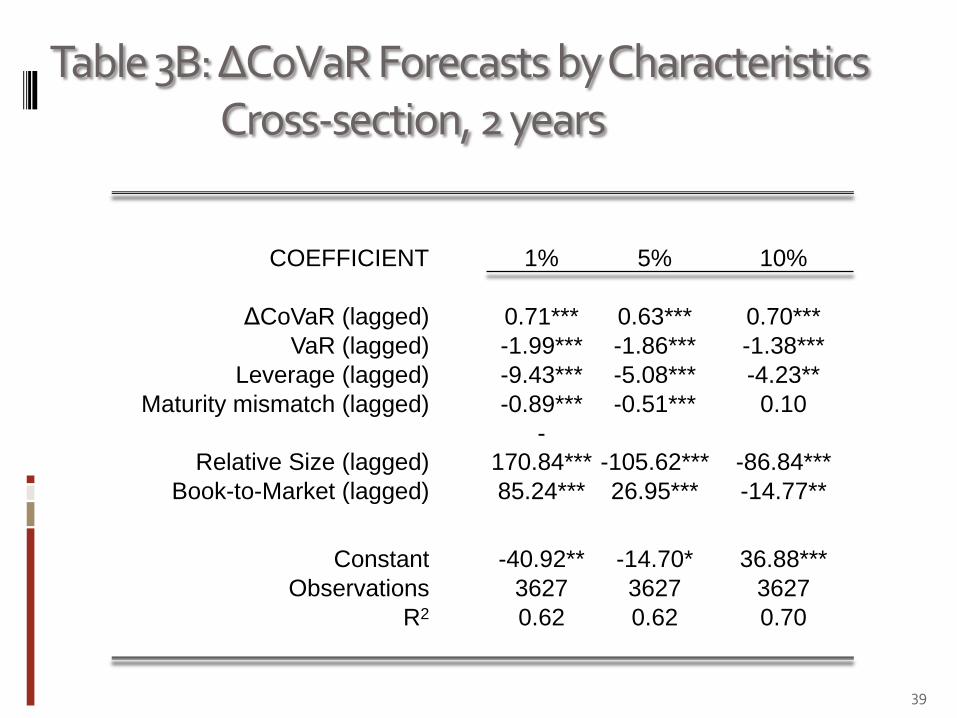
Table 3B: ΔCoVaR Forecasts by CharacteristicsCross-section, 2 years
39
COEFFICIENT 1% 5% 10%
ΔCoVaR (lagged) 0.71*** 0.63*** 0.70***
VaR (lagged) -1.99*** -1.86*** -1.38***
Leverage (lagged) -9.43*** -5.08*** -4.23**
Maturity mismatch (lagged) -0.89*** -0.51*** 0.10
Relative Size (lagged)
-
170.84*** -105.62*** -86.84***
Book-to-Market (lagged) 85.24*** 26.95*** -14.77**
Constant -40.92** -14.70* 36.88***
Observations 3627 3627 3627
R2 0.62 0.62 0.70
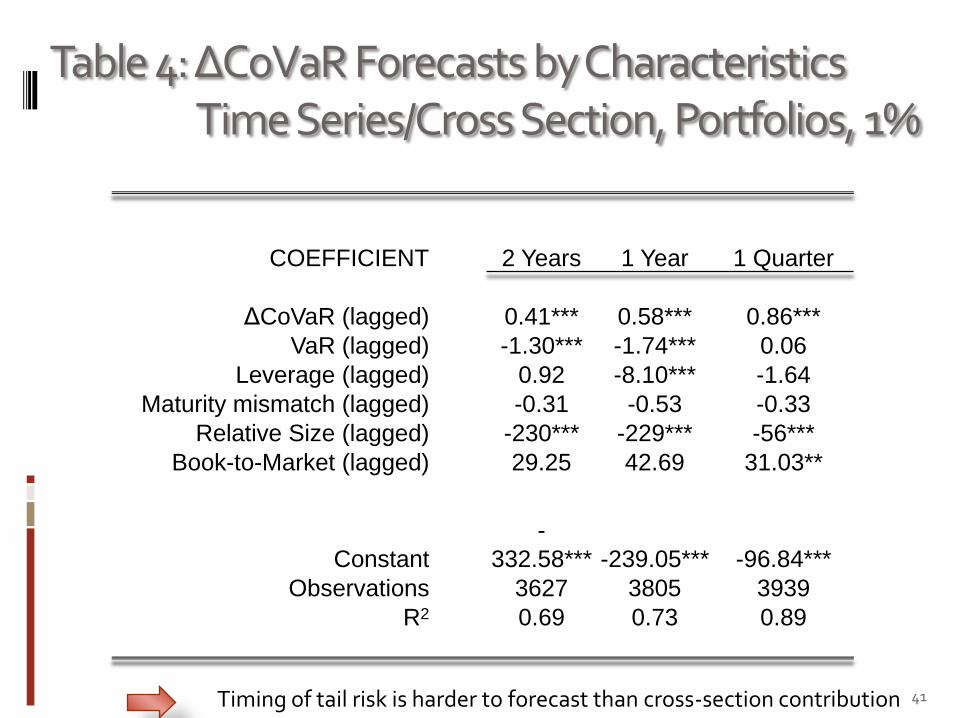
Table 4: ΔCoVaR Forecasts by CharacteristicsTime Series/Cross Section, Portfolios, 1%
41
COEFFICIENT 2 Years 1 Year 1 Quarter
ΔCoVaR (lagged) 0.41*** 0.58*** 0.86***
VaR (lagged) -1.30*** -1.74*** 0.06
Leverage (lagged) 0.92 -8.10*** -1.64
Maturity mismatch (lagged) -0.31 -0.53 -0.33
Relative Size (lagged) -230*** -229*** -56***
Book-to-Market (lagged) 29.25 42.69 31.03**
Constant
-
332.58*** -239.05*** -96.84***
Observations 3627 3805 3939
R2 0.69 0.73 0.89
Timing of tail risk is harder to forecast than cross-section contribution
Step 2b: Forecasting with Market Variables
CDS spread and equity implied volatility for 10 largest US commercial and investment banks(from Bloomberg)
Betas:
Extract principal component from CDS spread changes/implied vol changes within each quarter from daily data
Regress each CDS spread change/ implied vol change on first principal component
42

Table 6: ΔCoVaR Forecasts by Market VariablesCross Section, Portfolios, 1%
43
COEFFICIENT 2 Years 1 Year 1 Quarter
ΔCoVaR (lagged) 0.60*** 0.79*** 0.94***
VaR (lagged) -1.84 0.05 -0.08
CDS beta (lagged) -1.727** 787.92 95.37
CDS (lagged) 1.320 -2.211 -40.26
Implied Vol beta (lagged) -8.30 -590.28** -85.78
Implied Vol (lagged) -144.60 111.02 234.56***
Constant -335.30 -147.72 -114.07*
Observations 114 154 184
R2 0.36 0.57 0.77
short data-span (2004-2008)!
Extension to our Analysis
Co-Expected Shortfall (“Co-ES”) Advantage: coherent risk measure
Disadvantage: any estimate “in” the tail is very noise
Inclusion of additional information derivative positions
off-balance sheet exposure
Crowdedness measure
Interdependence measures
Bank supervision information
44
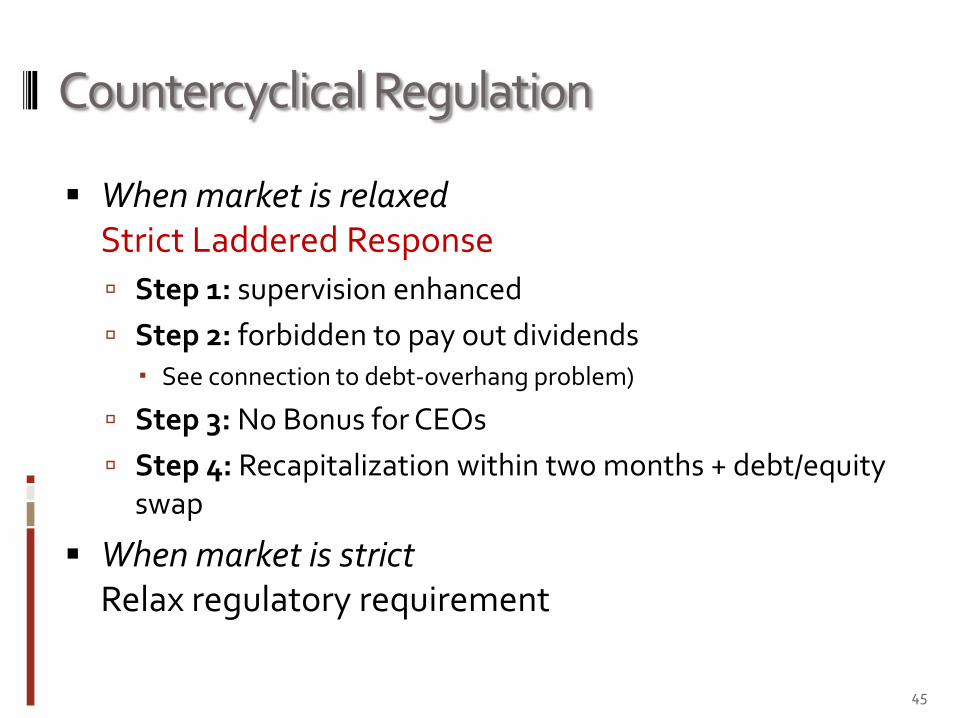
Countercyclical Regulation
When market is relaxedStrict Laddered Response
Step 1: supervision enhanced
Step 2: forbidden to pay out dividends See connection to debt-overhang problem)
Step 3: No Bonus for CEOs
Step 4: Recapitalization within two months + debt/equity swap
When market is strict Relax regulatory requirement
45
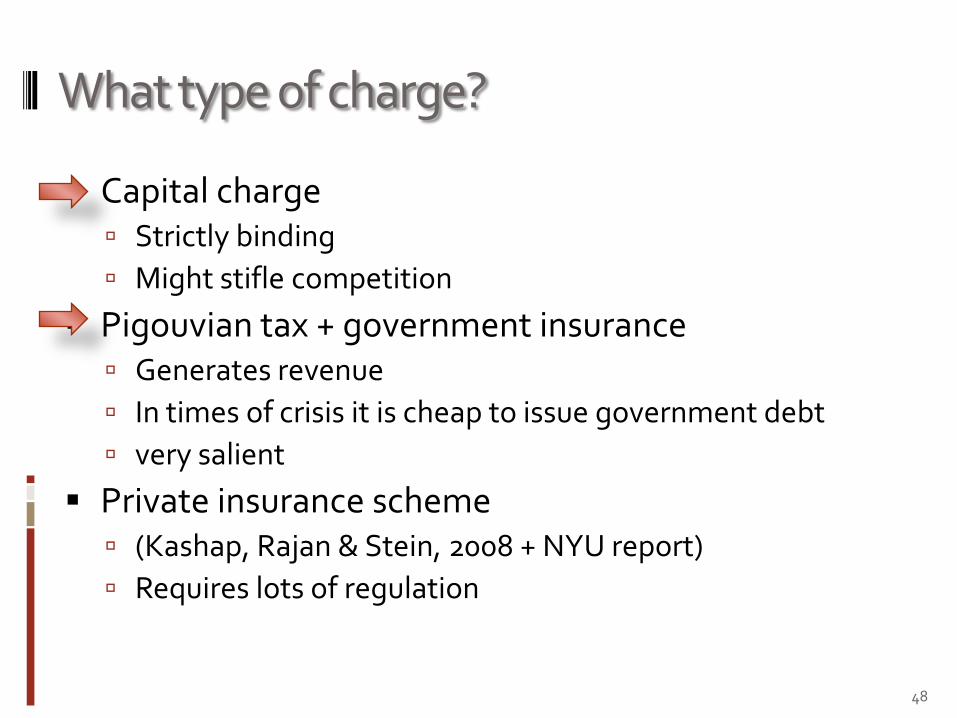
What type of charge?
Capital charge Strictly binding
Might stifle competition
Pigouvian tax + government insurance Generates revenue
In times of crisis it is cheap to issue government debt
very salient
Private insurance scheme (Kashap, Rajan & Stein, 2008 + NYU report)
Requires lots of regulation
48
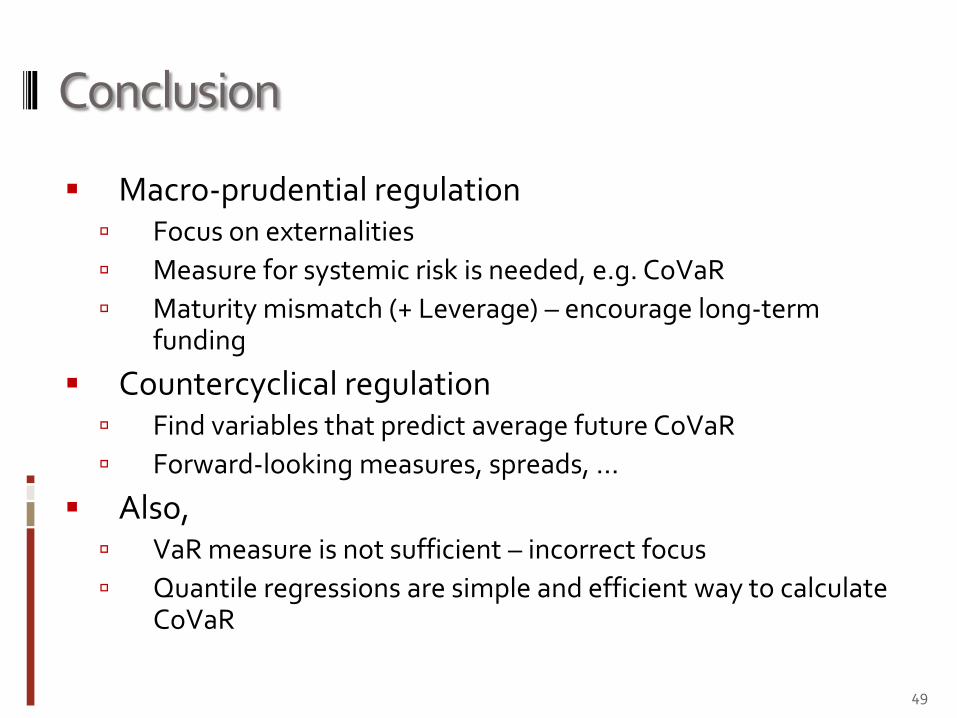
Conclusion
Macro-prudential regulation Focus on externalities
Measure for systemic risk is needed, e.g. CoVaR
Maturity mismatch (+ Leverage) – encourage long-term funding
Countercyclical regulation Find variables that predict average future CoVaR
Forward-looking measures, spreads, …
Also, VaR measure is not sufficient – incorrect focus
Quantile regressions are simple and efficient way to calculate CoVaR
49