To Test (or not) in Arena Settings - files.eric.ed.gov · To Test (or Not) 67 Spring 2008 Volume 1,...
12
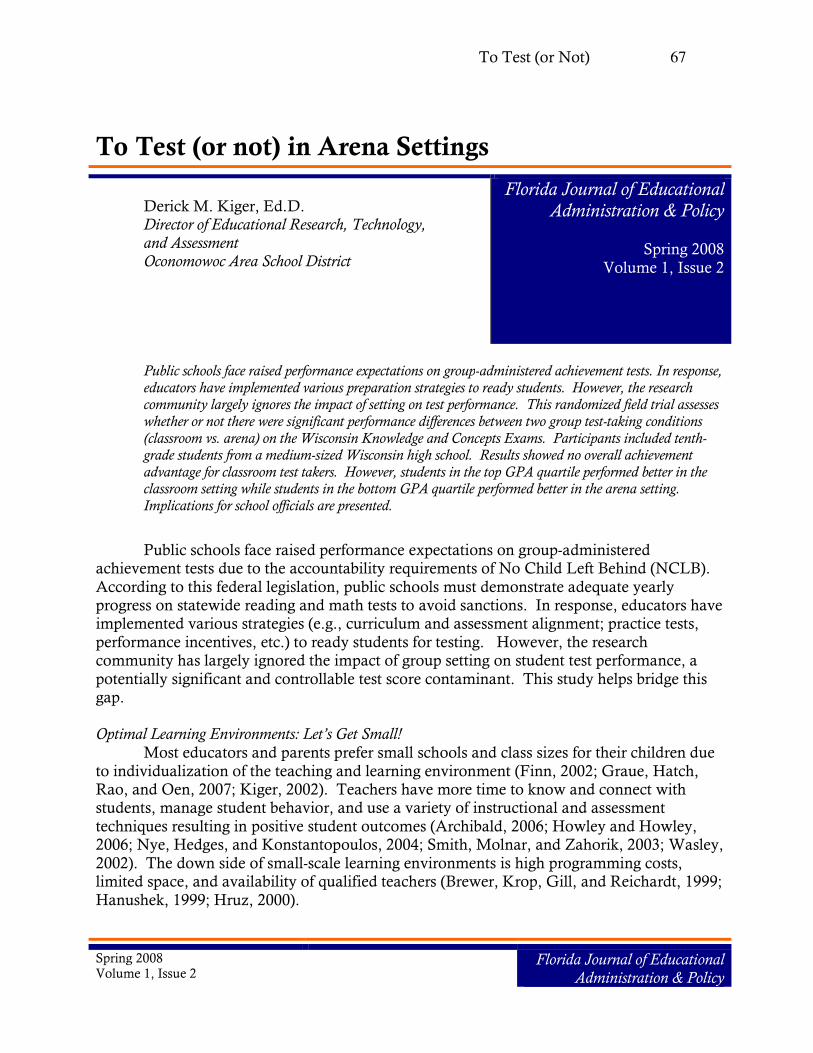
To Test (or Not) 67 Spring 2008 Volume 1, Issue 2 Florida Journal of Educational Administration & Policy To Test (or not) in Arena Settings Derick M. Kiger, Ed.D. Director of Educational Research, Technology, and Assessment Oconomowoc Area School District Florida Journal of Educational Administration & Policy Spring 2008 Volume 1, Issue 2 Public schools face raised performance expectations on group-administered achievement tests. In response, educators have implemented various preparation strategies to ready students. However, the research community largely ignores the impact of setting on test performance. This randomized field trial assesses whether or not there were significant performance differences between two group test-taking conditions (classroom vs. arena) on the Wisconsin Knowledge and Concepts Exams. Participants included tenth- grade students from a medium-sized Wisconsin high school. Results showed no overall achievement advantage for classroom test takers. However, students in the top GPA quartile performed better in the classroom setting while students in the bottom GPA quartile performed better in the arena setting. Implications for school officials are presented. Public schools face raised performance expectations on group-administered achievement tests due to the accountability requirements of No Child Left Behind (NCLB). According to this federal legislation, public schools must demonstrate adequate yearly progress on statewide reading and math tests to avoid sanctions. In response, educators have implemented various strategies (e.g., curriculum and assessment alignment; practice tests, performance incentives, etc.) to ready students for testing. However, the research community has largely ignored the impact of group setting on student test performance, a potentially significant and controllable test score contaminant. This study helps bridge this gap. Optimal Learning Environments: Let’s Get Small! Most educators and parents prefer small schools and class sizes for their children due to individualization of the teaching and learning environment (Finn, 2002; Graue, Hatch, Rao, and Oen, 2007; Kiger, 2002). Teachers have more time to know and connect with students, manage student behavior, and use a variety of instructional and assessment techniques resulting in positive student outcomes (Archibald, 2006; Howley and Howley, 2006; Nye, Hedges, and Konstantopoulos, 2004; Smith, Molnar, and Zahorik, 2003; Wasley, 2002). The down side of small-scale learning environments is high programming costs, limited space, and availability of qualified teachers (Brewer, Krop, Gill, and Reichardt, 1999; Hanushek, 1999; Hruz, 2000).
Transcript of To Test (or not) in Arena Settings - files.eric.ed.gov · To Test (or Not) 67 Spring 2008 Volume 1,...
To Test (or Not) 67
Spring 2008 Volume 1, Issue 2
Florida Journal of Educational Administration & Policy
To Test (or not) in Arena Settings
Derick M. Kiger, Ed.D. Director of Educational Research, Technology, and Assessment Oconomowoc Area School District
Florida Journal of Educational Administration & Policy
Spring 2008
Volume 1, Issue 2
Public schools face raised performance expectations on group-administered achievement tests. In response, educators have implemented various preparation strategies to ready students. However, the research community largely ignores the impact of setting on test performance. This randomized field trial assesses whether or not there were significant performance differences between two group test-taking conditions (classroom vs. arena) on the Wisconsin Knowledge and Concepts Exams. Participants included tenth-grade students from a medium-sized Wisconsin high school. Results showed no overall achievement advantage for classroom test takers. However, students in the top GPA quartile performed better in the classroom setting while students in the bottom GPA quartile performed better in the arena setting. Implications for school officials are presented.
Public schools face raised performance expectations on group-administered achievement tests due to the accountability requirements of No Child Left Behind (NCLB).
According to this federal legislation, public schools must demonstrate adequate yearly progress on statewide reading and math tests to avoid sanctions. In response, educators have implemented various strategies (e.g., curriculum and assessment alignment; practice tests,
performance incentives, etc.) to ready students for testing. However, the research community has largely ignored the impact of group setting on student test performance, a
potentially significant and controllable test score contaminant. This study helps bridge this gap.
Optimal Learning Environments: Let’s Get Small!
Most educators and parents prefer small schools and class sizes for their children due
to individualization of the teaching and learning environment (Finn, 2002; Graue, Hatch, Rao, and Oen, 2007; Kiger, 2002). Teachers have more time to know and connect with students, manage student behavior, and use a variety of instructional and assessment
techniques resulting in positive student outcomes (Archibald, 2006; Howley and Howley, 2006; Nye, Hedges, and Konstantopoulos, 2004; Smith, Molnar, and Zahorik, 2003; Wasley,
2002). The down side of small-scale learning environments is high programming costs, limited space, and availability of qualified teachers (Brewer, Krop, Gill, and Reichardt, 1999;
Hanushek, 1999; Hruz, 2000).
To Test (or Not) 68
Spring 2008 Volume 1, Issue 2
Florida Journal of Educational Administration & Policy
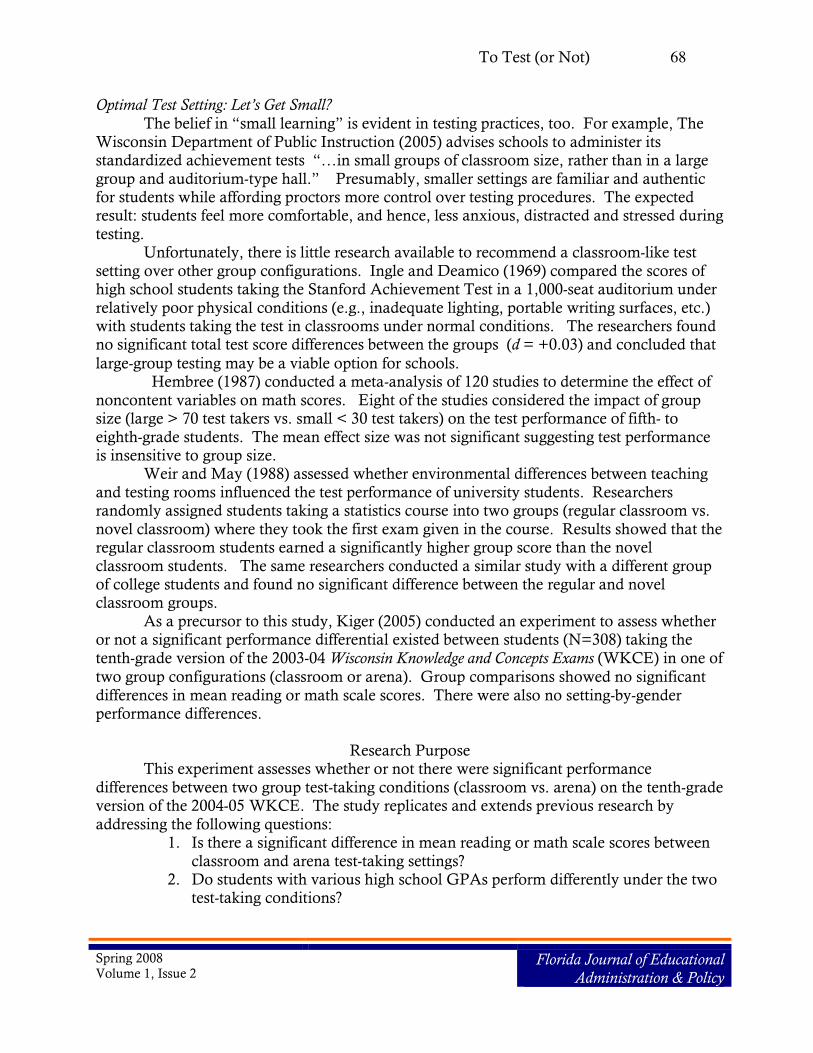
Optimal Test Setting: Let’s Get Small?
The belief in “small learning” is evident in testing practices, too. For example, The
Wisconsin Department of Public Instruction (2005) advises schools to administer its standardized achievement tests “…in small groups of classroom size, rather than in a large
group and auditorium-type hall.” Presumably, smaller settings are familiar and authentic for students while affording proctors more control over testing procedures. The expected result: students feel more comfortable, and hence, less anxious, distracted and stressed during
testing. Unfortunately, there is little research available to recommend a classroom-like test
setting over other group configurations. Ingle and Deamico (1969) compared the scores of high school students taking the Stanford Achievement Test in a 1,000-seat auditorium under
relatively poor physical conditions (e.g., inadequate lighting, portable writing surfaces, etc.) with students taking the test in classrooms under normal conditions. The researchers found no significant total test score differences between the groups (d = +0.03) and concluded that
large-group testing may be a viable option for schools. Hembree (1987) conducted a meta-analysis of 120 studies to determine the effect of
noncontent variables on math scores. Eight of the studies considered the impact of group size (large > 70 test takers vs. small < 30 test takers) on the test performance of fifth- to
eighth-grade students. The mean effect size was not significant suggesting test performance is insensitive to group size.
Weir and May (1988) assessed whether environmental differences between teaching
and testing rooms influenced the test performance of university students. Researchers randomly assigned students taking a statistics course into two groups (regular classroom vs.
novel classroom) where they took the first exam given in the course. Results showed that the regular classroom students earned a significantly higher group score than the novel
classroom students. The same researchers conducted a similar study with a different group of college students and found no significant difference between the regular and novel classroom groups.
As a precursor to this study, Kiger (2005) conducted an experiment to assess whether or not a significant performance differential existed between students (N=308) taking the
tenth-grade version of the 2003-04 Wisconsin Knowledge and Concepts Exams (WKCE) in one of
two group configurations (classroom or arena). Group comparisons showed no significant
differences in mean reading or math scale scores. There were also no setting-by-gender performance differences.
Research Purpose
This experiment assesses whether or not there were significant performance
differences between two group test-taking conditions (classroom vs. arena) on the tenth-grade version of the 2004-05 WKCE. The study replicates and extends previous research by
addressing the following questions: 1. Is there a significant difference in mean reading or math scale scores between
classroom and arena test-taking settings? 2. Do students with various high school GPAs perform differently under the two
test-taking conditions?
To Test (or Not) 69
Spring 2008 Volume 1, Issue 2
Florida Journal of Educational Administration & Policy
Setting
The Oconomowoc Area School District is located 30 miles west of Milwaukee,
Wisconsin and consists of five elementary schools, one middle school, and one high school. Total K-12 enrollment is about 4,200 students. Oconomowoc High School (OHS) serves a
population of approximately 1,470 students. The staff includes 103 teachers, most of whom hold a Masters Degree in their content area, and 52 support personnel. The school facility rests on 53-acres in the City of Oconomowoc and includes a complex for extra curricular
sports as well as outdoor physical education classes. The OHS student body is homogenous in terms of race (97% White) and socio-
economic status (approximately 6% economically disadvantaged). Students achieve at a high level, demonstrated by standardized test scores that rank above national and state
norms in all subject areas. The high school is also fully accredited by the North Central Association Commission on Accreditation and School Improvement.
Method
A Randomized Block Field Trial (RBFT) was used to assign students to an experimental condition. “Blocking” is an experimental strategy that reduces selection bias and error variance by creating a set of matched groups of participants before random
assignment (Shadish, Cook, and Campbell, 2002; Hays, 1988). In this study, grade 10 students were separated into quartiles based upon their reading scale scores from the eighth-
grade version of the WKCE. Students with no pre-test score were placed into a separate block. Students from each category were then randomly assigned to an experimental
condition (classroom or arena setting). Group assignment was revealed to students and proctors a few days before testing. Participants
The entire tenth-grade population (N = 353) was assigned to an experimental
condition several weeks before testing. However, a percentage (approx. 14.5%) of students “selected out” of their assigned group due to special education status as per Individual
Education Plan, absenteeism, or inter-district transfer, reducing the number of participants to
302 at the time of testing. Despite this attrition, pre select-out equivalence remained in tact (see Table 1).
To Test (or Not) 70
Spring 2008 Volume 1, Issue 2
Florida Journal of Educational Administration & Policy
Table 1. Group Characteristics by Experimental Condition
Student Characteristic
Arena Testinga Classroom Testingb
% %
Female 48.3
49.7
Student w/ Disability 2.6
0.7
Economically Disadvantaged 3.3
3.3
Not Enrolled at the School for
a Full Academic Year Prior to Testing
4.0
2.0
Minority 2.6
4.6
Note. aN = 151, M = 701.96, SD = 24.76. bN = 151, M = 701.29, SD = 26.39.
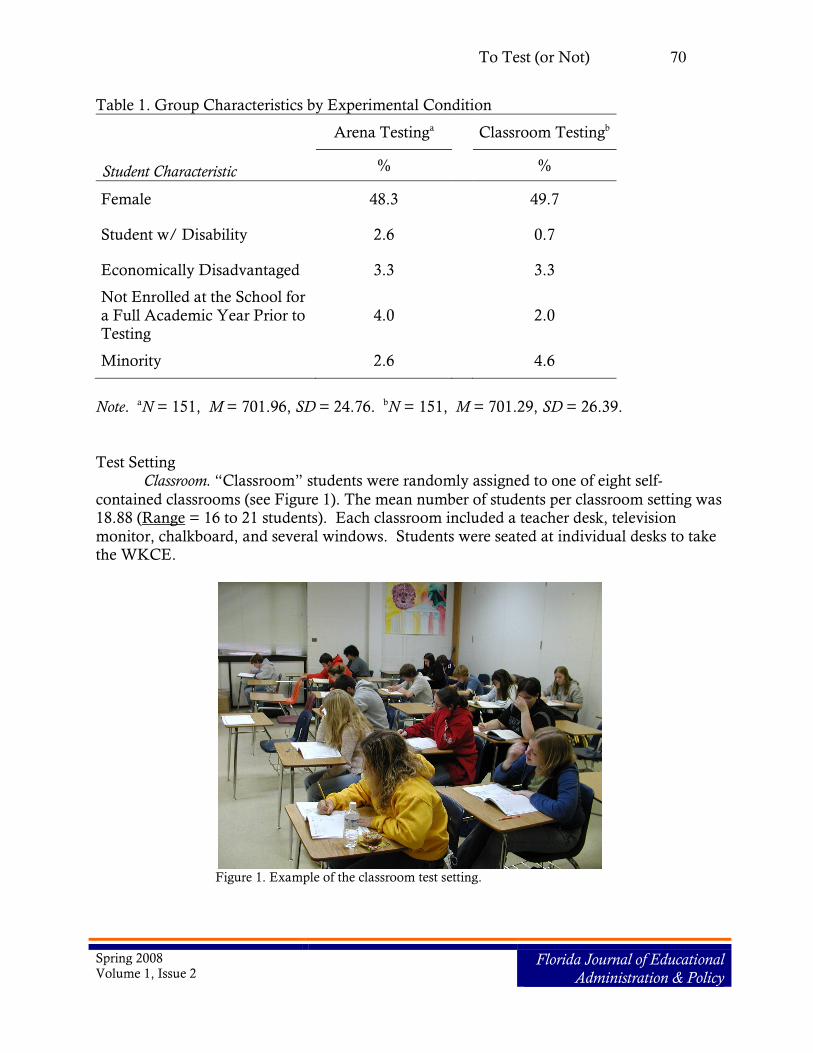
Test Setting Classroom. “Classroom” students were randomly assigned to one of eight self-
contained classrooms (see Figure 1). The mean number of students per classroom setting was 18.88 (Range = 16 to 21 students). Each classroom included a teacher desk, television
monitor, chalkboard, and several windows. Students were seated at individual desks to take the WKCE.
Figure 1. Example of the classroom test setting.
To Test (or Not) 71
Spring 2008 Volume 1, Issue 2
Florida Journal of Educational Administration & Policy
Each classroom was proctored by a high school teacher. All but one teacher had proctored a standardized assessment before the 2004-05 WKCE. Four classroom settings
were proctored by the same teacher throughout the test sessions. Proctors indicated via post-testing questionnaire that classrooms were adequately vented and lighted, standardized test
procedures were followed verbatim, test materials were collected and secured after each session, and students were attentive and well behaved.
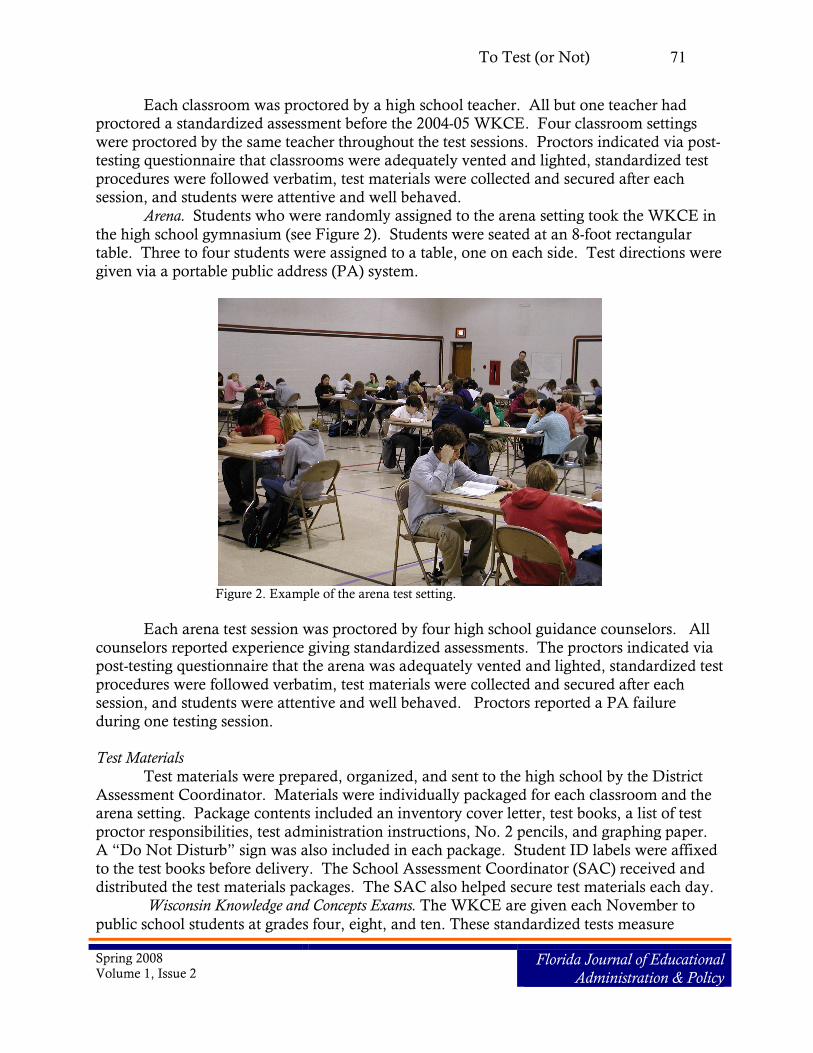
Arena. Students who were randomly assigned to the arena setting took the WKCE in
the high school gymnasium (see Figure 2). Students were seated at an 8-foot rectangular table. Three to four students were assigned to a table, one on each side. Test directions were
given via a portable public address (PA) system.
Figure 2. Example of the arena test setting.
Each arena test session was proctored by four high school guidance counselors. All
counselors reported experience giving standardized assessments. The proctors indicated via post-testing questionnaire that the arena was adequately vented and lighted, standardized test
procedures were followed verbatim, test materials were collected and secured after each session, and students were attentive and well behaved. Proctors reported a PA failure
during one testing session. Test Materials
Test materials were prepared, organized, and sent to the high school by the District
Assessment Coordinator. Materials were individually packaged for each classroom and the arena setting. Package contents included an inventory cover letter, test books, a list of test
proctor responsibilities, test administration instructions, No. 2 pencils, and graphing paper. A “Do Not Disturb” sign was also included in each package. Student ID labels were affixed
to the test books before delivery. The School Assessment Coordinator (SAC) received and distributed the test materials packages. The SAC also helped secure test materials each day. Wisconsin Knowledge and Concepts Exams. The WKCE are given each November to
public school students at grades four, eight, and ten. These standardized tests measure
To Test (or Not) 72
Spring 2008 Volume 1, Issue 2
Florida Journal of Educational Administration & Policy
achievement in reading, language applications, mathematics, science, and social studies. Students also provide a writing sample. Results meet NCLB and Wisconsin accountability
and school improvement requirements. The WKCE tenth-grade test is a customized multiple-choice test instrument
(equivalent in difficulty to a CTB TerraNova test at Level 20) that aligns with the Wisconsin
Model Academic Standards at grade 12. Total test time ranges from five to seven hours.
Results are reported via scale score-based proficiency categories that are specific to Wisconsin. The tests are scored by CTB-McGraw-Hill using the IRT method.
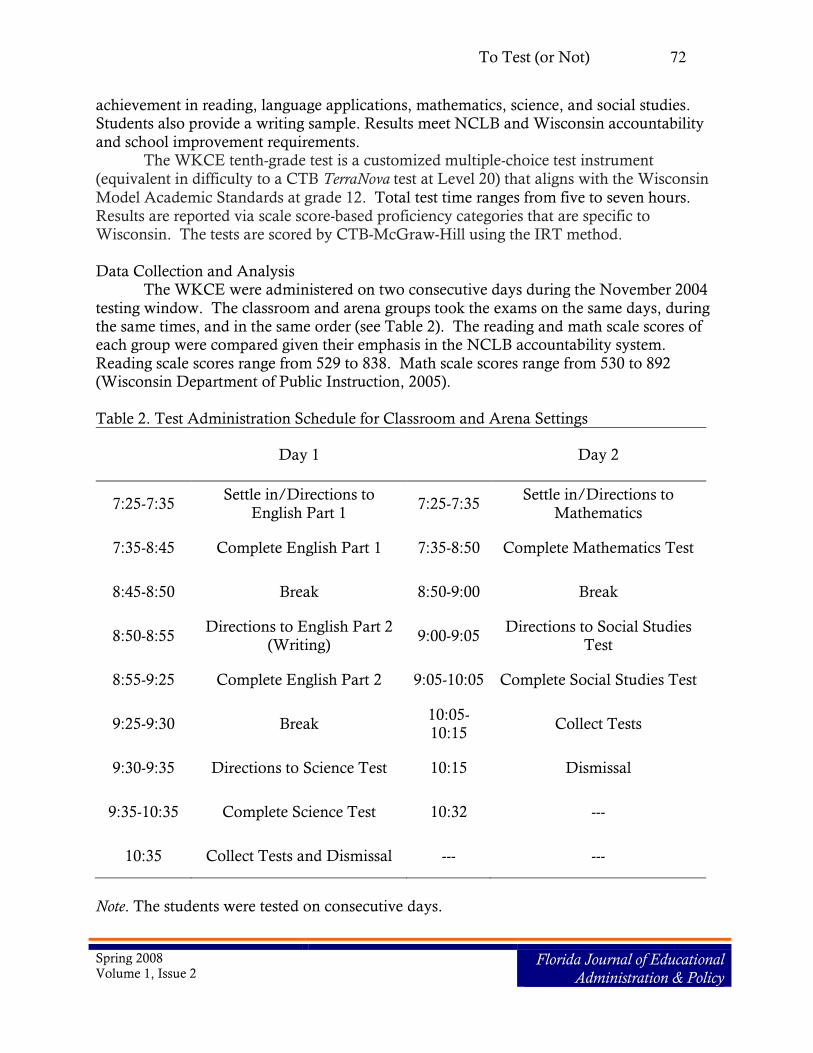
Data Collection and Analysis The WKCE were administered on two consecutive days during the November 2004
testing window. The classroom and arena groups took the exams on the same days, during the same times, and in the same order (see Table 2). The reading and math scale scores of each group were compared given their emphasis in the NCLB accountability system.
Reading scale scores range from 529 to 838. Math scale scores range from 530 to 892 (Wisconsin Department of Public Instruction, 2005).
Table 2. Test Administration Schedule for Classroom and Arena Settings
Day 1 Day 2
7:25-7:35 Settle in/Directions to
English Part 1 7:25-7:35
Settle in/Directions to
Mathematics
7:35-8:45 Complete English Part 1 7:35-8:50 Complete Mathematics Test
8:45-8:50 Break 8:50-9:00 Break
8:50-8:55 Directions to English Part 2
(Writing) 9:00-9:05
Directions to Social Studies Test
8:55-9:25 Complete English Part 2 9:05-10:05 Complete Social Studies Test
9:25-9:30 Break 10:05-10:15
Collect Tests
9:30-9:35 Directions to Science Test 10:15 Dismissal
9:35-10:35 Complete Science Test 10:32 ---
10:35 Collect Tests and Dismissal --- ---
Note. The students were tested on consecutive days.
To Test (or Not) 73
Spring 2008 Volume 1, Issue 2
Florida Journal of Educational Administration & Policy
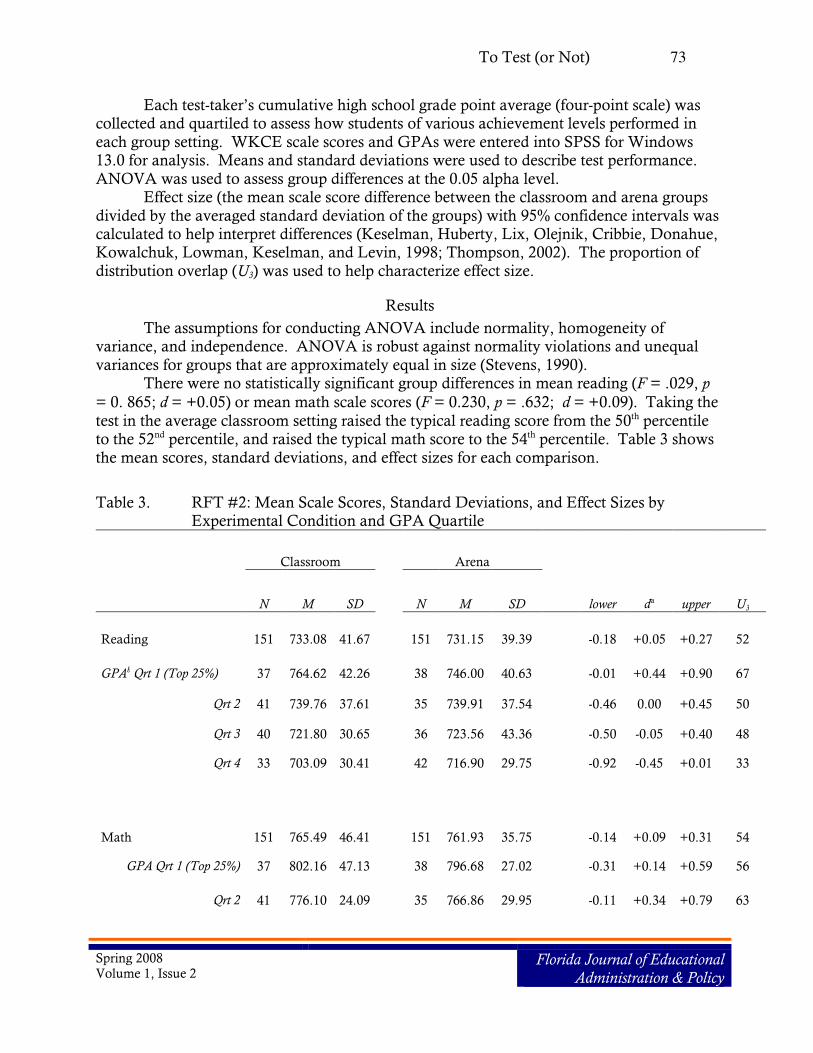
Each test-taker’s cumulative high school grade point average (four-point scale) was collected and quartiled to assess how students of various achievement levels performed in
each group setting. WKCE scale scores and GPAs were entered into SPSS for Windows 13.0 for analysis. Means and standard deviations were used to describe test performance.
ANOVA was used to assess group differences at the 0.05 alpha level. Effect size (the mean scale score difference between the classroom and arena groups
divided by the averaged standard deviation of the groups) with 95% confidence intervals was calculated to help interpret differences (Keselman, Huberty, Lix, Olejnik, Cribbie, Donahue, Kowalchuk, Lowman, Keselman, and Levin, 1998; Thompson, 2002). The proportion of
distribution overlap (U3) was used to help characterize effect size.
Results
The assumptions for conducting ANOVA include normality, homogeneity of variance, and independence. ANOVA is robust against normality violations and unequal
variances for groups that are approximately equal in size (Stevens, 1990). There were no statistically significant group differences in mean reading (F = .029, p
= 0. 865; d = +0.05) or mean math scale scores (F = 0.230, p = .632; d = +0.09). Taking the
test in the average classroom setting raised the typical reading score from the 50th percentile to the 52nd percentile, and raised the typical math score to the 54th percentile. Table 3 shows
the mean scores, standard deviations, and effect sizes for each comparison.
Table 3. RFT #2: Mean Scale Scores, Standard Deviations, and Effect Sizes by Experimental Condition and GPA Quartile
Classroom Arena
N
M
SD N
M
SD lower da upper U3
Reading 151 733.08 41.67
151 731.15 39.39 -0.18 +0.05 +0.27 52
GPAb Qrt 1 (Top 25%) 37 764.62 42.26 38 746.00 40.63 -0.01 +0.44 +0.90 67
Qrt 2 41 739.76 37.61 35 739.91 37.54 -0.46 0.00 +0.45 50
Qrt 3 40 721.80 30.65 36 723.56 43.36 -0.50 -0.05 +0.40 48
Qrt 4 33 703.09 30.41 42 716.90 29.75 -0.92 -0.45 +0.01 33
Math 151 765.49 46.41
151 761.93 35.75 -0.14 +0.09 +0.31 54
GPA Qrt 1 (Top 25%) 37 802.16 47.13 38 796.68 27.02 -0.31 +0.14 +0.59 56
Qrt 2 41 776.10 24.09 35 766.86 29.95 -0.11 +0.34 +0.79 63
To Test (or Not) 74
Spring 2008 Volume 1, Issue 2
Florida Journal of Educational Administration & Policy
Qrt 3 40 753.58 30.27 36 749.94 22.88 -0.32 +0.13 +0.58 55
Qrt 4 33 725.64 47.33 42 736.64 30.09 -0.74 -0.28 +0.18 39
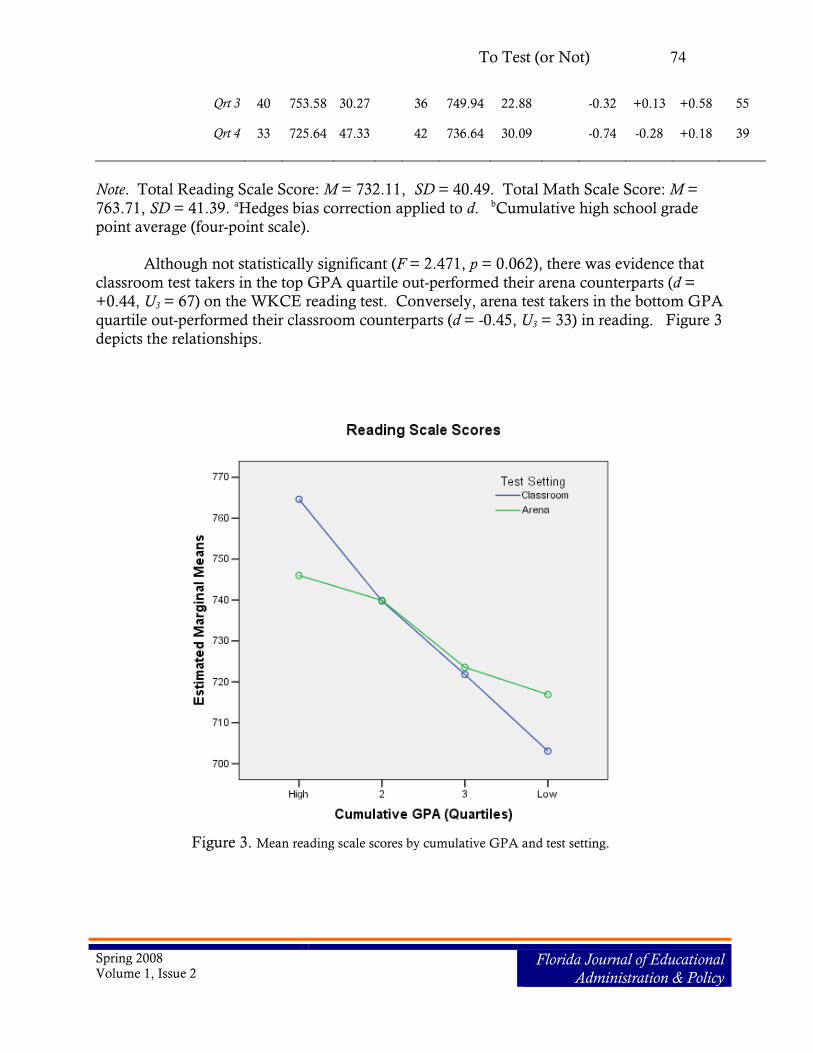
Note. Total Reading Scale Score: M = 732.11, SD = 40.49. Total Math Scale Score: M =
763.71, SD = 41.39. aHedges bias correction applied to d. bCumulative high school grade
point average (four-point scale).
Although not statistically significant (F = 2.471, p = 0.062), there was evidence that
classroom test takers in the top GPA quartile out-performed their arena counterparts (d =
+0.44, U3 = 67) on the WKCE reading test. Conversely, arena test takers in the bottom GPA
quartile out-performed their classroom counterparts (d = -0.45, U3 = 33) in reading. Figure 3
depicts the relationships.
Figure 3. Mean reading scale scores by cumulative GPA and test setting.
To Test (or Not) 75
Spring 2008 Volume 1, Issue 2
Florida Journal of Educational Administration & Policy
Discussion
This study examined performance differences between two group test-taking
configurations (classroom vs. arena) on the tenth-grade version of the Wisconsin Knowledge
and Concepts Exams. Results showed no overall achievement advantage for classroom test
takers, which is consistent with previous research cited in this study. However, students in the top GPA quartile performed better in the classroom setting while students in the bottom GPA quartile performed better in the arena setting. There are several possible explanations
for these findings. Not Small Enough?
Three classrooms in this study housed 20 or more test takers. Class-size reduction research suggests that group sizes less than 20 students are required to significantly improve
classroom conditions and learning opportunities (Biddle & Berliner, 2002). In addition, test-takers in these settings may have experienced feelings of distress, withdrawal, or flight due to
perceived crowding. Hall (1968) categorized interpersonal space into four zones (intimate, personal, social, & public) and associated distance and activities with each. Social spacing
(4 to 12 feet–reserved for formal interactions) may be required for optimum group testing conditions.
Not Familiar Enough?
Proctors are often required to rearrange seating and remove classroom artifacts like
posters and student work that may inform responses. This action may neutralize the “comfort factor” of classroom test settings. As discovered by Landry (2006) “…normally friendly and warm rooms…” are “… largely stripped of their identity and uniqueness during
testing times.” (p. 38) Not Standard Enough?
Variation among classroom test settings and administration procedures may have constrained overall group performance. For example, proctors rotated in four of the
classroom settings, which may have been distracting to students. In addition, one classroom proctor had no experience administering standardized assessments while each arena proctor
reported test-giving experience and training.
Classroom Success and Testing Room
High achieving test takers may perform better in classroom settings where they have experienced much academic success. This environment may improve motivation and
facilitate concentration and task completion. Conversely, low achieving students may test worse in classroom settings because they become overly anxious in a place where they have experienced less academic success. This assertion is supported by qualitative research
conducted by Landry (2006) who, according to interviewed teachers, found that if students “… were usually nervous or concerned about tests or performance in the regular classroom,
then this behavior would likely be present during standardized testing, although it may be accelerated or intensified.” (p. 36)
To Test (or Not) 76
Spring 2008 Volume 1, Issue 2
Florida Journal of Educational Administration & Policy
Implications
The findings of this study have several implications for school officials. First, arena
testing may be a cost-effective alternative for administrators seeking to minimize associated administration costs (e.g., disrupting entire school learning schedules, etc.) without
degrading school-wide test scores. Second, test preparation activities should include thoughtful organization (e.g., number of students per classroom, interpersonal space, etc.) and assignment of students (e.g., high vs. low achievers, etc.) to group test settings. Third,
techniques for increasing test wiseness and reducing test anxiety should be identified and incorporated into preparation activities. Fourth, trained proctors should remain with the
same group of students throughout the testing window to maintain continuity. Lastly, test administrators may consider the following human spatial tendencies (Aiello, 1987) when
preparing the group test setting: 1. Males use more interpersonal space than females; 2. School-aged children use larger interpersonal distances as they progress
through adolescence; 3. Mixed gender pairs use an intermediate amount of space; 4. Males and females prefer side-by-side seating in non-social settings; 5. Anglos use more space than Hispanics; and 6. Blacks use more space than Whites at 12 years and older.
Limitations and Future Research
Randomized Field Trials are recommended for assessing “what works” in education
because of the design’s high internal validity (Cook and Payne, 2002). However, scaling-up promising practices based solely on RFT evidence may be insufficient. This study was conducted at a high school within an affluent community. Results may not translate to a
dissimilar context. Additional research is required to confirm and extend findings. Mixed-method research would help identify school characteristics and organizational
practices that may contribute to experimental results (Borman, 2003). Experimentation with fewer test takers per classroom, interpersonal spacing among students, examination of
proctor by setting interaction, and prior student achievement by setting interaction is needed. Replication of this study at different grade levels and in culturally diverse school settings is
also warranted.
To Test (or Not) 77
Spring 2008 Volume 1, Issue 2
Florida Journal of Educational Administration & Policy
References
Aiello, J.R. (1987). Human Spatial Behavior. In D. Stokols & I. Altman (Eds.), Handbook of
Environmental Psychology: Volume 1. New York: Wiley & Sons, 389-504.
Archibald, S. (2006). Narrowing in on educational resources that do affect student achievement. Peabody Journal of Education, 81(4), 23-42.
Biddle, B. J., and Berliner, D. C. (2002, February). Small class size and its effects: What
does the evidence say about the effects of reducing class size? Educational Leadership,
Vol. 59, No. 5, 12-23.
Borman, G. D. (2003). Experiments for educational evaluation and improvement. Paper presented
at the annual meeting of the American Educational Research Association, Chicago,
IL. Brewer, D., Krop, C., Gill, B. P., and Reichardt, R. (1999). Estimating the cost of national
class size reductions under different policy alternatives. Educational Evaluation and
Policy Analysis, 21(2), 179-192.
Cook, T. D., and Payne, M. R. (2002). Objecting to the objections to using random
assignment in education. In F. Mosteller and R. Boruch (Eds.), Evidence matters:
Randomized trials in education research. Washington, DC: Brookings Institution Press,
150-178. Finn, J. D. (2002). Small classes in American schools: Research, practice, and politics. Phi
Delta Kappan, Vol. 83, No. 7, 551-560.
Graue, E., Hatch, K., Rao, K., and Oen, D. (2007, September). The wisdom of class-size
reduction. American Educational Research Journal, 44(3), 670-700.
Hall, E.T. (1968). Proxemics. Current Anthropology, 9, 83-95.
Hanushek, E. A. (1999). Some findings from an independent investigation of the Tennessee STAR experiment and from other investigations of class size effects. Educational
Evaluation and Policy Analysis, 21(2), 143-163.
Hays, W. L. (1988). Statistics. 4th Ed. New York: Holt, Rinehart and Winston.
Hembree, R. (1987). Effects of noncontent variables on mathematics test performance. Journal for Research in Mathematics Education, 18(3), 197-214.
Howley, A. and Howley, C. (2006, March). Small schools and the pressure to consolidate.
Education Policy Analysis Archives, 14(10), 1-28. Retrieved on January 4, 2008 from: http://epaa.asu.edu/epaa/v14n10/.
Hruz, T. (2000). The costs and benefits of smaller classes in Wisconsin: A further evaluation of The SAGE Program, 13(6). Thiensville, WI: Wisconsin Policy Research Institute,
Inc. Ingle, R. B. and Deamico, G. (1969, December). The effect of physical conditions of the test
room on standardized achievement test scores. Journal of Educational Measurement,
6(4), 237-240. Jehlen, A. and Kopkowski, C. (2006). Is smaller better? NEA Today, February, 24-30.
Retrieved on January 4, 2008 from: http://www.nea.org/neatoday/0602/coverstory.html.
To Test (or Not) 78
Spring 2008 Volume 1, Issue 2
Florida Journal of Educational Administration & Policy
Keselman, H. J., Huberty, C. J., Lix, L. M., Olejnik, S., Cribbie, R. A., Donahue, B., Kowalchuk, R. K., Lowman, L. L., Keselman, J. C., and Levin, J. R. (1998).
Statistical practices of educational researchers: An analysis of their ANOVA, MANOVA, and ANCOVA analysis. Review of Educational Research, 68(3), 350-386.
Kiger, D. (2002). Class size reduction: A facilitator of instructional program coherence. The
Qualitative Report, 7(4). Retrieved January 4, 2008 from:
http://www.nova.edu/ssss/QR/QR7-4/kiger.html. Kiger, D. (2005). The effect of group test-taking environment on standardized achievement
test scores: A randomized block field trial. American Secondary Education, 33 (2), 63-72.
Landry, D. (2006). Teachers’ (K-5) perceptions of student behaviors during standardized
testing. Curriculum and Teaching Dialogue, 8(1&2), 29-40.
No Child Left Behind Act of 2001, Pub. L. No. 107-110, 115 Stat. 1425. Nye, B., Hedges, L. V., and Konstantopoulos, S. (2004). Do minorities experience larger
lasting benefits from small classes? The Journal of Educational Research, 98(2), 94-100.
Shadish, W. R., Cook, T. D., and Campbell, D.T. (2002). Experimental and quasi-experimental
designs for generalized causal inferences. New York, NY: Houghton Mifflin.
Smith, P., Molnar, A., and Zahorik, J. (2003). Class-size reduction: A fresh look at the data.
Educational Leadership, Vol. 61, Issue 1, 72-74.
Stevens, J. (1990). Intermediate statistics: A modern approach. Hillsdale, NJ: Lawrence
Erlbaum. Thompson, B. (2002). What future quantitative social science research could look like:
Confidence intervals for effect sizes. Educational Researcher, 25-32.
Vail, K. (2007). The caring village. American School Board Journal, 32-33.
Wasley, P. A. (2002). Small classes, small schools: The time is now. Educational Leadership,
59(5), 6-10.
Weir, W. and May, R. B. (1988). Environmental context and student performance.
Canadian Journal of Education, 13(4), 505-510.
Wisconsin Department of Public Instruction. (2005). Wisconsin knowledge and concepts exams
interpretive guide. Madison, WI: Author.
Wisconsin Office of Educational Accountability. (2005). WKCE: Guidelines for appropriate
testing procedures. Madison, WI: Author. Retrieved on January 4, 2008 from:
http://dpi.wi.gov/oea/kc_ethic.html#testingconditions.
Derick Kiger is the Director of Oconomowoc's Research Technology and Assessment Department, which produces, manages, and communicates information to help stakeholders
achieve the District's strategic plan.