
To Serve All Students: The Case for Race Equity ... Kristen... · 1 | M i l e s To Serve All...
84
To Serve All Students: The Case for Race Equity Professional Development for Public School District Central Office Staff EMPA Capstone Paper By, Kristen Miles 2011 EMPA Cohort Graduate June 15, 2013
Transcript of To Serve All Students: The Case for Race Equity ... Kristen... · 1 | M i l e s To Serve All...
1 | M i l e s
To Serve All Students: The
Case for Race Equity
Professional Development
for Public School District
Central Office Staff
EMPA Capstone Paper
By, Kristen Miles 2011 EMPA Cohort Graduate June 15, 2013

2 | M i l e s
Acknowledgments
I could not have completed this project without support. I wish to extend my deepest gratitude to
the following individuals and entities:
Portland Public Schools, for inspiration and a vast wealth of multiple perspectives
Dr. Douglas Morgan, for patience, wisdom, and infinite flexibility
The entire 2011 EMPA cohort, for laughter, brilliant minds, passionate arguments, and life-long
memories
My little family – Matt, Eme, and Heather -- for understanding, love, and endless support and
encouragement
My bigger family, for cheerleading, and for excusing me from so many family functions
Jenny, for being a rock while I was stuck in a hard place
Rachel, Korinna, Jocelyn, Carla, and Patty, for listening to me drone on about this project on a
daily basis
Students everywhere who trust us with their minds, their hearts, and their futures

3 | M i l e s
TABLE OF CONTENTS
TABLE OF EXHIBITS ................................................................................................................ 5
CHAPTER I: INTRODUCTION ................................................................................................ 7
Background .............................................................................................................................................. 8
Purpose of the Study, Hypothesis, and Research Questions ...................................................................... 9
Significance of the study ....................................................................................................................... 11
Key Definitions ...................................................................................................................................... 12
Organization of the Paper ..................................................................................................................... 13
CHAPTER II: LITERATURE REVIEW ................................................................................ 15
The Case for Race Equity Professional Development for Teachers and Administrators .......................... 16
The Case for Race Equity Professional Development in Public Organizations ........................................ 21
The Moral and Ethical Obligations of the Public Education System ....................................................... 25
CHAPTER III: METHODOLOGY .......................................................................................... 28
Research Questions ............................................................................................................................... 30
Originality, Scope, and Limitations ........................................................................................................ 39
CHAPTER IV: RESULTS AND ANALYSIS .......................................................................... 40
Local Districts: Demographics ............................................................................................................... 40
Local Districts: Racial Achievement Gap Trends .................................................................................... 42
Local Districts: Survey Results ............................................................................................................... 44
Analysisof Results form Local Districts Survey ...................................................................................... 47
Nationally-recognized districts: Demographics ..................................................................................... 49
Nationally-recognized Districts:Racial Achievement Gap Trends .......................................................... 51

4 | M i l e s
Analysis of Results from Nartionally-recognized Districts ...................................................................... 56
Race Equity Training Programs ............................................................................................................. 59
CHAPTER V: CONCLUSION.................................................................................................. 63
Summary Overview
Components of a race equity PD program for public school district central office staff ......................... 66
Future Research .................................................................................................................................... 73
Leadership implications of the study ..................................................................................................... 74
WORKS CITED .......................................................................................................................................... 78
APPENDIX .................................................................................................................................. 82

5 | M i l e s
Table of Exhibits
Exhibit 1: Equity Survey for School District Administrators ..................................................................... 33
Exhibit 2: Ordinal Variable Codes .............................................................................................................. 35
Exhibit 3: Portland Metro Area Student Demographics by Race ............................................................... 41
Exhibit 4: Portland Metro Area Student Demographics by Race and Total Percentage ............................. 41
Exhibit 5: Greatest Racial Achievement Gap in Local School Districts by Year: Reading ....................... 43
Exhibit 6: Greatest Racial Achievement Gap in Local School Districts by Year: Math7 .......................... 43
Exhibit 7: Ordinal Variable Abbreviations and Codes ............................................................................... 44
Exhibit 8: Disaggregated Survey Results and Calculation of Equity Integration ....................................... 45
Exhibit 9: Correlation of Equity Integration and Achievement Gap in Reading ........................................ 48
Exhibit 10: Correlation of Equity Integration and Achievement Gap in Math ........................................... 48
Exhibit 11: Demographics and Additional Information for Top Schools as Ranked by the Broad Foundation ........ 50
Exhibit 12: Racial Demographics by Percentage: Broad-ranked Schools .................................................. 50
Exhibit 13: Dade County Public Schools Racial Achievement Gap Trend: Reading ................................. 52
Exhibit 14: Dade County Public Schools Racial Achievement Gap Trend: Math ...................................... 52
Exhibit 15: Corona-Norco Public Schools Racial Achievement Gap Trend: Reading ............................... 53
Exhibit 16: Corona-Norco Public Schools Racial Achievement Gap Trend: Math .................................... 53
Exhibit 17: Houston Independent School District Racial Achievement Gap Trend: Reading ................... 54
Exhibit 18: Houston Independent School District Racial Achievement Gap Trend: Math ........................ 54
Exhibit 19: Palm County School District Racial Achievement Gap Trend: Reading ................................. 55
Exhibit 20: Palm Beach County School District Racial Achievement Gap Trend: Math ........................... 55
Exhibit 21: Equity-related Policies in Broad Schools ................................................................................. 57
Exhibit 22: Equity PD Offerings and Net Changes in Achievement Gaps in Reading and Math .............. 58
Exhibit 23: Correlations between PD Recipients and Net Changes in Achievement Gaps ........................ 58
Exhibit 24: Foci, Methods, and Target Audiences of Portland-area Race Equity Training Programs ....... 61

6 | M i l e s
Exhibit 25: Comparison of Theory and Practice in Performance Measurement ......................................... 71
Exhibit 1-A: Demographics and Additional Information for Top Schools as Ranked by Forbes .............. 82
Exhibit 2-A: Racial Demographics by Percentage: Forbes-ranked Schools ............................................... 82
Exhibit 3-A: Barrington School District Racial Achievement Gap Data across Subjects .......................... 83
Exhibit 4-A: Mercer Island School District Racial Achievement Gap Data across Subjects ..................... 83
Exhibit 5-A: Falmouth Public Schools Racial Achievement Gap Data across Subjects ............................ 84

7 | M i l e s
Chapter I: Introduction
If public schools are to regain their proper role as purveyors of democracy as well as
providers of opportunity for social and economic advancement, they must regain the faith
of the American people. (Brown & Peterkin, 1999, p. 37)
Equity in education is a moral imperative for a combination of reasons. Perhaps the most
obvious of these is that being an educated person is assumed by most people to include
knowledge of how equity issues have affected the historical development of nation states,
particularly the United States. But, in addition to producing educated individuals, a primary
purpose of our public schools is to educate students for citizenship, which requires an
understanding of the role and function of equity in producing democratic communities where
future students will live and work. To achieve the equity mission of public schools, all school
district employees have a role in coproducing education. These same employees are also
stewards in their own communities, and carry moral values that can reflect the work of the
school district. While myriad articles, resources, and professional trainings in race equity can be
found for teachers, principals, and other school staff, very little of the literature or training
resources include district central office employees. These employees develop district and school
budgets, hire teachers and other staff, execute contracts with external vendors, control
communication with the public, design and maintain district facilities and school buildings, and
make strategic decisions about the function and operation of the district as a whole.
This chapter will be divided into five sections. The first section will provide the
background for the study and why it was selected; the second section will detail the purpose of
the study, the hypothesis, and the research questions that were used to analyze the data within the
hypothesis. The third section will discuss the significance of the study within the broader
educational and social context, the fourth section will define key terms to be used throughout the
study, and the final section will outline the organization of the remainder of the paper.

8 | M i l e s
Background
For this capstone, I had planned to do a statewide needs analysis that, I hoped, would
ultimately result in a rationale for the creation of a nonprofit organization that would support
school districts in their role as charter school authorizers. After all, it was (and is) my area of
expertise, and the opportunity to meet a need in my own field through a capstone project was
enticing. I had already done a rudimentary literature review and was getting ready to begin
drafting a proposal when I had a conversation with a former colleague at my organization about
the race equity professional development in which we as a district were engaged. This colleague
was someone I respected, and who held a position of high authority in one of the central office
departments. But reflecting on her experience at a two-day training called ―Beyond Diversity‖,
she shook her head and said, ―I don‘t know why all of this matters, anyway. The color of money
is green, and that‘s the only color I care about.‖
I was taken aback. I had always felt that the district‘s long-term equity initiative and the
relationship we had built with our race equity professional development provider, Pacific
Educational Group, were critical to our mission to serve students equitably and ensure their
academic success, regardless of race. Given that all teachers, principals, and senior-level
management were active participants in this work, I had assumed that everyone felt that way.
But in this one moment, my colleague‘s comment showed me how wrong I had been. Instead of
embracing the work and recognizing the critical function that she played as a high-level decision-
maker in the district in shaping our educational policies and practices, she had become so
isolated that she clearly could not see any connection between the work of her department and
the experience of Portland Public School‘s 47,000 students. Clearly, the purpose of our race

9 | M i l e s
equity work had not impacted her. And if it hadn‘t impacted her, there were probably many
others in the district that felt the same way – especially those employees who were not required
to participate in our race equity training. I was at once dismayed and inspired, sensing a great
need to connect the central office to our race equity professional development in a deeper way. I
immediately began to reorganize my capstone.
Purpose of the Study, Hypothesis, and Research Questions
The purpose of this study is twofold: to develop a rationale for a race equity professional
development program for central office staff in school districts, and to identify the essential components
of such a program. In doing so, I hypothesize the following:
Public school district organizational performance with respect to mission-driven work
will be improved when race equity professional development is expected of all school
district employees, including central office staff.
The culmination of this study will be: (a) the development of a rationale for a
professional development (PD) program in race equity for central office staff in school districts;
and (b) the identification of the essential components of such a program. This hypothesis will be
explored by researching answers to the following five questions:
1. How does the implementation of a racial equity professional development program
impact the performance of public school districts?
2. Does the presence of a racial equity professional development program impact
student academic performance data when it is provided to teaching staff and central
office employees?

10 | M i l e s
3. Does the presence of a racial equity professional development program impact
student academic performance data when it is provided to teaching staff but not to
central office employees?
4. What are the ethical and moral obligations of a public school district with respect to
racial equity?
5. What components should be included in a racial equity program designed for public
school district central staff?
The above questions will be answered by examining the available literature on: (a) the
importance of race equity PD programs in public school districts; (b) the importance of race
equity PD programs in public organizations: and (c) the moral and ethical obligations of the
public educational system. I will also survey Portland metro-area districts about their inclusion
and/or use of race equity PD, and will gather demographic, student performance, and racial
achievement gap data from these surveyed districts, as well as the top-performing districts in the
nation as ranked by Forbes and The Broad Foundation. I will examine the aforementioned data
for any correlation between the provision of race equity PD to various employee groups and
student performance trends by race. Finally, I will gather materials and information on race
equity programs delivered by Portland-metro area PD providers, and examine their common and
distinct elements in order to inform my recommendations on the critical components of a race
equity PD program for central office employees in public school districts. My goal is to have an
end product that will not only provide a rationale for the importance of providing race equity PD
to all staff in school districts, but to provide a recommended set of critical components for
providing race equity PD to school district central office employees.

11 | M i l e s
Significance of the study
Many bodies of research and literature support the importance of this study. For
example, the organizational development literature assumes that ―an effective organization is
better able to solve its own problems in the future, and … has a high quality of work and
personal life for those involved, as well as morally acceptable high productivity‖ (Taute W. T.,
2012). In other words, in order to be an effective organization, a school district must develop its
human resources by realizing ―the importance of the individual within the subsystems of the
organization‖ (Taute W. T., 2012). Developing culturally responsive practices is critical to this
success, especially in the public school system, where the demographics of both the employees
and the students are rapidly changing.
The research on the role of race in educational achievement has successfully documented
that the racial achievement gap between students of color and white students ―…is actually a
manifestation of the racial politics that are intrinsic, even vital, to the day-to-day functions of US
society and social institutions such as schools‖ (Duncan G. A., 2002). This gap in achievement
and opportunity can be rooted in ―disparate treatment‖ – that is, unequal consideration of or
attention paid to a person based on race, or ―disparate impact‖, wherein ―…a certain practice has
disproportionate impact on a population subgroup‖ based on race (Stiefel L. S., 2005). That is to
say, seemingly innocuous or neutral district practices and policies – like funding allocations, for
example -- can have an inequitable impact on different racial groups.
The literature on organizational culture also evidences that ―[e]ffective districts invest in
the learning of not only the students, but also of teachers, principals, district staff,
superintendents, and school board members‖ (Bottoms, 2010). In other words, the culture of an
organization cannot shift unless all employees are involved, and racial equity in education

12 | M i l e s
requires a culture shift. Given that ―…acquiring [cultural] competence is a continuing and
intentional process‖ (Andrade R. R., 2011), school districts must offer professional development
in race equity and cultural competency to all of its employees, teachers, administrators, and
central staff alike.
Beyond the organizational performance rationale, though, public school districts have a
moral and ethical imperative to provide an equitable education to each student. Some research
even indicates that a substantial portion of the inequity that children of color experience in
American public schools ―…is caused by the attitudes, beliefs, assumptions, and behaviors of
teachers and administrators.‖ (McKenzie & Scheurich, 2004, p. 628) Other contributing factors
are the perpetuation of traditional Eurocentric curriculum (Chapman, 2007), inequities in school
finance that inherently disadvantage poor students and students of color (Rice, 2004), and the
disproportionate referral to discipline sanctions and overrepresentation of students of color
suspension and expulsion data. (Gregory & Mosely, 2004) The entire public school system is in
need of change, and each employee in the district – including those working in the central office
– has an ethical responsibility to help make that change.
Key Definitions
Following is a summary of the key concepts important for this study.:
Race equity: an operational principle that supports the systemic elimination of
policies, practices, attitudes, and cultural messages that reinforce differential
outcomes by race or fail to eliminate them. Equity is distinct from equality in that
resources and support are not assumed to be equal across cultures, but those groups

13 | M i l e s
(students, in this case) that have the greatest needs receive the greatest levels of
support and/or resources.
Racism: an intentional or unintentional systematic enactment of racial power that is
demonstrated through a complex system of beliefs and behaviors, grounded in a
presumed superiority of one race over others, and resulting in the oppression of
people of other races.
Institutional racism: an intentional or unintentional combination of racial prejudice
and power which results in systemic, specific institutional policies and practices that
are manifested in different, disproportionate, and/or inequitable outcomes for
different racial groups.1
Equity integration: the extent to which a district has incorporated explicit policies,
practices, trainings, and/or goals designed with the express purpose of fostering racial
equity throughout the district, and reducing the student achievement, opportunity, and
discipline gaps. This is a key concept in the remainder of this study.
Organization of the Paper
This capstone paper is composed of following five main chapters:
Introduction: Introduce the topic and detail its importance and the major objectives of
the project. Present the hypothesis and the hypothesis. Specify the content and the
order of the remaining sections.
1 I derived these definitions from a combination of sources, including the Center for Assessment and Policy
Development, Pacific Educational Group, Anne Gregory & Pharmicia Mosely, Lisa Blitz & Benjamin Kohl, Jr., and
the Merriam-Webster dictionary.

14 | M i l e s
Literature Review: An examination of the literature in three major categories: race
equity PD in school districts; race equity PD in public organizations; the moral and
ethical obligations of the public education system.
Methodology: Detail the research approach, the subjects, the data-gathering methods
and instrumentation, and acknowledge the originality and limitations of the study.
Results and Analysis: Present descriptive data and the analysis of the results.
Conclusion: Present the recommended components of a race equity PD program for
public school district central office staff. Reflect on the leadership implications of the
study, and summarize findings and conclusions.

15 | M i l e s
Chapter II: Literature Review
My examination of the literature involving race equity professional development included the
following three steps:
1. Literature about racial equity professional development in public school districts and its
impact on student achievement.
2. Literature about racial equity professional development in public organizations and its
impact on organizational performance and development.
3. Literature about the moral and ethical obligations of the public school system with
respect to race equity.
My primary goal in undertaking these different literature reviews was to assist me in organizing
an analysis of literature regarding the use of racial equity professional development (PD)
programs in public school districts and their effects on student achievement. I use this
information to help answer the question of how race equity professional development impacts
organizational outcomes.
An analysis of the literature regarding the use of race equity professional development
programs in public school districts helps me focus on the particular issue of the relationship
between race equity PD programs and their effects on student achievement. Similarly, literature
on race equity professional development in public organizations and its impact on organizational
performance (besides student achievement) will help provide support for the usage of these
programs to improve organizational performance indicators other than student achievement.
Finally, I examined literature that focused on the moral and ethical obligations of this nation‘s
public school system. I tailored this analysis to literature that evaluated the effects of racial and

16 | M i l e s
cultural inequities in the public school system. My review of the literature will be organized
around the aforementioned three categories of my literature review.
The Case for Race Equity Professional Development for Teachers and
Administrators
There is wide agreement in the literature that fostering an environment of equity for
students of color is a mandate of the public education system (McKenzie & Scheurich, 2004;
Chrispeels, Burke, Johnson, & Daly, 2008; Chapman, 2007; Rocha & Hawes, 2009; Miller, Kerr,
& Ritter, 2008; Niesche & Keddie, 2011; Quiroz, 2013; Marx, 2004; Singleton, 2013).
Furthermore, most researchers agree that observational, anecdotal, and empirical evidence
suggests that, in general, inequities based on race exist for students of color in the classroom, the
school, and at the district level (McKenzie & Scheurich, 2004; Southern Regional Education
Board, 2010; Rocha & Hawes, 2009; Miller, Kerr, & Ritter, 2008; Marx, 2004; Singleton, 2013)
McKenzie and Scheurich (2004) note that:
Most schools have been doing an adequate job of providing a
quality education for White middle-class students, but this has not been the
case for students of color, especially those living in poverty. In fact, there is an
abundance of data and research that shows that students of color not only are
performing at lower achievement levels than their White counterparts
(Campbell, Hombo, & Masseo, 2000) but, also, are overrepresented in special
education and lower level classes (Olson, 1991; Reglins, 1992; Robertson,
Kushner, Starks, & Drescher, 1994; Useem, 1990), dropping out of
school at higher numbers (Cardenas, Montecel, Supik, & Harris, 1992),
frequently educated by teachers who do not believe they can learn or who are
actively negative in their attitude toward these students (McKenzie, 2001),
underrepresented in gifted and talented and higher level classes (Robertson
et al., 1994), often times educated in schools with less resources (Kozol,
1991) and with the least experienced teachers (Urban Teacher Collaborative,
2000), and more likely to be suspended or expelled. (p. 602)

17 | M i l e s
In fact, recent ―[r]esearch cited by social scientists reveals that African American and Latino
students are more segregated today than ever before‖ (Quiroz, 2013, p. 59) In this case, ―[e]ven
when minority children attend schools that are racially integrated, segregation may again emerge
in the form of academic grouping – a phenomenon also referred to as ‗second-generation
discrimination‘‖ (Rocha & Hawes, 2009, p. 327).
Reforms to address these inequities have come and gone since Brown v. Board of
Education in 1954. In the first phase of school reform, which began in the 1960s, funds were
passed directly to individual schools, bypassing the district, with the prevailing theory being that
schools were in the best position to tackle their unique challenges. From the 1970s to the early
2000s, the school and the classroom were looked at as related-but-individual agents of education,
and their difficulties were treated as such – overlapping but distinct. In the third phase of school
reform – the late 80s – well-defined school reform models came into vogue, and whole-school
restructuring aimed at improvement began. These models were often effective at the classroom
and school level, but very rarely did entire districts implement a reform model in a full-scale
manner to address issues and inequities at a systems level. This decade has ushered in the fourth
phase of reform, thanks to large urban districts whose achievement data as required by the No
Child Left Behind Act of 2001 (NCLB), which highlighted the need for equity in improvement
and district-wide reform (Chrispeels, Burke, Johnson, & Daly, 2008).
Because of the requirements of NCLB to examine student data disaggregated by race,
educators can no longer ignore or deny racial inequities between student groups in academic
performance. However, Miller, Kerr, and Ritter argue that ―…exclusively relying on
NCLB…standards to evaluate schools raises significant equity concerns‖ (2008, p. 113). In fact, Miller,
et al (2008) argue that ―[t]he push for greater accountability and increased standards…is about
the performance of individual children, individual classrooms, and particular school

18 | M i l e s
administrators and is not related to the former emphasis on group rights2, an emphasis that was
prevalent in the immediate post-Brown era‖ (2008, p. 100). Despite the undeniability of
disaggregated data, this emphasis on the individual student against a common set of standards in
school reform as opposed to a relational consideration of the differences between student groups
threatens to undermine the importance of affinity groups and the valuable connections students
of color hold within their communities (Chapman, 2007).
Perhaps even worse, the new age of school reform has been highlighted by ―color-
blindness‖ – that is, ―a kinder gentler form of racism, a racism that thrives on the politics of
inclusion‖ (Quiroz, 2013, p. 77). Color-blindness can be thought of as the practice of ―treating
everyone equally‖, thereby denying and devaluing the existence of color, race, or culture, and the
roles each of these factors play in the lives of students and the practices of educators. As such,
color-blindness allows those that perpetuate it to normalize ―whiteness‖ and ignore and deny
racism. In a community (such as public education) in which whiteness is the standard (in
behavior, assessment, learning style, etc.), everything else becomes ―other than‖ and is
marginalized in an assumed common culture that results, ultimately, in an emphasis on
traditional hierarchies, especially with respect to race (McKenzie & Scheurich, 2004; Miller,
Kerr, & Ritter, 2008; Quiroz, 2013; Marx, 2004). Therefore, the majority of the literature
concludes that ―…it is necessary to find ways to change teacher and administrator attitudes,
beliefs, assumptions, and behaviors‖ (McKenzie & Scheurich, 2004, p. 628) and Marx (2004)
asserts that ―white teachers and teacher education students must be guided in an exploration of
their own whiteness‖ (Marx, 2004, p. 32)
Marx notes that ―[a]s one of our society‘s major institutions, our education system
perpetuates the pervasiveness of whiteness and the passivity of white racism by failing to
2 Emphasis added by the author

19 | M i l e s
challenge, and by reproducing this pervasiveness and passivity‖ (2004, p. 32) In a system where
whiteness is normalized, independent research has shown that teachers tend to make assumptions
about behavior and achievement of students of color –that is, the ―other‖. These assumptions are
often processed through a deficit model; teachers tend to attribute behavior issues or low
achievement to deficits in a student‘s race, culture, socio-economic status, parental involvement,
intelligence, self-esteem, the value of education in the family, drug use, home language, and/or
the capacity to function in an educational environment with high expectations. As a result, the
expectations of students of color at school are lowered (McKenzie & Scheurich, 2004; Chapman,
2007; Rocha & Hawes, 2009; Miller, Kerr, & Ritter, 2008; Quiroz, 2013; Marx, 2004). Because
of these assumptions, ―…educators plunge into conversations about socioeconomic status,
language differences, and immigration and nationalism without recognizing how race filters
through these topics and influences our perspectives, experiences, and outcomes‖ (Singleton G.
E., 2013, p. 39). As a result, students of color often are assigned less rigorous curriculum, are
proportionately overrepresented in Special Education (SpEd) or English as a Second Language
(ESL) programs, and are increasingly underprepared by the education system for the next phase
of education or life. The assumptions made in the classroom about students of color become a
self-fulfilling prophecy (McKenzie & Scheurich, 2004; Chapman, 2007; Rocha & Hawes, 2009).
A good portion of the research expresses the need for a comprehensive reform of race-
based inequities at the state level, involving
…a governor and legislature that are seriously concerned about the impact
of an unsatisfactory educational system on a state's economic future… [and] concerned
enough to mandate changes in the public school statutory
framework which would either require reforms described herein, provide
large mandatory incentives to encourage districts to make such changes,
or both. (Brown & Peterkin, 1999, p. 38)

20 | M i l e s
Several researchers propose that the answer to the inequities in the classroom are in an
equitable and needs-based funding formula (Stiefel, Schwartz, & Berne, 2005; Miller, Kerr, &
Ritter, 2008; Brown & Peterkin, 1999), while others assert that public school reform with respect
to equity will not be achieved through a willingness on the part of educators or the education
system, or even due to any moral or ethical imperative to eliminate inequities, but ―…will only
occur if the reform is powered by circumstances that are made unavoidable by statute, other
mandates, the threat of competition, material financial incentives, or all four factors‖ (Brown &
Peterkin, 1999, p. 39).
However, other scholars contend that ―…a transformative discourse of diversity
(Blackmore 2006; Fraser 2007) that is supported by a common vision about the significance of
equity and how it might be pursued; supportive social relations between staff; and dispersed
leadership practices‖ (Niesche & Keddie, 2011, p. 66) is critical to rectifying the inequities in the
public school system. This approach calls for a deep examination of one‘s own race, and how
the underlying assumptions that accompany an individual‘s racial identity manifest in teaching
practices and, at the administrator level, policy decisions (McKenzie & Scheurich, 2004; Rocha
& Hawes, 2009; Niesche & Keddie, 2011; Quiroz, 2013; Marx, 2004; Singleton, 2013).
While there is wide agreement in the literature that teachers, principals, and executive-
level staff are critical to the implementation of any race equity initiatives, less common is the
inclusion of school district central office staff such as program managers, budget analysts,
secretaries, contract specialists, HR generalists, etc. Of notable exception are Chrispeels, Burke,
Johnson, and Daly who note that ―[s]chool and district effectiveness studies show that high
levels of student achievement are possible when schools and the district act as coordinated units
of change‖ (Chrispeels, Burke, Johnson, & Daly, 2008, p. 730), and a 2010 report by the
Southern Regional Education Board which notes that, even though their study findings

21 | M i l e s
―…suggest a strong relationship between district practices and student achievement results‖
(Southern Regional Education Board, 2010, p. 1), district staff are often ―…considered no more
than middlemen in the education enterprise, passing federal and state funds on to schools — where
the ―real work‖ of education takes place — and keeping track of school compliance with federal and
state laws, regulations and policies.‖ (Southern Regional Education Board, 2010, p. 1) Finally, Park
and Datnow conclude that ―…the district…plays a pivotal role in how leadership becomes enacted at
the school site‖ (Park & Datnow, 2009, p. 492), but, in the end, acknowledge that they ―…did not
have the opportunity to investigate the extent to which these leadership practices are affecting student
achievement and equity‖ (Park & Datnow, 2009, p. 492). Overall, the inclusion of district staff in the
literature about the importance of race equity initiatives in the public school system is deficient.
The Case for Race Equity Professional Development in Public Organizations
According to the literature, race equity training in public organizations is not as widely
considered a mandate as it is in education. However, the authors and researchers who address
the provision of race equity professional development do widely agree that not only is buy-in
and, to a greater extent, belief, on the part of senior management a critical component for the
success of any prospective equity training model (Hite & McDonald, 2006; Gutierrez, Kruzich,
Jones, & Coronado, 2000; Blitz & Kohl Jr., 2012; Buttner, Lowe, & Billings-Harris, 2009), but
any training with respect to diversity and/or equity should be needs-based and tailored to best fit
the needs of the organization and the populations it serves (Hite & McDonald, 2006; Gutierrez,
Kruzich, Jones, & Coronado, 2000; Doyle & George, 2008; Pitts, 2007; Buttner, Lowe, &
Billings-Harris, 2009; Andrade & Rivera, 2011).
Some existing research indicates that ―…an organization‘s strategy for managing
diversity influences both the process of meaning formation regarding diversity and the

22 | M i l e s
perception of performance effects. The availability of an organizational vocabulary and of
instruments to interpret interactions in terms of diversity make a crucial difference‖ (Benschop,
2001, p. 1166). Other research has found that not only do ―…firms with higher percentages of
women and people of color in management positions report relatively higher financial
performance (Shrader, Blackburn and Iles 1997; Ng and Tung 1998) and greater effectiveness‖
(Buttner, Lowe, & Billings-Harris, 2009, p. 771), but that ―…organizational members‘ attitudes
toward diversity predicted their diversity-related behavioral intentions‖ (Buttner, Lowe, &
Billings-Harris, 2009, p. 772). This idea of ―managing diversity‖ frequently surfaces in this set
of literature – an idea which is sharply repudiated in the education literature, especially by
Niesche and Keddie (2011), who note that ―such managerial approaches have constructed
minority difference as something that needs to be ‗managed‘ (see also Blackmore 2006;
Morrison et al. 2006; Wilkinson 2008). Such ‗othering‘ of minority cultures has grave political
consequences in terms of how equity is understood and pursued‖ (Niesche & Keddie, 2011, p.
68).
Worthy of note are the many reasons that public organizations undertake race equity or
diversity training. According to the literature, compliance with the law and remaining
competitive are the two most common, while social pressures and responding to an ethical or
moral mandate were much less commonly mentioned (Hite & McDonald, 2006; Gutierrez,
Kruzich, Jones, & Coronado, 2000; Benschop, 2001; Pitts, 2007; Buttner, Lowe, & Billings-
Harris, 2009). In fact, while Gutierrez, Kruzich, Jones, and Coronado (2000) note that
―…diverse human service workplaces [are] particularly crucial because of the role they can play
in improving the human capital potential of vulnerable populations through improved access to
quality health care, education, and support services‖, (Gutierrez, Kruzich, Jones, & Coronado,
2000, p. 54), others (Hite & McDonald, 2006; Gutierrez, Kruzich, Jones, & Coronado, 2000;

23 | M i l e s
Benschop, 2001; Pitts, 2007) ground their rationale in business results, asserting that
―institutional pressures for a diverse workforce derive from a need to grow and achieve a
competitive advantage to serve a diverse customer base‖ (Buttner, Lowe, & Billings-Harris,
2009, p. 774).
As in education, the literature on race equity in public organizations stresses the
potentially damaging effects of the ―color-blindness‖ phenomenon. Benschop argues that
diversity and race equity trainings are often not offered ―because notions of the abstract ideal
worker, who has no body and therefore no gender, colour, age and nationality still prevail‖
(Benschop, 2001, p. 1167). Responding to this way of operating, Blitz and Kohl, Jr. note that
―[a]n organization that overlooks the social and historical impact of race privilege and racism
risks perpetuating inequity through practices that highlight the achievements and strengths of
White staff members without recognizing the cultural context that supports their success‖ (Blitz
& Kohl Jr., 2012, p. 480). Some researchers, however, applaud color-blind practices, arguing for
identity-blind policies‖. Such policies, they argue, ―ensure that human resource decision-making
is implemented in the same way for each employee by ensuring that meritorious performance is
accurately measured, that rewards are allocated based on merit and that the pool of employees
considered for rewards is as wide as possible‖ (Buttner, Lowe, & Billings-Harris, 2009, p. 775).
But those that challenge this mindset from an organizational development standpoint argue that
―[a]ntiracism work requires that the perspectives, values, and experiences of all those who
belong to or participate in the organization be integrated and respected‖ (Blitz & Kohl Jr., 2012,
p. 482). Differences should be acknowledged and celebrated, especially as the workforce in this
country becomes ―…more balanced with respect to gender and race, particularly in the public
sector.‖ (Pitts, 2007, p. 1573)

24 | M i l e s
Another theme that rises to the surface when considering race equity professional
development as a mechanism of organizational change is the influence of managers and top
leadership on the overall culture of the organization and the behavior of its employees
(Gutierrez, Kruzich, Jones, & Coronado, 2000; Taute & Taute, 2012; Andrews, Boyne, &
Walker, 2011). Andrews, Boyne, and Walker find that ―…the evidence suggests that public
managers may underestimate the effects of their activities on performance‖ (Andrews, Boyne, &
Walker, 2011, p. 242), while Gutierrez, et al note that many public organizations ―…want to
increase individual awareness of the value of diversity to the organization, and yet only provide
training for direct service staff, with no participation by managers‖ (Gutierrez, Kruzich, Jones, &
Coronado, 2000, p. 66). This is in direct opposition to the literature on race equity professional
development in education, where teachers and top administrators are most often included, but
central office staff are likely to be uninvolved.
Despite the fact that research supports ―…the importance of cultural competence to client
satisfaction (Singleton-Bowie, 1995), [and] organizational success will increasingly be tied to an
organization‘s ability to meet diverse client needs‖ (Gutierrez, Kruzich, Jones, & Coronado,
2000, p. 64), there is general consensus in the literature that more research should be done in this
area, with respect to providing race equity training to public employees to achieve organizational
change (Hite & McDonald, 2006; Pitts, 2007). Pitts (2007) even notes that studies in race and
ethnicity in public organizations has been declining in recent years. Nevertheless, any program
which seeks to shape and change an organization must be ―focused on the organization in its
entirety. This includes the management, the subordinates, and also the practices and systems
prevailing within the workplace and the objectives set by the organization‖ (Taute & Taute,
2012, p. 67).
25 | M i l e s
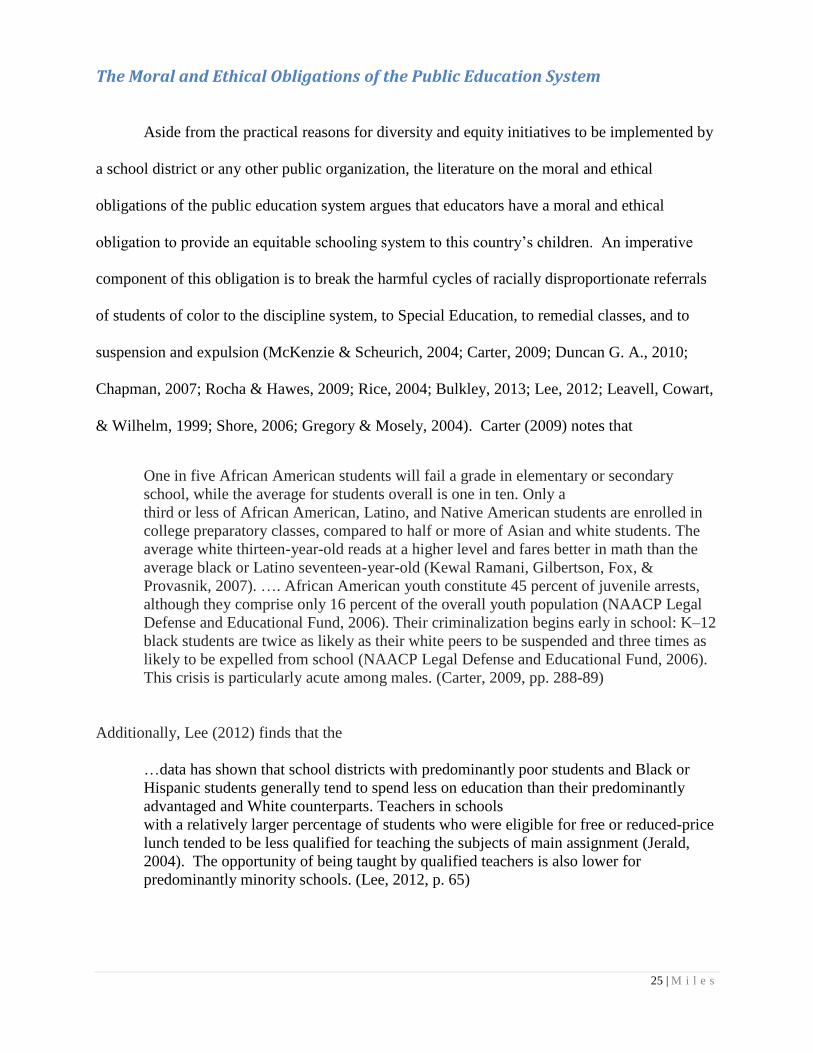
The Moral and Ethical Obligations of the Public Education System
Aside from the practical reasons for diversity and equity initiatives to be implemented by
a school district or any other public organization, the literature on the moral and ethical
obligations of the public education system argues that educators have a moral and ethical
obligation to provide an equitable schooling system to this country‘s children. An imperative
component of this obligation is to break the harmful cycles of racially disproportionate referrals
of students of color to the discipline system, to Special Education, to remedial classes, and to
suspension and expulsion (McKenzie & Scheurich, 2004; Carter, 2009; Duncan G. A., 2010;
Chapman, 2007; Rocha & Hawes, 2009; Rice, 2004; Bulkley, 2013; Lee, 2012; Leavell, Cowart,
& Wilhelm, 1999; Shore, 2006; Gregory & Mosely, 2004). Carter (2009) notes that
One in five African American students will fail a grade in elementary or secondary
school, while the average for students overall is one in ten. Only a
third or less of African American, Latino, and Native American students are enrolled in
college preparatory classes, compared to half or more of Asian and white students. The
average white thirteen-year-old reads at a higher level and fares better in math than the
average black or Latino seventeen-year-old (Kewal Ramani, Gilbertson, Fox, &
Provasnik, 2007). …. African American youth constitute 45 percent of juvenile arrests,
although they comprise only 16 percent of the overall youth population (NAACP Legal
Defense and Educational Fund, 2006). Their criminalization begins early in school: K–12
black students are twice as likely as their white peers to be suspended and three times as
likely to be expelled from school (NAACP Legal Defense and Educational Fund, 2006).
This crisis is particularly acute among males. (Carter, 2009, pp. 288-89)
Additionally, Lee (2012) finds that the
…data has shown that school districts with predominantly poor students and Black or
Hispanic students generally tend to spend less on education than their predominantly
advantaged and White counterparts. Teachers in schools
with a relatively larger percentage of students who were eligible for free or reduced-price
lunch tended to be less qualified for teaching the subjects of main assignment (Jerald,
2004). The opportunity of being taught by qualified teachers is also lower for
predominantly minority schools. (Lee, 2012, p. 65)

26 | M i l e s
While Brown v. Board of Education legally desegregated schools, full racial integration
and equity of access to education – which are recognized as distinct from desegregation -- have
not been realized (Carter, 2009; Chapman, 2007; Rocha & Hawes, 2009). In fact, some
researchers argue that racism is so engrained and prevalent in American society, that it is built
into our public systems, is accepted as ―normal‖, and often goes unrecognized (Duncan G. A.,
2010; Chapman, 2007; Rice, 2004; Bulkley, 2013; Gregory & Mosely, 2004). In fact, Bulkley
finds that inequities are deeply entrenched even in ―…the ways in which the system of public
education is organized, both in terms of its formal governance structures (i.e., school boards) and
the codified practices within those structures (such as teacher tenure, teacher and student
assignment policies, and tracking.)‖ (Bulkley, 2013, p. 12). She argues that many recent
education reform efforts – particularly those that have heralded schools of choice and other
competitive, market-oriented options as the cure for inequity – have actually hindered progress
toward racial equity in school and classroom practices that will mazimize the promotion of race
equity (Bulkley, 2013).
Racial equity is difficult to define. Further, ―…education literature is unfortunately
notorious for providing a detailed description of the problems educators face but does not offer
much in the way of solutions‖ (Leavell, Cowart, & Wilhelm, 1999, p. 69), and ―[c]hanging these
negative and destructive patterns and educating everyone‘s child so that they achieve at high
levels has been shown to be a formidable task‖ (McKenzie & Scheurich, 2004, p. 607). The
―…contradictions between American democratic ideals, including equality and justice for all,
and the reality of the determination of a white, middle-class majority that acts in its own best
interest‖ (Carter, 2009, p. 290) have devastating consequences for people of color while they are
members of an inequitable school system, and long after they graduate (or don‘t) and become
fully-realized citizens of society – a society in which ―…dominant group members regularly

27 | M i l e s
dismiss, marginalize, or simply do not comprehend the versions of events expressed by
subjugated group members‖ (Duncan G. A., 2010, p. 134).
Still, the literature clearly cites an ―educational debt‖ that must be repaid to students of
color after decades of inequities. (Carter, 2009). This will require
…a heightened consciousness among educators to ‗do diversity‘ with depth: by
increasing their own knowledge base to help vanquish the injurious communicative
divides among and between students and teachers who differ by race, ethnicity, culture,
and socioeconomic status, among other social identities; by working to ensure that all
students have equal opportunities to learn within the school; by maintaining a culture of
high expectations for all students; by developing critically conscious and historically
accurate pedagogy and curricula; and by preventing new forms of segregation within
schools with due vigilance. (Carter, 2009, p. 291)
As previously stated, I analyzed the literature in three categories for the following
reasons: to address the use of race equity professional development programs in public school
districts and their effects on student achievement; to address the use of race equity professional
development programs in public organizations and their impacts on organizational performance
(besides student achievement); and to delineate the moral and ethical obligations of this nation‘s
public school system with respect to race equity. While the bulk of the literature called for more
research on factors affecting race equity, like the one I have proposed for this study. They also
agree on the critical importance of race equity in public service organizations, and specifically in
public education. In summary, the literature I have reviewed supports the author‘s underlying
premise for this study: race equity is more likely to be achieved if all members of the
organization are fully prepared to participate actively in achieving this goal.

28 | M i l e s
Chapter III: Methodology
The purpose of this chapter is to outline and detail the data collection methods I used to
gather and review the data pertinent to this study. The data collection was divided into four
distinct parts:
1. Literature review. As the previous chapter described in detail, I reviewed literature in
the following three main categories:
a. Race equity PD in public school districts and its impact on student achievement
b. Race equity PD in public organizations and its impact on organizational
performance and development
c. The moral and ethical obligation of the public school system with respect to race
equity.
2. Local school districts. Part of this study involved an analysis of the level of ―equity
integration‖ in Portland-area public school districts. As previously noted, I define
―equity integration‖ in the following way: the extent to which a district has incorporated
explicit policies, practices, trainings, and/or goals designed with the express purpose of
fostering racial equity throughout the district, and reducing the student achievement,
opportunity, and discipline gaps. As such, I collected the following data on local
districts:
a. Racial demographics
b. Racial student achievement gap data
c. Survey responses
3. Nationally-ranked school districts. In addition to local districts, I was also interested in
whether or not ―equity integration‖ was a contributing factor in district performance

29 | M i l e s
(including student academic performance) on a national scale. To examine this, I
gathered data for the top-ranked districts in the nation as identified by both Forbes and
The Broad Foundation. While noting that their study ―…demolish[es] the idea that more
money equals better schools.‖ (Forbes), Forbes, a well-known business magazine,
analyzed student performance data from tens of thousands of districts in all states that
administer standardized testing, and then calibrated the results with national standards. It
then set a curve against the highest-ranking district using these criteria, and developed a
list called ―The Best Schools for Your Real Estate Buck‖ (Forbes).3 The Broad
Foundation (Broad), conversely, ―…honors large urban school districts that show the
greatest academic performance and improvement while reducing achievement gaps
among poor and minority students‖ (Broad Foundation, The) by awarding the Broad
Prize for Urban Education annually to one district. Broad also recognizes three runners-
up for the prize. Finalists are determined by evaluating: performance and improvement
results on standardized tests by grade and whole district; the reduction of racial and
socioeconomic achievement gaps; graduation rates; SAT and ACT exam scores,
Advanced Placement exam scores, and district demographic data (Broad Foundation,
The).4 Since Forbes ranks 100 districts and Broad honors one winner and three runners-
up, I gathered the following information for the four top-ranked districts as identified
separately by both Forbes and Broad:
a. Racial demographics and special populations (ESL, TAG, Special Education)
b. Racial student achievement gap data
c. Level of ―equity integration‖ as evidenced by board-adopted policies and
professional development programs.
3 The description of this study can be found at: http://www.forbes.com/2011/04/25/best-schools-for-real-estate-buck.html 4 The description of the criteria used for selection can be found at: http://www.broadprize.org/about/process.html

30 | M i l e s
4. Race equity PD providers. I collected information and training materials from
associated books and websites for six Portland-area organizations that offer race equity
PD. From these materials, I compiled a list of the PD foci that was most repeatedly
indicated by the providers, the target audience for the PD, and the training methods. I
used the most frequently stressed foci to help develop my recommended critical
components for a race equity PD program for public school district central office staff.
Research Questions
In the previous section I outlined the following five research questions that I was seeking
to answer in this study:
1. How does the implementation of a racial equity professional development program
impact the performance of public school districts?
2. Does the presence of a racial equity professional development program impact
student academic performance data when it is provided to teaching staff and central
office employees?
3. Does the presence of a racial equity professional development program impact
student academic performance data when it is provided to teaching staff but not to
central office employees?
4. What are the ethical and moral obligations of a public school district with respect to
racial equity?
5. What components should be included in a racial equity program designed for public
school district central staff?
31 | M i l e s
In the sections below I will summarize the methodologies I used to obtain answers to the above
five questions.
Question 1
1. How does the implementation of a racial equity professional development program impact
the performance of public school districts? To answer this question, I undertook the
following steps:
a. I distributed a survey (covered in detail in the following section) to 11 Portland-area
school districts, and Salem-Keizer Public Schools to measure the level of ―equity
integration‖ in each district.
b. I collected data on whole district student performance trends in Reading and Math for
each district that responded to the survey, as well as the Oregon state average
performance in both subjects. Student performance data, board-adopted policies, and
information about the provision of PD to various employee groups were readily
available on each district‘s website. The survey also asked for race equity PD
information, if any. All student performance data was disaggregated by race.
c. I identified the largest racial achievement gaps between the top-performing racial
group and the lowest-performing racial group in both subjects for each district that
responded to the survey. I also collected this information for the state of Oregon as a
whole for comparison. I collected racial demographic information for each
responding district, and Oregon‘s average percentage for each race. I then calculated
the average preponderance of each race for all districts (excluding the overall Oregon
average), determined the range, and the variance of the range.

32 | M i l e s
Questions 2 and 3
2. Does the presence of a racial equity professional development program impact student
academic performance data when it is provided to teaching staff and central office
employees?
3. Does the presence of a racial equity professional development program impact student
academic performance data when it is provided to teaching staff but not to central office
employees?
To answer both of these questions, I used information collected from the Exhibit 1 survey on the
next page, which was distributed by email to the following Portland-area districts:
1. Portland Public Schools
2. David Douglas School District
3. Gresham-Barlow School District
4. Beaverton School District
5. Tigard-Tualatin School District
6. Estacada School District
7. Oregon City School District
8. Centennial School District
9. Parkrose School District
10. Salem-Keizer School District
11. North Clackamas School District
12. Reynolds School District

33 | M i l e s
Exhibit 1: Equity Survey for School District Administrators
The purpose of this survey is to gather information on the professional development in equity that is currently offered in Oregon school districts, and whether or not this professional development is offered to both school-based employees and central office employees. This survey is part of a greater compilation of data examining the effects of professional development in equity on student achievement disaggregated by race in Portland metro area school districts, which will function as the capstone project in Kristen Miles’s Masters of Public Administration program at PSU. Please note that Kristen is not representing PPS in distributing this survey, and your individual responses will not be published.
Instructions: Please fill in the name of your district in the first shaded box below, and place an “X” in the box next to each question that best reflects your knowledge and opinion. Please answer the last question in narrative form.
Due date: Please submit this completed form to Kristen Miles at [email protected] no later than Monday, January 7, 2013. Any questions about this survey can be addressed to her at the email address above. Thank you for your time and contribution to this study.
District Name: Disagree Somewhat disagree
Somewhat agree
Agree Don’t Know
1. This district has school staff and teachers examine their own cultural awareness through professional development or other processes.
2. This district has central office staff examine their own cultural awareness through professional development or other processes.
3. Teacher expectations and evaluations include culturally-relevant teaching.
4. Central office staff expectations and evaluations include cultural competence and responsiveness.
5. This district reviews data disaggregated by race/ethnicity to monitor our achievement gap.
6. Equity is a key feature of our district’s culture.
7. Our district has placed a high priority on closing the racial achievement gap.
8. Our district provides the professional development necessary for teachers to engage in culturally-responsive practices.
9. Our district provides the professional development necessary for central office staff to engage in culturally-responsive practices.
10. Our district has a board-adopted equity policy.
11. If your district uses an equity framework or structured program for professional development in equity,
please describe it below. Please include: a. The year in which your district began using the program or framework b. If it is available to teachers AND central office staff c. Whether the program/framework is an expectation of employees or optional.

34 | M i l e s
The survey in Exhibit 1 is an 11-question, bounded continuous survey presented in a
continuous scale. Participants used ordinal variables to respond to each question. The questions
were adopted from a 2011 PPS Equity Survey that was given to principals, teachers, and central
office leadership. The PPS survey contained 49 questions assessing the beliefs and perceptions
of employees about race equity, race equity PD, and the level to which racially equitable
practices had been implemented in the district. I adopted questions #1, #3, and #8 from the PPS
survey, and duplicated them to gather information on central office staff in questions #2, #4, and
#9. I took questions #5, #6, and #7 directly from the PPS survey, and developed questions #10
and #11 myself.
My interest was in determining if the presence of a racial equity professional
development program impacted student academic performance data when it was provided to
teaching staff and central office employees, and when it was provided to one group but not the
other. Therefore, the inclusion of questions about race equity PD for both groups was critical to
the study. Questions #5, #6, #7, and #10 were added to gauge overall impressions of the
importance assigned to race equity in each district, and the practices that reflected that level of
importance. These questions contributed to my calculation of ―equity integration‖ in each
district, which I will describe below. Question #11 was intended to collect data on the particular
study framework or PD program (if any) each district used to provide professional development
in race equity.
After receiving responses from seven of the twelve districts to which the survey was sent,
I coded the ordinal variables using the framework in Exhibit 2.

35 | M i l e s
Exhibit 2: Ordinal Variable Codes
Disagree 1
Somewhat disagree 2
Somewhat agree 3
Agree 4
Don‘t know 0
I then created a table to record each district‘s response to each question. From this table
and the coded variables, I calculated the average ―equity integration‖ for each district ( ̅
),
across questions with 0.0 being the minimum level, and 4.0 being the maximum level of ―equity
integration‖. I also calculated the mean level of ―equity integration‖ for each question, across
districts, and converted these means to percentages.
For question pairs that asked for the same information for both teachers and central office
staff (questions #1 and #2; questions #3 and #4; questions #8 and #9), I calculated the difference
in the averages across districts in order to determine if race equity PD was offered differently to
teachers than to central office staff groups, and identified the range of ―equity integration‖ by
noting the districts with the highest level (three districts at 95%), and the district with the lowest
level (one district at 58%). Finally, I plotted each district‘s level of equity integration against its
comparative ordinal achievement gap position (1 = narrowest gap; 7 = widest gap) in both
Reading and Math, and tested for a correlation. (
√ √ )
National Districts
After identifying the top districts in the nation as ranked by Forbes and The Broad
Foundation, I collected the following information for each:

36 | M i l e s
Total students
Percentage of students eligible for Free and Reduced Meals
Percentage of English Language Learners
Percentage of students in Special Education
Racial demographics
Whether or not the district had a board-adopted policy specific to race equity
Whether or not the districts‘ boards had adopted other policies that incorporated race
equity
Whether or not the district offered race equity PD to its employees, and to which
groups, if any.
Student performance data, board-adopted policies, and information about the PD provided to
employee groups were readily available on each district‘s website. These data were represented
in both tables and graphs. I then collected information on the largest racial achievement gaps in
each district over a four-year time period to establish a trend in racial achievement gaps in each
subject.
Finally, in the interest of having a larger sample population, and in order to draw a
correlation between offering race equity PD and narrowing racial achievement gaps, I created a
table that indicated, for each district (both local and national): whether race equity PD was
offered to teachers and/or central office staff, and the net change in racial achievement gaps in
both Reading and Math. To determine a statistical correlation, the two PD variables were coded
as follows: No = 0; Yes = 1. I also calculated the average net change in achievement gaps in
both Reading and Math across all districts, though this average was not used in determining a
correlation.

37 | M i l e s
During the data collection process, I discovered that the districts ranked by Forbes were
mostly homogeneously White; in fact, in every case, there was insufficient data from which to
draw any conclusions about the racial achievement gap trends, and none were found to offer race
equity PD to any staff group. While all four Forbes-ranked schools had policies that mentioned
diversity or equality (such as a non-discrimination policy or a policy acknowledging the
inclusion of multicultural curriculum), none had a board-adopted policy that was specific to race
equity. Therefore, while these districts were ranked among the ―best‖ public school districts in
the nation by Forbes, for the purposes of this study, they offer no more useful and/or
generalizable information than would a small, expensive private school in Portland, and,
therefore, their data was not used in this study.
Question 4
4. What are the ethical and moral obligations of a public school district with respect to racial
equity? To answer this question, I studied the available literature on the ethical and moral
obligations of the public school system, and tailored my analysis to race equity. A full
summary of this literature can be found in the Literature Review chapter.
Question 5
5. What components should be included in a racial equity program designed for public school
district central staff? To answer this question, I collected information and materials on six
Portland-area race equity PD providers and trainers. After analyzing the materials for each
of these organizations (books, websites, reviews), I compiled a list of each provider‘s training
methods, target audiences, PD training foci, and equity philosophy as evidenced by the
themes that rose to the surface in the materials. I then created a table to document these

38 | M i l e s
themes, and noted common and repeated elements between programs, particularly with
respect to the organizations‘ PD training foci. From the information provided, the following
categories were included:
A focus on equity
A focus on cultural responsiveness and inclusivity
A focus on privilege
A focus on diversity
A specific focus on K-12 education
A focus on race
The target audience for the PD
Training methods
Each category (with the exception of the target audience and the training methods) was a
discrete, qualitative variable, and all applicable categories were indicated for each training
organization by checking the corresponding box. This allowed me to determine the most
common elements shared by the PD providers.
After gathering the data from this table, I interviewed two coworkers: one of whom
delivers race equity PD to all employee groups in PPS, and the other who manages a federal
grant aimed at helping students stay in school who are at risk of dropping out. Both provided
insight into and recommendations for the key components of a race equity PD program for
school district central office staff.
Finally, I studied literature on race equity in public organizations and organizational
development, and noted the alignment between the recommendations for providing race equity
PD in school districts and in other public organizations, when applicable. Appropriate literature
for all sections of the study was accessed through various trade publications, journals, books, and

39 | M i l e s
other credible published sources. The combination of information from the study of race equity
PD providers, the interviews, and the literature on race equity PD and organizational
development in public organizations provided the material for my recommendations on the
critical components of a race equity PD program for central office staff in a public school
district.
Originality, Scope, and Limitations
The scope of this study included a survey that was distributed to twelve local school
districts, an analysis of student performance data of those districts that responded to the survey, a
data and information analysis of the top-performing districts as ranked by Forbes and the Broad
Foundation, a literature review, and an analysis of training programs provided by five race equity
trainers in the Portland area.
As noted, the survey used in this study borrowed heavily from a survey distributed to
Portland Public Schools (PPS) principals, teachers, and administrators, though it was tailored and
augmented to meet the needs of this study. The quantifiable results of the survey and any
subsequent correlations are limited by the number of respondents. While a vast amount of
information was available for the nationally-ranked school districts, the results of the study are
limited to what was readily and immediately available to the public. Finally, the elimination of
the Forbes group of schools due to insufficient data reduced the number of nationally-ranked
district subjects by half.

40 | M i l e s
Chapter IV: Results and Analysis
The purpose of this chapter is to present and analyze the quantitative and qualitative data
gathered over the course of the study. This chapter will be divided into eight sections: * * Local
Districts: Demographics
Local Districts: Racial Achievement Gap Trends,
Local Districts: Survey Results
Local Districts: Analysis;
Nationally-recognized Districts: Demographics
Nationally-recognized Districts: Racial Achievement Gap Trends
Nationally-recognized Districts: Analysis.
Race Equity Training Programs.
Local Districts: Demographics
As described, the survey was distributed to 12 Portland, Oregon metro public school districts
(and Salem-Keizer School District in Salem, Oregon); the 7 following districts responded:
Oregon City
Gresham-Barlow
Portland Public Schools
David Douglas
Centennial
Salem-Keizer
North Clackamas
The results from the survey of these 7 districts are summarized in Exhibits 3 and 4. Data
is only presented for districts that responded to the survey, and all district names have been
coded to ensure confidentiality for those individuals who responded to the survey.

41 | M i l e s
Exhibit 3: Portland Metro Area Student Demographics by Race5
Exhibit 4: Portland Metro Area Student Demographics by Race and Total Percentage
5 Source: Oregon Department of Education Student Ethnicity Report, 2012-13.
http://www.ode.state.or.us/sfda/reports/r0067Select2.asp
0%
10%
20%
30%
40%
50%
60%
70%
80%
90%
100%
Multi-Ethnic
American Indian/Alaskan Native
Asian/Pacific Islander
Hispanic
Black
White
White Black Hispanic
Asian/Pacific
Islander
American
Indian/Alaskan
Native
Multi-
Ethnic
Total
Minority
District A 80% 1% 11% 2% 1% 5% 20%
District B 50% 1% 39% 4% 1% 5% 50%
District C 51% 5% 24% 13% 1% 5% 49%
District D 44% 10% 25% 16% 1% 5% 56%
District E 64% 3% 25% 3% 1% 5% 37%
District F 57% 11% 15% 9% 1% 7% 43%
District G 68% 2% 16% 8% 1% 6% 32%
OREGON 65% 3% 22% 5% 2% 5% 35%
Average (districts only) 59.19% 4.59% 22.19% 7.69% 1.00% 5.40% 40.86%
Variance (districts
only) 0.012874 0.001473 0.00732 0.002272408 1.71429E-06 3.97E-05 0.012863
Largest difference
(districts only) 36% 10% 28% 14% 0% 2% 36%

42 | M i l e s
While individual districts vary, on average, these 7 districts have a smaller percentage of white
students (by 6%) than the state average, and higher percentages of all other racial groups. In
other words, the 7 responding districts in the Portland area are, as a whole, more racially diverse
than Oregon‘s average.
Local Districts: Racial Achievement Gap Trends
Exhibits 5 and 6 on the following page show the achievement gap trend data over time
for each responding district and Oregon in both Reading and Math. Data points indicate the
widest achievement gap between racial groups in that year.6 As shown in Exhibit 5, the district
racial achievement gaps in Reading between the 2004-05 and 2005-06 school years ranged from
a 13% gap to a 35% gap. By the 2010-11 school year, that range had narrowed to between 16%
and 28%. While individual districts vary, there is no wholesale increase or decrease of the
collective trend in Reading for all districts. Exhibit 6 shows the racial achievement gap trend in
Math. Aside from two outliers with 35% and 13% gaps in the 2005-06 school year, most
districts had between 20% and 28% gaps. This range, however, has spread over time to result in
a range of 18% to 40% by 2010-11.
6 Source: Oregon Department of Education, Education Data Explorer.
http://www.ode.state.or.us/apps/BulkDownload/BulkDownload.Web/

43 | M i l e s
Exhibit 5: Greatest Racial Achievement Gap in Local School Districts by Year: Reading7
Exhibit 6: Greatest Racial Achievement Gap in Local School Districts by Year: Math7
7 Not all achievement gaps are between the same racial groups in each year. Students who declined to report race were not
accounted for in measuring achievement gaps. Wide variation in gaps between years could be accounted for by small
subpopulations in certain districts in certain years.
0
5
10
15
20
25
30
35
40
04-05Reading
05-06Reading
06-07Reading
07-08Reading
08-09Reading
09-10Reading
10-11Reading
Oregon City
Salem-Keizer
Centennial
David Douglas
Gresham-Barlow
North Clackamas
Portland Public
State of Oregon
0
5
10
15
20
25
30
35
40
45
04-05Math
05-06Math
06-07Math
07-08Math
08-09Math
09-10Math
10-11Math
Oregon City
Salem-Keizer
Centennial
David Douglas
Gresham-Barlow
North Clackamas
Portland Public
State of Oregon

44 | M i l e s
Local Districts: Survey Results
The survey described in the Methods section in Chapter 3 was an 11-question, bounded
continuous survey presented in a continuous scale.8 Participants used ordinal variables to
respond to each question. The questions were adopted from a 2011 PPS Equity Survey that was
given to principals, teachers, and central office leadership. The PPS survey contained 49
questions assessing the beliefs and perceptions of employees about race equity, race equity PD,
and the level to which racially equitable practices had been implemented in the district. I adopted
questions #1, #3, and #8 from the PPS survey, and duplicated them to gather information on
central office staff in questions #2, #4, and #9. I took questions #5, #6, and #7 directly from the
PPS survey, and developed questions #10 and #11 myself. My interest was in determining if the
presence of a racial equity professional development program impacted student academic
performance data when it was provided to teaching staff and central office employees, and when
it was provided to one group but not the other. Additionally, I wished to gauge overall
impressions of the importance assigned to race equity in each district, and the practices that
reflected that level of importance.
Exhibit 7 below shows the coding of ordinal variables on a scale of 0-4, where 0 equals
―Don‘t Know‖ and 4 equals ―Agree‖. These ordinal variables of the survey were first
abbreviated, and then coded using the coding system in Exhibit 7.
Exhibit 7: Ordinal Variable Abbreviations and Codes
Don‘t know = DK Disagree = D Somewhat Disagree = SD Somewhat Agree = SA Agree = A
DK = 0 D = 1 SD = 2 SA = 3 A = 4
8 See the survey in the Methodology chapter on page 29.

45 | M i l e s
Exhibit 8 shows each district‘s response to each question in the survey, the average level of
―equity integration‖ across districts and across questions (as indicated in the ―Average‖ column
and row), and the corresponding percentage of the average. Differences in levels of equity
integration were calculated, also.
Exhibit 8: Disaggregated Survey Results and Calculation of Equity Integration
As shown in Exhibit 8, on average, districts provide more PD on individual cultural awareness to
teachers than central office staff, and include equity metrics in teachers‘ evaluations more often
District
Teacher
PD -
cult
aware
Central
office
PD -
cult
aware
Teacher
evals
Central
office
evals
Data
disag
by
race
Equity
is in culture
Priority
on
closing
ach gap
Teacher
PD - cult
resp
Central
office
PD -
cult
resp
Equity
policy Avg
%
Avg
District A D D SA SD A SA SA SD SD SA 2.4 60%
District B A A A SA A A A SA A A 3.8 95%
District C A A DK SA A A A SA A D 3.4 85%
District D SD D SD D A SA SA SD D A 2.3 58%
District
Teacher
PD -
cult
aware
Central
office
PD -
cult
aware
Teacher
evals
Central
office
evals
Data
disag
by
race
Equity
is in culture
Priority
on
closing
ach gap
Teacher
PD - cult
resp
Central
office
PD -
cult
resp
Equity
policy Avg
%
Avg
District E A A A A A A A A SA SA 3.8 95%
District F A A A A A SA A A A A 3.8 95%
District G A A SD SA A SD A SD A SA 3.2 80%
District
Average 3.3 3.1 3.2 2.9 4 3.3 3.7 2.9 3 3.1
Difference .2 or 5% .3 or 13% -0.1 or -2%

46 | M i l e s
for teachers than central office staff. Conversely, central office staff were slightly more likely to
receive PD on cultural responsiveness than were teachers.
As the colored areas of Exhibit 8 illustrate, differences for all districts collectively were
calculated for three category sets:
1. (Blue) Whether the district required school staff and teachers to examine their own
cultural awareness through professional development or other processes AND whether
the district required central office staff to do the same. The districts falling into the blue
category showed a 5% higher frequency for teachers to be required to examine their own
cultural awareness than central office staff
2. (Green) Whether teacher expectations and evaluations included culturally relevant
teaching AND whether central office staff evaluations included cultural competence and
responsiveness. The districts in the green category showed a 13% higher incidence of
teachers‘ expectations and evaluations including culturally-relevant practices
3. (Red) Whether the district provided the professional development necessary for teachers
to engage in culturally-responsive practices AND whether the district provided central
office staff the professional development necessary to engage in culturally-responsive
practices. The districts in the red category showed a 2% higher incidence of central
office staff engaging in professional development around cultural responsiveness
Since the actual numerical and percentage differences could be calculated from this defined
population, the statistical significance was not calculated.
All respondents reported that their districts examine student data disaggregated by race,
and that closing the achievement gap is a priority. All but one district reported equity as being
an inherent part of the organizational culture, and all but one district reported having a board-
adopted racial equity policy (though three districts marked ―Somewhat Agree‖ for this question).

47 | M i l e s
Analysis of Local Districts Survey Results
Based on the information in Exhibit 8, four of seven districts have racial achievement
gaps in Reading that are higher than the average Oregon gap of 21% between White and Black
students. Two of seven districts report racial achievement gaps in Math that are higher than the
average Oregon gap of 35% between Asian and Black students. The district that reported the
lowest level of equity integration in the survey has the highest population of students of color
(56%), and also reports the second largest achievement gaps in both Reading and Math (24% and
38%, respectively). Of the three districts reporting the highest level of equity integration on the
survey (95% averages for each), one reported the smallest achievement gap in Math (19%) and
the third smallest achievement gap in Reading (20%); one fell into 4th
(23%) place in Reading
and tied for 3rd
place in Math (31%), and one – the largest school district in Oregon – had the
widest achievement gaps in both Reading and Math (28% and 40%, respectively). Oregon City
reported the lowest achievement gap in Reading (16%) and the second lowest in Math (20%); it
also has the highest percentage of White students (80%) and reported an equity integration of
60% in the survey.
The graph in Exhibit 9 plots each district‘s level of equity integration against its
comparative ordinal achievement gap position (1 = narrowest gap; 7 = widest gap) and
shows the correlation between the level of equity integration of a district and the relative width
of its racial achievement gap in Reading. As shown, there appears a slight correlation between
an increase in equity integration and an increase in the racial achievement gap in Reading. This
was an unexpected result, and may indicate more complex factors at play in the teaching of
English Language Arts.

48 | M i l e s
Exhibit 9: Correlation of Equity Integration and Achievement Gap in Reading
Correlation = .338
In Math, as Exhibit 10 shows, the correlation between the level of equity integration of a
district and the relative width of its racial achievement gap produced expected results. Data
shows a slight correlation between the level of equity integration of a district and a narrowing of
the achievement gap in Math.
Exhibit 10: Correlation of Equity Integration and Achievement Gap in Math
Correlation = -.078
As predicted, the data from Exhibit 10 show that the higher level of equity integration a district
reports, the narrower its racial achievement gap in Math. However, unexpectedly, the data also
0
1
2
3
4
5
6
7
0 0.5 1 1.5 2 2.5 3 3.5 4
Ach
ieve
me
nt
Gap
Po
siti
on
Level of Equity Integration
Reading
0
1
2
3
4
5
6
7
0 0.5 1 1.5 2 2.5 3 3.5 4
Ach
ieve
me
nt
Gap
Po
siti
on
Level of Equity Integration
Math

49 | M i l e s
show that the higher the level of equity integration, the wider the racial achievement gap is likely
to be in Reading. Both the correlations are weak.
Nationally-recognized districts: Demographics
For comparative purposes, I also wished to determine whether student performance data
was impacted by race equity PD in districts across the country, particularly those that are
acknowledged as top-ranking or high-achieving in some way. As such, I initially chose to study
the top four districts as ranked by Forbes and The Broad Foundation, both of whose processes
for determining top-ranking schools are detailed in the Methodology chapter.
For the top four districts as ranked by Forbes and The Broad Foundation, I gathered
demographic data by race and special population (Free and Reduced Meals (FRM), English as a
Second Language (ESL), and Special Education (SpEd)). Data points also included whether or
not the district had a board-adopted equity policy, whether or not they reported providing race
equity PD to their teachers and central office staff, and their racial achievement gap trends.
However, after gathering the data, it was clear that the districts ranked by Forbes would be of
little use to this study, as they were all largely homogeneously White, none were found to offer
race equity PD to any staff group, and, given the lack of diversity in their student populations,
there was insufficient data from which to draw any conclusions about the racial achievement gap
trends. Therefore, the Forbes districts‘ data was not be used in this study, but is included in the
appendices.
Exhibit 11 shows racial and special population demographic percentages for the Broad-
ranked schools, as well as their inclusion of race equity policies and PD. The data in this exhibit
shows that all districts have more than 60% students of color, all have racial equity policies, and all
provide race equity PD to at least some employee groups.

50 | M i l e s
Exhibit 11
: Demographics and Additional Information for Top Schools as Ranked by the Broad Foundation
Total
Students FRM ELL SpEd White Black Hispanic Asian
Native
American
Equity
Policy?
Other
equity/di
versity
policies?
Equity
PD?
Miami-Dade
County Public
Schools 347,366 70.1% 17.8% 10.9% 8.6% 24.5% 65.0% 1.2% 0.1% Yes Yes
For
teachers
Corona-Norco
Unified School
District 53,149 43.6% 15.3% 11.3% 31.0% 6.3% 50.3% 9.9% 0.3% Yes Yes
Mostly
teachers
and
principals,
some
admin
Houston
Independent
School District 204,245 50.9% 27.5% 8.0% 7.8% 26.2% 61.9% 3.2% 0.2% Yes Yes
For
teachers
Palm Beach
County School
District 174,663 51.0% 10.5% 15.0% 36.5% 28.7% 28.2% 3.1% 0.6% Yes Yes
For
teachers,
admin, and
others
Average: 194,856 53.9% 17.8% 11.3% 21.0% 21.4% 51.4% 4.4% 0.3%
Note: Houston did not report ELL data for 2011. The data reported in this table is from 2010.
Exhibit 12 below provides a graphic representation of the racial demographics of the districts
ranked by Broad. Each district is racially diverse, and all have less than 40% white students.
Exhibit 12: Racial Demographics by Percentage: Broad-ranked Schools
0.0%
20.0%
40.0%
60.0%
80.0%
100.0%
Miami-DadeCounty Public
Schools
Corona-NorcoUnified School
District
HoustonIndependent
School District
Palm BeachCounty School
District
Native American
Asian
Hispanic
Black
White

51 | M i l e s
As Exhibit 12 shows, the greatest percentage of white students in districts ranked by Broad
is 36.5%. Additionally, the Broad districts range in size from 53,000 students (slightly larger than
the largest district in Oregon) to 347,000 students.
Nationally-recognized Districts: Achievement Gap Trends
As I did with school districts in the Portland area, I also wished to observe the racial
achievement gap trend line for the Broad districts and compare the results to local district results.
Exhibits 13-20 on the following pages show performance by students in each district, in Reading
and Math respectively, over time. A trend line is also established for the widest gap between any
two races in each year.
The graphs in Exhibits 13 and 14 below show performance by students in Dade County
Public Schools, in Reading and Math respectively, over time. A trend line is also established for
the widest achievement gap between any two races in each year. Exhibits 13 and 14 show the
widest gap increasing slightly over time in Reading, and decreasing over time in Math in Dade
County Public Schools.
The graphs in Exhibits 15 and 16 show performance by students in Corona-Norco Public
Schools, in Reading and Math respectively, over time. A trend line is also established for the
widest achievement gap between any two races in each year. Exhibits 15 and 16 show a decrease in
the racial achievement gap over time in both Reading and Math in Corona-Norco Public Schools.

52 | M i l e s
Exhibit 13: Dade County Public Schools Racial Achievement Gap Trend: Reading
Exhibit 14: Dade County Public Schools Racial Achievement Gap Trend: Math
0
10
20
30
40
50
60
70
80
90
2007-08 2008-09 2009-10 2010-11
White
Black
Hispanic
Asian
Native American
Widest gap
0
10
20
30
40
50
60
70
80
90
100
2007-08 2008-09 2009-10 2010-11
White
Black
Hispanic
Asian
Native American
Widest gap

53 | M i l e s
Exhibit 15: Corona-Norco Public Schools Racial Achievement Gap Trend: Reading
Exhibit 16: Corona-Norco Public Schools Racial Achievement Gap Trend: Math
0
10
20
30
40
50
60
70
80
90
2009 2010 2011 2012
White
Black
Hispanic
Asian
Filipino
Native American
Widest gap
0
10
20
30
40
50
60
70
80
90
100
2009 2010 2011 2012
White
Black
Hispanic
Asian
Filipino
Native American
Widest gap

54 | M i l e s
The graphs in Exhibits 17 and 18 show performance by students in Houston Independent
School District, in Reading and Math respectively, over time. A trend line is also established for
the widest achievement gap between any two races in each year. Exhibits 17 and 18 show an
essentially flat gap in Reading over time, and a decrease in the Math achievement gap, followed by
an increase in Houston Independent School District.
Exhibit 17: Houston Independent School District Racial Achievement Gap Trend: Reading
Exhibit 18: Houston Independent School District Racial Achievement Gap Trend: Math
0
20
40
60
80
100
120
2008-09 2009-10 2010-11 2011-12
White
Black
Hispanic
Asian
Native American
Widest gap
0
10
20
30
40
50
60
70
80
90
100
2008-09 2009-10 2010-11 2011-12
White
Black
Hispanic
Asian
Native American
Widest gap

55 | M i l e s
The graphs in Exhibits 19 and 20 show performance by students in Palm Beach County School
District, in Reading and Math respectively, over time. A trend line is also established for the widest
achievement gap between any two races in each year. Exhibits 19 and 20 show essentially flat gaps
in both Reading and Math in Palm Beach County School District.
Exhibit 19: Palm County School District Racial Achievement Gap Trend: Reading
Exhibit 20: Palm Beach County School District Racial Achievement Gap Trend: Math
0
10
20
30
40
50
60
70
80
90
2007-08 2008-09 2009-10 2010-11
White
Black
Hispanic
Asian
Native American
Widest gap
0
10
20
30
40
50
60
70
80
90
100
2007-08 2008-09 2009-10 2010-11
White
Black
Hispanic
Asian
Native American
Widest gap

56 | M i l e s
Analysis of National Districts Broad Data
The districts ranked by The Broad Foundation offer insight into the level of equity
integration in nationally-ranked school districts and its potential impacts. All four are large
districts, with populations of students that are more than half students of color. All four have
board-adopted policies specifically addressing race equity in their districts. Additionally, all four
have other policies that prominently feature equity, diversity, and multiculturalism, and specifically
address the provision of an equitable education in their missions, visions, and strategic plans.
While all of these districts offer racial equity PD to their teachers, two of the four offer it to their
principals and other top administrators. Only one district – Palm Beach – offers race equity PD to
staff other than teachers and administrators. Exhibit 21 below shows each Broad-ranked school
district, and its board-adopted policies that prominently emphasize or are specific to race equity.
The policies most common to all districts (mission/vision/philosophy, non-discrimination,
employment practices, race equity, and instructional materials) each have their own column; all
other policies fall into the ―Other‖ category.

57 | M i l e s
Exhibit 21: Equity-related Policies in Broad Schools
School District
Mission/Vision/Philosophy
Non-Discrimination
Employment Practices
Race Equity
Instructional Materials Other Policies
Miami-Dade County X X
X X
• Educational outcomes • Multicultural programs • Access to equal educational opportunity • School counseling • Magnet programs/schools • Professional services and contracts • Charter schools • Wellness
Corona-Norco Unified X X X
X
• Guiding principles • Admission and attendance • Areas of study
Houston ISD X X X X X
• Smart recruitment • Students of color in STEM • Magnet program • Planning and decision-making • Student transfer • Curriculum development • Superintendent qualifications • Equal education
Palm Beach County X X X X X
• Diversity and Equity Committee • Diversity and equitable utilization in business • Eligibility for participation in extracurricular activities • Parent and family involvement
While the sample size of school districts for both local districts and nationally-ranked
districts is far too small to calculate a mathematical correlation with high validity, we can
anecdotally observe trends in student performance. Exhibit 22 shows whether or not each district
offers race equity PD to its teachers and/or central office staff, and the net change in both its

58 | M i l e s
achievement gap in Reading and its achievement gap in Math over time. Finally, the average net
changes in racial achievement gaps in both Reading and Math were calculated across all districts.
Exhibit 22: Equity PD Offerings and Net Changes in Achievement Gaps in Reading and Math
District
Teacher
PD
Central
PD
Δ Ach Gap
Reading
Δ Ach Gap
Math
District A No No -4% -20%
District B Yes Yes -6% -2%
District C Yes Yes -2% 6%
District D No No -10% 18%
District E Yes Yes -7% 9%
District F Yes Yes 3% 13%
District G Yes Yes -4% 5%
Miami-Dade Yes No 2% -4%
Corona-
Norco Yes Yes -3% -3%
Houston Yes No 1% -1%
Palm Beach Yes Yes -1% -2%
Average -3% 2%
Using the information in Exhibit 22, correlations between PD audiences and achievement gaps can
be determined. These are summarized in Exhibit 23:
Exhibit 23: Correlations between PD Recipients and Net Changes in Achievement Gaps
Correlation between teacher PD and Reading gap 0.520747302
Correlation between teacher PD and Math gap 0.132464856
Correlation between central office PD and Reading gap -0.013615001
Correlation between central office PD and Math gap 0.270830823
Correlation between teacher AND central office PD and Reading gap 0.248456064
Correlation between teacher AND central office PD and Math gap 0.231925989
As evidenced by Exhibit 23 above, the strongest correlation between race equity PD and net
change in the achievement gap is between PD provided to teachers and the gap in Reading. In this
case, since the net change is negative, a positive correlation is just that – it indicates that an increase
in race equity PD provided to teachers may help reduce the racial achievement gap in Reading. All
other correlations are statistically weak.

59 | M i l e s
As previously mentioned, no statistically significant conclusions can be drawn from such a
small sample size. However, given that the two Broad districts that saw net decreases in their
Reading achievement gaps were districts that offered racial equity PD to their administrators and
other central office staff, the anecdotal evidence suggests that providing race equity professional
development to principals, administrators, and other central office staff may help reduce the racial
academic achievement gap, particularly in Reading.
An examination of the local Portland metropolitan districts supports this theory. As noted in
Exhibit 22, of the six districts that saw a decrease in their racial achievement gaps in Reading, four
offered race equity PD to teachers, principals, and central office administrators and two offered no
PD to any employee group. The results for Math show the opposite: only two districts saw math
achievement gaps decrease, and one offered race equity PD to teachers, principals, and other central
office administrators, while the other district offered no PD.9 Five districts saw increases in their
racial achievement gaps in Math. Of these five, three offer PD to teacher groups and central office
employees, while one offers PD just to teachers, and one offers no PD. Since it would not be likely
that offering race equity PD to employee groups actually increases the achievement gap, I draw no
conclusion from this piece of anecdotal evidence.
Race Equity Training Programs
Race equity training programs offered by experienced consultants or experts in the field
provide an important path to organizational change with respect to race equity, especially for public
school districts. Furthermore, while many of them differ to some extent in approach or philosophy,
they also aligned in several key ways. In order to suggest the critical components of a race equity
professional development program for public school district central office staff, I studied five
9 See also Exhibits 9 and 10 for this correlation.

60 | M i l e s
Portland-area organizations that offer race equity training. Their foci, methods, and target audiences
are presented in Exhibit 24 below. Each category (with the exception of the target audience and the
training methods) was a discrete, qualitative variable, and all applicable categories were indicated
for each training organization by checking the corresponding box. This allowed me to determine
the most common elements shared by the PD providers.
As Exhibit 24 shows, those programs that are focused specifically on K-12 education are
also the only programs that specifically address race. The third program that focuses on race does
include K-12 educators and higher education, but is not specifically designed to be exclusive to
education. All other programs have a focus on equity, cultural responsiveness, inclusivity,
privilege, and diversity, which can be – but are not necessarily – race-related.
As Exhibit 24 shows, the three programs that are in some way tailored to training educators,
only Pacific Educational Group (PEG) notes that ―all staff‖ are part of its target audience. Even
still, the books written by the President and founder of PEG that are meant to accompany its
Courageous Conversations about Race training tend to downplay the role of central office staff in
district-wide race equity professional development. The first book, Courageous Conversations
about Race (2006), notes that ―[w]hen only a few people in a school system are examining race,
sustainable changes that impact overall results will not occur‖ (p. 230). Yet, the book, while used
for administrators and management, is largely targeted to educators and ―those with significant
institutional power‖ (Singleton G. E., 2006, p. 245). The second book in this program, More
Courageous Conversations about Race (2013), does discuss the importance of ―District Equity
Leadership Teams (DELTs)‖, and includes a section on central office department leaders. Even
still, the heaviest focus is on leaders and department managers – not central office staff as a whole.
(Singleton G. E., 2013, pp. 198-199)

61 | M i l e s
Exhibit 24: Foci, Methods, and Target Audiences of Portland-area Race Equity Training Programs
Organization
Focus
on
Equity
Focus on
Cultural
Responsiveness
and Inclusivity
Focus
on
Privilege
Focus on
Diversity
Specific
Focus on
K-12
Education
Focus
on
Race
Target
Audience
Training
Methods Notes
Pacific
Educational
Group
X
X
X
X
X
X
School district
administrators,
principals,
teachers, all
staff, parents,
community
members
Foundation
course
(Beyond
Diversity),
followed by 5
phases. Also
offers
summit,
seminars,
conferences,
small group,
online, and
train the
trainer
Focus on
transformational
leadership and
systemic,
institutionalized
racism and racist
practices. Operates
under Four
Agreements and Six
Conditions.
Intercultural
Communication
Institute
X
X
X
X
Teachers,
trainers,
internal and
external
consultants,
non-profit
professionals,
managers,
others
1,3, and 5-day
workshops
and seminars,
fellows
program,
graduate
degree
program,
certificate
program
Non-profit charity
started at Stanford
University. Focus on
ethical commitments
in intercultural,
cross-cultural,
multicultural, and
international
communication.
Diversity
Training
Associates
X
X
X
X
Not specified
Individual
and group
assessments,
multicultural
toolkit
Focus on equality vs.
equity, cultural
competence,
appropriateness,
sensitivity, and
diversity. Toolkit
presents stages of
individual growth in
equity work.
Center for
Diversity and
the Environment
X
X
X
X
Staff and board
members
Individual
and group
trainings,
Environment
2042
Leadership
Program
cohort, 2042
Today:
Young
Leaders Re-
imagining
Conservation
cohort, 2-day
retreat, equity
audits, needs
assessments
Focus on equity,
power, and privilege,
especially in
environmental work
and advocacy.
Coaching is action-
oriented, focused on
sustainability and
relevance.

62 | M i l e s
Organization
Focus
on
Equity
Focus on
Cultural
Responsiveness
and Inclusivity
Focus
on
Privilege
Focus on
Diversity
Specific
Focus on
K-12
Education
Focus
on
Race
Target
Audience
Training
Methods Notes
Center for
Educational
Equity
X
X
X
X
X
X
Educators,
school board
leaders,
community
members
Coaching for
Educational
Equity - 5-day
residential
seminar,
Taking it Up -
2-day
seminar,
Coaching
from the
Inside Out -
2-day
overnight
seminar,
workshops,
coaching, PD
development
Focus on systemic
racism, values, and
educational
inequities, policies,
practices, and
curriculum through
an inclusive lens,
micro-aggressions,
lens of whiteness,
and dominant culture.
Horizon
Counseling
Services
X
X
X
X
X
K-12
communities,
Higher Ed,
businesses,
non-profits,
government
agencies, faith-
based
communities,
health and
wellness
organizations,
teachers,
counselors,
school
administrators
Individual
and group
coaching and
training
Focus on anti-
oppression, equity
among PLCs, and
change agents for
equity and diversity.

63 | M i l e s
Chapter V: Conclusion
I began this study with the following hypothesis: Public school district organizational
performance with respect to mission-driven work will be improved when race equity professional
development is expected of all school district employees, including central office staff. Was the
hypothesis proven? The data are mixed. Data for local districts suggest that the racial
achievement gap in Math may be reduced by a higher level of ―equity integration‖ in a district,
which includes providing race equity PD to central office staff. This may be due to a greater
understanding by all district personnel of how to choose culturally competent curriculum,
provide culturally responsive instruction, and target supports for struggling students in a more
equitable fashion. Yet an analysis of the achievement gap in Reading showed the opposite, which
may indicate increased complexities for teaching English Language Arts, choosing curriculum,
and providing structured supports. Conversely, a study of data for nationally-recognized districts
showed the strongest correlation between the provision of race equity PD to teachers and a
reduction in the achievement gap in Reading. Race equity training programs showed a heavy
common focus on cultural responsiveness, equity, diversity, and privilege, but half avoided
talking about the issue of race directly. Fewer still offered a specific focus on K-12 education.10
There is ―significant research that indicates there is a positive relationship between
leadership and student achievement‖ (McKenzie & Scheurich, 2004, p. 603). Additionally,
―[p]rincipals know that they, alone, cannot make systemic change on their campus. They need
advocates‖ (McKenzie & Scheurich, 2004, p. 627). Leadership, of course, does not rest only
with principals, administrators, executive management, or department heads; every employee in
a school district has the opportunity to ―lead from where they sit‖. Research points to a strong
correlation between district practices and student success and district effectiveness (Southern
10
See Exhibit 24.

64 | M i l e s
Regional Education Board, 2010; Park and Datnow, 2009), yet ―…limited attention has been
given to the mental models held by the central office…about the tasks of leadership‖ (Chrispeels,
Burke, Johnson, & Daly, 2008, p. 747).
The ―…traditional factors that are thought to determine organizational effectiveness [are]
leadership, commitment to mission, resources, and political support‖ (Dubnick & Frederickson,
2011, p. 54). Yet, ―[o]rganizational performance, perhaps especially in the public sector, is open
to a variety of interpretations and is politically contestable‖ (Andrews, Boyne, & Walker, 2011,
p. 235). Different stakeholder groups – both internal and external – may have distinct and
divergent, even conflicting, ideas of what it means to improve organizational performance.
School principals may cite student achievement as a key indicator, while the head of the
accounting department may hold a clean municipal audit in the highest esteem. The human
resources department may pride itself on low employee turnover and absences, while the
transportation department may aim for cost savings on fuel and mechanical efficiencies. All are
valid considerations when looking at performance outcomes, and all are department-specific.
Yet, each of these measures also falls under the umbrella of any school district‘s mission: to
serve and educate all students. And data indicates that, even when other factors such as
socioeconomic status are considered, student achievement is still predictable by race, and Black
and Brown students consistently perform worse than their White counterparts on standardized
tests (Singleton G. E., 2013, pp. 74-77). In any case, the tendency for public organizations and
their employees to default to managerial, technical solutions combined with conflicting political
views about how to measure success necessitates an organization-wide moral foundation into
which even the most far-flung departments can ground themselves. This foundation should be
meaningful to all parts of the organization and its external stakeholders. In a public school
system, this foundation can – and should – be racial equity.

65 | M i l e s
All employees in a public school system have a responsibility not only to examine their
own personal cultural identity and how their assumptions associated with this identity impact the
service they provide, but to examine the service provided by the entire department, and how this
service impacts or interacts with student education. In other words, each employee, no matter
how distant from a school building, is a critical component of the provision of education.
Therefore, if race has been shown to be a major factor in predicting student achievement, then
effective organizational change and development must be ―…focused on the organization in its
entirety, [including] the management, the subordinates, and also the practices and systems
prevailing within the workplace and the objectives set by the organization‖ (Gutierrez, Kruzich,
Jones, & Coronado, 2000, p. 67). Furthermore, a systemic, ―…organizational change approach
is…necessary to diversity integration‖ (Doyle & George, 2008, p. 100).
Still, when designing a race equity professional development program for central office
staff, it is wise to consider that ―…practices that fit one type of organizational culture may not be
suitable for other systems‖ (Hite & McDonald, 2006, p. 366). In other words, race equity
professional development for teachers and school staff might – and should – look different than
race equity professional development for central office staff.
The data in this study suggest at least weak (but present) correlation between race equity
PD in public school districts and the narrowing of racial student achievement gaps, particularly
when the PD is offered to teachers, principals, and central office staff. Additionally, literature
on organizational development describes a need for a systemic approach to organizational
change. Finally, a wealth of literature and studies provide evidence that, in large part, even the
passive, seemingly innocuous behaviors and beliefs of privileged groups contribute to the
continued disenfranchisement and oppression of historically underprivileged groups. In the case
of public education, these underprivileged, underserved groups are our students of color, who

66 | M i l e s
have higher drop-out rates, higher rates of expulsion, and higher referral rates to Special
Education than White students. A system can only change if the entire system changes. With
those observations in mind, on the following pages, I propose the critical components of a race
equity professional development program for public school district central office staff, which I
developed from a synthesis of information from the literature, personal interviews with race
equity experts, and existing materials and publications from race equity PD providers.
Components of a race equity PD program for public school district central office
staff
The following components for a race equity PD program were abstracted from my three
literature reviews summarized in Chapter 2. I consolidated the recommendations and best
practices found in the literature on race equity training for teachers and school administrators,
literature on race equity and organizational performance, and the literature on the moral and
ethical role of education in a democratic society.
Component 1: Needs assessment
A needs assessment should be undertaken before individual or race equity work begins in
earnest. A needs assessment should be specific to the role of a central office employee, and
perhaps, if resources allow, specific to the department (budget, HR, contracting, etc.) This
assessment should include:
1. The range of needs and issues (Taute & Taute, 2012)
2. Data, including, at minimum, student demographics, district employee demographics,
central office and/or department demographics, student performance, and any data
associated with the services provided by the central office and/or department. All
data should be disaggregated by race whenever possible. (Singleton G. E., 2006;)

67 | M i l e s
3. A rationale for resource allocation to meet the stated goals (RMC Research
Corporation, 2008)
4. An agreement of participation in the work to come by all central office staff in all
departments.
Component 2: Adopt and Adapt
In districts that already provide race equity PD to their teachers, principals, and/or other
administrators and department heads, central office departments should be given the same access
to the trainings and other materials associated with these PD programs. Districts that have not
adopted any race equity PD should do so, and provide it to all employees from the beginning. If
a district has adopted a PD program that is specific to education, however, it should be noted that
the major providers of this PD that have tailored their programs to educational settings are also
heavily focused on teachers and school-based employees. Research has found that ―…resistance
to this type of work…may actually [be] evidence of the need for more effective differentiation‖
in the PD that is provided (Singleton G. E., 2013, p. 20). This will require adaptation of the
material and the program to the specific role of central office employees. At the core, however,
any adopted race equity PD program should include many of the same components as a program
designed for school staff and principals:
A focus on race as a major part of individual and group study
A transformational, systemic approach that explicitly acknowledges the role that central
services plays in student achievement
Individual work in identifying, accepting, and relating to one‘s own cultural identity
Addressing the normalization of ―Whiteness‖ and the ―othering‖ of other races
Locating the difference between equity and equality

68 | M i l e s
Deep examination of power and privilege as related to race11
Component 3: Examine the impact
Perhaps the most critical component in developing or adopting a race equity professional
development program for central office staff is to ensure that each staff member can identify
clearly how his or her work and the work of the department connects to students and, thereby,
student achievement (Minzghor, 2013; Bigay-Salter, 2013). Central office supports, of course,
do impact students; these are the employees who allocate funding, that hire teachers, that make
decisions about curriculum, that contract with external entities, and that assist families in
navigating the school system, to name a few. However, as the quotation at the beginning of the
Introduction suggests, individual employees (and even entire departments) can become isolated
in their work and lose their connection to students – particularly in an office environment that is
not frequently accessed by students. In fact, one researcher found that, in one district, even some
Assistant Superintendents who were not directly connected to curriculum and instruction ―did not
reveal a clear connection between their work and the business of creating effective teaching and
learning‖ when interviewed (Southern Regional Education Board, 2010, p. 19). Most central offices
are run not like schools, but like businesses, and, unlike schools which have no direct equivalent
in other public organizations, most central office functions (such as Human Resources, Payroll,
Contracting, Budgeting, etc.) are not only common but necessary in other public and private
organizations. This only emphasizes the critical imperative to ensure that the relation between
central supports and students is regularly revisited.
Glenn Singleton asserts that ―[p]rincipals and central office department managers play a
huge role in guiding…transformation of beliefs and behaviors‖ with respect to race equity
11
Several components were derived from the publications and websites of a number of equity PD providers,
including: Horizon Counseling Services, Pacific Educational Group, Diversity Training Associates, Intercultural
Communication Institute, Center for Diversity and the Environment, and the Center for Educational Equity. The
programs of some providers were more relied upon more heavily than others.

69 | M i l e s
professional development (Singleton G. E., 2013, p. 199). I propose that managers and other
heads of departments need not be the only influential individuals charged with leading the work
of race equity. Each employee must be instilled with the responsibility of leading his or her own
work, and the right to lead I. In fact, Singleton argues that the capacity for race equity work
must be deeply developed ―…if it is to survive and be sustained during times of extraordinary
change, such as budget reductions, personnel transitions, or political backlash‖ (Singleton G. E.,
2013, p. 23). And to do this authentically, each staff member must understand and believe in the
way in which his or her work impacts students.
Component 4: Organizational development and performance measures
Given that the very nature of the work of central office employees generally removes
them from daily, direct contact with students, it is important to acknowledge the differences in
the work of a central office staff person vs. that of a teacher or principal, while also validating
the importance of this work as a service to students. It is critical to remember that while
―…education was the target of performance-based reform movements long before other public
services came under similar scrutiny‖ (Nicholson-Crotty, Theobald, & Nicholson-Crotty, 2006,
p. 103), no measure of performance or effectiveness to date has been so definitive as to become
the standard. That said, since, by definition, the work of central office employees on the whole
tends to include large number of bureaucratic and/or business processes compared to the work of
instructional staff, it is appropriate to consider any included organizational performance
measures as reflective of the distinct work of central office staff, as well as of total
organizational change and development.
Dubnick and Frederickson argue that
[t]he assumed positive relationship between performance measurement and innovation
implies a more fundamental belief that such measures can, if appropriately designed and
applied, be used to strategically change the organization or program so that it is better

70 | M i l e s
able – particularly through differentiation – to contend with an otherwise complex
environment and uncertain/risky future (Dubnick & Frederickson, 2011, p. 38).
Differentiation is key here. It is important not only to consider the role of race equity in public
education as distinct from that of other public service arenas, but also that the role of the central
office in contributing to an overall culture of equity in a public school district is complementary,
but distinct, as well. Each department should align its work to the mission of the district and
explicitly define its role in serving students. This alignment should always be at the forefront of
the race equity work.
It is also essential to remember that, while some of the key reasons that other kinds of
public organizations take up race equity work are to comply with the law or because of some
external pressure to do so, as an educational organization, the district as a whole has a moral and
ethical obligation to do so, and each department is beholden to that obligation. Any wavering on
this front necessitates further clarification of the role of the central office and the departments
within it, and how these pieces of work connect to student achievement.
Because adoption of a race equity PD program and the implementation of it are two
discrete processes, they must each be explicitly defined. Adoption is the ―development of a
capacity to act‖ and includes ―measures of outputs, outcomes, and efficiency.‖ Implementation,
on the other hand, ―…represents knowledge converted into action [and] refers to the actual use of
performance measures for strategic planning, resource allocations, program management,
monitoring, [and] evaluation….‖ (de Lancer Julnes & Holzner, 2001, p. 695). As such,
departments may find it useful to use performance measures to track and measure the
effectiveness of their race equity PD program on their work outputs – work that affects student
learning and achievement.

71 | M i l e s
The most common performance measures that surfaced in the literature were
―assessments, interviews, evaluations, behavior observation, action plans, problem identification
and resolution, strategic planning, selection, training and development, and change management‖
(Taute & Taute, 2012, p. 64). Performance measures, however, should be carefully approached,
as the risk inherent to employing them is that of shining a bright light on sustained, systemic
inequities, and may spark resistance from participants (de Lancer Julnes & Holzner, 2001).
Furthermore, what is actually being measured is just as critical to define as is how it will be
measured. By contrasting the theory of what a performance measurement approach should do
vs. what it often does in practice when unfittingly applied, Dubnick and Frederickson (2011)
present a summary in Exhibit 25 of potential unintended consequences that can result by
improperly measuring performance, and the alignments (or lack thereof) between accountability
measures and their effectiveness in theory and in practice.12
:
Exhibit 25: Comparison of Theory and Practice in Performance Measurement
Accountability
In Theory In Practice
What to measure: The important
The results
The outcomes
The measurable
Surrogates of results
Processes
Performance measures show
programs that often:
Perform poorly Perform poorly, but things
would be worse without them
Performance measurement
results in:
Strategic differentiation
The diffusion of best practices
Isomorphism
Reflected status
(Dubnick & Frederickson, 2011, p. 31)
Given that the ―growing literature on innovation…points to a positive relationship
between an organization‘s innovation capacity and real changes (often real advances) in products
12
This is a partial view of the complete table that Dubnick and Frederickson present. There are five additional
accountability measures in the table that are not relevant for this study.

72 | M i l e s
and production processes‖, these distinctions between performance measures in theory and in
practice must be kept in mind and carefully monitored, if the systemic integration of race equity
PD is to be measured for results (Dubnick & Frederickson, 2011, p. 33). Finally, any
performance measurements should continue to reflect the purpose of the initiative and the people
involved – an area in which teacher and school-based staff groups will necessarily differ from
central office employee groups. These measures, when used most effectively, are not for
punitive purposes, but to help identify and sharpen questions meant to lead to deeper exploration
(Dubnick & Frederickson, 2011).
Component 5: Transformation and sustainability
Finally, building capacity for racial equity takes time. It also requires vulnerability,
flexibility, adaptability, and an authentic investment of emotional energy. Critical race theorists
argue that ―…racially informed relations of power are fixed in the seemingly objective social
languages, especially those associated with science, popular culture, and the media that
administrators, teachers, and students employ‖ (Duncan G. A., 2002, p. 131). Race equity work
involves deconstruction of deeply-embedded assumptions and behaviors, confronting White
privilege, and examining one‘s own core beliefs. At times, this practice can be discouraging, at
best. One researcher even ―…cautions that Whites who try to become more knowledgeable
about white racism and who try to disrupt it will likely be encouraged to abandon their pursuits
by their white peers‖ (Marx, 2004, p. 41).
Individual employees taking part in race equity work must be personally prepared not
only for transformation of their own assumptions and belief systems, but to sustain the necessary
discomfort that accompanies this work, despite the temptation to set it aside in favor of
something ―easier‖. Race equity work must not be presented or interpreted as an ―activity‖ or
73 | M i l e s
something one ―does‖ during a meeting, but as a reframing of thought and belief – as a true
change of heart. Ways to ensure continuity and sustainability for a race equity program can
include:
Development of specific, measurable goals and action plans
A reasonable timeframe for follow-up on goals and action plans
Regular meeting times for group members
Book studies and the use of articles/literature about race equity work
Using data whenever possible, including examining student data13
In addition to the personal resources with which each staff member must be equipped, the
district must allocate sufficient financial and personnel resources to sustain this work over time,
and provide it systemically to all employees. Failure to do so – that is, providing disjointed,
infrequent, or one-time workshops, or excluding some employee groups from the work –
threatens to result in ―…pockets of excellence rather than systemic and systemwide
transformation.‖ (Singleton G. E., 2013, p. 163) Worse yet, it holds the potential to cause the
work toward equity in the rest of the district to completely crumble when faced with the
intractable perpetuation of the norm – ―…the racial politics that are intrinsic, even vital, to the
day-to-day functions of US society and social institutions such as schools‖ (Duncan G. A., 2010,
p. 131).
Future Research
Due to time and resources available, the scope of this study was necessarily limited. It
would behoove any researcher seeking to expand upon this topic to increase the sample size of
13
Several of these components were derived from the publications and websites of a number of equity PD providers,
including: Horizon Counseling Services, Pacific Educational Group, Diversity Training Associates, Intercultural
Communication Institute, Center for Diversity and the Environment, and the Center for Educational Equity.

74 | M i l e s
districts surveyed, and to expand the reach of the survey in order to gather specific data about the
type, form, and structure of the race equity work offered to teaching and central office staff. It
would also be advisable to limit the uncontrolled variables in the study, so that any correlations
between the implementation of race equity PD and student performance could be statistically
substantiated.
Finally, this study comes with a challenge to providers of race equity PD programs whose
focus is on K-12 public education. Schools do not operate in isolation; they are part of an entire
system of student supports that must ―…act as coordinated units of change‖ together with the
central office (Chrispeels, Burke, Johnson, & Daly, 2008, p. 730). With the student at the center,
each department in the central office and all schools in the district can be seen as points on a web
– all delicately interconnected to each other and to the student. As such, the central office cannot
be included in race equity PD as an afterthought, or as an obscure part of the whole, with little
attention paid its specific needs, or to the services that it provides. More research should be done
on the impact the central office has on school management and performance, and student
achievement. Then, using that research, race equity PD providers should differentiate teaching
and school staff from central office employees, and develop training programs specifically
tailored to those two distinct groups and their unique circumstances. Only then will districts be
able to equitably implement race equity work across the district, and strive for systemic,
sustained change for students.
Leadership implications of the study
This project sprang out of my passion for equity in education – a passion that has
continued to be kindled by the EMPA program, my professors, and my fellow cohort members.

75 | M i l e s
As such, this capstone reflects just some of the important, necessary work that is still undone in
public education – work that must be done if this country ever wishes to proudly proclaim that it
provides stellar education to all of its children, regardless of race. Together with my
professional experience, the EMPA program has helped me hone and refine my desired career
trajectory, which, I know now, will always be in public service and, quite possibly, public
education. Through the EMPA program, I have discovered a passion for policy and politics, and
the opportunities provided to experience both of those realms have been enriching and fulfilling.
This capstone is informed by those experiences and learning opportunities, as well as by my
ethical framework, which has been influenced and supported by the EMPA program.
As a leader in my current profession, my focus is on equity for all students. Through
identifying a need for central office staff in public school districts, as critical members of their
organizations, to have access to race equity work in order to create true systemic organizational
change, my goal was to build a foundation for differentiating this work for central office staff,
and to encourage local school districts and race equity PD providers to adopt the critical
components I have proposed, regardless of how they go about providing the training. While the
literature indicates both the benefits and the risks of measuring performance in public
organizations, in the case of race equity, efficiency and effectiveness on their own are less
important than serving as a moral exemplar for society. This moral exemplification role is
common in public services; it can be seen in everyday illustrations such as: veterans‘ preference,
disability services and ADA requirements, the preservation of endangered species, and
environmentally conscious/green practices. These examples are about much more than simply
obeying the law; they are about unity under a common moral purpose. In essence, they
exemplify the values of citizenship in a global community. In public education, there is nothing
of greater importance than the equitable provision of education to all students, such that no

76 | M i l e s
student‘s race should determine her fate. I submit this project with the hope that it may serve the
greater purpose of equity in education.
Summary
While there is an abundance of literature about the importance of race equity training for
teachers and school staff, there is a dearth of research on race equity PD for central office and its
impact on students, or even its importance. Initial, anecdotal evidence from this study indicates
that there may be a correlation between the provision of race equity PD to a district‘s entire staff
and a reduced achievement gap in Reading, but more research is needed. However, the greatest
impetus for my assertion that districts should provide race equity PD to central office staff is that
the public school system has a moral and ethical obligation to provide an equitable education for
all students, and this obligation, in the vast majority of cases, requires substantive and deep
organizational change. This kind of full-scale change, however, cannot be accomplished
without: assessing the needs of the whole organization with respect to race equity; adopting or
developing a PD program and adapting it to the various employee groups it will serve;
continuously revisiting the connections between the daily work of the individual/department and
student success; implementing or creating appropriate organizational performance measures; and
preparing for sustainment of the PD program, and for organizational transformation.
Emerson wrote, ―[t]he great object of Education should be commensurate with the object
of life.‖14
This, arguably, should still be the chief object of education. If we expect our country‘s
children to be prepared to engage in meaningful, positive community membership, then we owe
them an equitable education which does not benefit one child over another by race. We must
14
From his ―Essay on Education‖.

77 | M i l e s
eliminate the predictability of student success by race, and the gaps in learning and opportunity
that fall along racial divisions. To do this, we must make ourselves students and learners in our
own trade, and engage ourselves in rigorous education on the inequities that exist in the public
school system and how we may, as whole school districts, eradicate them. Then and only then
will we deliver on the great promise of equal and equitable education for all students.

78 | M i l e s
Works Cited
Andrade, R., & Rivera, A. (2011). Developing a diversity-competent workforce: The UA
Libraries' experience. Journal of Library Administration, 51(7-8), 692-727.
Andrews, R., Boyne, G., & Walker, R. (2011). The impact of management on administrative and
survey measures of organizational performance. Public Management Review, 13(2), 227-
255.
Benschop, Y. (2001). Pride, prejudice, and performance: Relations between HRM, diversity, and
performance. The International Journal of Human Resource Management, 12(7), 1166-
1181.
Bigay-Salter, J. (2013, May 16). The components of a race equity professional development
program for school district central office staff. (K. Miles, Interviewer)
Blitz, L. V., & Kohl Jr., B. G. (2012). Addressing racism in the organization: The role of white
racial affinity groups in creating change. Administration in Social Work, 36(5), 479-498.
Bottoms, G. S.-D. (2010). The three essentials: Improving schools requires district vision,
district and state support, and principal leadership. Atlanta: Sountern Regional
Education Board.
Broad Foundation, The. (n.d.). The Broad Prize for Urban Education. Retrieved March 27, 2013,
from The Broad Prize for Urban Education: http://www.broadprize.org/
Brown, O. S., & Peterkin, R. S. (1999). Transforming public schools: An integrated strategy for
improving students academic performance through districtwide resource equity,
leadership accountability, and program efficiency. Equity & Excellence in Education,
32(3), 37-52.
Bulkley, K. E. (2013). Conceptions of equity: How influential actors view a contested concept.
Peabody Journal of Education, 88(1), 10-21.
Buttner, E. H., Lowe, K. B., & Billings-Harris, L. (2009). The challenge of increasing minority-
group professional representation in the United States: Intriguing findings. The
International Journal of Human Resource Management, 20(4), 771-789.

79 | M i l e s
Carter, P. L. (2009). Equity and empathy: Toward racial and educational achievement in the
Obama era. Harvard Educational Review, 79(2), 287-298.
Chapman, T. (2007). Desegregation and multicultural education: teachers embracing and
manipulating reforms. Urban Review, 40, 42-63.
Chrispeels, J. H., Burke, P. H., Johnson, P., & Daly, A. (2008). Aligning mental models of
district and school leadership teams for reform coherence. Education and Urban Society,
40(6), 730-750.
de Lancer Julnes, P., & Holzner, M. (2001). Promoting the utilization of performance measures
in public organizations: An empirical study of factors affecting adoption and
implementation. Public Administration Review, 61(6), 693-708.
Doyle, R., & George, U. (2008). Achieving and measuring diversity: An organizational change
approach. Social Work Education: The International Journal, 27(1), 97-110.
Dubnick, M. J., & Frederickson, H. G. (2011). Public accountability: Performance
measurement, the extended state, and the search for trust. Dayton, Ohio: The Kettering
Foundation.
Duncan, G. A. (2010). Beyond love: A critical race ethnography of the schooling of adolescent
black males. Equity & Excellence in Education, 35(2), 131-143.
Forbes, I. (n.d.). Best and Worst School Districts for the Buck. Retrieved March 22, 2013, from
Forbes.com: http://www.forbes.com/2007/07/05/schools-taxes-education-biz-
beltway_cz_cs_0705schools.html
Gregory, A., & Mosely, P. M. (2004). The discipline gap: Teachers' views on the
overrepresentation of African American students in the discipline system. Equity &
Excellence in Education, 37(1), 18-30.
Gutierrez, L., Kruzich, J., Jones, T., & Coronado, N. (2000). Identifying goals and outcome
measures for diversity training. Administration in Social Work, 24(3), 53-70.

80 | M i l e s
Hite, L. M., & McDonald, K. S. (2006). Diversity training pitfalls and possibilities: An
exploration of small and mid-size US organizations. Human Resource Development
International, 9(3), 365-377.
Leavell, A. G., Cowart, M., & Wilhelm, R. W. (1999). Strategies for preparing culturally
responsive teachers. Equity & Excellence in Education, 32(1), 64-71.
Lee, J. (2012). Educational equity and adequacy for disadvantaged minority students: School and
teacher resource gaps toward national mathematics proficiency standard. The Journal of
Educational Research, 105, 64-75.
Levine, C. H. (1984). Citizenship and service delivery: The promise of coproduction. Public
Administration Review, 178-187.
Marx, S. (2004). Regarding whiteness: Exploring and intervening in the effects of white racism
in teacher education. Equity & Excellence in Education, 37, 31-43.
McKenzie, K. B., & Scheurich, J. J. (2004). Equity traps: A useful construct for preparing
principals to lead school that are successful with racially diverse students. Educational
Administration Quarterly, 40(5), 601-632.
Miller, W. H., Kerr, B., & Ritter, G. (2008). School performance measurement: Politics and
equity. The American Review of Public Administration, 38(1), 100-117.
Minzghor, K. (2013, May 16). The components of a race equity professional development
program for school district central office staff. (K. Miles, Interviewer)
Nicholson-Crotty, S., Theobald, N. A., & Nicholson-Crotty, J. (2006). Disparate measures:
Public managers and performance-measurement strategies. Public Administration
Review, 101-113.
Niesche, R., & Keddie, A. (2011). Foregrounding issues of equity and diversity in educational
leadership. School Leadership & Management, 31(1), 65-77.
Park, V., & Datnow, A. (2009). Co-constructing and distributed leadership: district and school
connections in data-driven decision-making. School Leadership & Management, 29(5),
477-494.

81 | M i l e s
Pitts, D. W. (2007). Implementation of diversity management programs in public organizations:
Lessons from policy implementation research. International Journal of Public
Administration, 30(12-14), 1573-1590.
Quiroz, P. A. (2013). Marketing diversity and the 'new' politics of desegregation: overview of an
urban education ethnography. Race, Ethnicity, and Education, 16(1), 59-79.
Rice, J. K. (2004). Equity and efficiency in school finance reform: Competing or complementary
goods? Peabody Journal of Education, 79(3), 134-151.
RMC Research Corporation. (2008). A guide for comprehensive needs assessment. Phoenix:
Southwest Comprehensive Center at WestEd.
Rocha, R. R., & Hawes, D. P. (2009). Racial diversity, representative bureaucracy, and equity in
multiracial school districts. Social Science Quarterly, 90(2), 326-344.
Shore, S. (2006). (Re)thinking equity: The spatial and racial dynamics of managing learning and
learning to manage. Journal of Vocational Education & Training, 58(4), 497-513.
Singleton, G. E. (2006). Courageous Conversations About Race. Thousand Oaks: Corwin Press.
Singleton, G. E. (2013). More Courageous Conversations about Race. Thousand Oaks: Corwin.
Southern Regional Education Board. (2010). The three essentials: Improving schools requires
district vision, district and state support, and principal leadership. Atlanta: Southern
Regional Education Board.
Stiefel, L., Schwartz, E., & Berne, R. C. (2005). School finance court cases and disparate racial
impact: The contribution of statistical analysis in New York. Education and Urban
Society, 37(2), 151-173.
Taute, W., & Taute, F. (2012). Organizational development: A supplement for the effective
organization. Journal of Workplace Behavioral Health, 27(2), 63-78.

82 | M i l e s
Appendix
Exhibit 1-A: Demographics and Additional Information for Top Schools as Ranked by Forbes
Total
Students FRM ELL SpEd White Black Hispanic Asian Native
Amer
Equity
Policy?
Other
equity/di
versity
policies?
Equity
PD?
Falmouth
Public
Schools
2110 4.8% 1.3% 9.8% 93.6% 1.8% 1.0% 1.1% 0.7% No Yes None
found
Mercer Island
School
District
4223 3.3% 1.5% 9.5% 73.9% 1.3% 2.6% 19.8% 0.4% No Yes None
found
Pella
Community
School
District
2271 19.4
%
1.8% 11.1% 94.8% 1.5% 1.6% 3.8% 0.1% No Yes None
found
Barrington
School
District
3498 4.4% 0.8% 12.7% 92.2% 0.7% 0.8% 4.0% 0.3% No Yes No
Average: 3025.5 7.98
%
1.35% 10.78% 88.63% 1.33% 1.50% 7.18% 0.38%
Exhibit 2-A: Racial Demographics by Percentage: Forbes-ranked Schools
Note: Pella Community School District had too few students in racial groups other than White to produce racial
achievement gap data.
0.0%
20.0%
40.0%
60.0%
80.0%
100.0%
FalmouthPublic
Schools
MercerIslandSchoolDistrict
PellaCommunity
SchoolDistrict
BarringtonSchoolDistrict
Native American
Asian
Hispanic
Black
White
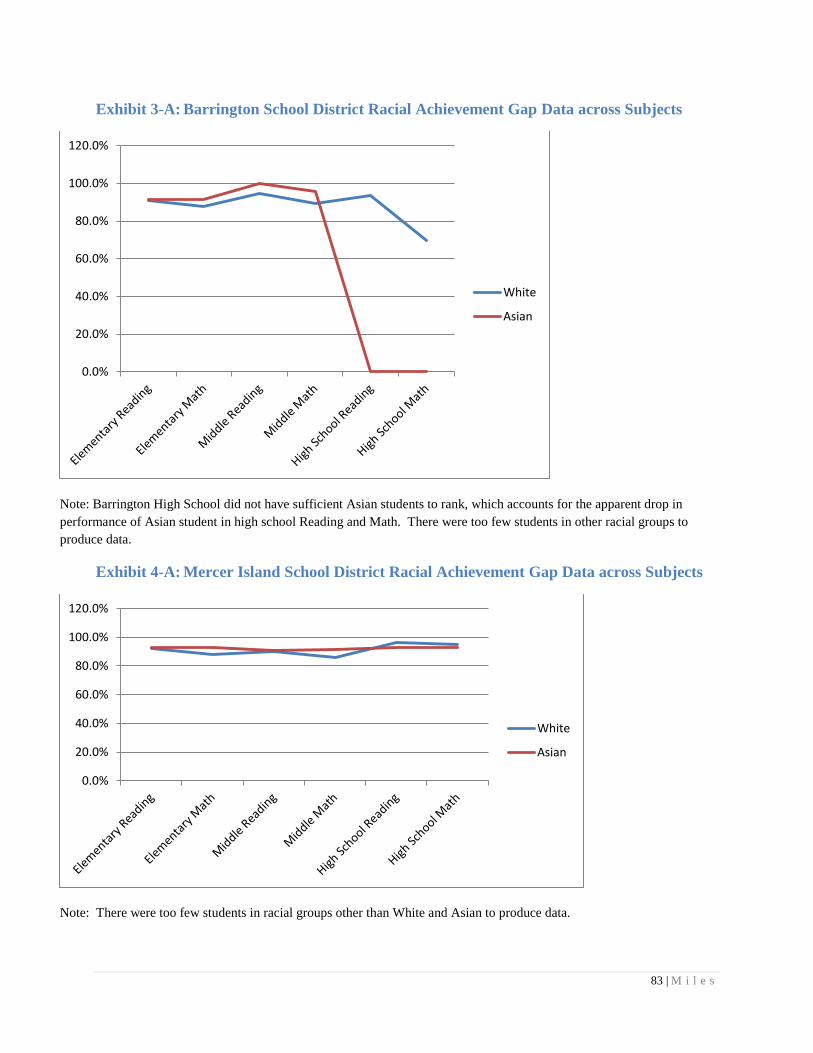
83 | M i l e s
Exhibit 3-A: Barrington School District Racial Achievement Gap Data across Subjects
Note: Barrington High School did not have sufficient Asian students to rank, which accounts for the apparent drop in
performance of Asian student in high school Reading and Math. There were too few students in other racial groups to
produce data.
Exhibit 4-A: Mercer Island School District Racial Achievement Gap Data across Subjects
Note: There were too few students in racial groups other than White and Asian to produce data.
0.0%
20.0%
40.0%
60.0%
80.0%
100.0%
120.0%
White
Asian
0.0%
20.0%
40.0%
60.0%
80.0%
100.0%
120.0%
White
Asian

84 | M i l e s
Exhibit 5-A: Falmouth Public Schools Racial Achievement Gap Data across Subjects
Note: There were too few students in racial groups other than White and Asian to produce data.
0.0%
20.0%
40.0%
60.0%
80.0%
100.0%
120.0%
ElementaryReading
ElementaryMath
MiddleReading
MiddleMath
HighSchool
Reading
HighSchoolMath
White
Asian