To Our Shareholders - Minebea · improving returns to our shareholders. Dividends, ... SALIOT CUBE...
16
Securities Code 6479 To Our Shareholders The 71st Business Year Business Report April 1, 2016 ▲ March 31, 2017
Transcript of To Our Shareholders - Minebea · improving returns to our shareholders. Dividends, ... SALIOT CUBE...
Securities Code 6479
To Our ShareholdersThe 71st Business Year Business Report April 1, 2016
▲ March 31, 2017
0
50,000
25,000
75,000
50,000
25,000
75,000
Ordinary IncomeOperating IncomeNet Sales
0
250,000
750,000
500,000
0
500,676
19,103
60,140
24,109
60,101
343,358
609,814
12,00915,950
51,438451,101 46,661
638,926
2,256
11,084
49,015452,506
48,393
(Unit: millions of yen) (Unit: millions of yen) (Unit: millions of yen)
FY2015 FY2016 FY2016 FY2016FY2017 FY2017 FY2017FY2015FY2015
Non-Consolidated Consolidated Non-Consolidated Consolidated Non-Consolidated Consolidated
1
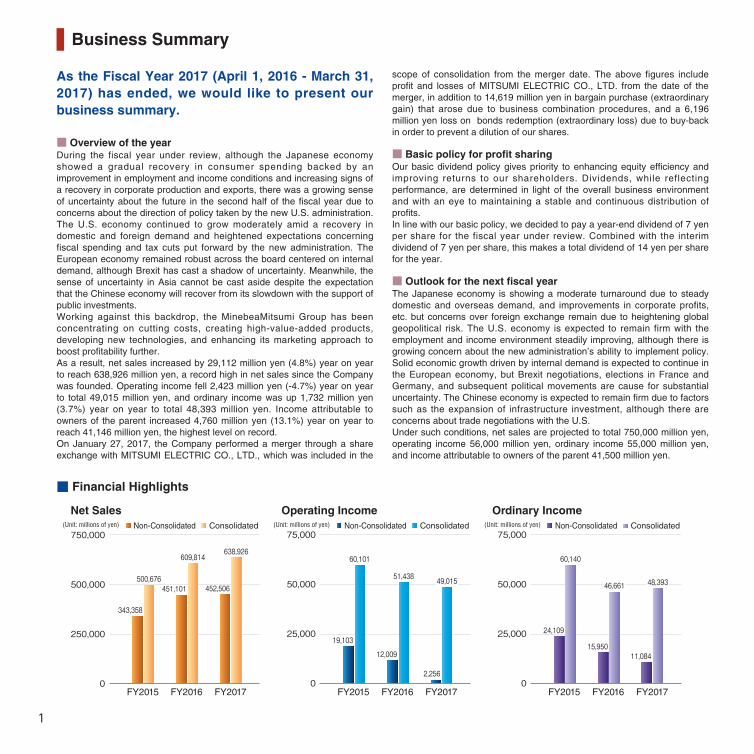
■ Overview of the yearDuring the fiscal year under review, although the Japanese economy showed a gradual recovery in consumer spending backed by an improvement in employment and income conditions and increasing signs of a recovery in corporate production and exports, there was a growing sense of uncertainty about the future in the second half of the fiscal year due to concerns about the direction of policy taken by the new U.S. administration. The U.S. economy continued to grow moderately amid a recovery in domestic and foreign demand and heightened expectations concerning fiscal spending and tax cuts put forward by the new administration. The European economy remained robust across the board centered on internal demand, although Brexit has cast a shadow of uncertainty. Meanwhile, the sense of uncertainty in Asia cannot be cast aside despite the expectation that the Chinese economy will recover from its slowdown with the support of public investments.Working against this backdrop, the MinebeaMitsumi Group has been concentrating on cutting costs, creating high-value-added products, developing new technologies, and enhancing its marketing approach to boost profitability further.As a result, net sales increased by 29,112 million yen (4.8%) year on year to reach 638,926 million yen, a record high in net sales since the Company was founded. Operating income fell 2,423 million yen (-4.7%) year on year to total 49,015 million yen, and ordinary income was up 1,732 million yen (3.7%) year on year to total 48,393 million yen. Income attributable to owners of the parent increased 4,760 million yen (13.1%) year on year to reach 41,146 million yen, the highest level on record.On January 27, 2017, the Company performed a merger through a share exchange with MITSUMI ELECTRIC CO., LTD., which was included in the
As the Fiscal Year 2017 (April 1, 2016 - March 31, 2017) has ended, we would like to present our business summary.
scope of consolidation from the merger date. The above figures include profit and losses of MITSUMI ELECTRIC CO., LTD. from the date of the merger, in addition to 14,619 million yen in bargain purchase (extraordinary gain) that arose due to business combination procedures, and a 6,196 million yen loss on bonds redemption (extraordinary loss) due to buy-back in order to prevent a dilution of our shares.
■ Basic policy for profit sharingOur basic dividend policy gives priority to enhancing equity efficiency and improving returns to our shareholders. Dividends, while reflecting performance, are determined in light of the overall business environment and with an eye to maintaining a stable and continuous distribution of profits.In line with our basic policy, we decided to pay a year-end dividend of 7 yen per share for the fiscal year under review. Combined with the interim dividend of 7 yen per share, this makes a total dividend of 14 yen per share for the year.
■ Outlook for the next fiscal yearThe Japanese economy is showing a moderate turnaround due to steady domestic and overseas demand, and improvements in corporate profits, etc. but concerns over foreign exchange remain due to heightening global geopolitical risk. The U.S. economy is expected to remain firm with the employment and income environment steadily improving, although there is growing concern about the new administration’s ability to implement policy. Solid economic growth driven by internal demand is expected to continue in the European economy, but Brexit negotiations, elections in France and Germany, and subsequent political movements are cause for substantial uncertainty. The Chinese economy is expected to remain firm due to factors such as the expansion of infrastructure investment, although there are concerns about trade negotiations with the U.S. Under such conditions, net sales are projected to total 750,000 million yen, operating income 56,000 million yen, ordinary income 55,000 million yen, and income attributable to owners of the parent 41,500 million yen.
■ Financial Highlights
Business Summary
0
300,000
150,000
450,000
500,000
250,000
750,000
0
15,000
45,000
30,000
0
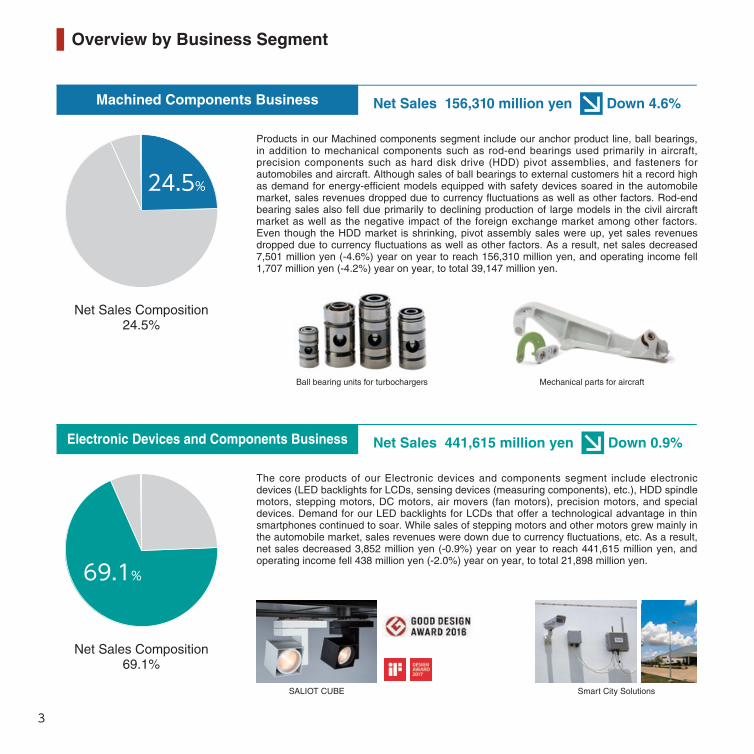
Income Attributable to Owners of the Parent Net AssetsTotal Assets
233,679
187,119
39,887
9,575
389,214
490,043
237,973
192,539
36,386
11,750
368,266
459,427
326,218
245,927
41,146
3,199
482,615
643,312
(Unit: millions of yen) (Unit: millions of yen) (Unit: millions of yen)
FY2015 FY2016 FY2016 FY2016FY2017 FY2017 FY2017FY2015FY2015
Non-Consolidated Consolidated Non-Consolidated Consolidated Non-Consolidated Consolidated
2
The outlook by segment for the full year is as follows:
◆ Machined components businessWe will continue to work on boosting performance of the ball bearing business, our anchor business line, by aggressively expanding sales targeting the automobile, information and telecommunications equipment industries, etc., while significantly improving productivity as demand picks up across the globe. Furthermore, we will also boost productivity in the rod-end bearing business by fundamentally revising production methods, and also work to boost sales in the aircraft market, which is expected to grow in the field of small and medium-sized aircraft.
◆ Electronic devices and components businessWe are continuing to supply high-value-added LED backlights for LCDs featuring ultra-thin light guide plates to the smartphone market, and will increase sales of products for automobiles, which is a market that is expected to grow. Working with an eye to enhancing the performance of our stepping motor business, we will zero in on enhancing quality and cutting costs as we work to increase sales of high-value-added products for automobiles, servers, and other applications.
◆ MITSUMI businessAs greater functionality is brought to camera actuators, and smartphone-related products such as switches, we will maintain and improve quality while increasing productivity in an effort to further increase sales. In automotive products such as antennas, communication modules and connectors, we will expand our lineup in addition to establishing a global production and supply system in an effort to improve performance. In addition, we will create substantial synergies utilizing the scale of our group as a whole such as expanding sales, reducing material and logistics costs, and developing new products to be more competitive.
◆ Other businessesWe will concentrate on enhancing the accuracy of machine made in-house in order to improve production efficiency for the departments that produce finished products and bring quality to new heights.
We look forward to your continuous support and guidance.
Yoshihisa KainumaRepresentative Director June 2017
The following is an English translation of the Business Report for the 71st Business Year (FY2017) of MinebeaMitsumi Inc.The Company provides this translation for your reference and convenience only and without any warranty as to its accuracy or otherwise.
3
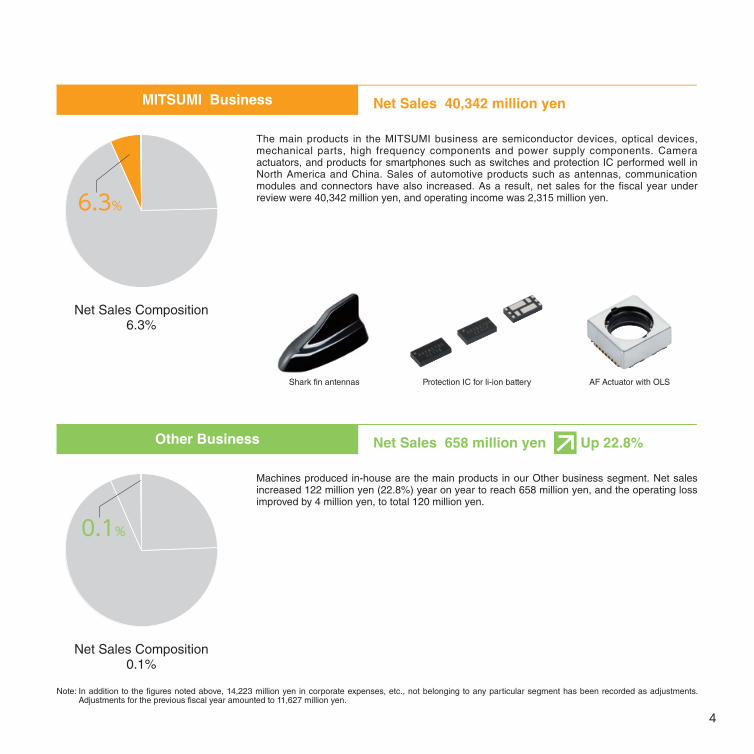
Products in our Machined components segment include our anchor product line, ball bearings, in addition to mechanical components such as rod-end bearings used primarily in aircraft, precision components such as hard disk drive (HDD) pivot assemblies, and fasteners for automobiles and aircraft. Although sales of ball bearings to external customers hit a record high as demand for energy-efficient models equipped with safety devices soared in the automobile market, sales revenues dropped due to currency fluctuations as well as other factors. Rod-end bearing sales also fell due primarily to declining production of large models in the civil aircraft market as well as the negative impact of the foreign exchange market among other factors. Even though the HDD market is shrinking, pivot assembly sales were up, yet sales revenues dropped due to currency fluctuations as well as other factors. As a result, net sales decreased 7,501 million yen (-4.6%) year on year to reach 156,310 million yen, and operating income fell 1,707 million yen (-4.2%) year on year, to total 39,147 million yen.
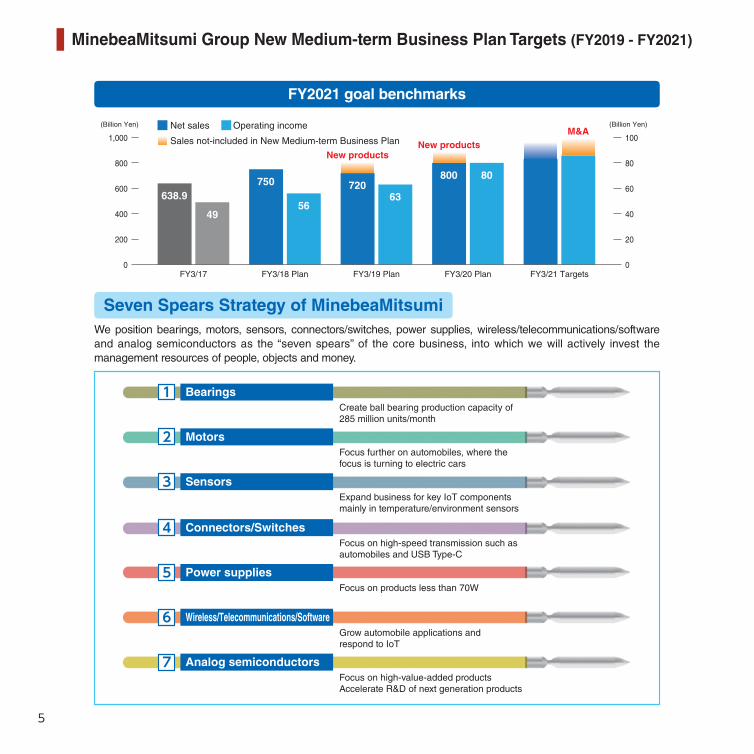
The core products of our Electronic devices and components segment include electronic devices (LED backlights for LCDs, sensing devices (measuring components), etc.), HDD spindle motors, stepping motors, DC motors, air movers (fan motors), precision motors, and special devices. Demand for our LED backlights for LCDs that offer a technological advantage in thin smartphones continued to soar. While sales of stepping motors and other motors grew mainly in the automobile market, sales revenues were down due to currency fluctuations, etc. As a result, net sales decreased 3,852 million yen (-0.9%) year on year to reach 441,615 million yen, and operating income fell 438 million yen (-2.0%) year on year, to total 21,898 million yen.
Net Sales 156,310 million yen Down 4.6%
Net Sales 441,615 million yen Down 0.9%
Machined Components Business
Electronic Devices and Components Business
Net Sales Composition24.5%
Net Sales Composition69.1%
Ball bearing units for turbochargers Mechanical parts for aircraft
SALIOT CUBE Smart City Solutions
24.5%
69.1%
Overview by Business Segment
4
The main products in the MITSUMI business are semiconductor devices, optical devices, mechanical parts, high frequency components and power supply components. Camera actuators, and products for smartphones such as switches and protection IC performed well in North America and China. Sales of automotive products such as antennas, communication modules and connectors have also increased. As a result, net sales for the fiscal year under review were 40,342 million yen, and operating income was 2,315 million yen.
Machines produced in-house are the main products in our Other business segment. Net sales increased 122 million yen (22.8%) year on year to reach 658 million yen, and the operating loss improved by 4 million yen, to total 120 million yen.
Net Sales 40,342 million yen
Net Sales 658 million yen Up 22.8%
MITSUMI Business
Other Business
Note: In addition to the figures noted above, 14,223 million yen in corporate expenses, etc., not belonging to any particular segment has been recorded as adjustments. Adjustments for the previous fiscal year amounted to 11,627 million yen.
Net Sales Composition6.3%
Net Sales Composition0.1%
Shark fin antennas Protection IC for li-ion battery AF Actuator with OLS
6.3%
0.1%
5
We position bearings, motors, sensors, connectors/switches, power supplies, wireless/telecommunications/software and analog semiconductors as the “seven spears” of the core business, into which we will actively invest the management resources of people, objects and money.
FY2021 goal benchmarks
Seven Spears Strategy of MinebeaMitsumi
Focus on high-value-added productsAccelerate R&D of next generation products
0 0
1,000
600
800
400
200
100
80
60
40
20
(Billion Yen)(Billion Yen)
638.9
49
FY3/17
75063
FY3/18 Plan
720
56
FY3/19 Plan
800 80
FY3/20 Plan FY3/21 Targets
Net sales Operating income
Sales not-included in New Medium-term Business Plan
New productsNew products
M&A
Create ball bearing production capacity of 285 million units/month
Focus further on automobiles, where the focus is turning to electric cars
Grow automobile applications and respond to IoT
Focus on products less than 70W
Focus on high-speed transmission such as automobiles and USB Type-C
Expand business for key IoT components mainly in temperature/environment sensors
1 Bearings
2 Motors
3 Sensors
4 Connectors/Switches
5 Power supplies
6 Wireless/Telecommunications/Software
7 Analog semiconductors
MinebeaMitsumi Group New Medium-term Business Plan Targets (FY2019 - FY2021)
6
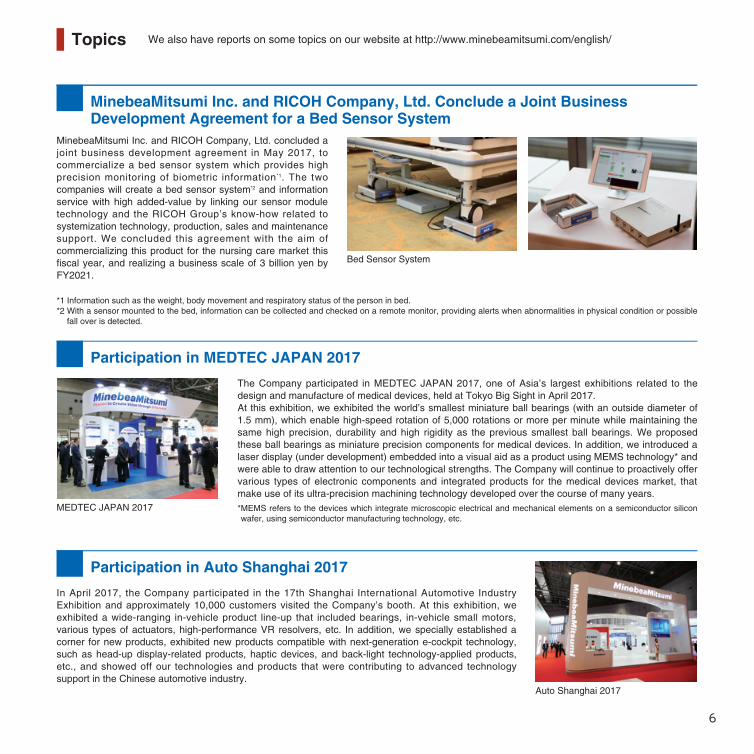
MinebeaMitsumi Inc. and RICOH Company, Ltd. concluded a joint business development agreement in May 2017, to commercialize a bed sensor system which provides high precision monitoring of biometric information*1. The two companies will create a bed sensor system*2 and information service with high added-value by linking our sensor module technology and the RICOH Group’s know-how related to systemization technology, production, sales and maintenance support. We concluded this agreement with the aim of commercializing this product for the nursing care market this fiscal year, and realizing a business scale of 3 billion yen by FY2021.
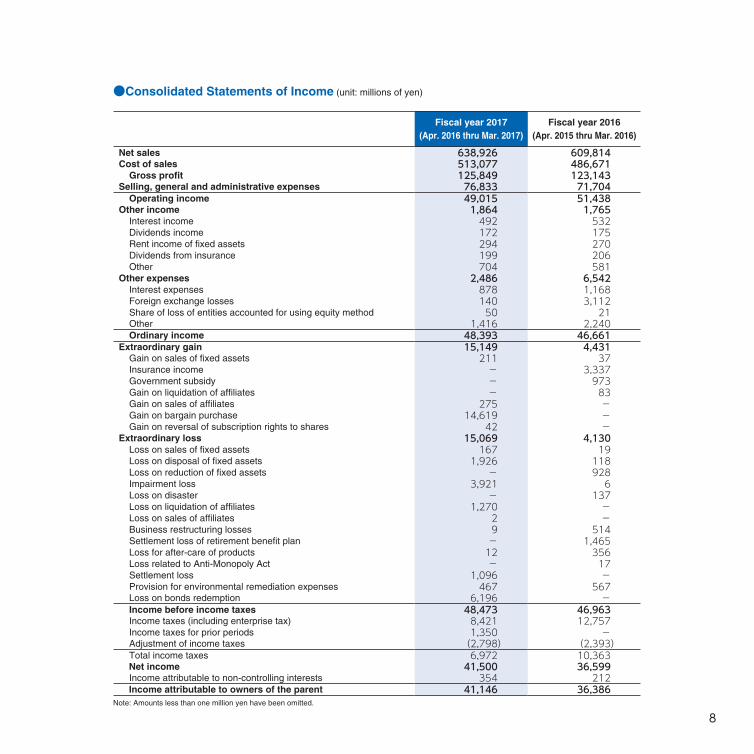
In April 2017, the Company participated in the 17th Shanghai International Automotive Industry Exhibition and approximately 10,000 customers visited the Company’s booth. At this exhibition, we exhibited a wide-ranging in-vehicle product line-up that included bearings, in-vehicle small motors, various types of actuators, high-performance VR resolvers, etc. In addition, we specially established a corner for new products, exhibited new products compatible with next-generation e-cockpit technology, such as head-up display-related products, haptic devices, and back-light technology-applied products, etc., and showed off our technologies and products that were contributing to advanced technology support in the Chinese automotive industry.
MinebeaMitsumi Inc. and RICOH Company, Ltd. Conclude a Joint Business Development Agreement for a Bed Sensor System
Participation in Auto Shanghai 2017
Bed Sensor System
*1 Information such as the weight, body movement and respiratory status of the person in bed.*2 With a sensor mounted to the bed, information can be collected and checked on a remote monitor, providing alerts when abnormalities in physical condition or possible
fall over is detected.
Auto Shanghai 2017
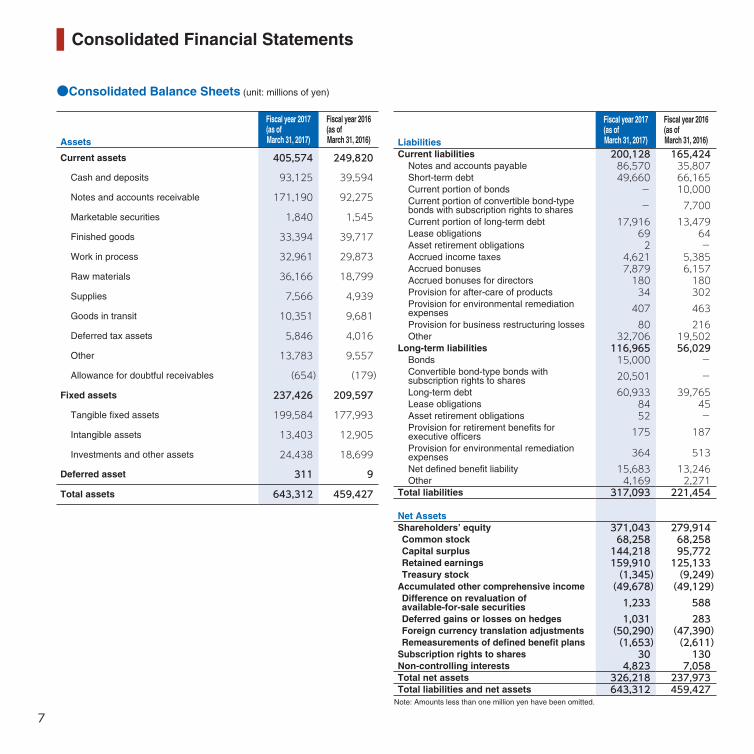
The Company participated in MEDTEC JAPAN 2017, one of Asia’s largest exhibitions related to the design and manufacture of medical devices, held at Tokyo Big Sight in April 2017.At this exhibition, we exhibited the world’s smallest miniature ball bearings (with an outside diameter of 1.5 mm), which enable high-speed rotation of 5,000 rotations or more per minute while maintaining the same high precision, durability and high rigidity as the previous smallest ball bearings. We proposed these ball bearings as miniature precision components for medical devices. In addition, we introduced a laser display (under development) embedded into a visual aid as a product using MEMS technology* and were able to draw attention to our technological strengths. The Company will continue to proactively offer various types of electronic components and integrated products for the medical devices market, that make use of its ultra-precision machining technology developed over the course of many years.* MEMS refers to the devices which integrate microscopic electrical and mechanical elements on a semiconductor silicon wafer, using semiconductor manufacturing technology, etc.
Participation in MEDTEC JAPAN 2017
MEDTEC JAPAN 2017
Topics We also have reports on some topics on our website at http://www.minebeamitsumi.com/english/
7
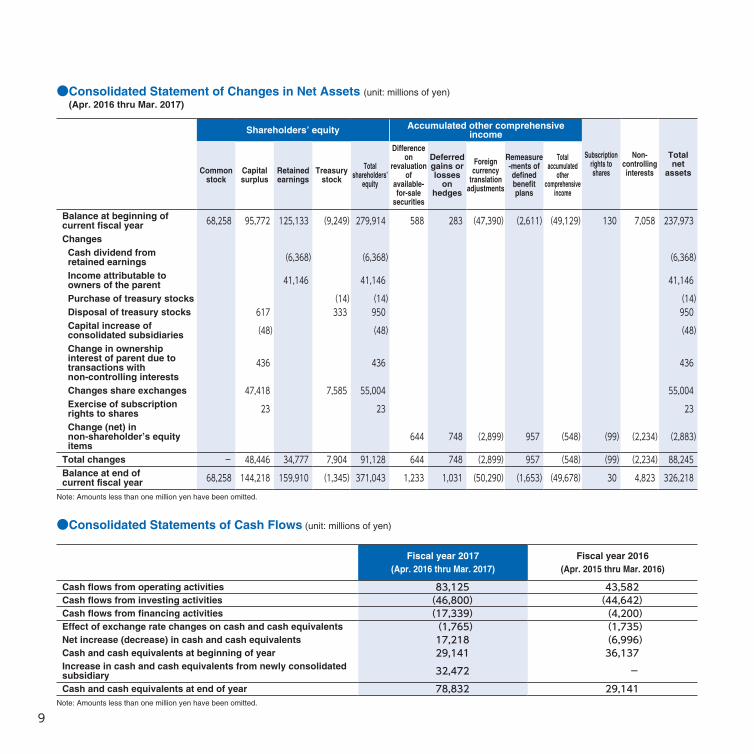
●Consolidated Balance Sheets (unit: millions of yen)
Fiscal year 2017 (as of March 31, 2017)
Fiscal year 2016 (as ofMarch 31, 2016)Assets
Current assets 405,574 249,820
Cash and deposits 93,125 39,594
Notes and accounts receivable 171,190 92,275
Marketable securities 1,840 1,545
Finished goods 33,394 39,717
Work in process 32,961 29,873
Raw materials 36,166 18,799
Supplies 7,566 4,939
Goods in transit 10,351 9,681
Deferred tax assets 5,846 4,016
Other 13,783 9,557
Allowance for doubtful receivables (654) (179)
Fixed assets 237,426 209,597
Tangible fixed assets 199,584 177,993
Intangible assets 13,403 12,905
Investments and other assets 24,438 18,699
Deferred asset 311 9
Total assets 643,312 459,427
Fiscal year 2017 (as of March 31, 2017)
Fiscal year 2016 (as ofMarch 31, 2016)Liabilities
Current liabilities 200,128 165,424Notes and accounts payable 86,570 35,807Short-term debt 49,660 66,165Current portion of bonds - 10,000Current portion of convertible bond-typebonds with subscription rights to shares - 7,700Current portion of long-term debt 17,916 13,479Lease obligations 69 64Asset retirement obligations 2 -Accrued income taxes 4,621 5,385Accrued bonuses 7,879 6,157Accrued bonuses for directors 180 180Provision for after-care of products 34 302Provision for environmental remediation expenses 407 463Provision for business restructuring losses 80 216Other 32,706 19,502
Long-term liabilities 116,965 56,029Bonds 15,000 -Convertible bond-type bonds with subscription rights to shares 20,501 -Long-term debt 60,933 39,765Lease obligations 84 45Asset retirement obligations 52 -Provision for retirement benefits for executive officers 175 187Provision for environmental remediation expenses 364 513Net defined benefit liability 15,683 13,246Other 4,169 2,271
Total liabilities 317,093 221,454
Net AssetsShareholders’ equity 371,043 279,914Common stock 68,258 68,258Capital surplus 144,218 95,772Retained earnings 159,910 125,133Treasury stock (1,345) (9,249)
Accumulated other comprehensive income (49,678) (49,129)Difference on revaluation of available-for-sale securities 1,233 588Deferred gains or losses on hedges 1,031 283Foreign currency translation adjustments (50,290) (47,390)Remeasurements of defined benefit plans (1,653) (2,611)
Subscription rights to shares 30 130Non-controlling interests 4,823 7,058Total net assets 326,218 237,973Total liabilities and net assets 643,312 459,427
Note: Amounts less than one million yen have been omitted.
Consolidated Financial Statements
8
●Consolidated Statements of Income (unit: millions of yen)
Fiscal year 2017(Apr. 2016 thru Mar. 2017)
Fiscal year 2016(Apr. 2015 thru Mar. 2016)
Net sales 638,926 609,814Cost of sales 513,077 486,671
Gross profit 125,849 123,143Selling, general and administrative expenses 76,833 71,704
Operating income 49,015 51,438Other income 1,864 1,765
Interest income 492 532Dividends income 172 175Rent income of fixed assets 294 270Dividends from insurance 199 206Other 704 581
Other expenses 2,486 6,542Interest expenses 878 1,168Foreign exchange losses 140 3,112Share of loss of entities accounted for using equity method 50 21Other 1,416 2,240Ordinary income 48,393 46,661
Extraordinary gain 15,149 4,431Gain on sales of fixed assets 211 37Insurance income - 3,337Government subsidy - 973Gain on liquidation of affiliates - 83Gain on sales of affiliates 275 -Gain on bargain purchase 14,619 -Gain on reversal of subscription rights to shares 42 -
Extraordinary loss 15,069 4,130Loss on sales of fixed assets 167 19Loss on disposal of fixed assets 1,926 118Loss on reduction of fixed assets - 928Impairment loss 3,921 6Loss on disaster - 137Loss on liquidation of affiliates 1,270 -Loss on sales of affiliates 2 -Business restructuring losses 9 514Settlement loss of retirement benefit plan - 1,465Loss for after-care of products 12 356Loss related to Anti-Monopoly Act - 17Settlement loss 1,096 -Provision for environmental remediation expenses 467 567Loss on bonds redemption 6,196 -Income before income taxes 48,473 46,963Income taxes (including enterprise tax) 8,421 12,757Income taxes for prior periods 1,350 -Adjustment of income taxes (2,798) (2,393)Total income taxes 6,972 10,363Net income 41,500 36,599Income attributable to non-controlling interests 354 212Income attributable to owners of the parent 41,146 36,386
Note: Amounts less than one million yen have been omitted.
9
●Consolidated Statements of Cash Flows (unit: millions of yen)
Fiscal year 2017(Apr. 2016 thru Mar. 2017)
Fiscal year 2016(Apr. 2015 thru Mar. 2016)
Cash flows from operating activities 83,125 43,582Cash flows from investing activities (46,800) (44,642)Cash flows from financing activities (17,339) (4,200)Effect of exchange rate changes on cash and cash equivalents (1,765) (1,735)Net increase (decrease) in cash and cash equivalents 17,218 (6,996)Cash and cash equivalents at beginning of year 29,141 36,137Increase in cash and cash equivalents from newly consolidated subsidiary 32,472 -Cash and cash equivalents at end of year 78,832 29,141
Note: Amounts less than one million yen have been omitted.
●Consolidated Statement of Changes in Net Assets (unit: millions of yen) (Apr. 2016 thru Mar. 2017)
Shareholders’ equity Accumulated other comprehensive income
Subscription rights to shares
Non-controllinginterests
Totalnet
assetsCommon stock
Capitalsurplus
Retainedearnings
Treasury stock
Total shareholders’
equity
Difference on
revaluationof
available-for-sale
securities
Deferred gains or losses
on hedges
Foreign currency
translation adjustments
Remeasure-ments of defined benefit plans
Total accumulated
other comprehensive
income
Balance at beginning of current fiscal year 68,258 95,772 125,133 (9,249)279,914 588 283 (47,390) (2,611)(49,129) 130 7,058 237,973Changes
Cash dividend from retained earnings (6,368) (6,368) (6,368)Income attributable to owners of the parent 41,146 41,146 41,146Purchase of treasury stocks (14) (14) (14)Disposal of treasury stocks 617 333 950 950Capital increase of consolidated subsidiaries (48) (48) (48)Change in ownership interest of parent due to transactions with non-controlling interests
436 436 436
Changes share exchanges 47,418 7,585 55,004 55,004Exercise of subscription rights to shares 23 23 23Change (net) in non-shareholder’s equity items
644 748 (2,899) 957 (548) (99) (2,234) (2,883)
Total changes - 48,446 34,777 7,904 91,128 644 748 (2,899) 957 (548) (99) (2,234) 88,245Balance at end of current fiscal year 68,258 144,218 159,910 (1,345)371,043 1,233 1,031 (50,290) (1,653)(49,678) 30 4,823 326,218
Note: Amounts less than one million yen have been omitted.
10
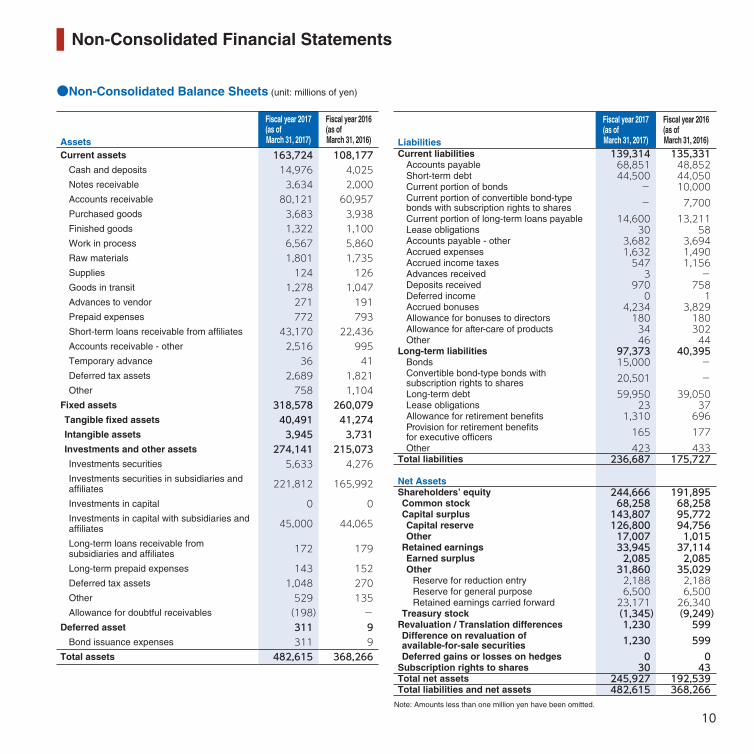
●Non-Consolidated Balance Sheets (unit: millions of yen)
Fiscal year 2017 (as of March 31, 2017)
Fiscal year 2016 (as of March 31, 2016)Assets
Current assets 163,724 108,177Cash and deposits 14,976 4,025Notes receivable 3,634 2,000Accounts receivable 80,121 60,957Purchased goods 3,683 3,938Finished goods 1,322 1,100Work in process 6,567 5,860Raw materials 1,801 1,735Supplies 124 126Goods in transit 1,278 1,047Advances to vendor 271 191Prepaid expenses 772 793Short-term loans receivable from affiliates 43,170 22,436Accounts receivable - other 2,516 995Temporary advance 36 41Deferred tax assets 2,689 1,821Other 758 1,104
Fixed assets 318,578 260,079Tangible fixed assets 40,491 41,274Intangible assets 3,945 3,731Investments and other assets 274,141 215,073Investments securities 5,633 4,276Investments securities in subsidiaries and affiliates 221,812 165,992
Investments in capital 0 0Investments in capital with subsidiaries and affiliates 45,000 44,065
Long-term loans receivable from subsidiaries and affiliates 172 179
Long-term prepaid expenses 143 152Deferred tax assets 1,048 270Other 529 135Allowance for doubtful receivables (198) -
Deferred asset 311 9Bond issuance expenses 311 9
Total assets 482,615 368,266
Fiscal year 2017 (as of March 31, 2017)
Fiscal year 2016 (as of March 31, 2016)Liabilities
Current liabilities 139,314 135,331Accounts payable 68,851 48,852Short-term debt 44,500 44,050Current portion of bonds - 10,000Current portion of convertible bond-type bonds with subscription rights to shares - 7,700Current portion of long-term loans payable 14,600 13,211Lease obligations 30 58Accounts payable - other 3,682 3,694Accrued expenses 1,632 1,490Accrued income taxes 547 1,156Advances received 3 -Deposits received 970 758Deferred income 0 1Accrued bonuses 4,234 3,829Allowance for bonuses to directors 180 180Allowance for after-care of products 34 302Other 46 44
Long-term liabilities 97,373 40,395Bonds 15,000 -Convertible bond-type bonds with subscription rights to shares 20,501 -Long-term debt 59,950 39,050Lease obligations 23 37Allowance for retirement benefits 1,310 696Provision for retirement benefits for executive officers 165 177Other 423 433
Total liabilities 236,687 175,727
Net AssetsShareholders’ equity 244,666 191,895Common stock 68,258 68,258Capital surplus 143,807 95,772Capital reserve 126,800 94,756Other 17,007 1,015
Retained earnings 33,945 37,114Earned surplus 2,085 2,085Other 31,860 35,029
Reserve for reduction entry 2,188 2,188Reserve for general purpose 6,500 6,500Retained earnings carried forward 23,171 26,340
Treasury stock (1,345) (9,249)Revaluation / Translation differences 1,230 599Difference on revaluation of available-for-sale securities 1,230 599Deferred gains or losses on hedges 0 0
Subscription rights to shares 30 43Total net assets 245,927 192,539Total liabilities and net assets 482,615 368,266
Note: Amounts less than one million yen have been omitted.
Non-Consolidated Financial Statements
11
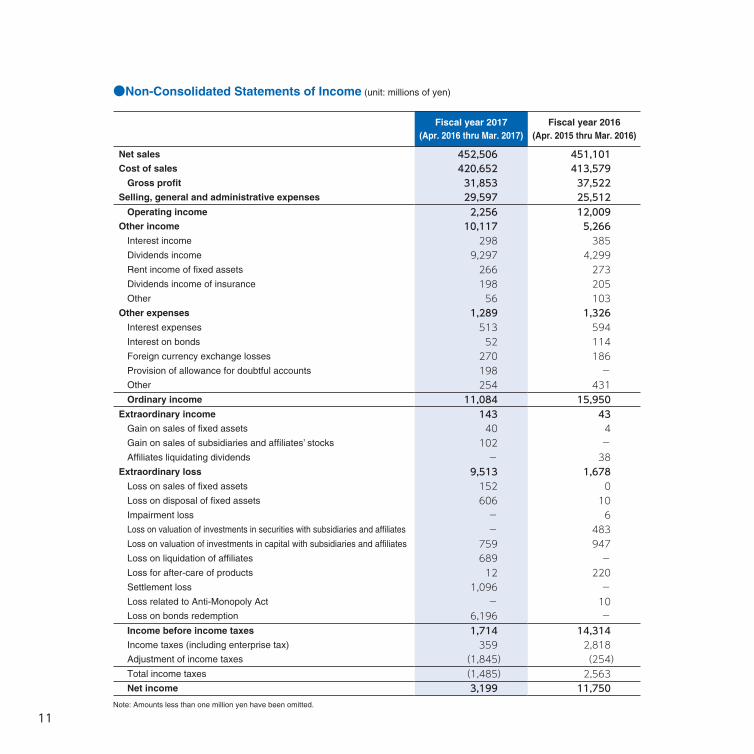
●Non-Consolidated Statements of Income (unit: millions of yen)
Fiscal year 2017(Apr. 2016 thru Mar. 2017)
Fiscal year 2016(Apr. 2015 thru Mar. 2016)
Net sales 452,506 451,101Cost of sales 420,652 413,579
Gross profit 31,853 37,522Selling, general and administrative expenses 29,597 25,512
Operating income 2,256 12,009Other income 10,117 5,266
Interest income 298 385Dividends income 9,297 4,299Rent income of fixed assets 266 273Dividends income of insurance 198 205Other 56 103
Other expenses 1,289 1,326Interest expenses 513 594Interest on bonds 52 114Foreign currency exchange losses 270 186Provision of allowance for doubtful accounts 198 -Other 254 431Ordinary income 11,084 15,950
Extraordinary income 143 43Gain on sales of fixed assets 40 4Gain on sales of subsidiaries and affiliates’ stocks 102 -Affiliates liquidating dividends - 38
Extraordinary loss 9,513 1,678Loss on sales of fixed assets 152 0Loss on disposal of fixed assets 606 10Impairment loss - 6Loss on valuation of investments in securities with subsidiaries and affiliates - 483Loss on valuation of investments in capital with subsidiaries and affiliates 759 947Loss on liquidation of affiliates 689 -Loss for after-care of products 12 220Settlement loss 1,096 -Loss related to Anti-Monopoly Act - 10Loss on bonds redemption 6,196 -Income before income taxes 1,714 14,314Income taxes (including enterprise tax) 359 2,818Adjustment of income taxes (1,845) (254)Total income taxes (1,485) 2,563Net income 3,199 11,750
Note: Amounts less than one million yen have been omitted.
12
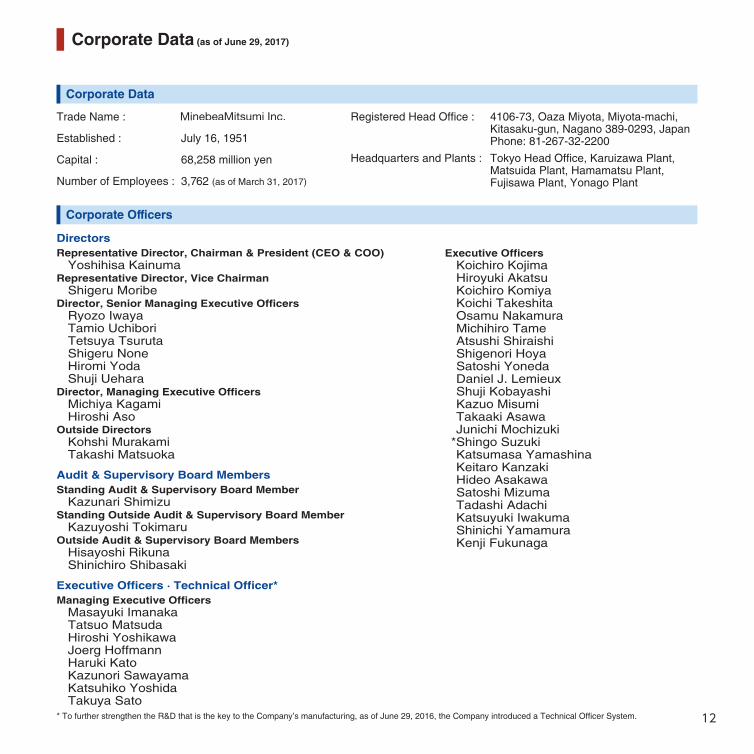
Corporate Data
Corporate Officers
Trade Name :
Established : July 16, 1951
Capital : 68,258 million yen
Number of Employees : 3,762 (as of March 31, 2017)
Registered Head Office : 4106-73, Oaza Miyota, Miyota-machi, Kitasaku-gun, Nagano 389-0293, JapanPhone: 81-267-32-2200
Headquarters and Plants : Tokyo Head Office, Karuizawa Plant, Matsuida Plant, Hamamatsu Plant, Fujisawa Plant, Yonago Plant
* To further strengthen the R&D that is the key to the Company’s manufacturing, as of June 29, 2016, the Company introduced a Technical Officer System.
DirectorsRepresentative Director, Chairman & President (CEO & COO)
Yoshihisa KainumaRepresentative Director, Vice Chairman
Shigeru MoribeDirector, Senior Managing Executive Officers
Ryozo IwayaTamio UchiboriTetsuya TsurutaShigeru NoneHiromi YodaShuji Uehara
Director, Managing Executive OfficersMichiya KagamiHiroshi Aso
Outside DirectorsKohshi MurakamiTakashi Matsuoka
Audit & Supervisory Board MembersStanding Audit & Supervisory Board Member
Kazunari ShimizuStanding Outside Audit & Supervisory Board Member
Kazuyoshi TokimaruOutside Audit & Supervisory Board Members
Hisayoshi RikunaShinichiro Shibasaki
Executive Officers ∙ Technical Officer*Managing Executive Officers
Masayuki ImanakaTatsuo MatsudaHiroshi YoshikawaJoerg HoffmannHaruki KatoKazunori SawayamaKatsuhiko YoshidaTakuya Sato
Executive OfficersKoichiro KojimaHiroyuki AkatsuKoichiro KomiyaKoichi TakeshitaOsamu NakamuraMichihiro TameAtsushi ShiraishiShigenori HoyaSatoshi YonedaDaniel J. LemieuxShuji KobayashiKazuo MisumiTakaaki AsawaJunichi Mochizuki
*Shingo SuzukiKatsumasa YamashinaKeitaro KanzakiHideo AsakawaSatoshi MizumaTadashi AdachiKatsuyuki IwakumaShinichi YamamuraKenji Fukunaga
Corporate Data (as of June 29, 2017)
13
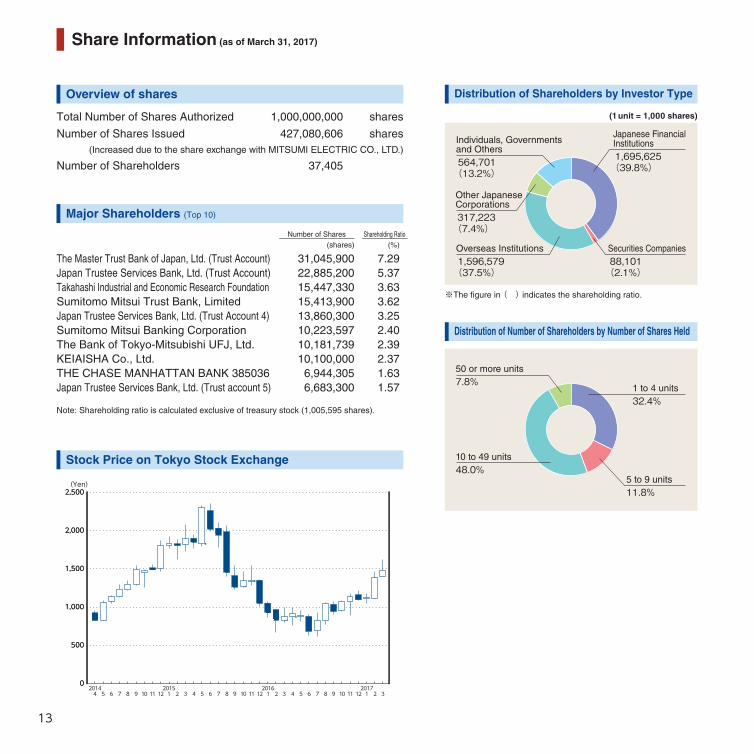
1 to 4 units32.4%
50 or more units7.8%
10 to 49 units48.0%
5 to 9 units11.8%
(1 unit = 1,000 shares)
Individuals, Governments and Others564,701(13.2%)
Overseas Institutions1,596,579(37.5%)
Securities Companies88,101(2.1%)
Japanese FinancialInstitutions1,695,625(39.8%)
Other Japanese Corporations317,223(7.4%)
Stock Price on Tokyo Stock Exchange
Overview of shares Distribution of Shareholders by Investor Type
Distribution of Number of Shareholders by Number of Shares Held
10 11 1220161 2 3 10 11 12
20171 2 3
20144 5 6 7 8 4 5 6 7 8 9 4 5 6 7 8 99 10 11 12
20151 2 3
00
1,0001,000
1,5001,500
2,0002,000
500500
2,5002,500(Yen)
Total Number of Shares Authorized 1,000,000,000 shares
Number of Shares Issued 427,080,606 shares(Increased due to the share exchange with MITSUMI ELECTRIC CO., LTD.)
Number of Shareholders 37,405
Major Shareholders (Top 10)
Number of Shares Shareholding Ratio(shares) (%)
The Master Trust Bank of Japan, Ltd. (Trust Account) 31,045,900 7.29Japan Trustee Services Bank, Ltd. (Trust Account) 22,885,200 5.37Takahashi Industrial and Economic Research Foundation 15,447,330 3.63Sumitomo Mitsui Trust Bank, Limited 15,413,900 3.62Japan Trustee Services Bank, Ltd. (Trust Account 4) 13,860,300 3.25Sumitomo Mitsui Banking Corporation 10,223,597 2.40The Bank of Tokyo-Mitsubishi UFJ, Ltd. 10,181,739 2.39KEIAISHA Co., Ltd. 10,100,000 2.37THE CHASE MANHATTAN BANK 385036 6,944,305 1.63Japan Trustee Services Bank, Ltd. (Trust account 5) 6,683,300 1.57
Note: Shareholding ratio is calculated exclusive of treasury stock (1,005,595 shares).
※The figure in ( ) indicates the shareholding ratio.
Share Information (as of March 31, 2017)
14
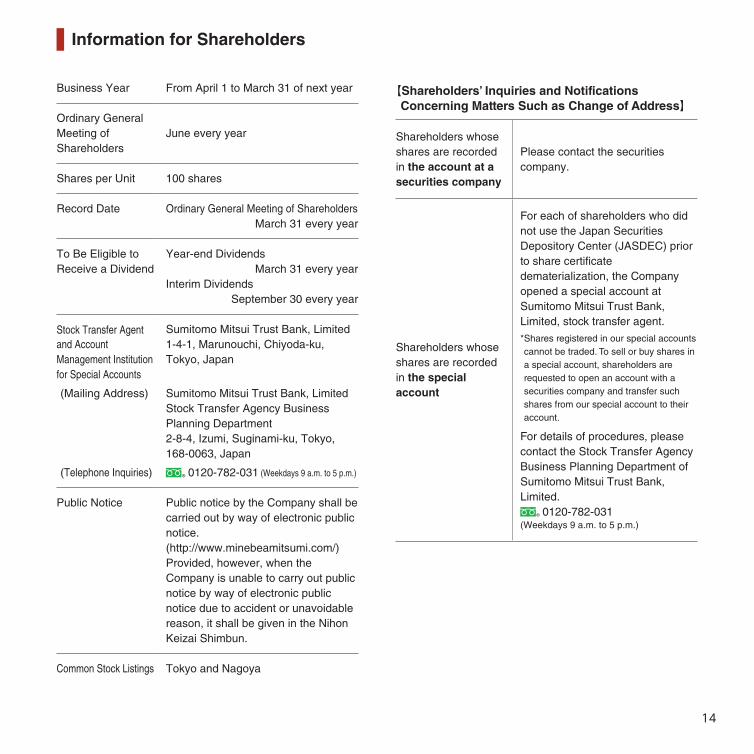
Business Year From April 1 to March 31 of next year
Ordinary General Meeting of Shareholders
June every year
Shares per Unit 100 shares
Record Date Ordinary General Meeting of Shareholders March 31 every year
To Be Eligible to Receive a Dividend
Year-end Dividends March 31 every year
Interim Dividends September 30 every year
Stock Transfer Agent and Account Management Institution for Special Accounts
(Mailing Address)
(Telephone Inquiries)
Sumitomo Mitsui Trust Bank, Limited1-4-1, Marunouchi, Chiyoda-ku, Tokyo, Japan
Sumitomo Mitsui Trust Bank, LimitedStock Transfer Agency Business Planning Department2-8-4, Izumi, Suginami-ku, Tokyo, 168-0063, Japan
® 0120-782-031 (Weekdays 9 a.m. to 5 p.m.)
Public Notice Public notice by the Company shall be carried out by way of electronic public notice.(http://www.minebeamitsumi.com/) Provided, however, when the Company is unable to carry out public notice by way of electronic public notice due to accident or unavoidable reason, it shall be given in the Nihon Keizai Shimbun.
Common Stock Listings Tokyo and Nagoya
【Shareholders’ Inquiries and Notifications Concerning Matters Such as Change of Address】
Shareholders whose shares are recorded in the account at a securities company
Please contact the securities company.
Shareholders whose shares are recorded in the special account
For each of shareholders who did not use the Japan Securities Depository Center (JASDEC) prior to share certificate dematerialization, the Company opened a special account at Sumitomo Mitsui Trust Bank, Limited, stock transfer agent.
* Shares registered in our special accounts cannot be traded. To sell or buy shares in a special account, shareholders are requested to open an account with a securities company and transfer such shares from our special account to their account.
For details of procedures, please contact the Stock Transfer Agency Business Planning Department of Sumitomo Mitsui Trust Bank, Limited.
® 0120-782-031 (Weekdays 9 a.m. to 5 p.m.)
Information for Shareholders
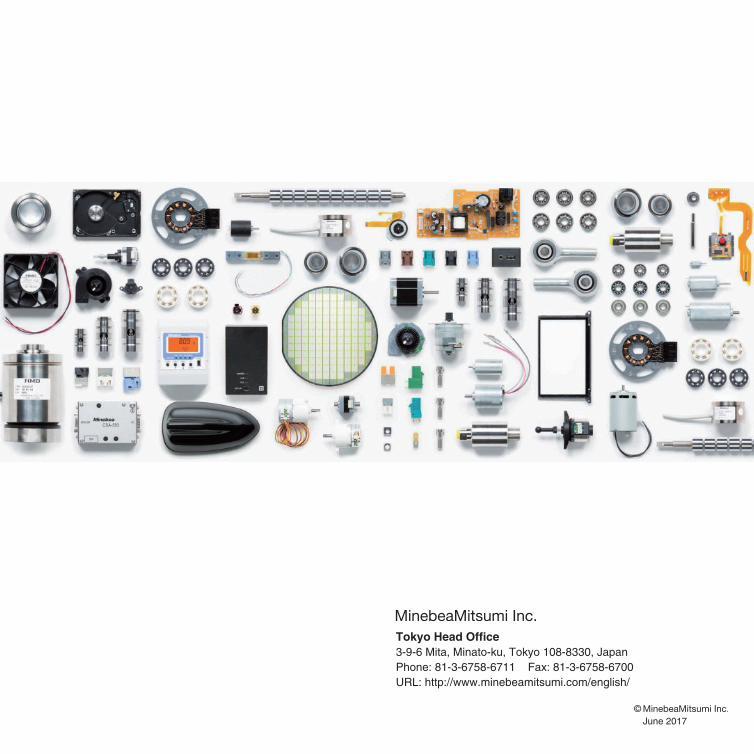
Tokyo Head Office3-9-6 Mita, Minato-ku, Tokyo 108-8330, JapanPhone: 81-3-6758-6711 Fax: 81-3-6758-6700URL: http://www.minebeamitsumi.com/english/
June 2017©