TO MY PARENTS ETOYE FONEIE 1VIOY
240
TO MY PARENTS ETOYE FONEIE 1VIOY
Transcript of TO MY PARENTS ETOYE FONEIE 1VIOY

TO MY PARENTS
ETOYE FONEIE 1VIOY
A STUDYOF BUBBLE GENERATION AND HYDRODYNAMICS
IN DISSOLVED AIR FLOTATION
BY
KONSTANTINOS REPANAS
THESIS SUBMITTED FOR THE DEGREEOF DOCTOR OF PHILOSOPHY
INDEPARTMENT OF CHEMICAL AND PROCESS ENGINEERING
FACULTY OF ENGINEERINGUNIVERSITY OF NEWCASTLE UPON TYNE
U.K.
MAY 1992
Nr.• It' . 1 `,11 1
••- •+ • • • •• n••••-• •
L3 '2 :7 :I. 11
L3q-161
ABSTRACT
In Dissolved Air Flotation the performance of the saturator
and subsequent release of the air from the solution is important.
In particular the bubble size, the degree of saturation and the
hydrodynamic bubble movement are important physical parameters.
In this study all these have been investigated.
The factors affecting the bubble size when gas is released
from a supersaturated solution and the performance of two types
of absorbers a conventional packed column and a Higee Absorber
were examined. The size of the bubbles generated from a nozzle
have been measured in tap water at different operation conditions
of liquid flowrate, gas flowrate and pressure.
The bubble size was measured using a photographic technique
and found to decrease with increasing the gas pressure in the
conventional saturator, but it was not possible to observe the
small bubbles generated using the Higee Technique. For the
conventional device, the liquid flowrate had a significant role
whereby the bubble diameter fell with flowrate. Bubble uniformity
increased as both pressure and liquid throughput increased.
The saturation performance of the two kinds of absorbers
were examined. In all the cases, the Higee technique operate
better as far the saturation level was concerned. The degree of
saturation in the Higee systems was found to be a strong function
of both gas and liquid flowrates as well as the rotational speed
(which governs the gas pressure).
Finally, as it may be possible to distribute the saturated
solutions and (any bubbles formed) more uniformly throughout
flotation tanks if Higee saturators are used, a computer package was
adopted to provide enough data for the simulation of the flow patterns
in flotation tanks.

ACKNOWLEDGEMENTS
I would like to express my deep thanks to Dr. C.R. Howarth for
his supervision and guidance throughout this work.
My gratitude extends to Mr. E.T. Horsley, for developing and
printing the photographs needed for this research and also Dr.A.Nalik
for his contribution and fruitful discussions throughout this research
project.
In addition, the advice and assistance of all the technical staff
is gratefully acknowledged.
Finally, I would like to thank Diane Mennim for her help,
patience, understanding and encouragement.

CONTENTS
CHAPTER 1
1.0 INTRODUCTION 1
Li DISSOLVED AIR FLOTATION 1
L2 PURPOSE OF THE PRESENT WORK 3
L3 SCOPE OF THE PRESENT WORK 4
L4 STRUCTURE OF THE THESIS 4
CHAPTER 2
2_0 LITERATURE SURVEY OF FLOTATION PROCESSES 6
2_1 TYPES OF FLOTATION TECHNIQUES 6
2.L1 ELECTROLYTIC FLOTATION 6
2_1_2_ DISPERSED AIR FLOTATION 7
2_1_3_ DISSOLVED AIR FLOTATION 8
2_2. FLOTATION AS A SEPARATION METHOD 1 3
2_2_1_ GENERAL ASPECTS 1 3
2_2_2.. CLASSIFICATION OF SEPARATION
TECHNIQUES USING ABSORBED
BUBBLES 1 6
2_3_ THEORETICAL CONSIDERATIONS 1 9
2_4_ THE EFFECT OF ADDITIVE REAGENTS 24
2.5 FACTORS INFLUENCING FLOTATION
PROBABILITY 26
2.5_1_ BUBBLE STABILITY 30
2.5.1.1. PHYSICAL EFFECTS 30
2_5.1.2. CHEMICAL EFFECTS 31
25.2. FOAM STABILITY 33
CHAPTER 3
3.0. BUBBLE CHARACTERISTICS 34
3.1.BUBBLE-PART I CLE INTERACTION 34
3.1.1.GENERAL CONSIDERATIONS 34
3.1.1.1 COLLECTION EFFICIENCY
OF FLOTATION 35
3.1.1_2 THICKENING CRITERIA 37
11.13 MECHANISMS FOR ATTACHMENT
OF BUBBLES ONTO PARTICLES IN
DISSOLVED AIR FLOTATION 42
3.2. MECHANISMS OF BUBBLE FORMATION 46
32i. BUBBLE FORMATION FROM
A SINGLE ORIFICE 46
12.1.1. FORMATION REGIMES 46
12.1.2. THEORETICAL MODELS FOR
SINGLE ORIFICE BUBBLE
FORMATION 50
3.2.2. THEORY OF BUBBLE NUCLEATION IN
DISSOLVED AIR FLOTATION 61
12.2.1 DIAMETER OF GENERATED BUBBLE 61
12.2.2 NUMBER OF BUBBLES 65

3_2_2_3 COALESCENCE OF BUBBLES 67
3_3_ AIR SATURATION 70
3.3_1 DISSOLVED AIR-THEORETICAL ASPECTS 70
3_3_2 DISSOLVED AIR GENERATION RATE 72
3_3_3 TYPES OF SATURATION SYSTEMS 74
3_3_3.1 STATIC SATURATORS 75
3_3_3_2 DYNAMIC SATURATORS 75
3.3_3_3 HIGEE TECHNIQUES 76
3_4_ MASS TRANSFER IN BUBBLE PROCESSES 8 1
3.41_ FILM MODEL 83
3_4_2. BORDER DIFFUSION LAYER MODEL 85
3_4_3_ PENETRATION MODEL 87
3_5_ BUBBLE SIZE MEASUREMENT TECHNIQUES 89
35_1_ DIRECT TECHNIQUES 89
3.5_2_ INDIRECT METHODS 91
CHAPTER 4
4_0_ EXPERIMENTAL WORK 94
4_1_ DESIGN OF SATURATORS 94
4_1_1_ CONVENTIONAL SYSTEM 94
4_1_2_ HIGEE ROTATING DISK 98
4_2_ PRECIPITATE AIR MEASUREMENTS 99
4_2] _ RELEASED AIR TECHNIQUE 99
4_3_ DESIGN OF THE GAS BUBBLE NOZZLE 101
4_4_ DESIGN OF FLOTATION CIRCUIT 105
4_5_ BUBBLE SIZE DETERMINATION 107
4_5_1_ BUBBLE SIZE OBSERVATION
APPARATUS
107
4_5_2_ PHOTOGRAPHIC TECHNIQUE
109
CHAPTER 5
5_0 RESULTS AND DISCUSSIONS 111
5_1 DEGREE OF SATURATION 111
5.1_1_CONVENT I ONAL SATURATOR 111
5.1_1_1 MEASUREMENTS 111
5.1.1.2 RESULTS,DISCUSSION
AND CONCLUSIONS 112
51_2_ HI GEE ABSORBER 122
51_21 _ OBTAINED RESULTS
DISCUSSION AND CONCLUSION 123
5_2.. BUBBLE SIZE MEASUREMENTS 131
5_2_1_ CONVENTIONAL SATURATOR RESULTS 131
5_2_2. HIGEE SATURATOR RESULTS 132
5_2_3_ DISCUSSION AND CONCLUSIONS 143
5_2_3_1_ EFFECT OF PRESSURE ON
BUBBLE SIZE 143
5_3_ HYDRODYNAMIC STUDIES 152
5_3] _ SINGLE EXPERIMENTAL NOZZLE 153
5_3_2_ MULTI NOZZLE SYSTEM 154
5_3_3_ ANALYSIS AND CONCLUSIONS 154
CHAPTER 6

6.0 CONCLUSIONS 166
6_1 CONVENTIONAL SATURATION SYSTEM
166
6_2 HIGEE SATURATOR RESULTS
167
6_3 HYDRODYNAMIC STUDIES
168
CHAPTER 7
7.0 RECOMMENDATION FOR FUTURE WORK
169
CHAPTER 8
8_0 REFERENCES
CHAPTER 9
APPENDICES

CHAPTER 1
1_0 INTRODUCTION
1_1 DISSOLVED AIR FLOTATION
The earliest attempt recorded using flotation as a
separation method involved a British patent in 1860 (RAMIREZ E.R.,
1976). This process involves the addition of oil to wastewater
where the lighter density of the oil surfaced impurities in the
water itself. Since then, significant efforts were carried out to
improve the efficiency and the productivity of the "adsorptive
bubble separation techniques".
More recently, Dissolved-Air Flotation has become
accepted, in particular in the Scandinavian countries and the
United Kingdom with more than 50 plants in operation or under
construction. The largest dissolved-air flotation plant currently
being constructed in the UK is the 315m 3 /day Frankley water
treatment works (ZABEL T.F., 1980). Dissolved-air flotation has
been specifically developed for the treatment of algal laden and
waters. The flocs produced by the treatment of these waters have
a low settling velocity, particularly when the water temperature
is low, even when polyelectrolytes are added. Treating these
waters by flotation requires smaller tanks and produces better
1
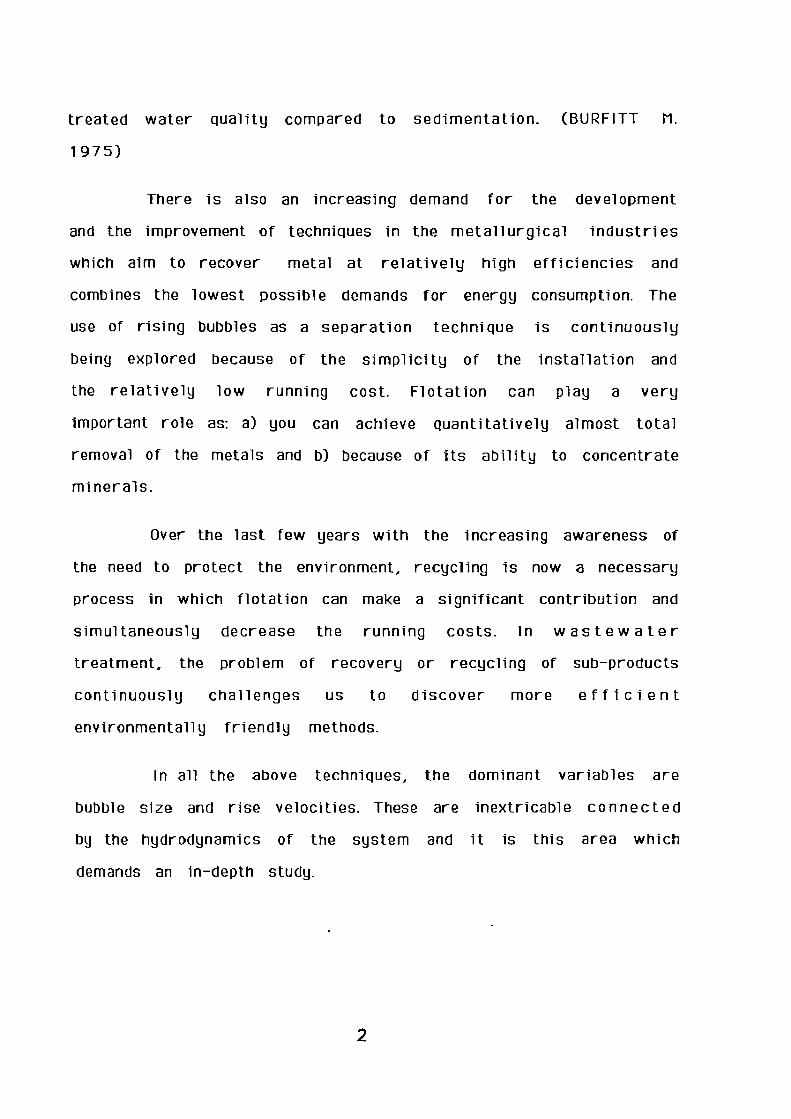
treated water quality compared to sedimentation. (BURF ITT M.
1975)
There is also an increasing demand for the development
and the improvement of techniques in the metallurgical industries
which aim to recover metal at relatively high efficiencies and
combines the lowest possible demands for energy consumption. The
use of rising bubbles as a separation technique is continuously
being explored because of the simplicity of the installation and
the relatively low running cost. Flotation can play a very
important role as: a) you can achieve quantitatively almost total
removal of the metals and b) because of its ability to concentrate
nil nerals.
Over the last few years with the increasing awareness of
the need to protect the environment, recycling is now a necessary
process in which flotation can make a significant contribution and
simultaneously decrease the running costs. In wastewater
treatment, the problem of recovery or recycling of sub-products
continuously challenges us to discover more efficient
environmentally friendly methods.
In all the above techniques, the dominant variables are
bubble size and rise velocities. These are inextricable connected
by the hydrodynamics of the system and it is this area which
demands an in-depth study.
2

1_2 PURPOSE OF THE PRESENT WORK
The broad objective is to look at techniques of producing
finely divided gas bubbles by dissolved air flotation.
With the "conventional" dissolved air flotation devices
the saturated stream of water is introduced through a restricted
nozzle at a high velocity. This will substantially affect the
hydrodynamics of the system which interferes with the structure
of the fragile flocs if they are present in the solution.
However, Higee Devices are used lately in the field of
process intensification, particular for gas/liquid contacting. The
basic idea is the application of very big accelerations to the
countercurrent flow of gases and liquids in a reticulated torus. In
this way fine bubbles are generated and also gases with a very
low solubility can absorbed easily into a liquid. (BALASUNDARAN V.
& PORTER J.E., 1990).
As Higee techniques can handle more throughput it should
be possible to hydrodynamically design the system to produce
considerably less turbulence in the flotation tank. For this reason
part of the study, is to investigate the hydrodynamic regimes in a
tank.
3
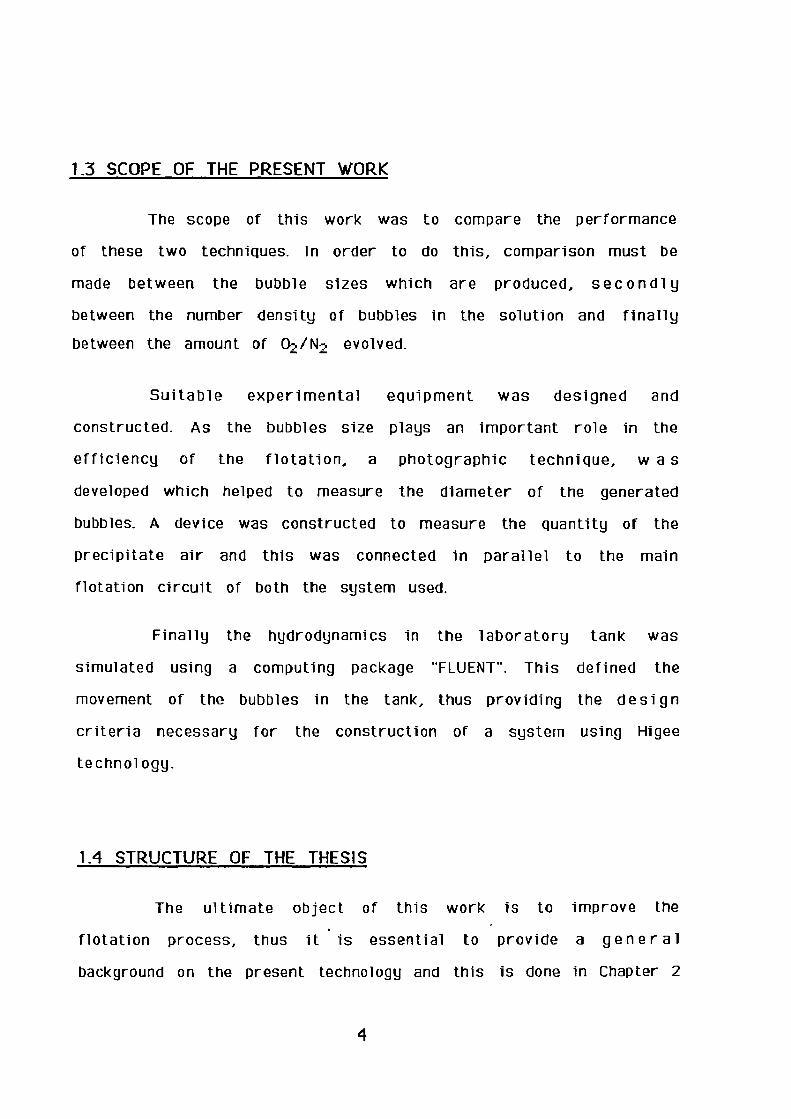
1_3 SCOPE OF THE PRESENT WORK
The scope of this work was to compare the performance
of these two techniques. In order to do this, comparison must be
made between the bubble sizes which are produced, second] y
between the number density of bubbles in the solution and finally
between the amount of 02 /N, evolved.
Suitable experimental equipment was designed and
constructed. As the bubbles size plays an important role in the
efficiency of the flotation, a photographic technique, w a s
developed which helped to measure the diameter of the generated
bubbles. A device was constructed to measure the quantity of the
precipitate air and this was connected in parallel to the main
flotation circuit of both the system used.
Finally the hydrodynamics in the laboratory tank was
simulated using a computing package "FLUENT". This defined the
movement of the bubbles in the tank, thus providing the design
criteria necessary for the construction of a system using Higee
technology.
1_4 STRUCTURE OF THE THESIS
The ultimate object of this work is to improve the
flotation process, thus it • is essential to provide a gener al
background on the present technology and this is done in Chapter 2
4
which surveys the types of the processes and the theoretical
mechanisms by which bubbles-particles interact.
The experimental work recorded in this report
concentrates on bubble formation and mass transfer thus chapter 3
reflects this by surveying the literature and techniques of
characterising bubble processing. Chapter 4 describes the
apparatus and measurement techniques on two kinds of saturators.
The first one was the conventional packing saturator and a single
nozzle was used as a gas distributor, while the second one was a
Higee rotating packing absorber. The scope of this investigation
was to compare in Chapter 5 the efficiencies of the two
arrangements. Also in the same chapter briefly, a model is
described for the hydrodynamics of the conventional system.
5

CHAPTER 2
2_0 LITERATURE SURVEY OF FLOTATION PROCESSES
2.1. TYPES OF FLOTATION TECHNIQUES
Flotation can be described as a gravity separation process
in which gas bubbles attach to solid particles to cause the
apparent density of the bubble-solid agglomerates to be less than
that of the water allowing the agglomerates to float to the
surface.
This work is primarily concerned with dissolved air
flotation, thus this technique is described in detail. However in
order to provide a comparison, other techniques are briefly
referred to.
The different methods of producing the gas bubbles give
rise to different types of flotation processes which a r e
electrolytic flotation, dispersed-air flotation, and dissolved-air
flotation (ZABEL F.T., 1980).
2.1.1 Electrolutic flotation
The basis of electrolytic or electro-flotation is the
generation of bubbles of hydrogen and oxygen in a dilute aqueous
6

solution by passing a direct current between two electrodes (K.L.
SUTHERLAND, 1955).
The process has the disadvantage that the electrodes need
periodic replacement and fouling of the electrodes is also a
frequent problem. One advantage however is that the bubble
formation does not create turbulence, therefore this system is
attractive for the removal of fragile flocs.
The bubble size generated in el ectro-fl otati on is very
small, (45-180pm) and the surface loading is therefore restricted
to less than 4m3 /h compared with up to 12m 3 /h for dissolved air
flotati on.(E. RAMIREZ, 1976)
The application of electro-flotation has been restricted
mainly to sludge thickening and small effluent treatment plants,
(4 -5 m 3 /h). The process has been reported to be suitable for very
small water treatment instal lations (KLASSEN,V.I., 1963)
2.1.2 Dispersed-air flotation
For this technique the stream of the air is introduced
into the solution through a dispersion system which usually is a
porous diaphragm made of either sintered glass, ceramic or other
appropriate material. The air pressure depends on the hydrostatic
head of the liquid above the distributor. This category is used in
techniques for the enrichment of ores, where .the air is introduced
7

with the help of a stirrer which both disperses and breaks up the
bubbles. (K. NATI S 1977)
As described in 2.2.2, a large number of separation
techniques using aDsorbed bubbles are not suitable for water
treatment applications because either the bubble size tends to be
large (>1mm, compared to 30-1 bum for dissolved-air flotation
and 45-180pm for electro-flotation) or the high turbulence (ore
flotation) breaks up the fragile flocs formed during the chemical
pretreatment, or undesirable chemicals (molecular flotation, ion
flotation) are required to produce the air bubbles.
2.1.3 Dissolved-air flotation
In dissolved-air flotation the bubbles are produced by the
reduction in pressure of a water stream pre-saturated with air at
a higher pressure. The three main types of dissolved-air flotation
are vacuum-flotation, micro-flotation and pressure flotation.
(K.NATI S,1979)
Vacuum flotation
In vacuum flotation the water to be treated is saturated
with air at atmospheric pressure. A vacuum is then applied to the
flotation tank releasing the air as small bubbles (30-90pm). The
amount of air available for the flotation is limited by the
achievable vacuum. This process is being applied only in the paper
8

industry for the recovery of fibres. Vacuum-flotation has three
main disadvantages: a)i t is a batch process, b)i t requires
sophisticated equipment to maintain the vacuum, c)the amount of
air available is limited by the vacuum. The main advantage of this
technique is that fine bubbles are formed without the addition of
any chemicals which might affect the composition of the solution.
(LABEL T.F., 19E10)
Plicroflotation
The so-called microflotation is an efficient process for
removing colloidal pollutants from water. It uses the same
principles as vacuum flotation but is generally carried out i n
laboratory size units. The technique was first introduced in 1965
by Rubin and Cassel. The main difference from other flotation
techniques is that microflotation requires very low gas flow
rates, extremely small bubbles (4011m) and heterocoagulati on of
the colloidal dispersions with a hydrous metal oxide. Due to small
bubbles and a low flow rates, a relatively large gas/liquid
interfacial area per unit of gas flow rate is produced with no
severe agitation.
Pressure flotation
Pressure flotation is currently the most widely used
dissolved-air flotation process. In pressure flotation air is
dissolved in water under pressure and released at the hydrostatic
pressure of the tank.
9

Three basic pressure dissolved-air flotation pr ocesses
can be used: full-flow pressure flotation, split-flow pressure
flotation and recycle-flow pressure flotation (See Fig.1). Each
operate under the same basic principle whereby saturated
pressurized water is introduced to the flotation tank through a
pressure release device and mixed with the flocculated water. In
the pressure release device the pressure is reduced to the
hydrostatic pressure so releasing the air in the form of fine
bubbles (20-100pm). The air bubbles attach themselves to the
flocs and the agglomerates float to the surface_ The float can be
removed from the surface and the clarified water is taken from
the bottom of the flotation tank.
In full-flow pressure flotation, the entire influent is
pressurized and aerated. In split-flow pressure flotation, a
fraction of the influent is subjected to pressurization, while the
remainder flows directly to flocculation-flotation tank_ This
flow scheme of fers a cost saving over full-flow pressure
flotation, since the saturator and the feed pump only handle a
portion of the total flow and therefore smaller units a r e
required. However, as less air is provided in the split-flow
system, this process has to operate at higher pressure in order to
provide the same amount of air.
For water treatment applications, requiring the removal
of fragile flocs, both the above systems are not suitable because
any floc formed prior to the air release device would be
destroyed by the high shear experienced during the pressure
10

release. For this application recycle-flow pressure flotation is
the most appropriate system.
In recycle-flow pressure flotation, the whole influent
flows directly to the flocculation tank or to the flotation tank if
separate flocculation is not required. Part of the clarified
effluent is recycled, pressurized and saturated with air. Because
of the additional flow through the flotation tank due to recycle,
the flotation tank has to be designed larger than for the full-
flow system especially if the recycle flow required is large, as
for sewage sludge thickening.(K. NATI S, 1981)
11

-OwClarifiedeffluent
c) RECYCLE-FLOW PRESSURE FLOTATION
Flocculatingagent
Sludge
Flocculatingagent
a) FULL-FLOW PRESSURE FLOTATION
Sludge
t
Clarifiedeffluent
Flocculatingagent
ilFLOCCULA T I ONCHAMBER
FLOTAT IONTANK
SATURATOR
b) SPLIT-FLOW PRESSURE FLOTATION
Sludge
it
Influent FL OCCULATI ON FLOTAT ION •CHA MBER TANK Clarified
effluent
SATURATOR
FIG.1.Types of pressure dissolved-air flotation
12

2_2 FLOTATION AS A SEPARATION METHOD
2.2.1 General aspects
All separation methods, either physical or chemical, are
based on differences in properties on the substances to be
separated e.g. the adsorptive bubble separation technique where
flotation is included, is based on the differences in surface
activities. The substance which is going to be separated might be
the size of a molecule or a colloid or larger. These substances
are adsorbed or adhered selectively onto the bubbles surfaces
which are rising through an aqueous medium. In this way they are
separated or gathered in the surface of the solution.
In cases where the substance is not surface active by
itself, it can be made active by either the formation of a complex
or the adhesion onto another substance which is called collector.
In that procedure the substance (in liquid or solid form) are
removed from the solution. This does not occur in percolation
which is the opposite. Both of these methods are proper and
particularly effective in the removal or recovery of small
amounts of substances from large quantities of liquid where they
are contained.
In particularly flotation has been used for more than a
century when it was first used for the enrichment of ores. Today
13

it supplies 90% of the annual production of copper and zinc. In
recent years this field has been extended to the treatment of
wastewater and potable water.(BUREAU OF MINES, 1975)
Flotation is quite a complicated procedure, because its
efficiency depends in many variables. However these can be
categorized basically as chemical effects and hydrodynamics.
From the chemical view point the most basic governing
factors effect both the particles or ion to be removed and the
aqueous medium which they are being removed. These factors are:
1) the crystal lattice of the particles ii) the size of the ions iii)
the hydration of the polar groups of the solids iv) the solubility
of the surface-active substances and their complexes v) the
superficial charge. When considering hydrodynamics, factors such
as the degree of stirring, the aeration, bubble coalescence and the
probability of the collision between a bubble and a particle are
important. The selectivities which are achieved with flotation is
generally a result of a balance which must exist between all the
factors. Each factor might have an important role in a set of
conditions, but its interaction between other factor affect the
wide system. For this reason the term "probability of flotation"
has been introduced. (KLASSEN V.I, 1963)
This is when a statistical analysis of the process is
introduced in order to facilitate the correct evaluation of
flotation as a technological . process. The probability of flotation
of a given particle is determined by the probabilities of individual
14
states. These consist of the interaction of particles with
reagents, collision with bubbles, attachment to bubbles, action of
separating forces, conditions of formation and disruption of
aeroflocs and processes occurring in the froth layer. (KLASSEN
V.I., 1963)
15

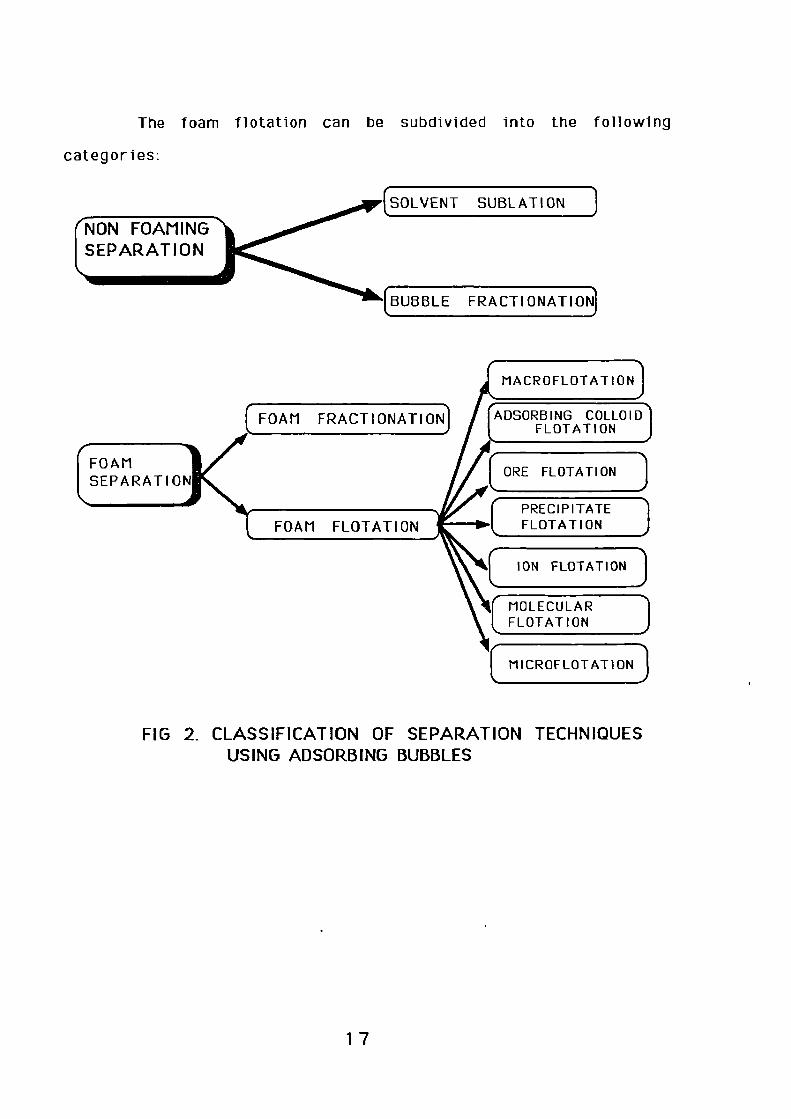
2.2.2. Classification of separation techniques using absorbed
bubbles
Fig.2 illustrates these techniques which can be classified
into two basic groups: (KARGER B.L, 1967)
The smaller one is called 'Non-Foaming Absorptive Bubble
Separation' and in this case the forming of the froth is not
necessary. The larger group is called "Foam separation** and it
demands the formation of froth or foam for the removal of the
component which is going to separated.
"Non Foaming separation** can be separated into two
smaller categories: a) bubble fractionation in which there is a
transfer of the components through the liquid surface of a bubble
due to absorption or the adhesion of the particles on the bubble
b) solvent sublation is where the component is transferred in the
liquid phase but is not blended with the solvent and is found on
the top of the system. (SEBBA F. 1962)
'Foam Separation ** can be separated into two sub-
categories:
a) foam fractionation: which means the removal of the solute is
achieved after its absorption on the surface of the bubbles.
(LEMLICH R, 1972)
b) foam flotation: which is simply the removal of particles by
foaming.
16
INON FOAMINGSEPARATION
FOAM FRACTIONATION
C----FOAMSEPARATION
1ADSORBING COLLOID
FLOTATION
ORE FLOTATION )
PRECIPITATEFLOTATION
/
MOLECULARFLOTATION
ION FLOTATION )
)
MICROFLOTATION )
The foam flotation can be subdivided into the following
categories:
SOLVENT SUBLATION )
BUBBLE FRACTIONATION
MACROFLOTATION)
FIG 2. CLASSIFICATION OF SEPARATION TECHNIQUESUSING ADSORBING BUBBLES
17
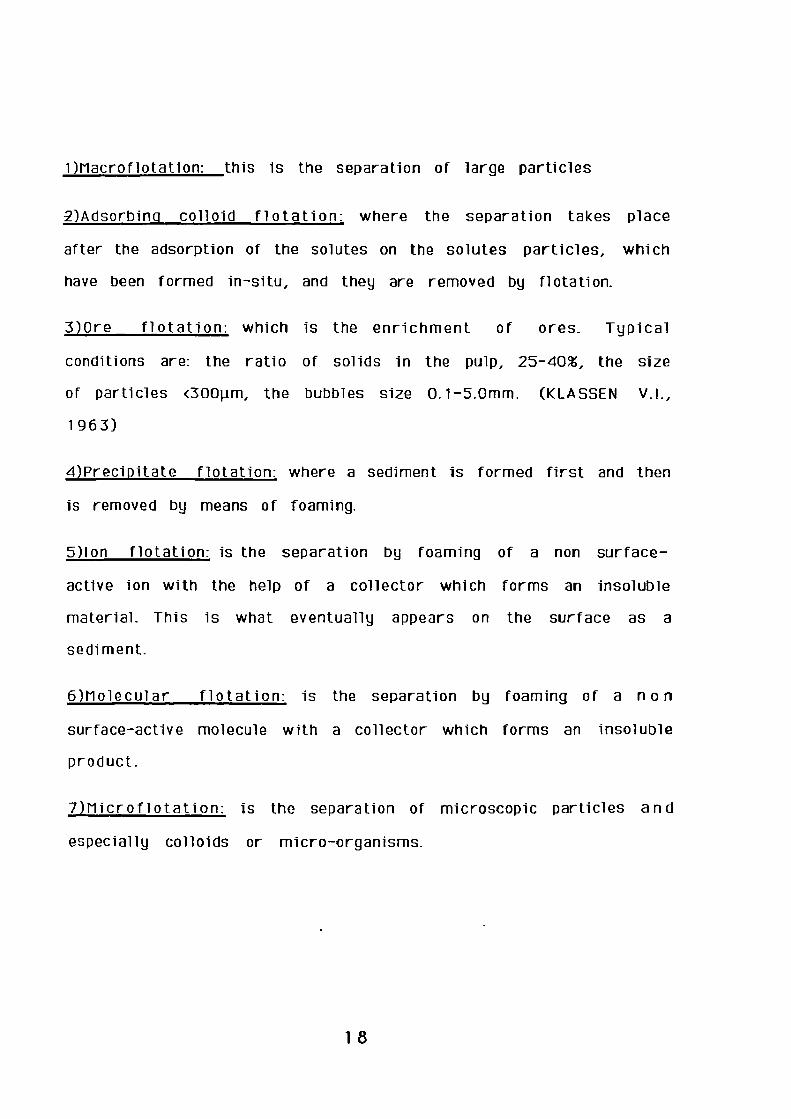
1)Nacroflotation: this is the separation of large particles
2)Adsorbinct colloid flotation: where the separation takes place
after the adsorption of the solutes on the solutes particles, which
have been formed in-situ, and they are removed by flotation.
3)Ore flotation: which is the enrichment of ores. Typical
conditions are: the ratio of solids in the pulp, 25-40%, the size
of particles <300pm, the bubbles size 0.1-5.0mm. (KLASSEN V.I.,
1963)
4)Precipitate flotation: where a sediment is formed first and then
is removed by means of foaming.
5)Ion flotation: is the separation by foaming of a non surface-
active ion with the help of a collector which forms an insoluble
material_ This is what eventually appears on the surface as a
sediment.
6)11olecular flotation: is the separation by foaming of a non
surface-active molecule with a collector which forms an insoluble
product.
7)Nicroflotation: is the separation of microscopic particles and
especially colloids or micro-organisms.
18

23 THEORETICAL CONSIDERATIONS
As indicated in 2.2.2 the interaction of particles withh
bubbles is a very big factor in efficient removal therefore it is
necessary to discuss the theoretical aspects.
The equilibrium adsorption of dissolved materials at a
gas-liquid interface is given theoretically by the Gibbs
equation:(APLAN F.F, 1966)
d6=-RT/ {rid(In)} [1]
where: 6 = surface tension
ri= the surface concentration of the adsorbed
component i
T= absolute temperature
R= universal constant
ai= activity of . component i
19

The minus sign shows that materials which concentrates at
the surface generally lowers the surface tension.
In the case of ionic surface active substances and under
certain circumstances the equation (1) can simplify to the
following:
r5,d611-InEz 1 /RI [2]
where Es is the concentration of the surface active substances_
From the above equation Fs can be calculated, if the change of the
surface tension is known as a function of the concentration of the
surface active substance, when a Langmuir type of isotherm may
be applicable. On the other hand trace materials follow the linear
adsorption isotherm:
ri'l<1 CI [3]
if their concentrations are low enough.
where Ki is the equilibrium constant between the concentration o f
the bulk and the surface and Ci is the concentration of t h e
component i.
20
The free surface energy is decreased with the absorption
of heteropolar surface-active reagents and the hydrophobic layer,
which is formed around the bubble, acts as a -bridge" so the
adhesion between the bubble and the particle can be achieved. The
absorption of the surface-active reagent on an interfacial surface
depends on the initial concentration of both the pH of the solution
and on time. Equilibrium can be achieved within 0.1 sec in the case
of alcohols with short chains, several seconds in the case of
aromatic amines and some hours in case of sulphuric sal ts.
Generally speaking different mechanisms take place for the
adsorption of the surface-active reagent on to the particle under
di fferent circumstances, e.g. different values of pH or the
presence or absence of other ions.
Surface-active substances act as combinations of two or
more mechanisms on the surface of the particles_ These
mechanisms result in the formation of bonds:
1) between the polar groups and the "sites" on the mineral surface
2) between these sites of the mineral and the rest of the particle
3)between the chains of the hydrocarbon and the surface-active
substances
4) between the polar group of this substance.
Because of the bonds which define the hydrophobic
character (i.e. the ability to float) of . the particles in a
particular system, we can achieve a high degree of selectivity in
21

the field of separation with the appropriate choice of surface
active reagents.
Quantatively this can be expressed with the angle of the
contact, 9, between the bubble and the particle. This angle is
related to the surface tensions of these three phases and is given
by the Youngs equation:
sn---. E.1 + L.A sin(9 ) [4]
where ZCSA,�SSL,Z5L A, are the coefficients of the interfacial
tension between solid-air, solid-liquid, and liquid-air
respectively. Another important equation is the Durpe's formula
which determines the Work of the adhesion in the interfacial
surface in solid-air, Ws', .
WsA := 69L+6LR-69A ( 1 -cos9) [5]
It is easily understood that to replace the liquid which is
on the surface of a particle by the gas (air), a minimum contact
angle is required to be formed with the bubble. The Energy of the
adhesion between the liquid and the solid must be smaller than the
Energy of coherence of the liquid, which for water is 149mJ/m2
(APLAN F.F, 1966).
22
When the contact angle is decreased (the particles are
more hydrophilic) smaller bubbles are required for the stability
of the solid-bubble couple. This has been observed (ADVANCED
STUDY INSTITUTE, CAMBRIDGE, 1986) in the case where flotation
is used for the treatment of wastewaters, where the typical
conditions for the contact angle is (40 0 - 5 0 0 ) demand very tiny
bubbles (diameter smaller than 0.1mm). (ADVANCED STUDY
INSTITUTE, 1982) Flotation is generally promoted by small 6 s A
and large values of 6 LA and 8 SL (hydrophobic particles). On the
other hand, the absorption of the surface active substances is
capable of changing the hydrophilic character of a particle to a
hydrophobic one with the change of the interfacial tensions of the
Youngs equation [4] in accordance with the following:
-c16/da=ri [6]
which is another form of Gibbs' equation [11,
where przthe chemical potential of the surface
active substance
ii =the surface concentration of adsorbed
component i
23
2.4 THE EFFECT OF ADDITIVE REAGENTS
These are substances which are added to the pulp prior or
during flotation in order to facilitate the process. They can effect
both the properties of the material to be separated and the
properties of the liquid, thus are classified as follows:
(FUERSTENAU D.W, 1962)
Frothers. The main purpose of frothing agents is to
produce quality froth, by changing the surface tension of the
water. Also, the introduction of the frothers is responsible for
the production of an appropriate size of bubble. This happens by
the absorption of the frother at the bubble surface between the
air and the liquid.
Most frothers are organic having structural formulas
characterized by the presence of two opposing constituents, one
part of the molecule being nonpolar and the other polar. They are
therefore heteropolar, and consist of one or more hydrocarbon
groups attached to one polar group with the hydrocarbon radical
having up to five or six carbon atoms. Examples of frothers are
pine-oil, soaps and mixtures of aliphatic alcohols.
Another very important property of frothers is that they
can drastically improve the collision between the particle and the
bubble, thus keeping this aggregate stable, so the undesired
24
particles which are mechanical ly trapped in the foam can be
removed for recovery from the tail ing water. It is noted that
frothers must to a certain extent be soluble in water otherwise
they will not be able to perform effectively.
liodifuing reagents: They have been used to select between
different ions or particles that might co —exist in a dispersion
system. Among the most important of these are: (APLAN F.F, 1979
Activating agents which are used to improve the attachment of the
bubble collector to the particle e.g. sodium sulphide, copper
sulphate.
Depressing agents which are used to inhibit flotation of unwanted
minerals by coating the particles so that they will not attach
themselves to rising air bubbles. At the same time they should not
coat minerals which are required to float. Examples of depressing
agents are quel uacho for calcite, coating sodium silicate for
silica and potassium bichromate for galena.
pH regulators: As well as modifying the pH, these
sometimes alter the surface of the ores and also regulate the
ionization potential of the collectors. Generally lime or soda ash,
sulphuric acid, hydrochloric acid, sodium bicarbonate are used.
Dispersion agents: They are mainly used to facilitate or to
inhibit the fl occulation.
25

2.5 FACTORS INFLUENCING FLOTATION PROBABILITY
Generally flotation can be considered as a phenomenon
where the probability of a particle to reach the foam i.e. the
possibility of the flotation, is the product of the three following
terms: (KITCHENER J.A, 1983)
1) The probability of collision between the particle and a bubble.
2) The probability of adhesion.
3) The probability of maintaining the adhesion.
The first probability depends on the hydrodynamic
characteristics that govern the flotation chamber_ The second
depends on the superficial forces and the third on the collision
with other particles and the turbulence in the system. The
adhesion between the particle and the bubble is the basic
mechanism of flotation and this stage is the one which defines the
kinetic characteristics of the flotation. If we consider the
mechanism of flotation, the adhesion is as result of either the
collision of the rising bubbles with the particles or as a result of
the formation of new bubble on the surface of the particles, a
phenomenon which is relevant to the nucleation.
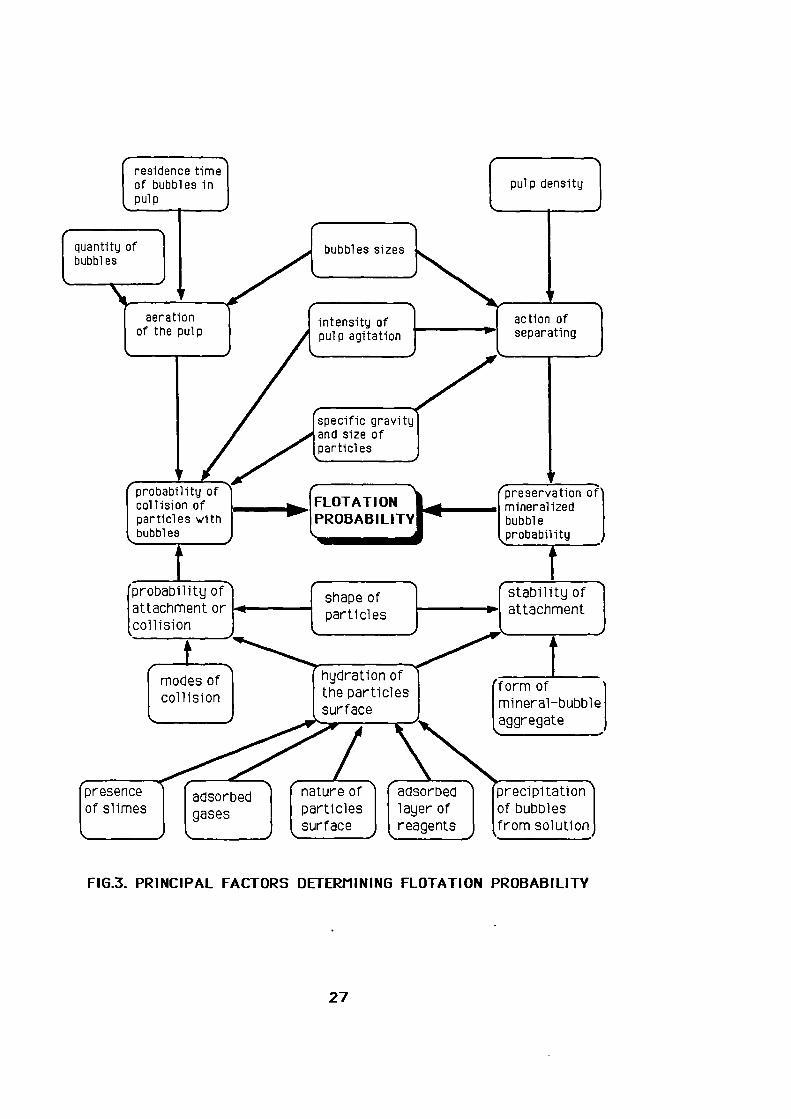
The multiple interrelation of all these phenomena I s
illustrated in details in FIG 3
26
residence timeof bubbles inpulp
pulp density
V/*preservation
, mineralizedbubbleprobability
action ofseparating
specific gravityand size ofparticles
probability ofcollision ofparticles withbubbles
FLOTATION •PROBABILITY
presenceof slimes
adsorbedgases
nature ofparticlessurface
tpa tr toabcanbmi l ie tnyt oo f;{ shape of
particles
stability ofattachment
collision.4.•nn,.......
t
,e0•••"•,Ar
tmodes ofcollision
hydration ofthe particlessurface
(formfmoinm o
e r afl-bubble
aggregate
/ adsorbed precipitationlayer of of bubblesreagents from solution
quantity ofbubbl es
FIG.3. PRINCIPAL FACTORS DETERMINING FLOTATION PROBABILITY
27

Other ways include the trapping of the rising bubbles i n
the lattice which is due to the flocculation and finally the
confinement of the bubble in an aggregate as it forms. This last
way does not appear in the flotation with dispersed air because
the bubbles, rise to the surface with quite large velocities due to
their large size. In that case only the mechanism of collision is
important. In the case of dissolved-air flotation, it is possible
that all the three aforementioned mechanisms take place. To
increase the possibility, therefore to achieve adhesion between the
particle and the bubble after the collision it is necessary to add
surface active substances_ In the following Table (A) t h e
influence of the flotation variables can been seen on the speed of
the adhesion.
28

TABLE A
INFLUENCE OF DIFFERENT VARIABLES OF THE FLOTATION ON THE
SPEED OF ADHESION BETWEEN PARTICLES AND BUBBLES
Size of particle:
Size of the bubble:
Collectors:
The bigger the size o fthe particle the slowerthe adhesion takes place
The bigger the size o fthe bubble the quickerthe adhesion takes place
Dramatically improve theadhesion
Foaming reagents:
If a collector is present,these only marginallyincrease the rate ofadhesion
Depressing reagents Dramatically decrease orhinder the adhesion
Bubble-particle contact This must be in the rangetime: of 5 msec
29

The rate of flotation is related to the numbers of the
bubbles and independent of the diameter of the bubbles if smaller
than 0.1mm. This means that for a given flow rate, the bubbles
must be as small as possible, (below the 0.1mm size), thus this
increases the number density. (REAV D. 1975)
In the present work efforts were made to determine the
bubble size and its influence on flotation efficiency. In order to
do this, measurements on the fraction of dissolved air which is
released from the saturation solution was used to calculate the
bubble number density in turn which has an important influence on
the flotation efficiency.
2.5.1 Bubble stabilitu
2.5.1.1.Phusical effects
Regarding the physicochemical aspect of the flotation two
models are considered today as acceptable. (CLARK A.N, 1953)
In accordance with the first, electrostatic, the energy for
the coupling of the particle with the bubble is due to electrostatic
attraction between one particle and an interfacial surface with
opposite charge. In accordance with the second, the particles
become hydrophobic with the absorption of the collector and this
allows their adhesion with the bubbles.
30

After the bubbles are formed they tend to coalesce. This
decreases their surface areas/unit volume and consequently the
free energy of the system, and subsequently they tend to rise
faster as the result of increased buoyancy. Both of these
phenomena can be inhibited with the addition of surfactants which
a) stabilize the surface of the bubbles by forming a wet hymenio
thus reducing the coalescence potential and b) allow better
adhesion of the bubbles to the particles, thus the suspended
material is transferred to the surface of the solution.
As the bubbles move towards the surface of the solution
they collide with each other so it is quite possible f o r
coalescence to occur. The rising velocity depends on the size of
the bubbles and also on the presence or not of surface active
substances in the solution. Smaller bubbles move with smaller
velocities than the bigger ones due to the buoyancy forces. The
surface active substances not only decelerate the rising bubbles,
but also reduce the adhesion between them due to selective
absorption on the surface of the bubbles. The latter property is
only valid in the case when all the bubbles have similar sizes,
otherwise the bigger bubble will absorb the smaller one. Bubbles
with size 0.2mm in pure water behave as solid spheres and we can
apply the well-known Stokes-law for Reynold numbers <1_ (BUSEV
A.I, 1981)
2.5.1.2. Chemical effects
The surface active substances which are adsorbed on the
bubbles surfaces, have their polar groups orientated towards the
31

liquid. The surfactants are hydrated and eventually the bubbles
are surrounded with an hydrated layer. This layer protects the
bubbles from rupturing and also prevents adhesion and
coalescence. It has been reported that an increase in concentration
of the foaming reagents reduces the size of the bubbles to a
certain extent. As the concentration increases there is the
continuous removal and assembly of surface active substances on
the surface of the liquid and the size reaches steady state.
In the case of dissolved air flotation where the bubbles'
radius is too small the pressure in the bubble is increased to a
certain point, and subsequently the air contained in the bubble is
re-dissolved. So for a stable bubble to exist the pressure of air
in the bubble must be equal to or preferably smaller than the
external pressure where the liquid is supersaturated with air.
It has been found also that the bubble has a negative
charge so all the anions are gathered basically in the air-side of
the interfacial surface while all the cations are in the liquid
side. Ascending to the surface through the solution, the bubbles
increase in size because of the decrease of hydrostatic pressure,
so the rising velocity is increased. Because of the positive
superficial potential which exists in every interfacial surface,
they tend to take a spherical shape eventually if they have sizes
<1.5mm, regardless of of the flotation technique. (NEMEROW N.L,
1 97 1)
32
2.5.2. Foam stabil i tq
Finally as the bubbles reach the surface of the solution
they form a foam and the stability of this is important. On
reaching the surface they "push" the liquid upwards and become
surrounded with a liquid hymenion. They assemble side by side and
in this way they form froth. The froth, because it has a n
increased free surface energy, as a result of the big interfacial
surface liquid-air appears thermodynamically unstable. The
foaming is a dynamic balance, as new bubbles are added
continually from the solution others disappear from the top of it.
In steady state conditions, the volume of added air and subtracted
air are equal. The number of bubbles which are added is bigger
because of their adhesion on the way up. For this reason the
bubbles in the top layer of the froth are bigger. The average
thickness of the liquid hymenion between the bubbles is 1 um. The
liquid which is trapped between them goes back into solution
because of gravity effects and as a result, the thickness of the
hymenion decreases, so they start to adhere each other. They also
adhere because of the bigger pressure which exists inside the
small er bubbles. Generally speaking the quality of the foam is
affected by a large number of variables but it mainly depend on
the chemical composition of the hymenion. When in solution there
are more than one surface substances, due to fractionation in
bubbles which in turn is due to the different rates of adsorption.
(FUERSTAU DAV, 1 962)
33

CHAPTER 3
3_0 BUBBLE CHARACTERISTICS
3.1 BUBBLE-PARTICLE INTERACTION
3.1.1 General considerations
In mineral flotation the particles are general ly large
typically 50pm in diameter or larger, therefore bubbles have to
be large, of the order of 1 mm, and the solid content in the pulp is
normally high, of the order of 25% by weight.
In effluent treatment by contrast, the particles are
typically small less than 2011m in diameter and close to neutral
buoyancy, and they are also present in very dilute concentration,
often as low as 5Oppm. It has been found advantageous to use very
small bubbles, of ten less than 100pm in diameter. These are
generated by dissolved air flotation or electroflotation. In
characterising removal efficiency two parameters can be used:
Collection Efficiency, Eo, and a Thickening Parameter, TP. The
34

former depends on the bubble size and the latter on the degree of
air saturation. (MATIS K., 1977)
3.1.1.1 Collection Efficiencu of Flotation
Experience has shown that, at a given gas supply rate,
more efficient removal is possible if the bubbles are small, and
it is of interest to try to predict, or, measure the effect of
bubble size and particle size on the collection efficiency, Eb,
defined as the fraction of particles in the bubbles path which
actually collides with bubble.
SUTHERLAND has found that: (COLLINS G.L., 1976)
Ec..3c01, [7]
where: dp= diameter of the particle
db= diameter of the bubble
At a given gas rate, the volume swept out by the bubbles
is inversely proportional to the bubble diameter. Flotation rates
equals the product of collection efficiency and swept volume.
Hence, the rate of flotation predicted by the above equation should
vary as (dp/db).
The hydrodynamics of the collection of particles by
bubbles was studied by FLINT and HOWARTH (1971). They found
35

that particle behaviour was characterized by two dimensionless
groups:
K. (pp*dp2*ut) / ( 9*p.*db)
[ 8]
G.(pp-R)*dp2*g/ 1 8*p.*ut [ 9]
where: p= the density
d= the diameter
[I= the viscosity of liquid
g= the gravitational acceleration
u t = the bubble terminal velocity
Subscripts p,l,b refer to particle,
liquid and bubble.
In case of fine particles (K<0.1, db <2011m ) the collection
efficiency was independent of K but strongly dependent on 6, i.e.
that for fine particles the inertia effects were very small in
comparison with the viscous effects. In this regime the collection
efficiency was:
36
[10]
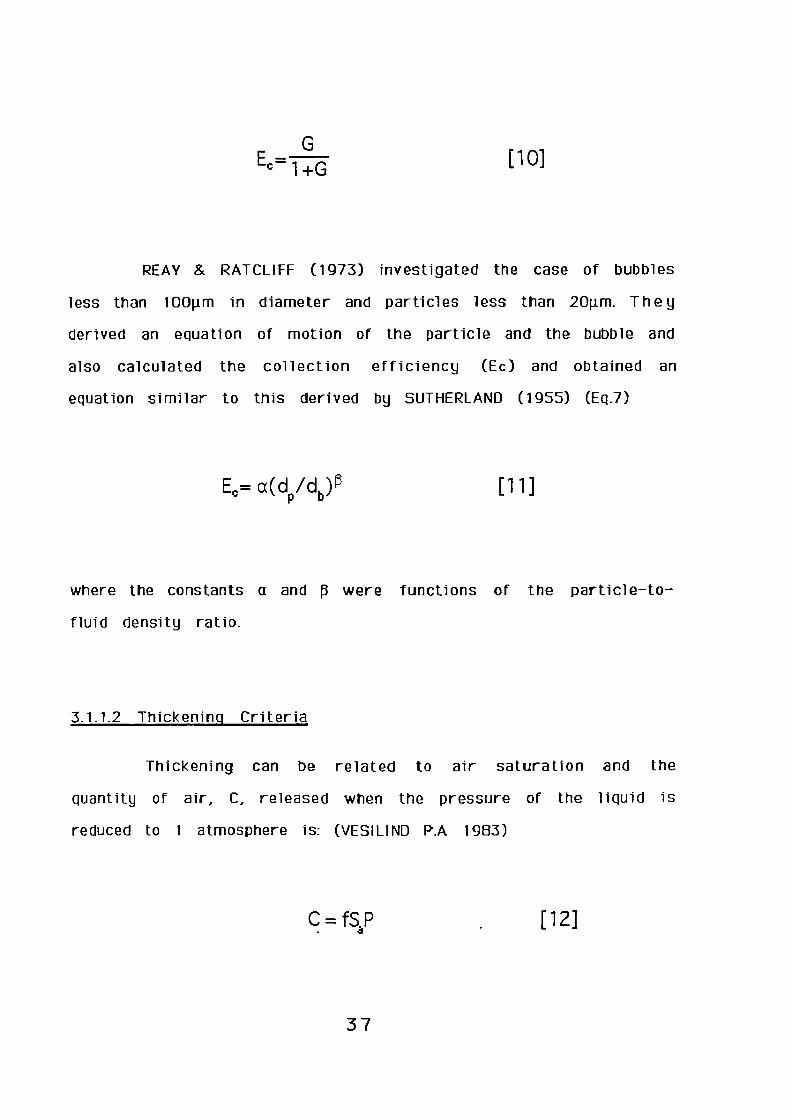
REAY & RATCLIFF (1973) investigated the case of bubbles
less than 100pm in diameter and particles less than 20p.m. The y
derived an equation of motion of the particle and the bubble and
also calculated the collection efficiency (Ec) and obtained an
equation similar to this derived by SUTHERLAND (1955) (Eq.])
Ec = a(dp/db ) P [11]
where the constants a and /3 were functions of the particle — to-
fluid density ratio.
3.1.1.2 Thickening Criteria
Thickening can be related to air saturation and the
quantity of air, C, released when the pressure of the liquid is
reduced to 1 atmosphere is: (VESILIND PA 1983)
C = fS3P [12]
37
where f is the fraction of saturation
achieved. (Typical values 0.50-0.85)
S a = saturation concentration of air at
Atmospheric pressure
P = pressure in retention tank (Atm)
The total amount of air in a flotation tank is (DICK R.I., 1972)
Ain = (fSal)) LQ = SaQ [13]
L=recycled rate as fraction of Q
Q=feed rate of influent
The last term (Sa Q) is the amount of air dissolved in the
feed, assuming full saturation. If the feed is aerobic sludge, the
fraction contributed to the sludge by oxygen may have to be
subtracted. After the pressure is released, the air at equilibrium
i s:
38

P Sa(L + 1 )Q [141
The amount of air available for flotation is either the
difference, or
A = Air, - Aq = Sa(fP-1 )LQ [ 1 51
In most of these cases it is more convenient to measure
the Dissolved Oxygen (DO) rather than the quantity of released
air. In these cases the modifying formula of Dicks, which has been
suggested by (BRATBV and MARAIS, 1975) is used.
Ca = [(Op + fP1\19) - (Os + N9)]V, [1 61
0 =measured DO at operating P and T, mg/1P
Os=dissolved oxygen concentration at 1 Atm and 0
o C, mg/1
Ns= dissolved nitrogen concentration at 1 Atm and
0 °C, mg/1 (estimated) •
39
Vr=recycle volume, 1
9 =operating temperature, oc
The principle parameter in the design of a dissolved air—
flotation system is the air/solid ratio, A/S.
Assuming that all the wastewater flow is pressurized, the
air to solid ratio is given by Eckenfeder and Ford (REYNOLDS T.D
1970)
A/S . 1.3 * Sa(fP - 1 )/S,. [17]
where A=air available for flotation (mg)
Sa=influent solids concentration (mg/1)
Ss=suspended solid concentration (rng/1)
For a system where pressurized recycle is used the above
equation is modified to
A/S .(Q * Ss)/1 .3 * S3(fP - 1)L [ 1 8]
40

In order to characterize flotation plants GEHR and HENRY
(1976) suggested the following thickening parameter, TP_ If we
assume that A is the air available for flotation in mg. S the
influent solid concentration in mg/1, Sf the float solids
concentration in mg/1, Vs the sludge volume in 1 and V the volume
of liquid in the flotation tank, then the effective influent soli d
concentration, C.ef , will be
Cf---TOTAL SOLIDS IN FLOTATION TANK/V [19]
where V=recycle volume Vr + sludge volume Vs
and the Effective Thickening Time Tf will be
Tf = St./ Ce f
Therefore,
TP = Tir / (A/S)
[20]
[21]
The terms in this formula can be modified for use with
continuous flow unit by evaluating the C a unit time period.
41

S *VTP = 5A
[22]
By rewriting the terms of the thickening parameter in terms of
their basic components, the TP can simplified to:
The TP should be constant for a particular sludge and
flotation unit, varying only with chemical dosage. The TP can be
used to compare the amenability of sludges of different types, or
at various flotation plants. The higher the TP the more easily the
sludge can be floated. The TP can also be used to assess the
effects of different polymers on flotation of a particular sludge,
the higher the TP the better the performance. (MARTIN M.J., 1974)
3.1.1.3 Mechanisms for attachment of bubbles onto particles in
Dissolved Air Flotation
The use of Stokes equation for a dissolved-air flotation
process is valid assuming unhindered movements on an air-solid
agglomerate (VRABLIK E.R., 1959)
ut = g(p,_pg)da2/18,, [23]
42

where
ut = terminal rise velocity of the gas-
solid agglomerate
p i = density of the liquid
p g = density of the gas-solid
agglomerate
da = diameter of agglomerate
p = viscosity of liquid
g = acceleration due to gravity
There are three different mechanisms by which bubbles
can assist the suspended solids in rising to the surface illustrated
in FIG. 4 and are:
1) Adhesion of a gas bubble to a suspended or solid phase.
2) Trapping of a gas bubble in a floc-structure as the gas bubble
rises.
3) The absorption and adsorption of gas bubbles in a floc-
structure as the floc structure is formed. (BIESINGER M.G., 1974).
The maximum possible contact in the first method may be
established by dissolving the gas into the stream that contains the
43
suspended phase due to surface tension acts as a plane for bubble
nuclei formation when the gas precipitates out of the solution.
The second mechanism depends upon the fl oc structure
being sufficiently irregular in structure formation in order that a
rising bubble may be trapped in the surface irregularities. The
larger the floc diameter the greater the probability that a rising
gas bubble shall trap itself and either not miss the floc-structure
or "fl ow around" the floc structure because of flow lines
established around the rising gas bubbles.
The third method of dissolved-air flotation includes the
formation of a floc around not only the suspended phase but also
around the gas-bubbles. This permits the formation of nuclei on
the surface of the suspended phase as well as allows the trapping
of the rising bubbles in the surface irregularities of the floc in
addition to absorbing gas bubbles in the floc formation.
By all the three aforementioned mechanisms a three phase
system (g-l-s) is created in which the following three interfacial
tensions exert governing effects:
a)the gas-solid tension (Vs)
b)the solid-liquid tension (s/1)
c)the gas-liquid tension (gin
Together they determine the contact angle at the point 0 f
conjunction of the three phases. The larger the angle the greater
is the tendency of the bubbles to adhere to the particles.
44

00
0
0
I •ISuspended
solids
Sol id particle or oil globule
i
P i p (C-;?:::11 t
Gas-bubble Gas bubble has Contactnuclei grown as pressure angleformation is released
a) Precipitation or collision of rising bubbles onthe suspendend phase
Fl oc structure
Rising bubbles
b) Trapping of gas bubbles in a floc structure
Rising bubbles
c) Trapping of gas bubbles as the floc structureis formed
FIG_4 MECHANISMS FOR BUBBLES-PARTICLES ATTACHMENT
45
3_2 MECHANISMS OF BUBBLE FORMATION
It is clear from 3.1 that the bubble size is critical for
good flotation performance, thus, part of this work was to assess
the size of bubbles formed at a particular nozzle. A review of the
theories of bubble formation and size measurements data is
necessary.
3.2.1 BUBBLE FORMATION FROM A SINGLE ORIFICE
This review is in two parts: firstly, dealing with a gas
flowing through a nozzle, and secondly with nucleation as a result
of saturated liquid flow through the nozzle. It is necessary to
consider the first because this defines the upper limit of size if
there is gas desorption within the body of the nozzle.
3.2.1.1 FORMATION REGIMES
There have been numerous studies on bubble formation
where an orifice has been used as a distributor. A comprehensive
survey and discussion of these studies have been made by (KUMAR
R. 1972). In all the studies it can be concluded that bubble
formation under gravity conditions could take place in different
regimes depending on the physical properties of the liquid, orifice
size, the volume of the gas. chamber underneath the orifice and the
46

gas flow rate (r1cCANN D.J., 1971). These regimes can be
classified mainly into the following.
Static Regime
This occurs at very low gas flowrate and with a reasonably
small gas chamber volume below the orifice where individual
bubbles of more or less regular shapes are formed. (DAVI NSON L.
1956). In this regime the frequency of bubble formation is
di rectly proportional to the gas flowrate while bubble size is
independent of the viscosity of the liquid and gas flowrate but
depends on the orifice diameter and surface tension of the liquid
(JACKSON R 1964). Thus, in this regime the balance between the
buoyancy and surface tension forces, which leads to the following
equation (assuming complete wetting of the orifice), from which
bubble size at detachment from the orifice can be roughly
estimated, since bubble formation is a dynamic process.
V(pipg )g = ndho- [24]
where: V= is the volume of the bubble
g=Accelerati on due to gravity
R=Densi ty of the liquid .
47

pg=Density of the gas
cl., =Diameter of the orifice
o-=Surface tension
Neglecting the density of the dispersed phase pg compared to
that of liquid phase p 1. , at detachment the above equation can be
written as in a dimensionless form:
clb , 4a 11/3
dh' [g(pt-pg)dh' [25]
where the constant c=( 1.5) 1 /3= 1.1 5
In practice the bubble is acted upon by forces in addition to
buoyancy and surface tension, so that c will not have the value
shown above. Experimental work has shown that equation is fairly
good at determining the size of bubbles but that a better value of
c in the equation would be approximately unity. It can be seen
from the above equation that for a given gas liquid system at a
given temperature the bubble diameter varies with the orifice
diameter raised to the power of one third.
48

Constant frequencu regime
The regime occurs at a moderate gas flowrate, where the
inertia of the liquid becomes more important than the surface
tension (LEIBSON I. 1959). In this regime bubble frequency is
independent of gas flowrate but depends on the orifice diameter as
observed by some investigators (DAVIDSON L. 1956) but not by
others (EVERSOL W.G., 1941) while bubble size increased with
increasing flowrate and the volume of the gas chamber. But the
effect of increasing the orifice diameter was found by some
workers (DAVIDSON 1956) to increase bubble size while others
(VAN KREVELEN 1950) found bubble size to be independent of the
orifice but depends on the gas flowrate.
Turbulent regime
This regime takes place at high gas flowrate where bubbles
are no longer formed individually, instead there is a considerable
spread of bubble size with the production of numerous small
bubbles (JACKSON R 1964), owing to the momentum of the gas
issuing from the orifice being sufficient to maintain it as a jet
before it breaks up into separate bubbles_ Thus, in this regime
bubble size decreases with increasing gas flowrate, as observed
by LEIBSON et al, who studied the behaviour of bubbles as a
function of orifice Reynolds number.
49

3.2.1.2 THEORETICAL MODELS FOR SINGLE ORIFICE BUBBLE
FORMATION
Several models have been proposed to predict the size of the
bubble at the orifice. All these models are based on the same form
of balance to describe the growth of the bubble, which takes place
in discrete phases (one, two or three stage model s). Bubble
growth takes place either at constant flow conditions, constant
pressure conditions or in the intermediate conditions.
Bubble formation at constant flow conditions means that, the
gas flowrate passing into the bubbles remains constant during
bubble formation, this can be obtained by using a small gas
chamber underneath the orifice, and a large pressure drop across
the orifice. Growth at constant pressure conditions arises from
the presence of large gas chamber volume, such that the pressure
drop across the orifice is small, hence the chamber pressure
remains constant, while gas flowrate and the pressure drop are
time dependent the growth is said to be in the intermediate
conditions.
Theoretical models on bubble formation at constant pressure
were discussed by some investigators (DAVIDSON J.F., 1960), who
considered the force balance and bubble formation to take place in
one stage, two stage growth was considered by others (LANAUZE
R.D., 1974). In the intermediate conditions a number of
investigators (NAMUR A., 1976) proposed a one stage model,w hi le
others (KHURANA A.K, 1969) • proposed two and • three stages models.
All these models are discussed below.
50

Q615V= C -
V 5[26]
One stage model
DAVIDSON AND SCHULERS (1960), proposed a model for
growth of a bubble in a viscous and in inviscid liquid. The model
assumes that the bubble is formed at a point source within the
liquid, where the gas is supplied and its motion is governed by the
balance of the buoyancy force and the drag forces due to viscosity
and the inertia. Bubble detachment is assumed to take place, when
the bubble centre has covered a distance equal to its own radius.
On the assumptions that the bubble is spherical throughout its
formation, and the momentum of the gas is negligible, the authors
have shown that, for the case of inviscous liquids, and small gas
flowrates bubble volume is given by the following equation, which
was obtained by considering the balance between the buoyancy
force and the inertia force only:
where C= is a constant has a value of 1.378
Q= is the volumetric flowrate
By assuming that the bubble moves at all instants with the
Stokes velocity appropriate to its size, the authors have derived a
simple equation, valid for viscous liquids and small gas
flowrates. This equation gives bubble volume in terms of the
51
LIQUID
IlkBuoyancy
Convectioncurrents
ASurfacetension
t 1
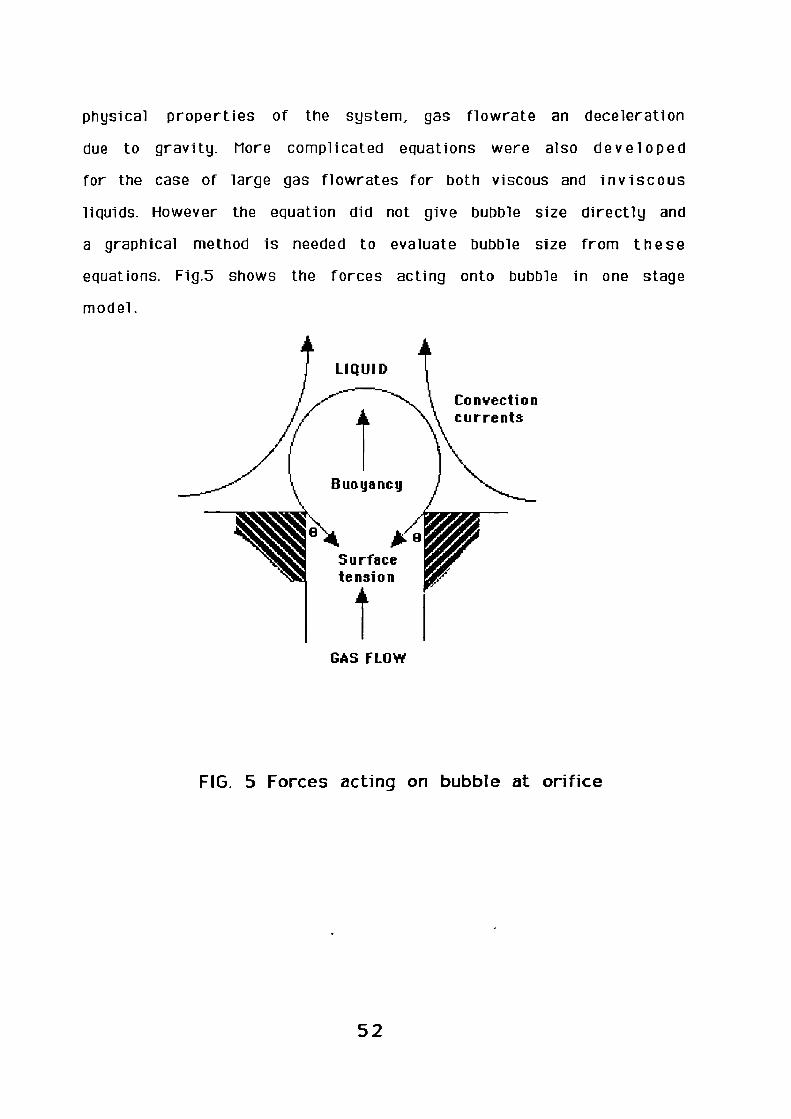
physical properties of the system, gas flowrate an deceleration
due to gravity. More complicated equations were also developed
for the case of large gas flowrates for both viscous and inviscous
liquids. However the equation did not give bubble size directly and
a graphical method is needed to evaluate bubble size from these
equations. Fig.5 shows the forces acting onto bubble in one stage
model.
GAS FLOW
FIG. 5 Forces acting on bubble at orifice
52
Two stage model
GADDIS et al (1986) have made an extensive investigation
for bubble formation valid over a wide range of viscosities and
gas flowrates. According to their model the bubble growths in two
stages.
In the first stage expansion, the bubble remains attached to
the nozzle up to the point when the resultant of the lifting forces
just exceeds the resultant of the restraining.
Further increase in bubble volume causes imbalance o f
forces, detachment, and the bubble lifts while still being
connected to the nozzle through a neck. (see FIG.6) The neck
contracts and the bubble finally detaches itself from the nozzle.
Prediction of the bubble volume at the end of the expansion
stage can be obtained from the balance in forces. Difficulties
arise in determining the detachment volume. Two assumptions are
used to overcome these difficulties. (RANAKRISHAN S. 1969)
1) The equation of motion is also applied in the detachment
stage for a prescribed bubble geometry.
2) The bubble detachment volume, V, is calculated from the
equation: (RUFF K., 1972)
V = +AV [27]
53

where Vo= The volume of the bubble at the end of the
expansion stage.
AV= The excess volume corresponding to the gas flow
in the bubble through the neck during the
detachment period period.
The volume of the bubble at the end of the expansion is
calculated from the force balance illustrated in FIG.6 and the
individual forces are defined as follows:
54
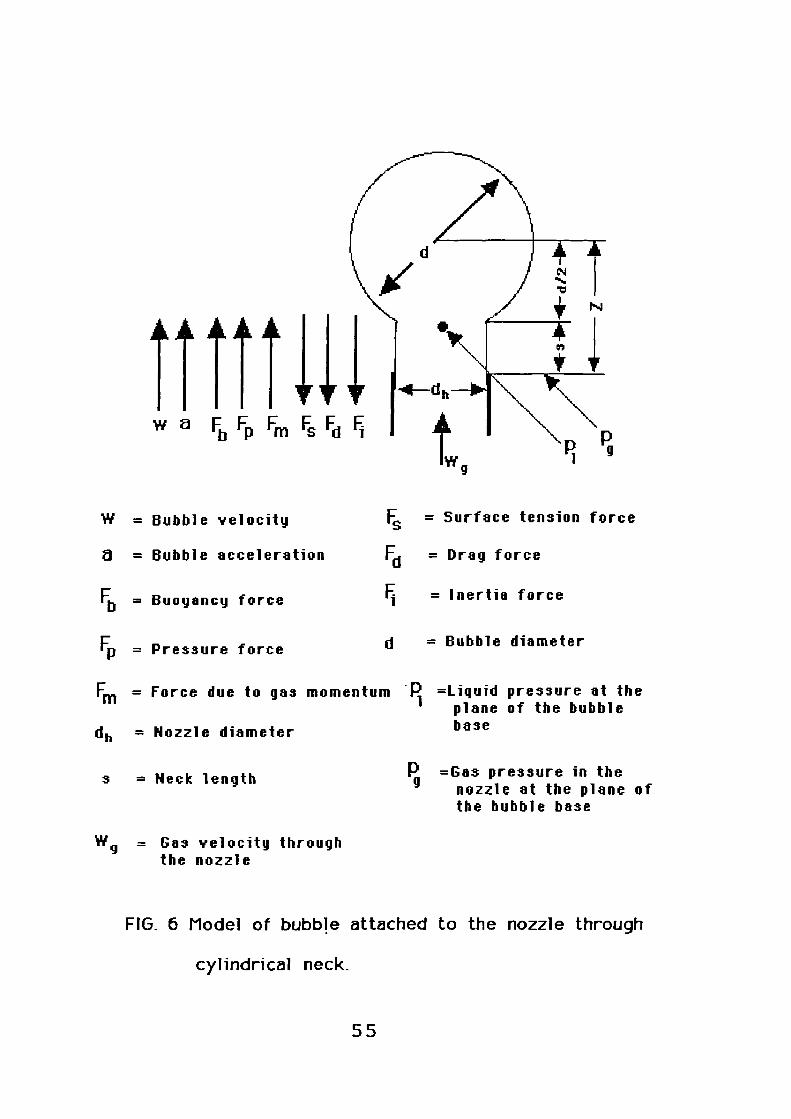
Vii = Bubble velocity F1's = Surface tension force
a = Bubble acceleration Fd = Drag force
Fb = Buoyancy force Fi = Inertia force
FP = Pressure force d = Bubble diameter
Fm = Force due to gas momentum • P =Liquid pressure at the1 plane of the bubble
dh = Nozzle diameter base
s = Neck length
Aig = Gas velocity throughthe nozzle
P =Gas pressure in theg nozzle at the plane of
the bubble base
FIG. 6 Model of bubble attached to the nozzle through
cylindrical neck_
55

The bubble expands because of gas flow through the nozzle
and the lifting forces acting on the bubble are:
Buoyancy force Fb
Fb = i d3 (pipdg [28]
where: d = the diameter of the bubble
g = the acceleration due to gravity
pr = density of the continuous phase
pg = density of the dispersed phase
Pressure force Fp
Fp = n /4 dh (pg -p i ) [29]
where: dh = nozzle diameter
pl= liquid pressure at the plane of the bubble base
pg= gas pressure in the nozzle at the plane of the
bubble base
Force flue to gas momentum Fm
56

nF, = dh'139 wg [30]
where:
pg = density of the dispersed phase
%,, g = gas velocity through the nozzle
Surface tension force Fd
Fs = dh o-
[31]
where: a= the surface tension
q=Dynamic viscosity of the continuous phase
Drag force Fd
27nV 81RV2Fd = 2d + 32nd [32]
Where: V=Bubble volume at the end of the detachment stage
57
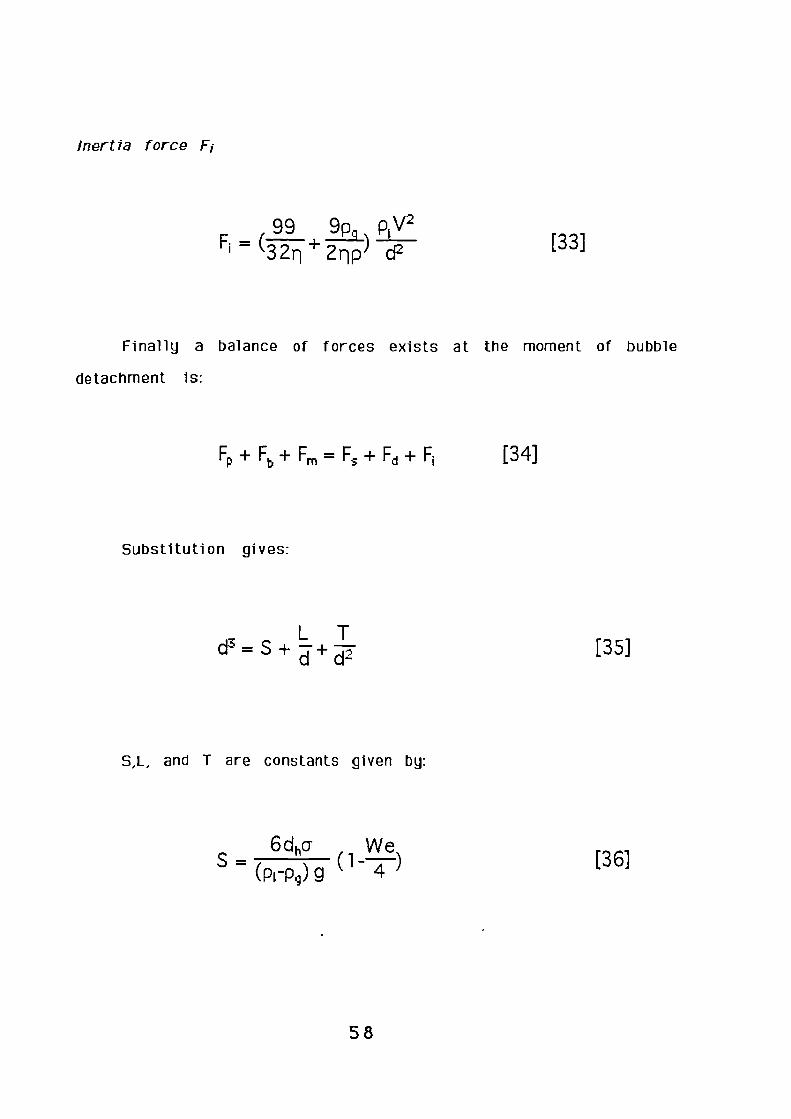
Inertia force Fi
99 9p PiV2F i = (329 + 2rip ) d2
Finally a balance of forces exists at the moment of bubble
detachment is:
Fp Fb = Fs + Fd F i [34]
[33]
Substitution gives:
LTd3 = S
d d2[35]
S,L, and T are constants given by:
6dho- WeS = (pi-pg ) g 1 --4 ) [36]
58
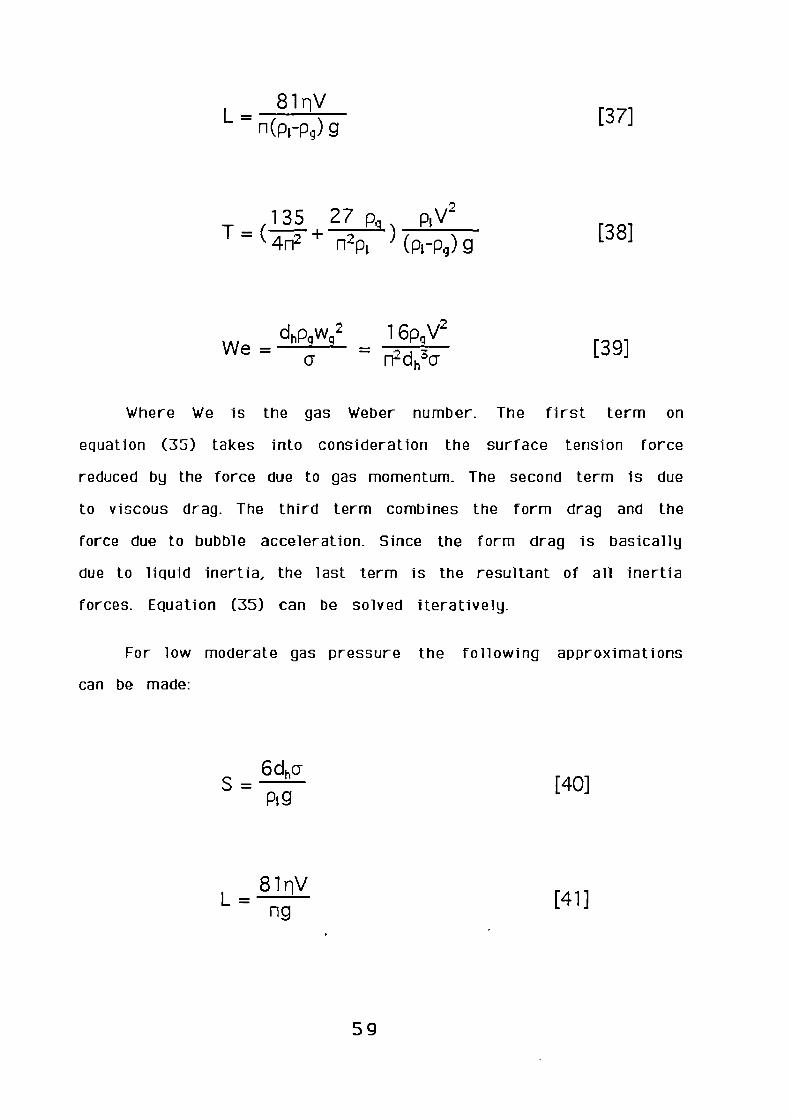
81nVL = n(pi-p9 ) g [37]
6dho-s=
Pig[40]
81nVL = ng [41]
135 27 p AN/2
n2 P1 ( P1 -P9 ) g[38]
w 2dhpe,„. 16p1V2
We= n2dh3o- [39]
Where We is the gas Weber number. The first term on
equation (35) takes into consideration the surface tension force
reduced by the force due to gas momentum_ The second term is due
to viscous drag. The third term combines the form drag and the
force due to bubble acceleration. Since the form drag is basically
due to liquid inertia, the last term is the resultant of all inertia
forces. Equation (35) can be solved iteratively.
For low moderate gas pressure the following approximations
can be made:
59
T= 4n2g135 V2
[42]
The model has been criticized by LANAUZE and HARRIS (1974)
and they pointed out the weakness and the limitation of this model.
They claimed that RAMAKRISHNAN (1969) et al used a static force
to describe the lift off point and by doing so they ignored the f act
that the centre of the bubble (about which the force balance
applied) was moving upwards before and after the lift point which
indicated a continual resultant upward forces on the bubble.
WRAITH A.E. (1971) proposed a two stage model for bubble
formation in a inviscous liquid. This model is based on potential
flow analysis for a stationary expanding sphere and assumes that
in the first stage the bubble is hemispherical and transfer into
the fine sphere detaches from the orifice, occurs in the second
stage where the buoyancy force is dominant after the bubble has
risen a distance equal to its radius.
60
3.2.2 THEORY OF BUBBLE NUCLEATION IN DISSOLVED AIR FLOTATION
The size of bubbles has been shown to greatly affect the
performance of flotation processes (CASSELL et al 1975).
Although the bubbles produced in DAF are small, of the order of
100pm (VRABLIK, 1959), even smaller bubbles are generally
considered advantageous (KITCHENER 1981, WOOD 1973). Studies of
the nucleation and growth of microbubbles by WARD (1970) and
TAKAHASI (1979) have shown that energy must be imparted to a
liquid supersaturated with air before bubbles will form.
The production of very fine bubbles required for OAF can
be accomplished by dissolving air in water under pressure and
subsequent flashing to the normal pressure. The bubbles produced
in this way adhere to solid or liquid particles in liquid and reduce
the specific gravity. The hydrodynamic performance of generated
bubbles has scarcely been studied, and in the following topic we
will try to consider the major factors affect the size and t he
hydrodynamics of generated bubbles.
3.2.2.1 Diameter of enerated bubbles
Consider the formation of a bubble nucleus V 2 from the
supersaturated liquid. It is .assumed that the • volume of the liquid
is very large, pressure and temperature are constant, the change
61

in free Energy of the bubble surface is negligible and the
concentration in the liquid is small. Thus the change in free
energy as the result of the formation of the bubble nucleus has
been given by WARD C. (1970) as:
AF = In n1 (a, 1-a 11 ) - (P,-,-PI)V2 + o-A [43]
Consider a spherical bubble formed at the radius r from
the supersaturated liquid of the molar fraction of air xa . Within
the bubble, let air be one component Thus, eq. (43) can be applied
to bubble formation in dissolved air pressure fl otation.
AF = rin(an-a 1 ) - ( Pn- P1) (4/3)nr3 + 4nr2o- [44]
Putting: P, = PL + 2a/r and Ea = a, -
AF = nn ,6a + (4/3)nar2[45]
Assuming that air is an ideal gas, we . obtain the molecular
chemical potential of air inside the bubble:
62

an =ao + KTIn(1)1 + 2a/r) [46]
Where ao is the molecular chemical potential at the
standard state. The molecular chemical potential of the dissolved
air is:
=a0 + KTIn(C;) [47]
where C is a coefficient. Therefore,
+ 2a/r Aa = KTIn (Pi
k Cxa[48]
Henry's law applies to the dissolved air content and
partial pressure of air. Thus, C, is equal to Henry's law constant.
Hence:
1131 + 2/r))
/rN 4AF = KTIq [49]Cxa —3 nr2a
63
RADIUS OF NUCLEUS
It has been already assumed that air is an ideal gas.
Putting PI =P 0 (atmospheric pressure), we obtain the change in free
energy as a result of the formation of the bubble nucleus through
reduction of dissolved pressure PA to atmospheric pressure Po,
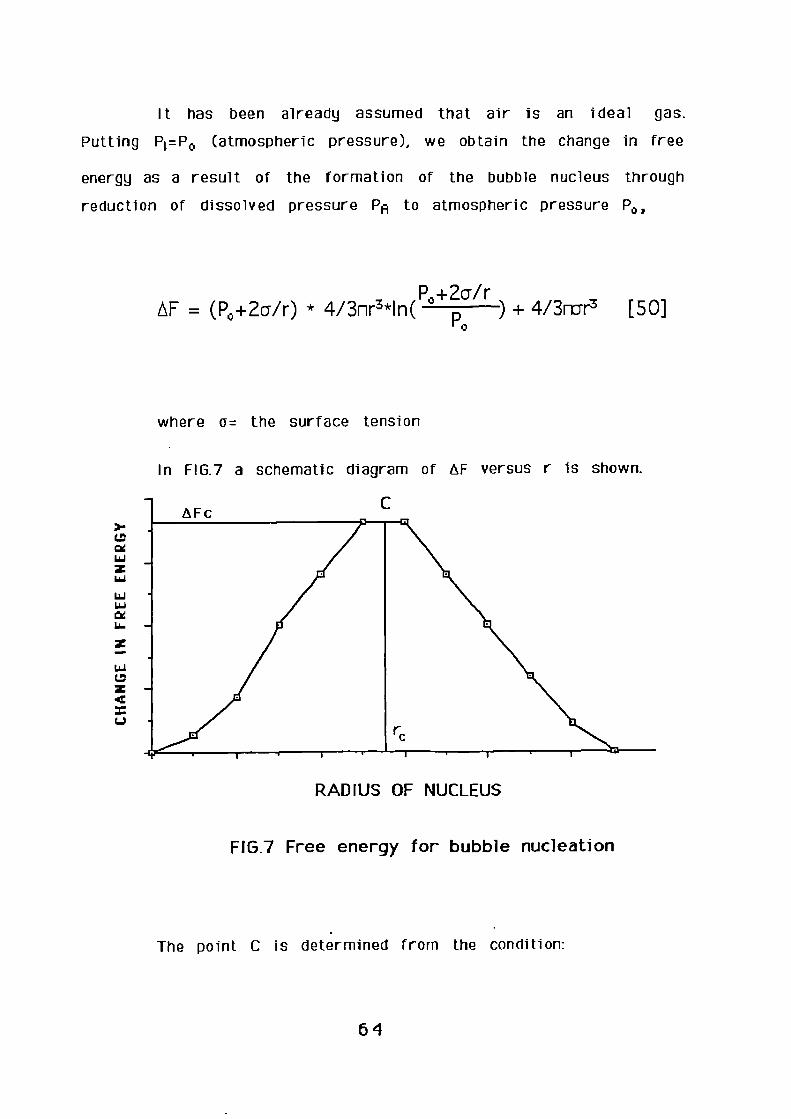
130+2o-/r AF = (P0 +20-/r) * 4/3nr3*In( ) + 4/3no-r-3[50]
Po
where u= the surface tension
In FIG.7 a schematic diagram of AF versus r is shown.
FIG.7 Free energy for bubble nucleation
The point C is determined from the condition:
64
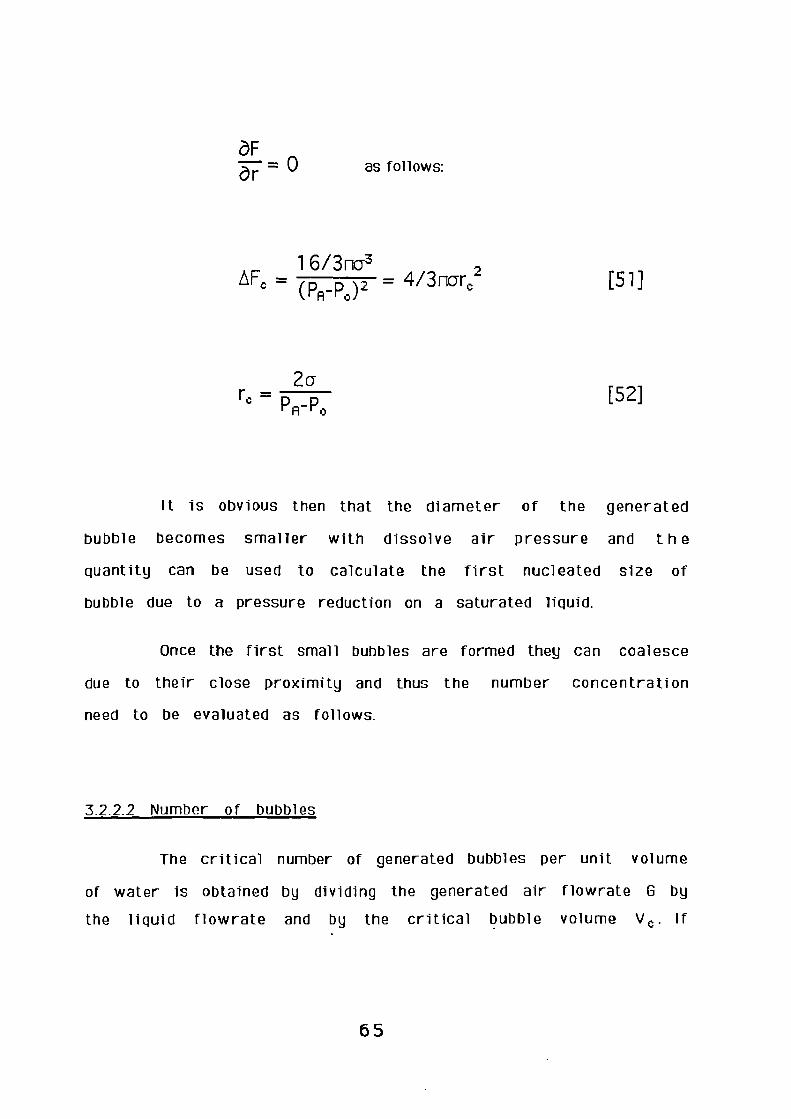
OF-aT.- = 0 as follows:
AFc — = 4/3narc2
(PA-Pa)-
1 6/3no-3[51]
re — p R_ po2o-
[52]
It is obvious then that the diameter of the generated
bubble becomes smaller with dissolve air pressure and t h e
quantity can be used to calculate the first nucleated size of
bubble due to a pressure reduction on a saturated liquid.
Once the first small bubbles are formed they can coalesce
due to their close proximity and thus the number concentration
need to be evaluated as follows.
3.2.2.2 Number of bubbles
The critical number of generated bubbles per unit volume
of water is obtained by dividing the generated air flowrate 6 by
the liquid flowrate and by the critical bubble volume Ve. If
65
G/QNo = vc [54]
G/QNb = v [56]
Equation (53) is used to obtain the critical volume, then the
initial number of bubble is:
, 4 ( 2a )3v 0 =Fl pia_ po [53]
Alternatively if the average diameter is calculated from
equation (55):
dav =
(IN.; *d 3j 1/3)
ZNi[55]
where 0 j = Number of bubbles with diameter di
The number of bubbles per unit volume Nbis given by:
66

It is obvious that the number of the bubble is
theoretically strongly influenced by dissolved air pressure and
increased with liquid flowrate.
3.2.2.3 Coalescence of bubbles
Coalescence is called the phenomenon where bubbles grow
in diameter by feeding on small bubbles (RAMIREZ E.R.,1976).
Generally bubbles and microbubbles coalesce when two bubbles
collide and form a single bubble. There are three factors which
favour coalescence:
1) The presence of non-uniform diameter bubbles where the large
bubbles "gobble-up the small bubbles by collisions. This is true
since the rate of the large bubbles is considerably greater than
that of small bubble and thereby favour collision.
2) Violent agitation tends also to coalesce bubbles.
3) The presence of a large surface area in contact with the
bubble-liquid surface. The large surfaces serve as deposition
points for the microbubbles where coalescence can readily take
place. Some of these factors are considered as follows:
67
Vb =P0
* —* d6 av
130-Ep„gh+4a/dav n[57]
a) Volume of generated bubble
After discharge of the supersaturated water through the
nozzle a numerous tiny bubbles are formed. The bubbles rise in the
flotation tank and collapsed at the water surface. Bubble diameter
determining by measuring a number of bubbles (100-200) after
taking photographs. When a bubble is spherical the volume of air
is occupied by a single bubble under atmospheric pressure is given
by the following equation:
Where h is the depth from the liquid surface to the
bubble.
In our experiments the bubble diameter is measured at the
top of the vessel and so the effect of liquid depth is negligible.
68

b) Uniformitti of bubble size
Not only does uniformity of size influence coalescence but
also the physical properties of the floated material often
determine the optimum bubble size needed to carry out the
flotation. Hydrophobic materials are easier to float than are
hydrophilic. Substances which have densities close to one require
finer bubbles than do materials that have densities considerably
greater than one. Rise rates of bubbles is an extremely important
factor in efficient flotation (RAMIREZ E.R.,1976). It is also
preferable in the applications of gas-liquid systems that the size
of the bubble is not only small but also as uniform as possible. In
order to express the uniformity of bubble size an index 8 has been
introduced by (UNNO H., 1980) and is equal to:
EA [58]uiv
where c=the standard deviation of the size spectrum.
The smaller value of index represents the more uniform size.
It is di fficult to generate both small and uniform bubbles, thus
the development of a device which produces very small bubbles
hydrodynamically will not only improve the efficiency of gas
69
V Pa= H
[59]
liquid contacting processes but also stimulate the application of
the device to many kind of other processes.
3.3. AIR SATURATION
3.3.1 Dissolved air-Theoretical aspects
As indicated in 3.2.2.2 the bubble density depends on the
degree of saturation and hence the theoretical aspects of
saturation need consideration.
Dissolved air flotation uses bubbles of air generated
under controlled conditions by release from a supersaturated
solution of air in the water. The main reason for supersaturation
of a pulp by air is a sharp decrease in pressure in many portion
of the pulp. Release of gas from solution can occur either as a
result of cavitation or effervesence.
Solubility of air in the water is given by Henry's law:
where H is a constant at a given temperature.
70
100
200
1200
1000 -
800 -
600 -
400 -
200 -
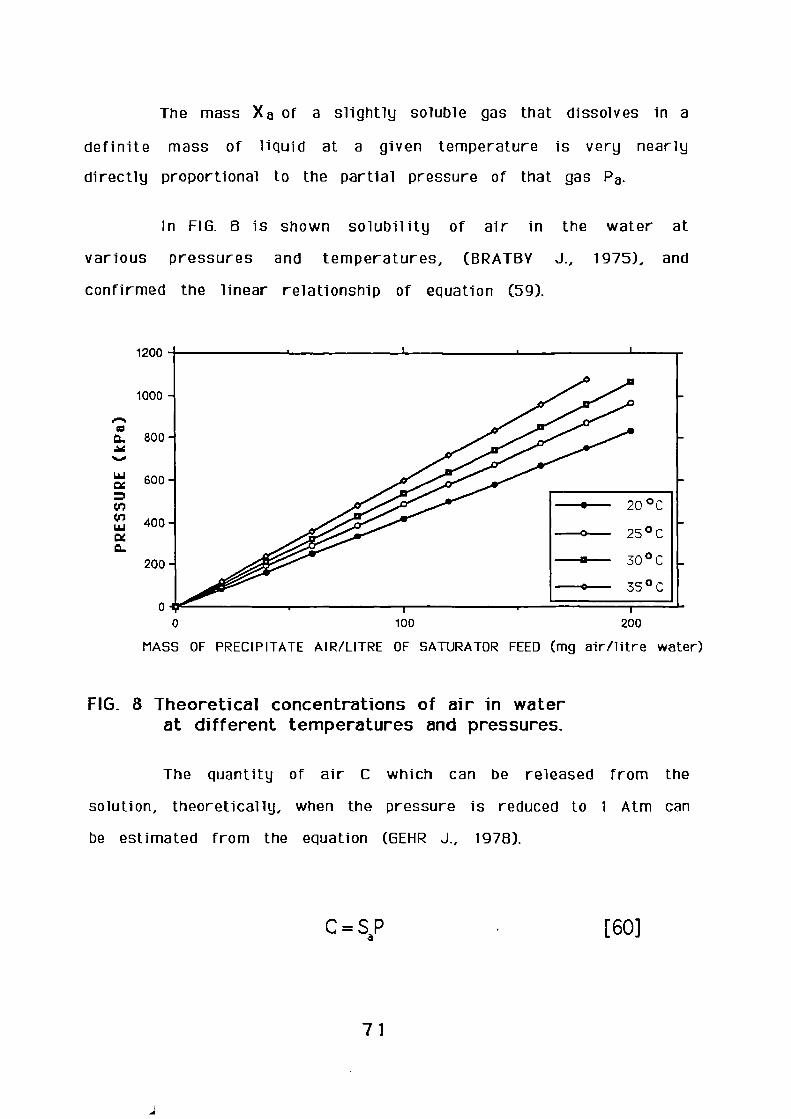
The mass X a of a slightly soluble gas that dissolves in a
definite mass of liquid at a given temperature is very nearly
directly proportional to the partial pressure of that gas Pa.
In FIG. 8 is shown solubility of air in the water at
various pressures and temperatures, (BRATBV J., 1975), and
confirmed the linear relationship of equation (59).
MASS OF PRECIPITATE AIR/LITRE OF SATURATOR FEED (mg air/litre water)
FIG. 8 Theoretical concentrations of air in waterat different temperatures and pressures.
The quantity of air C which can be released from the
solution, theoretically, when the pressure is reduced to 1 Atm can
be estimated from the equation (GEHR J., 1978).
C = Sal) [60]
71
Sa = saturation concentration of air at
Atmospheric pressure.
P = pressure in retention tank (Atm)
The actual quantity of air released will depend on the
turbulent mixing conditions at the point of pressure reduction and
on the degree of saturation obtained in the pressurizing system.
Since the solubility in the industrial waste may be less than that
in the water, a correction may have to be made to the previous
equation. Also, VRABLI CK (1959) has shown that a linear
relationship exists between pressure and solubility for most
industrial waste and that the slope of the curve depends on the
nature of the waste.
3.3.2 Dissolved Air Generation rate
As we can see from eq (60) the solubility of air in water
increases in direct proportion to the air pressure. The number of
moles of dissolved air in 1cm3 is expressed as:
N - P )(w * am —. M„ 1v
[61]
72
Pw * PT-Pw
W HE[62]
where Nrn = moles of air dissolved in the water
flu= density of water
xa= molar fraction of air at dissolve pressure
M= Molecular weight of water
Because xa «1 then by eq. (61) and by Henry's Law we
obtain:
where PT = Total pressure
Pu j = Vapour pressure of water
It = Henry's law constant
In dissolving air in water under pressure P a and
subsequent flashing to atmospheric pressure Po, the excess number
of moles of dissolved air in lcm3 water is written as:
73

Nm [63]
On the assumption that air is an ideal gas, the generated
air volume, Va at the same temperature under atmospheric
pressure is written as:
PLU P1-P0 RT
v A = mw n *LIr o rt [64]
where R= Gas constant
T= Absolute temperature
Assuming that all dissolved air in water changes into
bubbles the theoretical generated air flowrate can be obtained
from the above equation.
333 TYPES OF SATURATION SYSTEMS
In the process of gas-liquid contact a numerous of devices
have been employed to enhance the mass transfer between the two
phases. In dissolved air flotation techniques a number of studies
were made to examine the design criteria for design saturator
vessels. In all these studies the main subject is to maintain the
quantity of air (gas) added below the theoretical quantity of air
74
as this minimizes the amount of excess air which must be removed
by a retention tank or contact vessel. If the free air is not
removed, flotator efficiency will be greatly impaired due to large
bubble formation. There are two main retention tanks (saturators)
arrangements:
The Static and the Dynamic.
3.3.3.1 STATIC SATURATORS
The static designs are employed when aeration efficiencies
below 50% are acceptable. Investigators of the static designs have
indicated aeration efficiencies of 50 percent. These efficiencies
are based on the amount of air dissolved in the retention tan k
effluent and do not include any free air, present as finely
dispersed bubbles, which may be dispersed in the retention tank
effluent. The free air percent in the static type retention tank
discharge represents approximately 33% of the total air present
in the discharge.
3.3.3.2 DYNAMIC SATURATORS
These are generally bubble, spray, plate, packed column or
mechanical enhance mixer devices, employed for efficiencies
greater than 90%. The turbine type retention tank has indicated
aeration efficiencies of 92%. However, in the case of packed
75

tower it has shown that large towers will be required to obtain
90% plus aeration efficiencies.
3.3.3.3. HIGEE TECHNIQUES
Lately has been introduced another type of efficient mass
transfer device. Higee technique is a rotating mass transfer
apparatus in which centrifugal forces is used to intensify mass
transfer (ASTARITA G. 1983).
Higee comprises a rotor containing the packing arranged as a
toroid and a stationary casing. The packing is a reticulated
material, which is characterized by both large surface area per
unit volume and a high voidage.
Gas enters via nozzles in the casing at high pressure and
then migrates through the rotating annulus of packing. Small
bubbles are formed and then come into contact with the scrubbing
liquid, which having been distributed at the "eye" of the packing
annulus, is forced outward by the centrifugal force. Treated gas
leaves through the centre of the machine while the loaded solution
is returned to the centre line over a weir and is drained from the
casing. Experiments were carried out using different liquid/gas
ratios and speeds to observe their effect on contactor
performance (BELL C. 1975)
76
HI GEE FEATURES
Hi gee has a number of special features which di f f er
significantly from more conventional mass transfer devices. Among
the most important are:
Small size
Low weight
Short contact time
Low liquid hold-up
Insensitive to motion or orientation
Rapidly attains steady state
Non foaming
Quick emptied and easily cleaned.
Three of the operating features are among the greatest
considerations and they will relate to:
1) Mass transfer
in Throughput capacity
iii) Power consumption
77
i) Mass transfer
The rate of the mass transfer in a bubble column is affected
by:
a) The mean bubble size and hence the interfacial area for mass
transfer;
b) The relative velocities between the phases, i.e. turbulence and
hold-up;
c) The stability or renewal of bubble surface
Considering each of these features in turn
a) Initial bubble size
It is obvious that the smaller the bubble size the greater the
interfacial area available for moss transfer. When small bubbles
form at an aperture the size of the bubble is determined by
aperture size and by the balance of the forces acting upon it The
bubble will continue to grow much larger than the aperture until
the buoyancy forces tending to make the bubble break away and
rise become greater than the surface of interfacial tension
forces. In the single bubble regime this balance of forces results
in the Equation (35).
78
While this equation may be an over-simplificaion in real life
situations because viscosity and inertial forces are ignored, it is
clear that bubble diameter is inversely proportional to the cubic
root of the "'g" force. In the rotary de-aerator the "g" can be
replaced by wr,- where w is the rotational speed in radians/sec.
and r refers to the radius. With "g" forces in the range 100-1000
times terrestrial "g" the bubble diameter will be 4.6 to 10 times
smaller and the interfacial area correspondingly larger than in a
stationary vessel. (SARDAR H. 1984).
b) Relative velocitg
In a conventional stationary bubble reactor there is a
pressure exerted upon the bubble reactor which results from the
static head of liquid above it. As the bubble rises this pressure is
decreased and the bubble expands and accelerates. In a rotary de-
aerator the pressure on the bubble at any point is the head of the
liquid times its density times the "g" force. As a bubble "rises"
from periphery to the centre therefore the pressure is initially
much higher but reduces rapidly as both the height of the liquid
and the "g" force are reduced from periphery to centre. Unhindered
this would result in a tremendous buoyancy forces and high bubble
velocities with the resulting enhanced mass transfer rates.
79
c) Surface renewal
It has been shown that when a bubble collides symmetrically
with a narrow obstruction its subsequent behaviour will be
dictated by the buoyancy and kinetic energy released on impact. If
the sum of these are greater than the surface energy created by
splitting then breakdown will occur creating two smaller bubbles.
If the buoyancy/kinetic energy is less only deformation and
bouncing will occur. In the centrifugal field buoyancy and kinetic
energy will be much larger than in a static apparatus so bubble
breakdown will be greater and the equilibrium bubble size much
smaller. This vigorous bubble breakdown produces new interfacial
are while maintaining the small bubble size.
2) Throudhout/Capacitu
In a stationary bubble reactor/stripper the downward
velocity of the liquid, and hence vessel diameter, are constrained
by the velocity at which bubbles will rise. If the liquid velocity
were to approach or exceed the bubble rise velocity the bubbles
would be entrained and carried out by the fluid. The bubble rise
velocity is indicated by Stokes Law. From this is clear that "g"
will have a large and proportional effect upon the bubble velocity.
In the rotary de-aerator the very much enlarged bubble velocity
can therefore countered by a high liquid velocity in the opposite
direction. This enables very high capacities to be obtained in small
80

rotational equipment, the overall effect being to reduce the size
and weight of the de-aerator considerably. (KATTI S.1986)
3) Power Consumption
In the first generation of Higee units, the liquid and gas
contacted in film flow conditions rather than having a continuous
liquid phase with bubbles dispersed in it. The principle
disadvantage of this was the excessive power consumption
resulting from accelerating all the liquid to the rotor tip speed
and the energy was lost by impact with the stationary walls. With
a continuous liquid phase confined within a totally rotating unit,
only the net energy imparted to the fluid needs to be put into the
system, since the fluid after treatment is returned to the axis of
the machine, its velocity is reduced and much of the kinetic energy
-recovered". The net power requirement is orders of magnitude
smaller as a result. (DANCKWERTS P. 1966).
3.4 MASS TRANSFER IN BUBBLE PROCESSES
Many of the industrial processes, including OAF involving
mass transfer of a diffusing solute from the bulk fluid of one
phase into the interface to the bulk of the second phase. The
diffusing solute transfers from phase P1 where the concentration
is higher than equilibrium into phase P2_ Thus mass transfer takes
place from the bulk fluid of phase P1 to the interface and then
81
from the interface to the bulk fluid of the other phase P2. In the
interior of bulk fluids mass flux is accomplished by mixing t o
turbulent fluctuations and the concentrations of the di ffusing
solute in the interiors is thus practically constant as is shown in
F I G.1 O.
In the boundary layer near the interface the turbulence
diminishes which causes a concentration gradient to develop as the
interface is approached, until at the interface the mass flux
encounters resistance due only to the mechanism of diffusion.
Several different theoretical models have been developed,
each representing a simplified mode of mass transfer, but most of
models are based on the following assumptions.
1) The resistance to mass flux is the sum of the resistance
of each phase and the resistance of the interface. However, the
interface resistance may be taken to be negligible and in this
case, taking into account that the mass flux within a single phase
is independent of the other phase, the total resistance to mass
transfer considered as the sum of phase resistances known as
additivity of resistances.
2) Near the interface the two phases are in equilibrium, and
the equilibrium is established more rapidly than the change of
average concentration in either bulk fluid.
Two are the most well —known models in mass transfer
processes. The film model where we assume that there is a region
in which steady state molecular diffusion is the transfer
82

mechanism. The penetration theory where the interface is
continously being impinged by unsteady molecular diffusion.
3.4.1.FILM MODEL
According to this model steady state mass transfer occurs by
molecular diffusion across a stagnant, or laminar flow film at the
interface between the phases, in which the fluid is turbulent. All
the resistance is assumed to be confined inside the film and
therefore mass concentration gradients arise only inside this film
in bulk fluids, the concentration being constant and equal to some
average values. So, the mass rate rn* transferred across a unit
area of interface per unit time, is proportional to the
concentration gradient between the bulk fluid and the interface so
that: (SHERWOOD T.K. 1975)
-D= (C -C ) = -k(Co-C)
6eff m[65]
where Co=the average concentration in the bulk fluid, kg/m3
Cin=the average concentration in the interface, kg/m3
D=the diffusivity, re/ s
k=mass transfer coefficient, ms/kg
83

6eff=the effective film thickness, m
The weak point of this theory is the definition of a stagnant
film of a definite (but unknown) thickness.
84
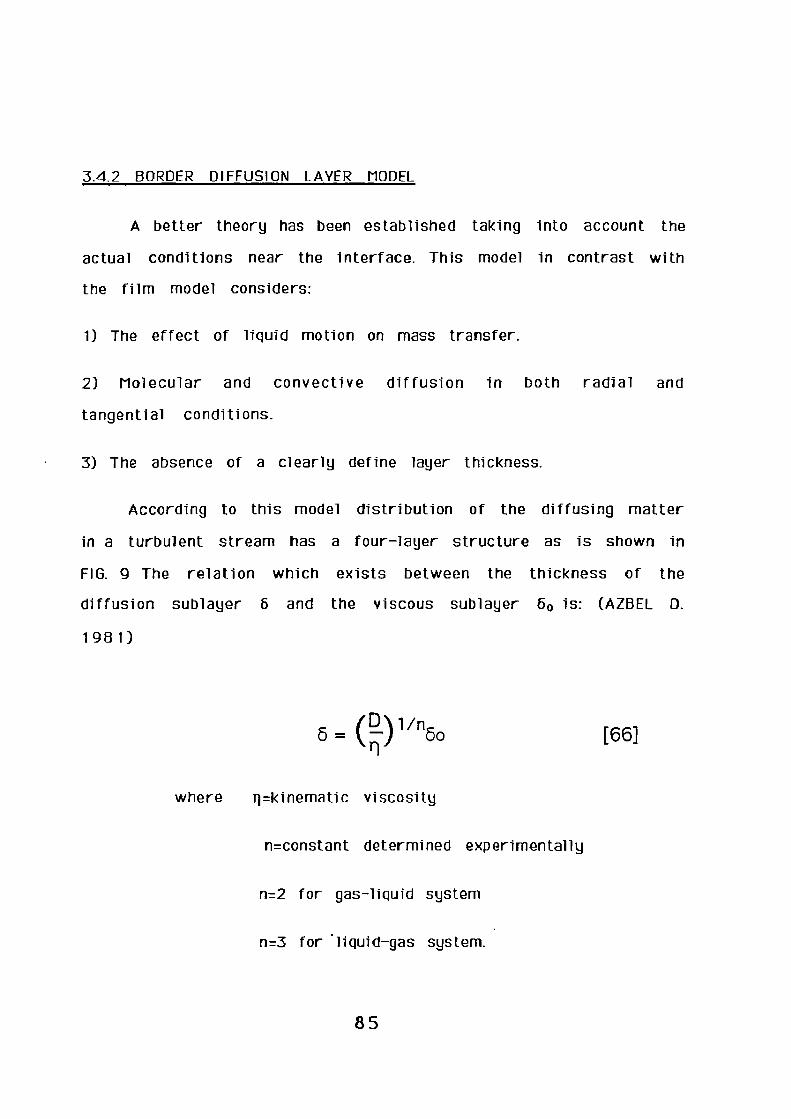
3.4.2 BORDER DIFFUSION LAVER MODEL
A better theory has been established taking into account the
actual conditions near the interface. This model in contrast with
the film model considers:
1) The effect of liquid motion on mass transfer.
2) Molecular and convective diffusion in both radial and
tangential conditions.
3) The absence of a clearly define layer thickness.
According to this model distribution of the diffusing matter
in a turbulent stream has a four-layer structure as is shown in
FIG. 9 The relation which exists between the thickness of the
diffusion sublayer 6 and the viscous sublayer 6 0 is: (AZBEL D.
1 98 1)
iD\ unb = k -I bo
rl
where q=kinematic viscosity
n=constant determined experimentally
n=2 for gas-liquid system
n=3 for • liquid-gas system.
[66]
85

ffusi on
C=Co••. ••. .•••••. ••. ••. ••.
kJ k, 44 44 kJ 44 44 4.4 44 44 kJ 40 44 kJ kJ kJ kJ LI 40 kl kJ 4! kJ k
0 40 4! 4! 40 44 40 40 44 44 4! 4! 4.0 40 44 44 44 44 40 40 44 40 40 40 44 40 4! 4
e kJ kJ 4.0 4! 44 40 4
Main turbulentO .60 kJ kJ 40 40 40 4! 40 4.0 40 4! 44 44 44 44 44 40 44 40 44 40 40 4! 44 40 44 4
0 40 44 44 4! 44 4! 40 44 4! 4.0 4! 4.$ 4d 4! 44 4.1. 44 44 44 4.! 44 44 40
40 4! 44 4f 40 4! 4! 44 44 40 44 44 40 kJ 44 40 44 44 40 40 40 44 40 40 44 44 40 4
5,34-Turbulent boundary 1
Jn•=.
'az-*Viscous subl oyerE
FIG.9 Distribution of the diffusing substancesin a turbulent stream
FIG.1 0 Concentration distrib ution in I.,-rases duringmass transfer
86
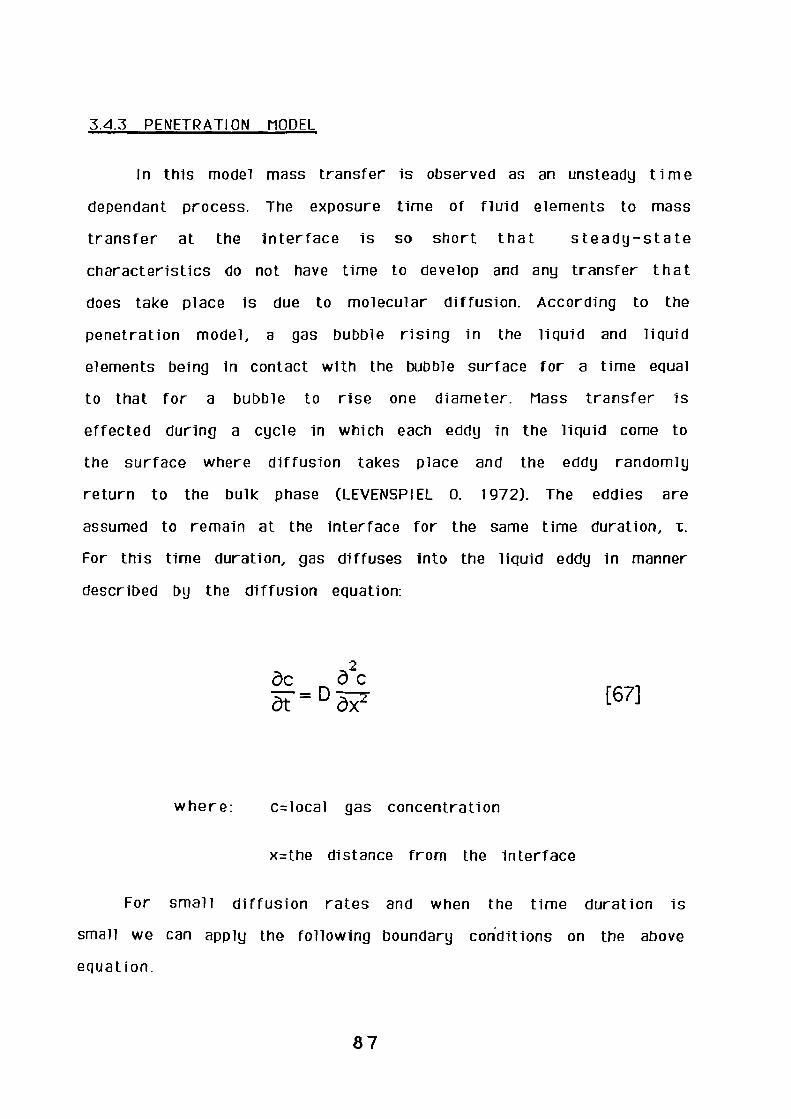
ac 62c
D 75C.rc[67]
3.4.3 PENETRATION MODEL
In this model mass transfer is observed as an unsteady time
dependant process. The exposure time of fluid elements to mass
transfer at the interface is so short that steady—state
characteristics do not have time to develop and any transfer that
does take place is due to molecular diffusion. According to the
penetration model, a gas bubble rising in the liquid and liquid
elements being in contact with the bubble surface for a time equal
to that for a bubble to rise one diameter. Mass transfer is
effected during a cycle in which each eddy in the liquid come to
the surface where diffusion takes place and the eddy randomly
return to the bulk phase (LEVENSPI EL 0. 1972). The eddies are
assumed to remain at the interface for the same time duration, T.
For this time duration, gas diffuses into the liquid eddy in manner
described by the diffusion equation:
where: c=local gas concentration
x=the distance from the interface
For small di f fusi on rates and when the time duration is
small we can apply the following boundary conditions on the above
equation.
87
Co at t=0 and x>0
Co at x— co and t>0
Cir.'at x=0 and t>0
where Co is the average gas concentration in the liquid bulk
Cin is the concentration at the interface
The mass transfer coefficient is obtained after solving the
above equation and it is:
k=2(D/n-c)112
[68]
where D= the diffusivity
t= the contact time
88
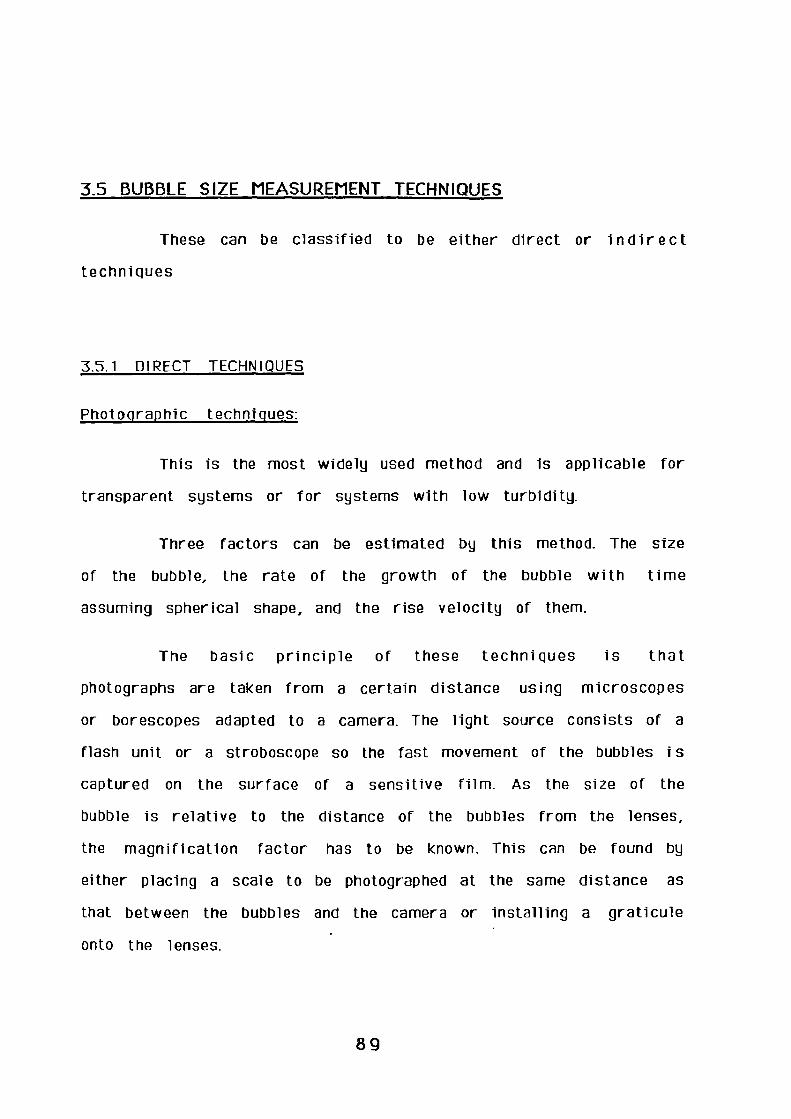
3_5 BUBBLE SIZE MEASUREMENT TECHNIQUES
These can be classified to be either direct or indirect
techniques
3.5.1 DIRECT TECHNIQUES
Photographic techniques:
This is the most widely used method and is applicable for
transparent systems or for systems with low turbidity.
Three factors can be estimated by this method. The size
of the bubble, the rate of the growth of the bubble with time
assuming spherical shape, and the rise velocity of them.
The basic principle of these techniques is that
photographs are taken from a certain distance using microscopes
or borescopes adapted to a camera. The light source consists of a
flash unit or a stroboscope so the fast movement of the bubbles is
captured on the surface of a sensitive film. As the size of the
bubble is relative to the distance of the bubbles from the lenses,
the magnification factor has to be known. This can be found by
either placing a scale to be photographed at the same distance as
that between the bubbles and the camera or installing a graticule
onto the lenses.
8g
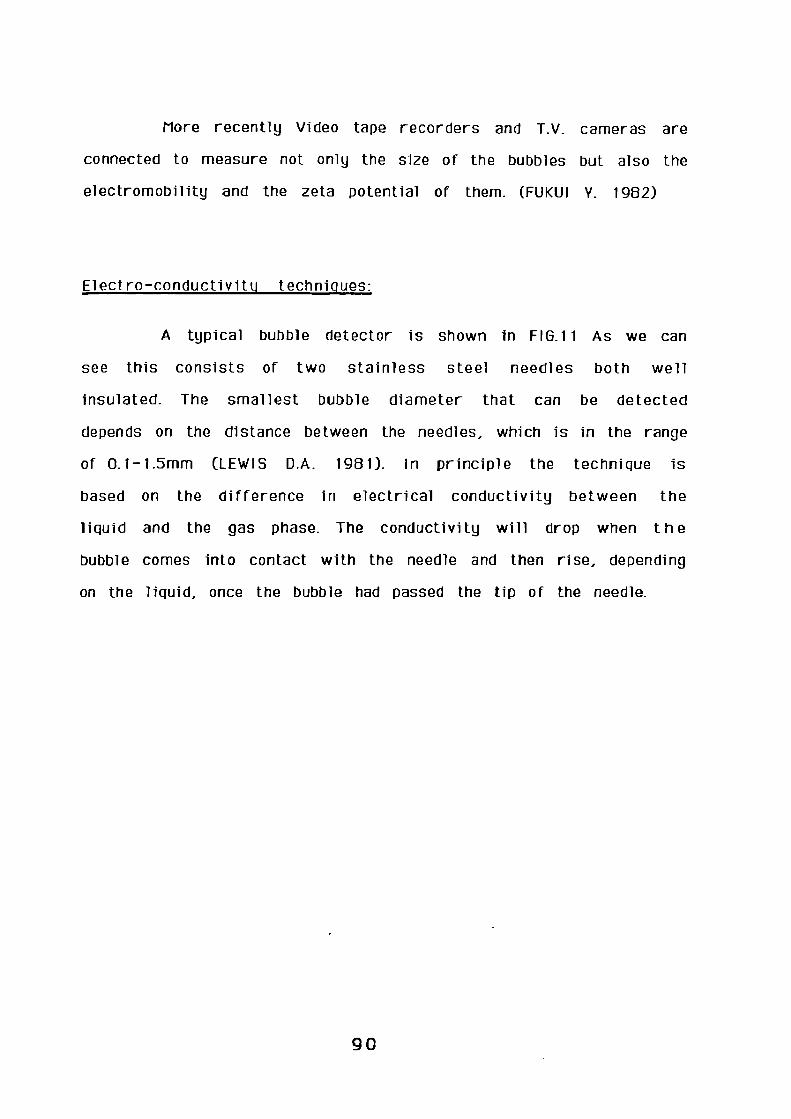
More recently Video tape recorders and T.V. cameras are
connected to measure not only the size of the bubbles but also the
electromobility and the zeta potential of them. (FUKUI Y. 1982)
Elect ro-conductivitu techniques:
A typical bubble detector is shown in FI6.1 1 As we can
see this consists of two stainless steel needles both well
insulated. The smallest bubble diameter that can be detected
depends on the distance between the needles, which is in the range
of 0.1- 1.5mm (LEW! S D.A. 1981). In principle the technique is
based on the di fference in electrical conductivity between the
liquid and the gas phase. The conductivity will drop when the
bubble comes into contact with the needle and then rise, depending
on the liquid, once the bubble had passed the tip of the needle.
go
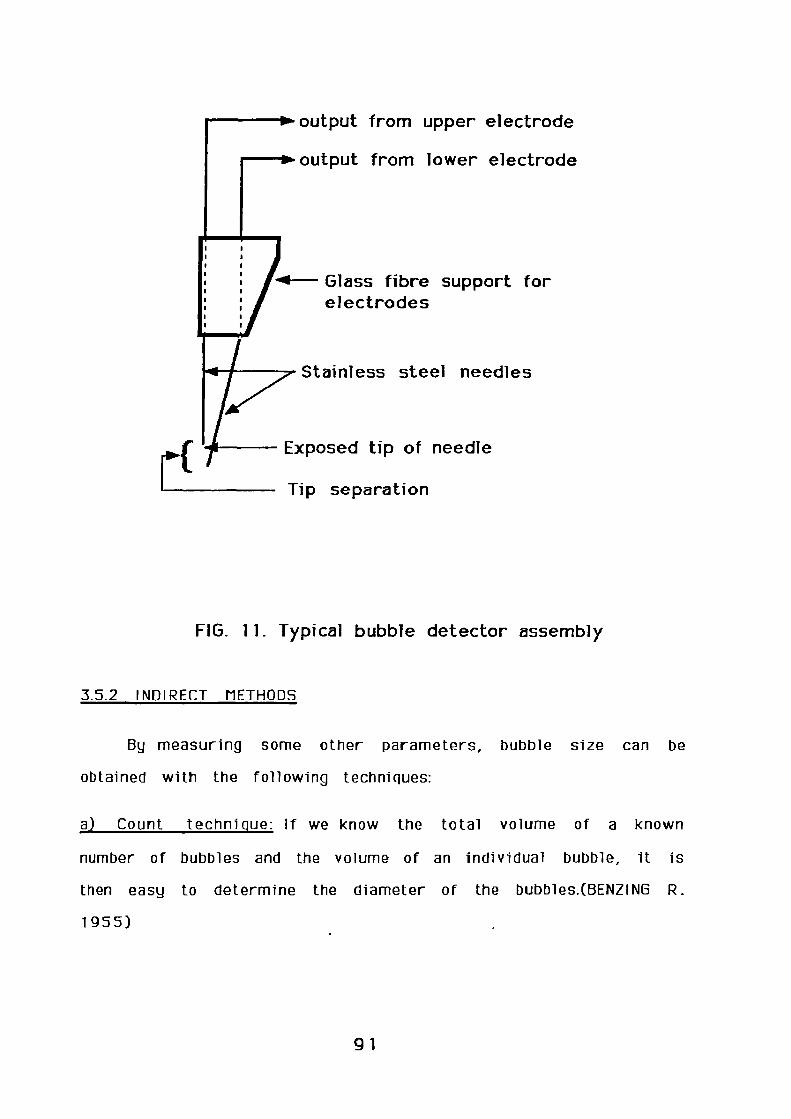
Pib output from upper electrode
p
. output from lower electrode
-4--- Glass fibre support forelectrodes
41,77-Stainless steel needles
Exposed tip of needle
Tip separation
FIG. 11. Typical bubble detector assembly
3.5.2 INDIRECT METHODS
By measuring some other parameters, bubble size can be
obtained with the following techniques:
a) Count technique: If we know the total volume of a known
number of bubbles and the volume of an individual bubble, it is
then easy to determine the diameter of the bubbles.(BENZING R.
1955)
91
b) Vi bro-acoustic technique: With this method it is possible to
measure the frequency of the formed bubbles, by placing a
microphone near to the orifice, and the sound of the detachment
bubbles is transferred by means of pulses on an oscilloscope
through a pre-amplifier. (HUGHES R. 1955)
c) Light scattering technique: The idea of this method is to al low
a beam of light to pass
water). A photo cell is
the tank and it receives
through the dispersion
intensity depends only
through a dispersion system (i.e. bubbles-
placed on the other side of the column or
the part of the incident beam that passes
without being scatter thus the beam's
on the projected area of the dispersed
phase. (CALDERBANK P. 1956)
FIG 12 shows the classification of the techniques used to
measure bubble diameter and from this survey it was decided to
use the basic photographic technique because it was simple to use,
inexpensive and easy to calibrate.
92

eTECHNIQUES FOR BUBBLE SIZE MEASUREMENT
DIRECT )
PHOTOGRAPHICTECHNIQUES
ELECTRO-CONDUCTI V ITVTECHNIQUES
INDIRECT 11
I
:40..
...m.womomoCOUNT TECHNImQUEj
VI BRO-A COUST ICMETHODS
LIGHT-SCATTERINGTECHNIQUES
FIG.12 CLASSIFICATION OF BUBBLE MEASUREMENT TECHNIQUES
9 3

CHAPTER 4
4_0 EXPERIMENTAL WORK
4.1 DESIGN OF SATURATORS
4.1.1 CONVENTIONAL SYSTEM
A common method for gas transfer is to use packed columns.
These consist essentially of a column packed with a proprietary
packing, through which the liquid is percolated in an atmosphere of
gas. Packings are available in many shapes and sizes. The shape is
selected so that for a given superficial volume as much surface i s
exposed as is practicable to pass a reasonable flow of liquid
through the packing. The larger the packing, the greater is the
flow that can pass through it per unit cross sectional area, but
the lower is the total exposed surface per unit volume. For high
gas transfer efficiency, a large surface per unit volume of
packing is required as gas transfer takes place at the gas-liquid
interface on the packing surface. Hence the "best" packing is one
allowing a high rate of liquid transmission while presenting a
large interface for gas transfer.
An important practical consideration in packed columns is the
distribution of the liquid over the packing. If the liquid is not
distributed evenly then "dry" areas of packing result which reduce
the effective packing volume. Further, the design should minimize
94

the opportunity for liquid to pass down the walls of the column,
presenting a path at' least resistance which reduces the effect of
a large interfacial area. This is prevented to a certain degree if
the ratio of nominal packing size column/diameter is less than 1:8.
The packed column system (saturator) which was used in our
experiments is shown in Fl 6.13. Compressed air and water were
mixed first in an eductor, and then through a sparger introduced
at the top of the saturator. During the experiments it was
important for the pressure in the saturator to be constant. This
could be achieved in two ways. Either, by controlling the pressure
release safety valve or by keeping the level of the water in the
saturator constant, by controlling the outlet valve. Also it is
worth mentioning that no air was bubbled through the water at the
bottom nor positively circulated through the packing. The packing
consisted of 25mm Raschig rings (HY-PACK, stainless steel,
nominal size 25mm) which occupied a volume from the above the
distributor to 15 cm from the bottom. The feed from the
centrifugal pump passed through the holes of the distributor at
the top of the saturator and was sprayed over the whole area of
the packing by jet action. This distributor was made from a
stainless steel disc 20cm in diameter with 100x1mm holes. The
Raschig rings were allowed to cover the distributor in order to
retard the tendency of the water to spray directly onto the walls
of the saturator which would have introduced by-passing of the
packing and reduced the efficiency.
95
All the pressure readings were made with the help of a
pressure gauge which was connected to the saturator. Normally a t
least 10 minutes were allowed in order to achieve equilibrium in
every setting.
96
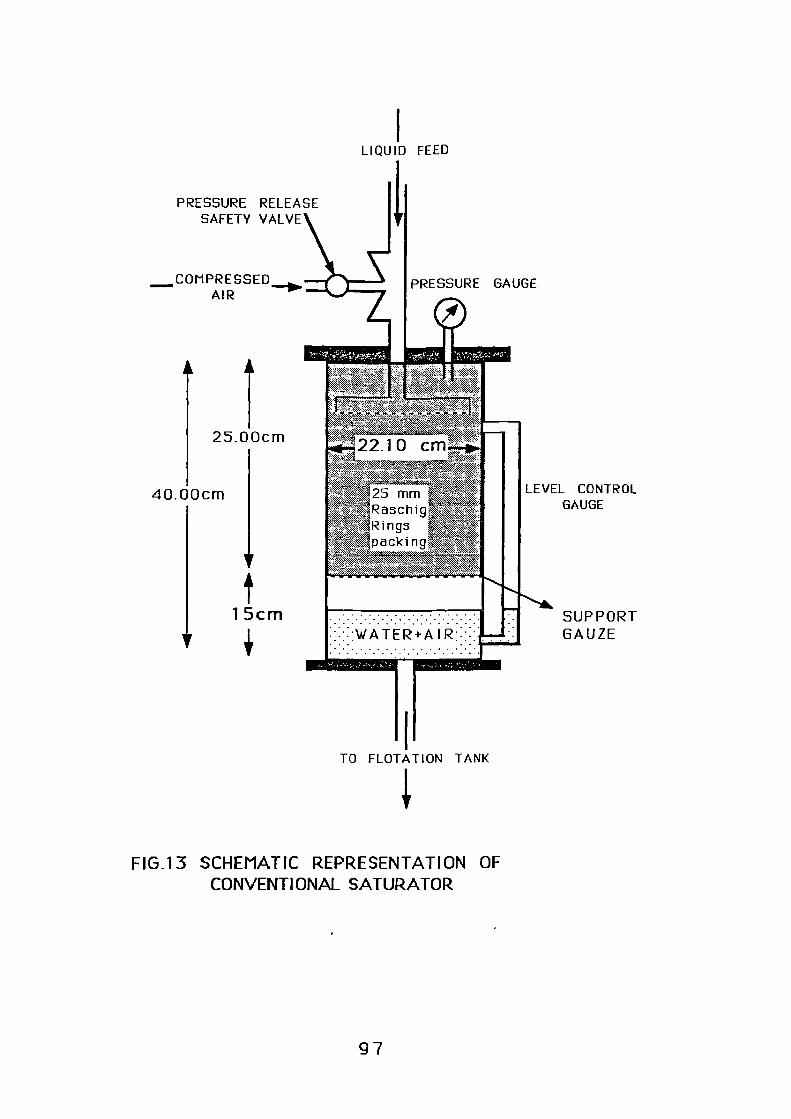
SUPPORTGAUZE
COMPRESSEDAIR
PRESSURE RELEASE
\
SAFETY VALVE
25.00cm
k*:s"•.&u 25 mrn*AiU*
RingsipackingS
.. •4t*AW:
LEVEL CONTROLGAUGE
TO FLOTATION TANK
PRESSURE GAUGE
40.00cm
1 5cm
LIQUID FEED
FIG.13 SCHEMATIC REPRESENTATION OFCONVENTIONAL SATURATOR
97

4.1.2. HI GEE ROTATING DISK
In FIG.14 is shown schematically the main parts of the Higee
absorber which was used in order to obtain results comparable
with those of the conventional saturator. The Higee rotating
distributor which was tested during the experiments incorporates a
torus with a radial depth of 10cm and an axial thickness of 2.5cm
rotating up to 1500rpm.
The gas passed through two radial tubes into the peripheral
plenum chamber of the rotor. From this chamber it was then fed
into the outer periphery of the annul ar liquid pool, using a
membrane. Gas bubbles are generated in this way and discharged at
the distributor under intense acceleration fields and travel
radially inwards under the influence of very high buoyancy. Then
they coalesce rapidly at the inner surface of the liquid annulus.
Liquid is introduced to the rotor from a stationary nozzle
distributor close to the inner liquid surface, and is discharged at
the outer radius, thereby providing a counter current flow regime.
However, having reached the packing outer radius, the liquid i s
then transferred axially into another chamber where it moves
radially inwards to a discharge lip only marginally outboard of
the gas-liquid interface in the packed chamber. This was the point
where sample of the treated liquid collected and submitted to
further analysis, i.e., measurement of precipitate air and bubbles
photographs.
98
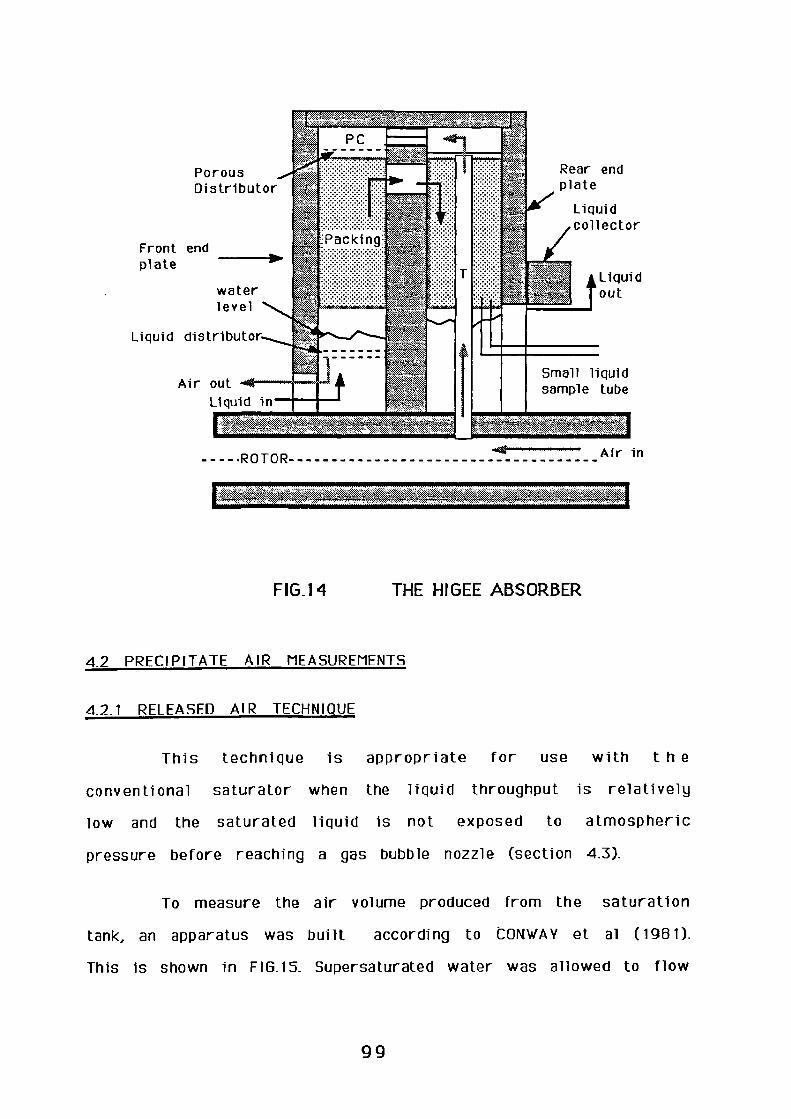
PorousDistributor
Rear endplate
Liquidcollector
Front endplate
waterlevel
Liquidout
Liquid distributor
Air outLiquid in
Small liquidsample tube
40**** .af414.0.h.„1,0
--ROTORwstg Air in
VI-Afr
FIG.14 THE HIGEE ABSORBER
4.2 PRECIPITATE AIR MEASUREMENTS
4.2.1 RELEASED AIR TECHNIQUE
This technique is appropriate for use with t h e
conventional saturator when the liquid throughput is relatively
low and the saturated liquid is not exposed to atmospheric
pressure before reaching a gas bubble nozzle (section 4.3).
To measure the air volume produced from the saturation
tank, an apparatus was built according to CONWAY et al (1981).
This is shown in F16.15. Supersaturated water was allowed to flow
99

through a restriction valve C into the first cylinder, while water
was displaced from the second, having valve A open to maintain
constant atmospheric pressure in the system. The released air then
was driven into an inverted 250m1 burette which was immersed in
a 21t graduated cylinder. The volume of the water displaced from
the graduated cylinder was equal to the volume of the water and
released air added in the first one. So by opening the valve B it
was possible to measure subsequently the volume of the water
added to the first cylinder. The difference between the two
volumes of water represented the volume of air released.
100
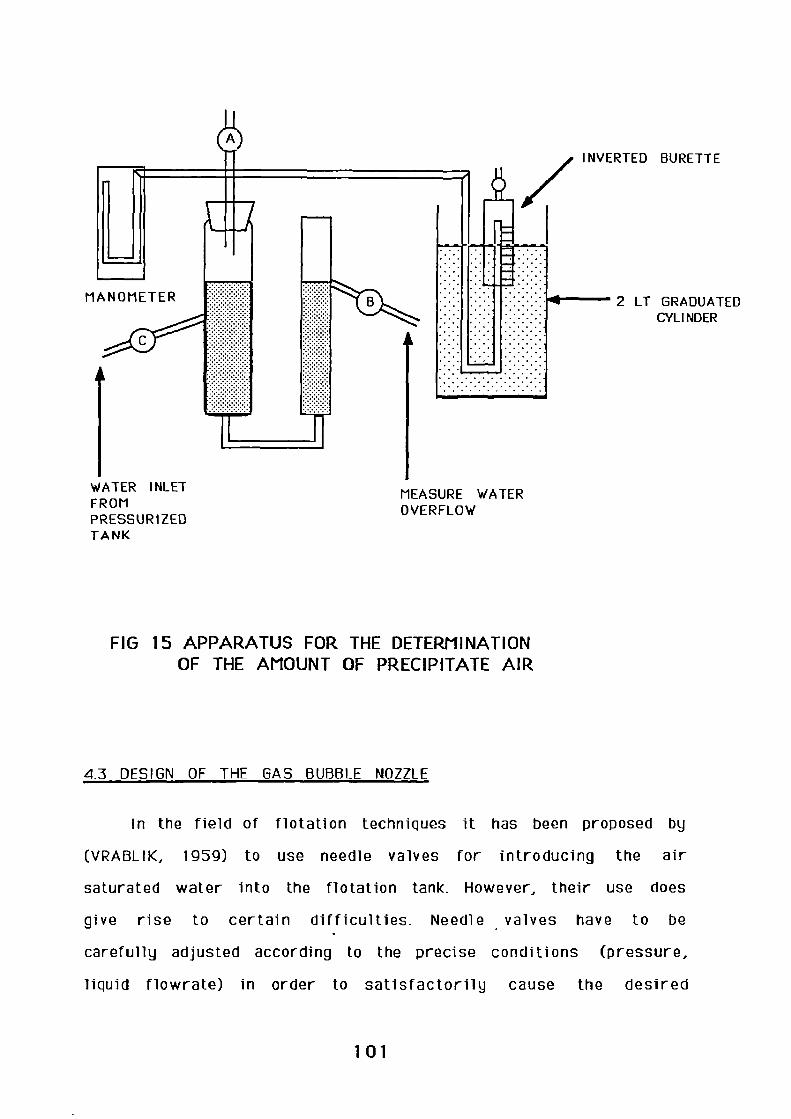
WATER INLETFROMPRESSURIZEDTANK
MEASURE WATEROVERFLOW
_INVERTED BURETTE
MANOMETER
I
. •fiall- 2 LT GRADUATEDCYLINDER
FIG 15 APPARATUS FOR THE DETERMINATIONOF THE AMOUNT OF PRECIPITATE AIR
4.3 DESIGN OF THE GAS BUBBLE NOZZLE
In the field of flotation techniques it has been proposed by
(VRABLIK, 1959) to use needle valves for introducing the air
saturated water into the flotation tank. However, their use does
give rise to certain difficulties. Needle valves have to be
carefully adjusted according to the precise conditions (pressure,
liquid flowrate) in order to satisfactorily cause the desired
101

formation of gas bubbles. Also, needle valves have a tendency to
become blocked and they are relatively costly to replace or repair
when they become worn or otherwise faulty.
The nozzle which was used in our experiments was designed
and constructed in the laboratory and is shown in FI6.16. The main
parts of it are:
1) A transversely divided housing 1,7, constructed from stainless
steel having a through passage in the form of a cylindrical bore
the diameter of which was 2.5cm (1inch).
2) Two stainless steel discs, 2 and 3, were disposed di ametrically
within the housing and were spaced 6.35mm(1/4inch) apart by a
spacer ring, 6, thereby a chamber, 8, was formed. The two housing
parts are releaseably interengaged by screw threads to clamp the
two discs with the spacer ring in between them.
3) Disc 2 had an orifice,4, located 4mm from the wall of inlet
housing 1; the diameter of orifice was 3.2mm(1/8inch). Disc 3 was
provided with an orifice, 5, located 2mm from the wall of outlet
housing 7 and diametrically opposed to orifice 4. The diameter of
orifice 5 is 6.35mm(1/4inch).
In use, pressurized air saturated water is passed through
orifice 4 at high velocity into chamber 8 where it impinges on
disc 3. In flowing to outlet orifice 5 the water must change
direction and impinge upon the cylindrical surface of chamber 8
and then again change direction before leaving chamber 8 via
orifice 5. In passing through the orifice 4 the pressure is greatly
102
reduced. Impingement of water on the metal surfaces and changes
in direction cause violent turbulence which in turn causes air to
come out of the solution in the form of tiny bubbles. Finally, the
water+air mixture leaves chamber 8 via orifice 5. This has a
larger diameter than orifice 4 since it is desirable that the
greatest pressure drop occur across orifice 4 (thus causing
release of the major proportion of the dissolved gas within
chamber 8.
103

c m-01.1
..
/://,/404 iffmr
•Si
Rafrmak•/FLOW IN
Fr 7.5cm
AWINKINTI 11M1112I
31.7mm 25.4mm
FLOWOUT
20mm
1
7
TAPPED INLET SECTION 6
1,7 HOUSING2,3 DISCS4 INLET ORIFICE 3.2mm5 OUTLET ORIFICE 6.35mm6 SPACER RING8 CHAMBER
DISK 2 DISK 3
FIG 16 GAS BUBBLE GENERATION NOZZLE
104
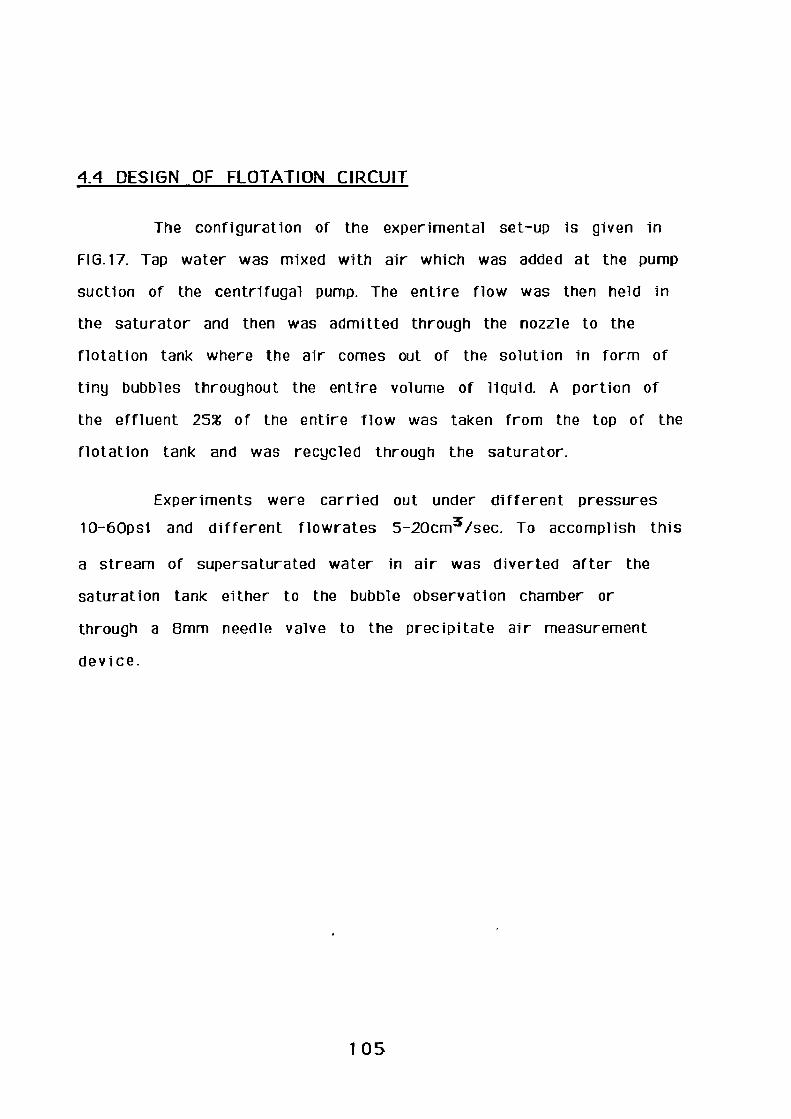
4_4 DESIGN OF FLOTATION CIRCUIT
The configuration of the experimental set-up is given in
FIG.17. Tap water was mixed with air which was added at the pump
suction of the centrifugal pump. The entire flow was then held in
the saturator and then was admitted through the nozzle to the
flotation tank where the air comes out of the solution in form of
tiny bubbles throughout the entire volume of liquid. A portion of
the effluent 25% of the entire flow was taken from the top of the
flotation tank and was recycled through the saturator.
Experiments were carried out under different pressures
10-60psi and different flowrates 5-20cm3/sec. To accomplish this
a stream of supersaturated water in air was diverted after the
saturation tank either to the bubble observation chamber or
through a 8mm needle valve to the precipitate air measurement
device.
105
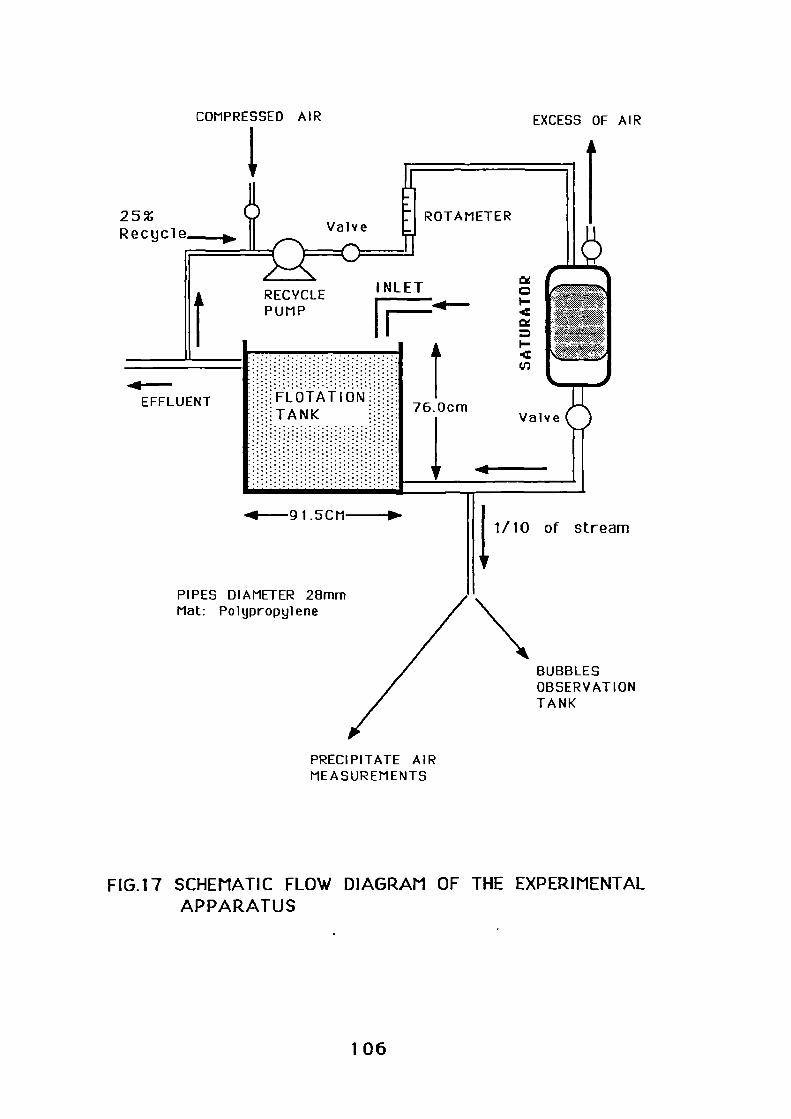
COMPRESSED AIR EXCESS OF AIR
25Recycle
EFFLUENT
Valve
INLETRECYCLEPUMP
FL OTAT I ON•: :::::: 76.0cm:TANK ••••••:•:-:•
ROTA METER
411--91 . 5C M---1110-1/10 of Stream
PIPES DIAMETER 28mmMat: Polypropylene
BUBBLESOBSERVATIONTANK
PRECIPITATE AIRMEASUREMENTS
FIG 17 SCHEMATIC FLOW DIAGRAM OF THE EXPERIMENTALAPPARATUS

4_5 BUBBLE SIZE DETERMINATION
4.5.1 BUBBLE OBSERVATION APPARATUS
The photographic technique which was used for the
determination of the bubbles diameter, basically consisted of a
borescope, a 35mm camera, a flash unit and an observation tank.
A) BORESCOPE
This was a rigid OLYMPUS borescope (F080-044-000-55)
with length of 44cm and diameter of 8mm. The direction of view
through the lenses was 0° and the field of view 550 . Finally the
depth of field could vary from 5mm to infinity.
B) CA HERA
The camera which was used to photograph the bubbles was
a 35mm OLYMPUS 0M-2 and this was coupled with a refconvertor
and an appropriate adaptor. By attaching the refconvertor into the
eyepiece of the camera, it was possible for the operator t o
observe the object from a more comfortable position_ The camera
was mounted to the borescope with the aid of a special OLYMPUS
adaptor.
C) LIGHT SOURCE
An OLYMPUS flash PE-280 was used to freeze the motion
of the bubbles while a KM light source (KMF-5) using a 100 watt
quartz halogen lamp was used to illuminate the dispersion of the
bubbles, so the focusing was achieved easier. The light was guided
107

from the light source to the borescope through a fibre light cable.
The flash duration was in the range of 5-20psec.
D) OBSERVATION TANK
The observation tank was made of perspex
(40cmx31cmx18cm). A wire 0.22mm in diameter was allowed to
immerse into solution close to the front side of the perspex tank
making focus easier in this way. The sides of the observation tank
were needed cleaning every 15 minutes due to adherence of the
bubbles onto them and making in this way difficult the observation
of the bubbles.
The arrangement of the apparatus to measure the size
distribution of bubbles formed in different conditions is shown i n
F I G.18.
108
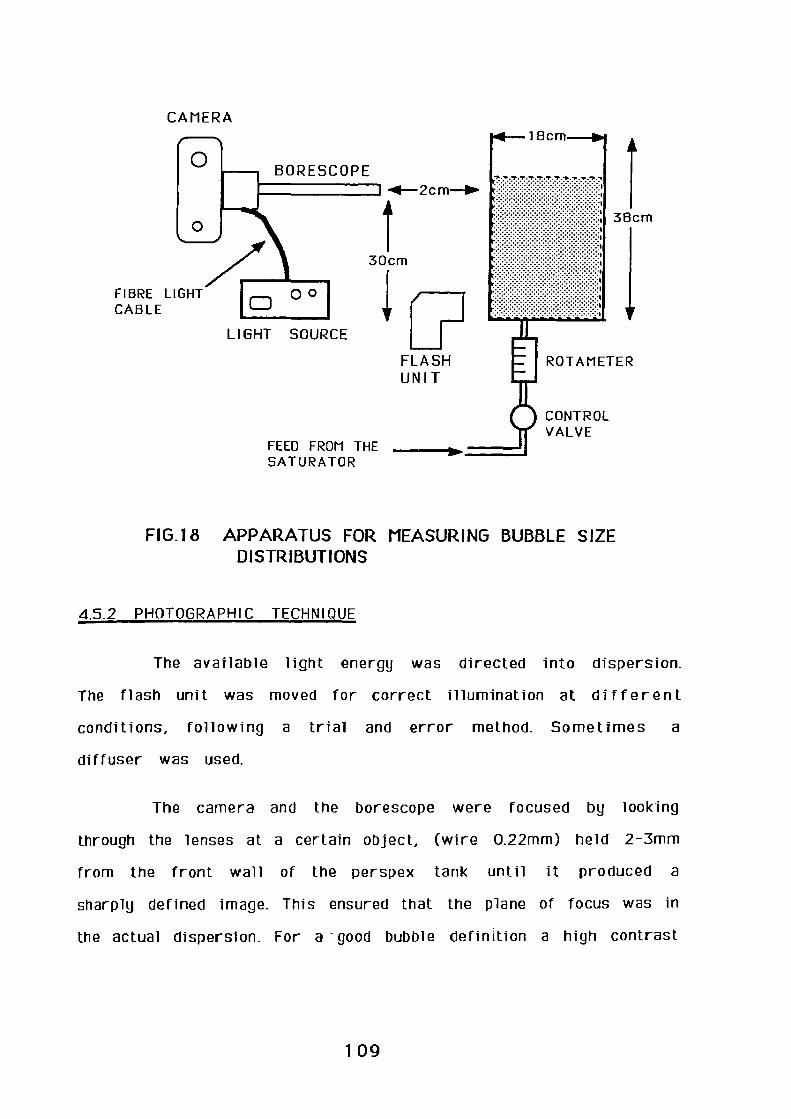
FIBRE LIGHTCABLE
LIGHT SOURCE
FLASHUNIT
CONTROLVALVE
CAMERA
FEED FROM THESATURATOR
FIG.1 8 APPARATUS FOR MEASURING BUBBLE SIZEDISTRIBUTIONS
4.5.2 PHOTOGRAPHIC TECHNIQUE
The available light energy was directed into dispersion.
The flash unit was moved for correct illumination at different
conditions, following a trial and error method. Sometimes a
diffuser was used.
The camera and the borescope were focused by looking
through the lenses at a certain object, (wire 0.22mm) held 2-3mm
from the front wall of the perspex tank until it produced a
sharply defined image. This ensured that the plane of focus was in
the actual dispersion. For a • good bubble definition a high contrast
109
film was necessary (ILFORD 400), developed in a hi gh contrast
developer.
All the photographs were taken in a perspex tank under the
same conditions in order to eliminate any error. The
supersaturated solution coming via the main pipe and the branched
pipe was inserted in the perspex tank through a nozzle similar t o
one which has been already described. The flow rate could be
accurately control led with the aid of a control valve and a
rotame ter. At each pressure a sequence of photographs of bubble
was taken. Size distributions were therefore measured from
photographs taken at this time. The resulting negatives from the
photographs were projected on a large screen, and the size of the
wire was used as the scaling factor. The total magnification was
x50.
110
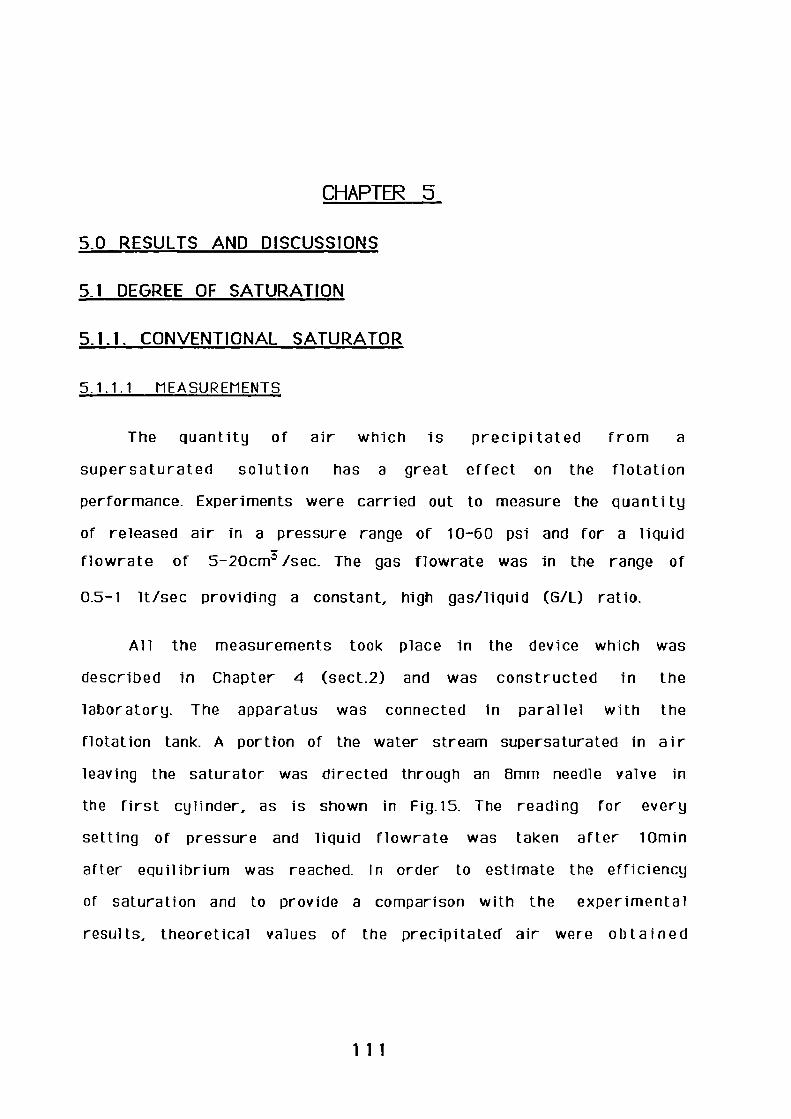
CHAPTER 5
5_0 RESULTS AND DISCUSSIONS
5_1 DEGREE OF SATURATION
5_1_1_ CONVENTIONAL SATURATOR
5.1.1.1 MEASUREMENTS
The quantity of air which is precipitated from a
supersaturated solution has a great effect on the flotation
performance. Experiments were carried out to measure the qua nti ty
of released air in a pressure range of 10-60 psi and for a liquid
flowrate of 5-20cm3 /sec. The gas flowrate was in the range of
0.5-1 it/sec providing a constant, high gas/liquid (G/L) ratio.
All the measurements took place in the device which was
described in Chapter 4 (sect.2) and was constructed in the
laboratory. The apparatus was connected in parallel with the
flotation tank. A portion of the water stream supersaturated in air
leaving the saturator was directed through an 8mm needle valve in
the first cylinder, as is shown in Fig.15. The reading for every
setting of pressure and liquid flowrate was taken after 10min
after equilibrium was reached. In order to estimate the efficiency
of saturation and to provide a comparison with the experimental
results, theoretical values of the precipitated air were obtained
111

from Henrys law and then converted to the actual volume of air b y
multiplying it with the current liquid flowrate.
5.1.1.2 Results, Discussion and Conclusions
Figures (19a-19f) show the relationship between generated
air flowrate and liquid flowrate. The tabulated data are reported
in appendix 4. In these Figures the solid lines are the theoretical
values obtained by Henry's law (see eq.59) where the squares
show the data points. The close correlation shows that Henry's law
is obeyed over this pressure range.
F16.20 and 21 combine these results to show the effect of
pressure and liquid flowrate and it is obvious that the degree of
saturation is a strong function of pressure.
112

13 Pressure 10 psi
—4-- HENRYS LAW
0 2 4 6 8 10 12 14 16 18 20
FIG 19a
o Pressure 20 psi
—4-- HENRYS LAW
10
20
LIQUID FLOW cm3/sec
LIQUID FLOW cm3/sec
FIG 19b
113
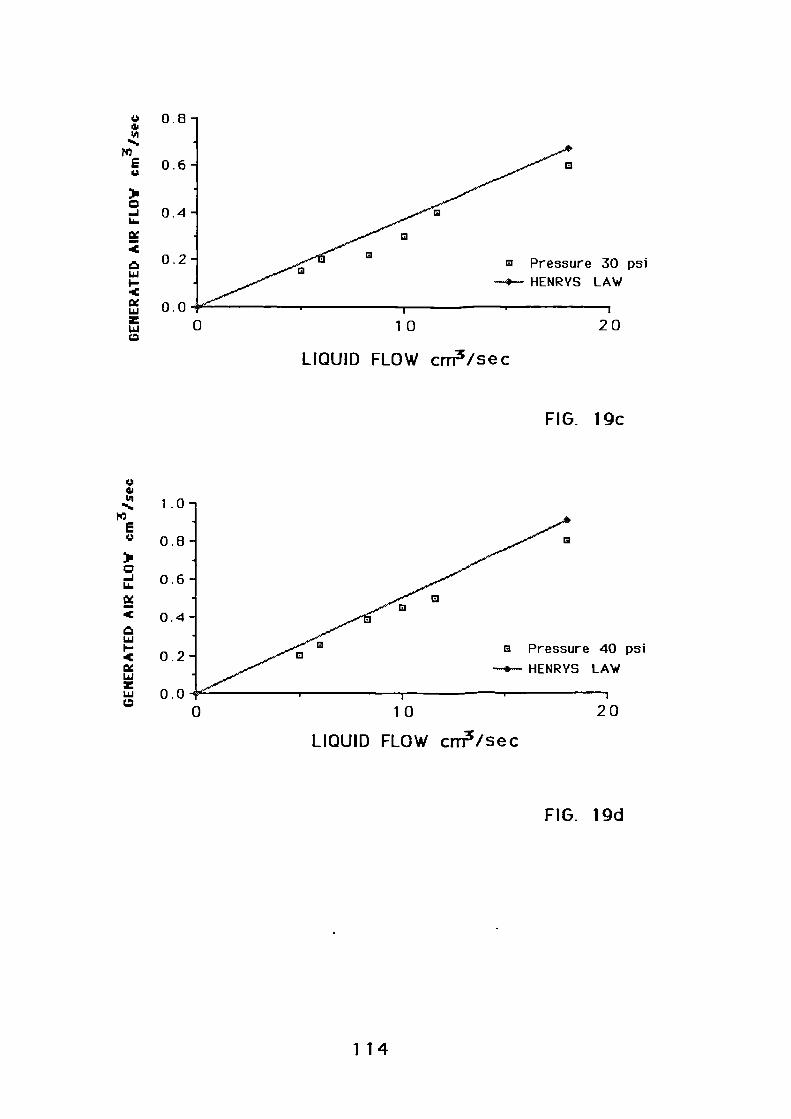
G Pressure 30 psiHENRYS LAW
10
20
.
•
8
.
•
6
0 . 4
0 . 2
.
•
0
FIG_ 19c
10
1 . 0
0 . 8
.
•
6
0 . 4
.
•
2
0 . 00
G Pressure 40 psi
—4*-- HENRYS LAW
20
LIQUID FLOW cm3/sec
LIQUID FLOW cm3/sec
FIG. 19d
114
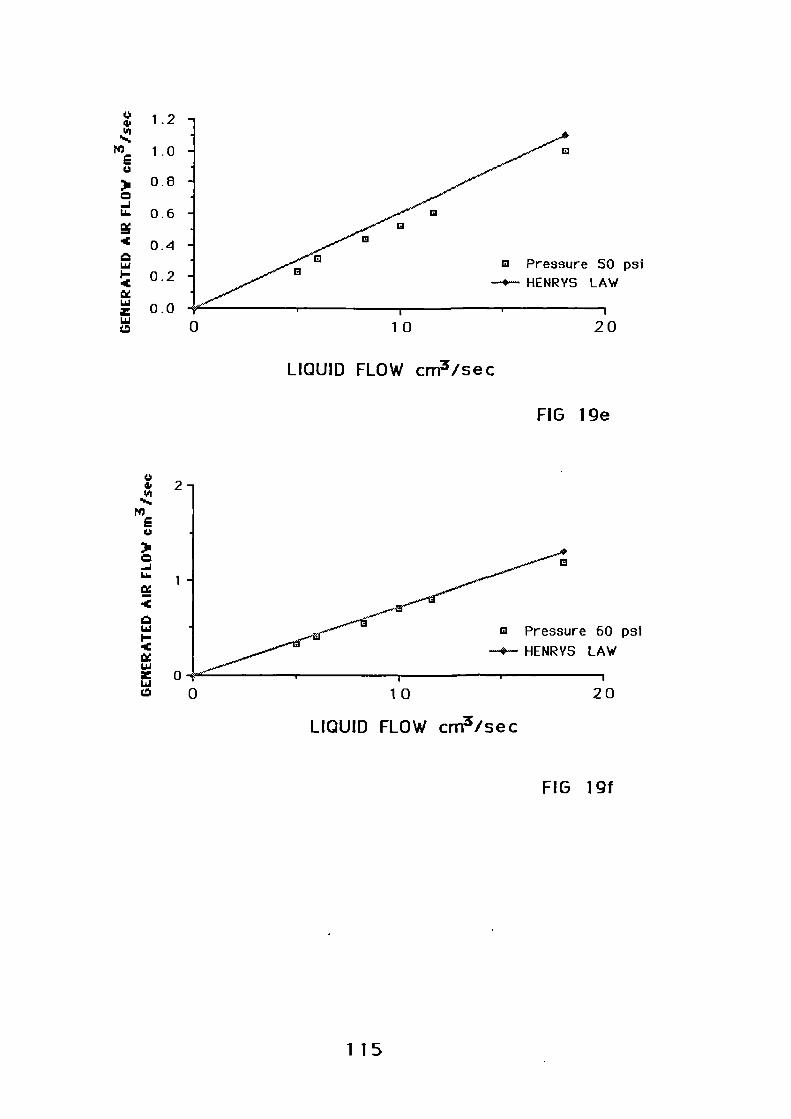
10
1 . 2
1 . 0
0 . 8
0 . 6
0 . 4
0 . 2
0 . 00
o Pressure 50 psiHENRYS LAW
20
0
10
20
0 Pressure 60 psi
HENRYS LAW
LIQUID FLOW crn3/sec
FIG lge
LIQUID FLOW cm3/sec
FIG 19f
115
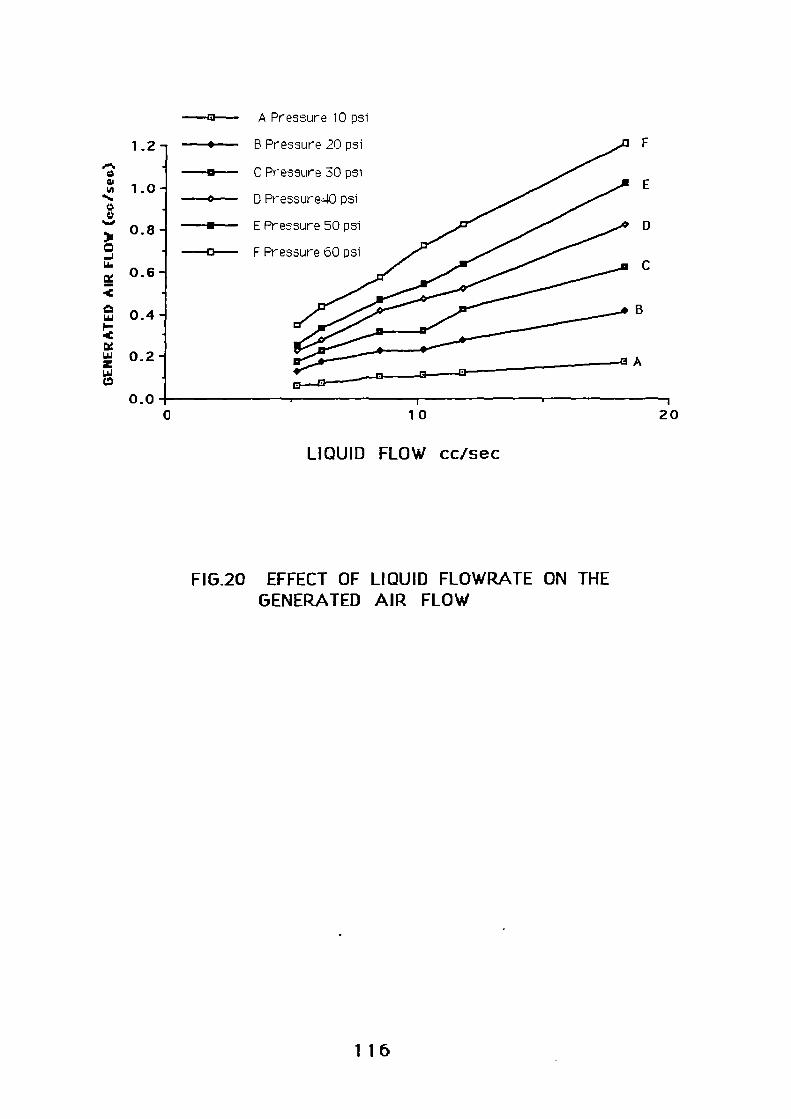
A Pressure 10 psi
B Pressure 20 psi
C Pressure 30 psi
D Pressure-10 psi
E Pressure 50 psi
F Pressure 60 psi
A
—o-
1.2 —.---
—a--1.0 - —0-
0 .8-
- —0--0.6-
0.4 -
0.2 -
0.00 110
LIQUID FLOW cc/sec
FIG.20 EFFECT OF LIQUID FLOWRATE ON THEGENERATED AIR FLOW
116

A LIQUID FLOW 5cc/sec
B LIQUID FLOW 1 Occ/sec
C LIQUID FLOW 18cc/sec
C
0.4 -
0.2 -_
0.0 I I I • I • I
0 10 20 30 40 50
PRESSURE (psi)
60• i
70
FIG. 21 EFFECT OF PRESSURE ON THE GENERATEDAIR FLOWRATE
117

The amount of precipitated air also increases linearly with
an increase in liquid flowrate. Provided saturation was attained,
experimental values corresponded very closely with the
theoretical saturation concentrations. This method, therefore
provides a convenient measure of the actual amount of air
precipitated from saturation feeds. It also provides a means of
assessing the efficiency of different saturation procedures and
determining the influence of various factors such as needle valve
configuration, turbulence and dilution water.
Factors affecting Degree of Saturation
CONWAY A. et al (1981), have carried out experiments using
the same device as it was described in Chapter 4, to measure t he
quantity of the precipitated gas but they used a different
configuration of nozzle_ In their experiments a comparative study
was made to evaluate the performance of a flotation unit using
three different gases with solubilities greater than air. The gases
were a) off-gas from oxygen activated sludge (solubility: 466
mg/1.Atm), b) combusted digested gas (solubility: 203 mg/1.A tm)
and c) sludge-incineration stack-gas (solubility: 352 mg/LA tm).
(BISWAS A.K. 1967). Despite the high solubility of these gases
compared with 23mg/1.Atm for air, a full utilization of Dissolved
Air Flotation using high soluble gases has reduced efficiency when
compared to air due to the • fact that the main component of the
above gases, CO.:, can interfere in many ways in the chemistry of
118
the system. For example CO 2 can change the surface potential of
some minerals such as calcite. (PLASKIN I.N., 1959-BISWAS A.K.,
1967). Also all the above gases require extra precautions for
safe handling.
Apart from choosing a gas with higher solubility in water
another method to enhance the flotation performance is the use of
water than air at high temperatures (60 0 -80°). In this case for
the same range of pressures (40-60psi) the amount of the
precipitated air increases only for water temperatures above 600
(SHANNON W.T.,1980).
Effect of flowrate
TAKAHASHI T. et al (1979), in their experiments found that
the amount of precipitated air in the flotation tank from a
saturated in air water stream increases with the increase in liquid
flowrate. Our data are in a good agreement with theirs. In some
cases, as you can see from FIG 22, the amount of generated air is
smaller than ours, which is probably due to the fact that they
have used different nozzle configurations to ours.
119

10
20
• Takahashi 60 psi
1:1 Pressure 60 psi
—4— HENRYS LAW
LIQUID FLOW cm3/sec
FIG 22I'
Effect of pressure
Finally BRATBY J. (1975) related the amount of the released
air in the flotation tank with the pressure which was applied to
the liquid with the following equations:
C=0.195 P [69]
for P > 45 psi
C=1 0(0•00773 P-0.548)
[70]
for P< 45 psi
120

;
-0o• 120—.. .
..o100—
ro
8a s 0 ' 195.P
where: P= Saturator gauge pressure (psi)
C= mass of air precipitated per litre of saturated
water (mg/it)
FIG.23 shows the results and data points obtained by BRA TBY
J. (1975) and also with the thick line showing the empirical
correlation which is the best fit of all these data given by Eq.
(69-70). Superimposed on this line is our experimental points
shown as big squares. It is clear that our results overlapped the
BRATBY J. data points at low pressures, but due to the fact that
we cannot work at higher pressures we could not confirm the
straight proportion of the curve at high pressures.
PRESSURE (Psi)_
.... lo io 60 sp P.50 § I160 I
ro
T I I 1 I I I
r1
Ia—
ca.
7.1 60—e.-0. e.•
U40— e • 2
• .,• ., a a .10(0,00773.P-0,548)
2 20— °a
e I a P-0. e • ata ..,.0
eIi 1..; if 1 1 1 f
800
80-
E 140—
FIG. 23 EFFECT OF PRESSURE ON THE MASS OF PRECIPITATE
AIR
.
00 100 200 300 400 500 600 700
P, SATURATOR PRESSURE ( kPo)
1
121

5_1_2_ HIGEE ABSORBER
In the Higee apparatus the bulk of the liquid returns to the
centre line in the non packed second chamber and flows over a
weir into a large storage tank. A small sample tube dips below the
liquid surface and scoops the aerated liquid and directs into a
dissolved oxygen monitoring unit (ORBISPHERE LABORATORIES, Mod:
26072, sensor: 211521. From these results the dissolved air can
be calculated because both oxygen and nitrogen have nearly the
same diffusivities.
Results were taken with packings of varying thickness,
(25cm and 5cm), and also without packing. The packing was a
rigid mesh made from polypropylene having a porosity greater than
95% and the width of the polypropylene mesh element was about
1mm; its commercial trade name was DECLON. The variables are
the speed of rotation (which defines the "g" force at the outer
periphery and thus the pressure of the absorbing gas), liquid
flowrate and gas flowrate. All the packings had the same radial
depth of 10cm but some runs were carried out with thinner axial
length of packing (2.5cm) which increased the liquid velociti es
and also helped to reduce circulation within the packing. The gas
and liquid flow were controlled for each set of runs. However,
because of the high throughput the temperature could not be
controlled but it was maintained in the range 10-20 °C.
122

5.1.2.1 Obtained results, discussion and conclusion.
The results of all the runs for different conditions are
tabulated in Appendix 3. The results were classified in various
groups and and the parameters which we examined were:
1) Effect of Plenum pressure on the amount of released air
(which for a fixed radial length of packing is directly linked to
the speed)
2) Effect of liquid flowrate on the amount of released air for
different settings of gas flowrate, packings and rotation speed.
3) Effect of gas flowrate on amount of released air
Effect of pressure
FIG.24 shows the results of two runs one using thick DECLON
as packing material and the other no packing at all. It can be seen,
therefore, that in the case where packing was used, the amount of
air released is smaller than when no packing is used_ The varying
pressures produced as a result of the different rotation speeds do
not appear to influence the final concentration of released air. It
is expected that when packing is present the gas bubbles
continually coalesce and split as they migrate through the packing,
this should produce a more efficient degree of saturation, however
the results prove otherwise. This is probably due to the very high
gas/liquid flow used for these runs and the initial bubbles formed
by jet action without the packing, are very small.
123

°------4:1-----13"--------G---------------cI--o A
-
The runs in FIG. 24 were carried out at low liquid flows,
therefore a series of runs were undertaken at hi gh liquid
throughputs. FIG.25 shows that the efficiency is improved at lower
pressures and unlike FIG. 24 the generated air increases with
pressure, this can be economically advantageous because better
saturation levels can be obtained with lower energy consumption.
For this type of saturator, pressure is linked to speed and
effective gravity, thus at high pressure (high speed), although the
bubbles should be smaller, the higher centrifugal speeds mean that
the bubbles move faster and spend less time in the liquid and will
give poorer performance.
—o-- A NO PACKING
Liquid flow
91 cc/sec
6.4 -; --4--- B THICK DECLON 5crn Air flow
1000 cc/sec
5.4 r i I
0
10
20 30 40
PRESSURE (psi)
FIG. 24 EFFECT OF PLENUM PRESSURE ON RELEASED AIR
124

0 3000 4000111
1000 2000
THIN PACKINGGAS FLOW 1500 cc/sec
—ci— P=78.3 p51
—*-- P= 37.5 psi
LIQUID FLOWRATE (cc/sec)
FIG.25 EFFECT OF LIQUID FLOWRATE ON THE AMOUNT OF
RELEASED AIR
Effect of liquid throughput
To examine how important high liquid throughput and the
presence of the packing was during the operation, two types of
packing were used, thin and thick DECLON. FIG.26 reveals that thin
packing gives slightly better absorption of air. This happens
because the thin packing produces a higher mean liquid velocity
and probably near plug flow conditions withOut back mixing_ It is
125
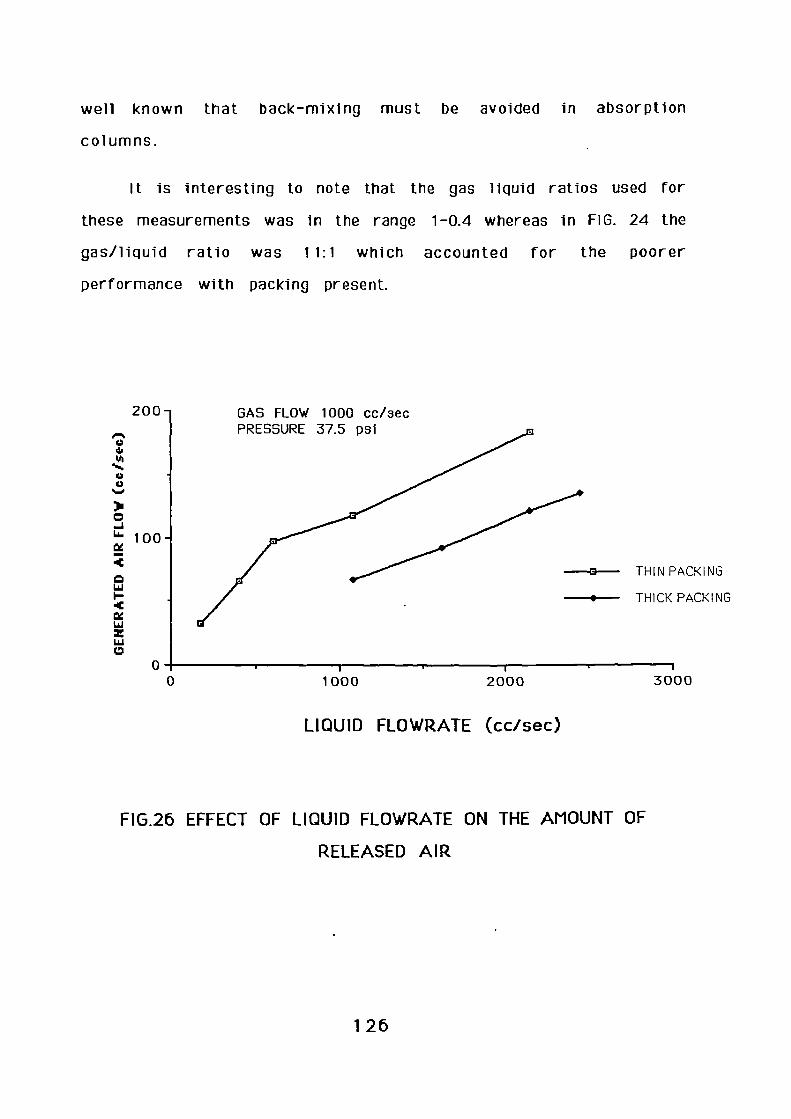
200-
100-
GAS FLOW 1000 cc/secPRESSURE 37.5 psi
—m— THIN PACKING
--.-- THICK PACKING
10 1000
0 ,r
2000 3000
well known that back-mixing must be avoided in absorption
columns.
It is interesting to note that the gas liquid ratios used for
these measurements was in the range 1-0.4 whereas in FIG. 24 the
gas/liquid ratio was 11:1 which accounted for the poorer
performance with packing present.
LIQUID FLOWRATE (cc/sec)
FIG.26 EFFECT OF LIQUID FLOWRATE ON THE AMOUNT OF
RELEASED AIR
126
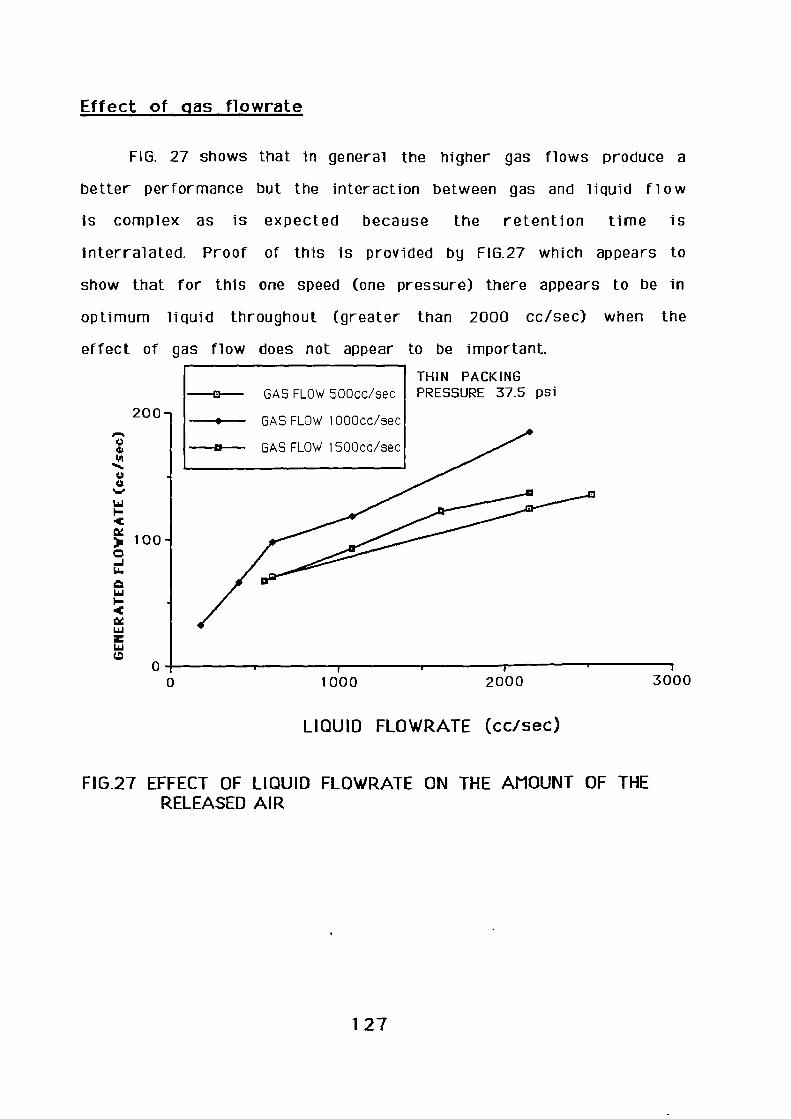
Effect of gas flowrate
FIG. 27 shows that in general the higher gas flows produce a
better performance but the interaction between gas and liquid flow
is complex as is expected because the retention time is
interralated. Proof of this is provided by FIG 27 which appears to
show that for this one speed (one pressure) there appears to be in
optimum liquid throughout (greater than 2000 cc/sec) when the
effect of gas flow does not appear to be important.
THIN PACKINGPRESSURE 37.5 psi
200-,
—a--- GAS FLOW 500cc/sec
--.-- GAS FLOW 1000cc/sec
—a— GAS FLOW I 500cc/sec
0 ,1-0 1000
I2000 3000
LIQUID FLOWRATE (cc/sec)
FIG.27 EFFECT OF LIQUID FLOWRATE ON THE AMOUNT OF THERELEASED AIR
127
Experiments were also carried out for the low liquid flows
and when no packing is present, the gas flow, as shown in FIG. 28,
has no important role on the performance of the Higee absorber.
On the other hand, pressure seems to be the dominant factor for
enhancing performance at these conditions. Without packing the
bubbles are not impeded as they migrate towards the centre line
and thus the gas flow effect should only effect the initial bubble
size. For single nozzle and one "g", the bubble size decreases with
gas flow and in theory the mass transfer should be improved,
however more bubbles are produced per unit volume and the
potential for coalescence increase which reduces the mass
transfer. Without packing coalescence will occur with the net
result that the two mass transfer effects cancel each other out,
resulting in only a marginal gas flow effect as seen in FIG 25.
128
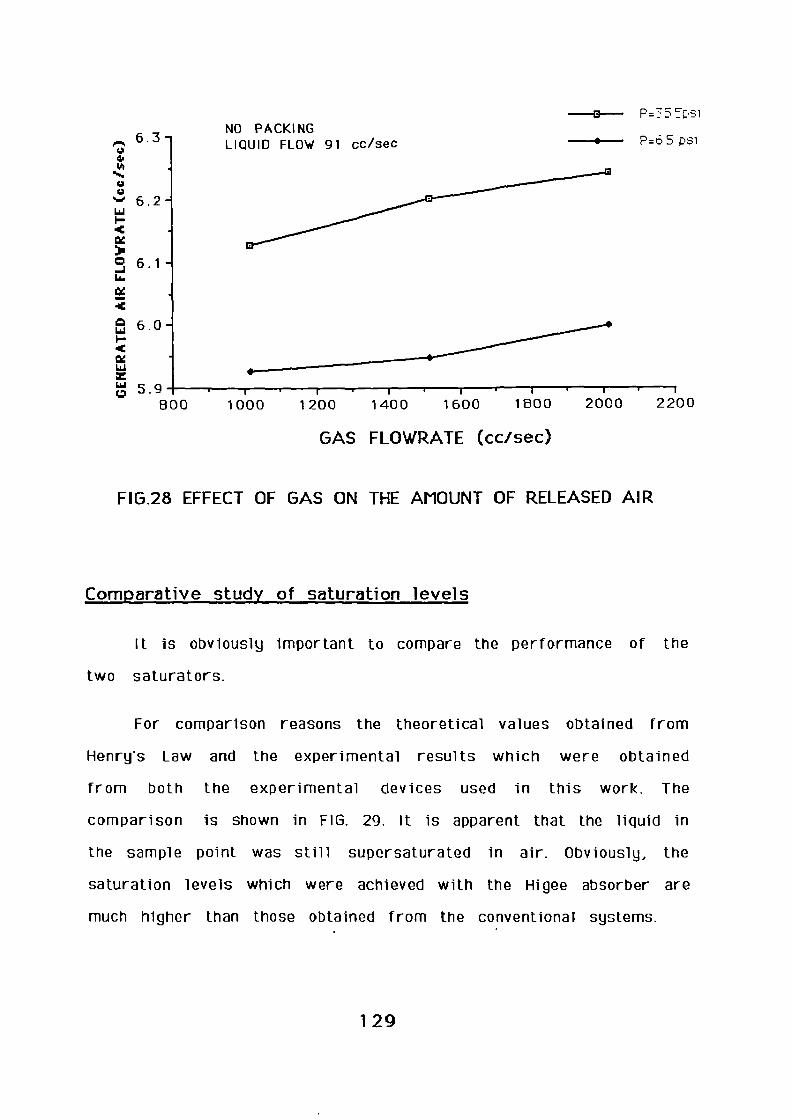
6.3 -
—El---- P = 5 5p s
P = 6 5 psiNO PACKINGLIQUID FLOW 91 cc/sec
n-n 6.2 -w
0 6.1 -...I
CC
:17C
El 6.0 -I-<
zL61 5.9 • • I •
800 1000 1200 1400 1600 1800 2000 2200
GAS FLOWRATE (cc/sec)
FIG.28 EFFECT OF GAS ON THE AMOUNT OF RELEASED AIR
Comparative study of saturation levels
It is obviously important to compare the performance of the
two saturators.
For comparison reasons the theoretical values obtained from
Henry's Law and the experimental results which were obtained
from both the experimental devices used in this work. The
comparison is shown in FIG. 29. It is apparent that the liquid in
the sample point was still supersaturated in air. Obviously, the
saturation levels which were achieved with the Higee absorber are
much higher than those obtained from the conventional systems.
129
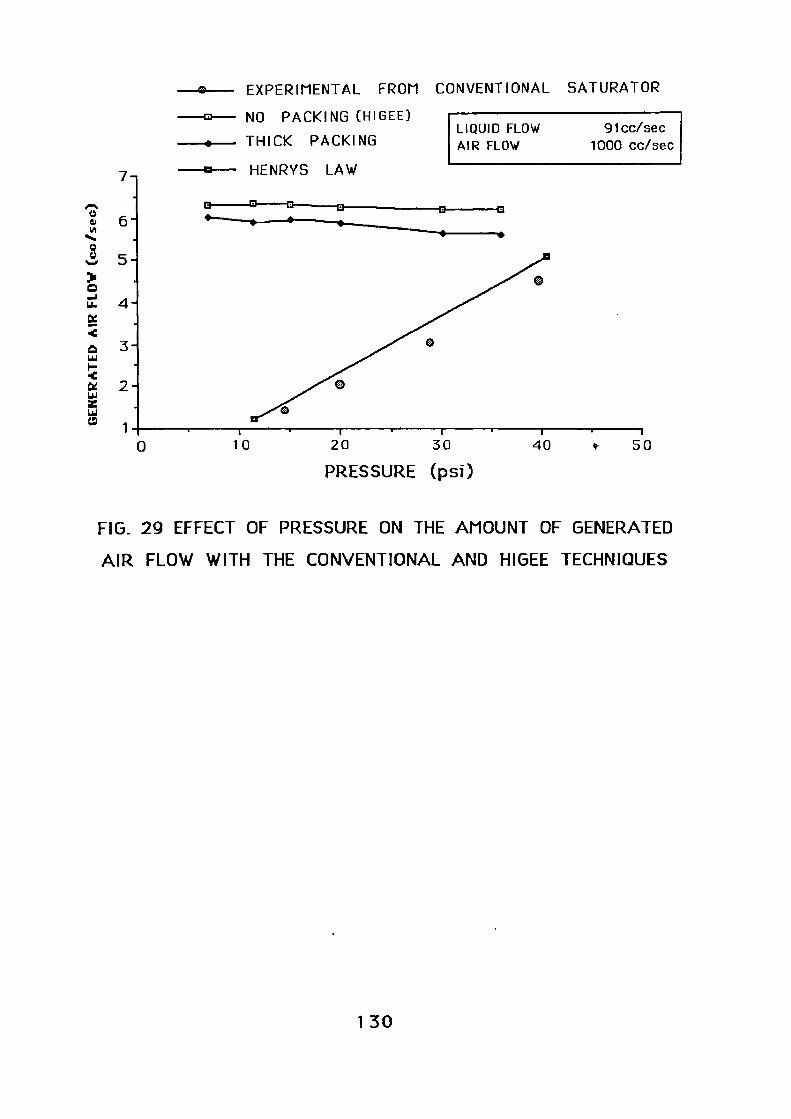
4........n...........n100,,,
,
I • I
6 -
5 -
4
i
3
2
1
7,
—0-- EXPERIMENTAL FROM CONVENTIONAL SATURATOR
—0-- NO PACKING (HIGEE)
--•-- THICK PACKING
—0-- HENRYS LAW
LIQUID FLOW
91cc/sec
AIR FLOW
1000 cc/sec
o
10 20 30
40
t 50
PRESSURE (psi)
FIG_ 29 EFFECT OF PRESSURE ON THE AMOUNT OF GENERATED
AIR FLOW WITH THE CONVENTIONAL AND HIGEE TECHNIQUES
130
5.2 Bubble size measurements
5.2.1 Conventional saturator results
The resulting negatives from the photographs were projected
on a large screen and for comparison reasons an object of known
size was protruded.
The photographs (1-18) show that the bubbles appeared
spherical but, due to their velocity sometimes they appeared
blurred which was attributed to imperfect flash conditions and the
large scale of magnification which was achieved through the
arrangement of lenses.
In all the runs a number of bubbles were photographed to
within a zone 2cm from the level of the water in the perspex tank
and the average bubble diameter was evaluated. The experimental
program can be divided into the following experiments:
1) Effect of liquid flowrate on bubble size.
2) Effect of pressure on bubble size.
A statistical analysis was performed to evaluate the validity
of the observed bubble diameters. The results of the photographs
were shown in histograms 30a-30r. (see APPENDIX 1)
131
The results of the analysis were plotted in Fl G.31-33 against
the calculated results which derived from Eq.(55). (see APPENDIX
2)
The standard deviation of the obtained results was in the
range of 15-30pm. 95% of the generated bubbles lay between 30-
200pm. Also during the experiments at higher liquid flowrates
(18cc/sec) large bubbles were observed but they were not
captured in the film. These were probably formed by the growth of
bubbles in corners or, attached to the outlet pipes for here the
water is still supersaturated. Of course the formation of this size
of bubbles is undesirable due to the fact that air is wasted for
their formation and also, they can cause turbulence in the system
where fragile flocs appear.
5.2.2 Hiqee Saturator results
The saturated liquid which returned to the central axis, and
then flowed over the collection weir, from which a small sample
was directed into the same bubble visualization chamber as
described in Chapter 4. The appearance of the liquid when viewed
with the borescope was of a slight cloudiness but it was not
possible to photograph or observe any bubbles. This could be
either because the bubbles are too small or because the pressure
of the liquid had reduced to atmospheric by the time it reaches the
weir and all the bubbles had come out of the solution before
reaching the measurement cell. The latter concept is unlikely to
132

be true as the absorbed gas results show in section 5.1.2.1 there
is clearly a large quantity of dissolved gas present by the time
the liquid gets to the oxygen meter. The Higee unit was only
available for a limited time and it was not possible redesign the
liquid take-off section to enable any bubbles present to b e
examined. Further more if the bubbles are very small a much more
expensive and complex bubble size monitoring system required.
133

PRESSURE 10 (psi)
LIQUID FLOWRATE 5cc/sec
PHOTOGRAPH 1

s,
/111410.0.‹.?
tS1•
'4,4101INgreirn4,,,t..' , . - • " .:,.. , • . •I'''.v.,:--:..- P.trtA4.4..t.it.-• -..."/JAvArnop*Otaatt-:
0
45‘41441211intosii-iii:
4 : .•
0.*go*
110.
„es'Att
•
••••2'
r . ,
Niarok
• • :4 -144

PRESSURE 20 (psi)
LIQUID FLOWRATE Scc/sec
PHOTOGRAPH 2


PRESSURE 30 (psi)
LIQUID FLOWRATE 5cc/sec
PHOTOGRAPH 3
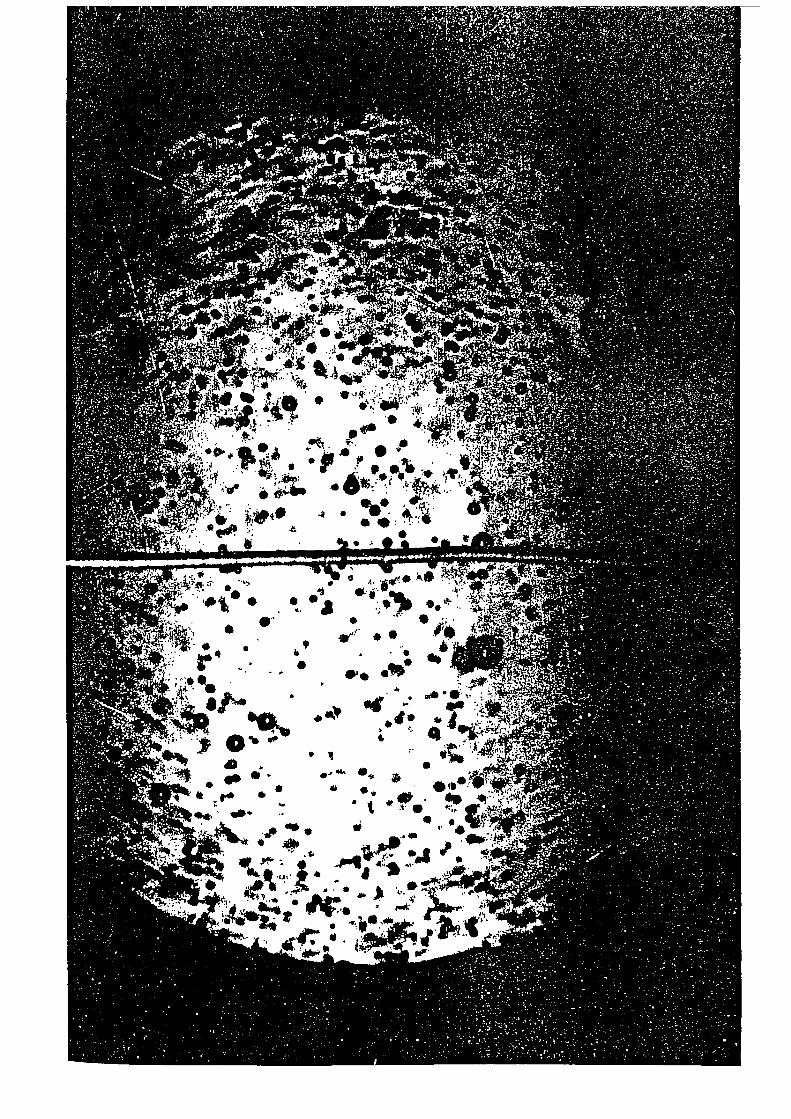

PRESSURE 40 (psi)
LIQUID FLOWRATE 5cc/sec
PHOTOGRAPH 4


PRESSURE 50 (psi)
LIQUID FLOWRATE 5cc/sec
PHOTOGRAPH 5

PRESSURE 60 (psi)
LIQUID FLOWRATE 5cc/sec
PHOTOGRAPH 6
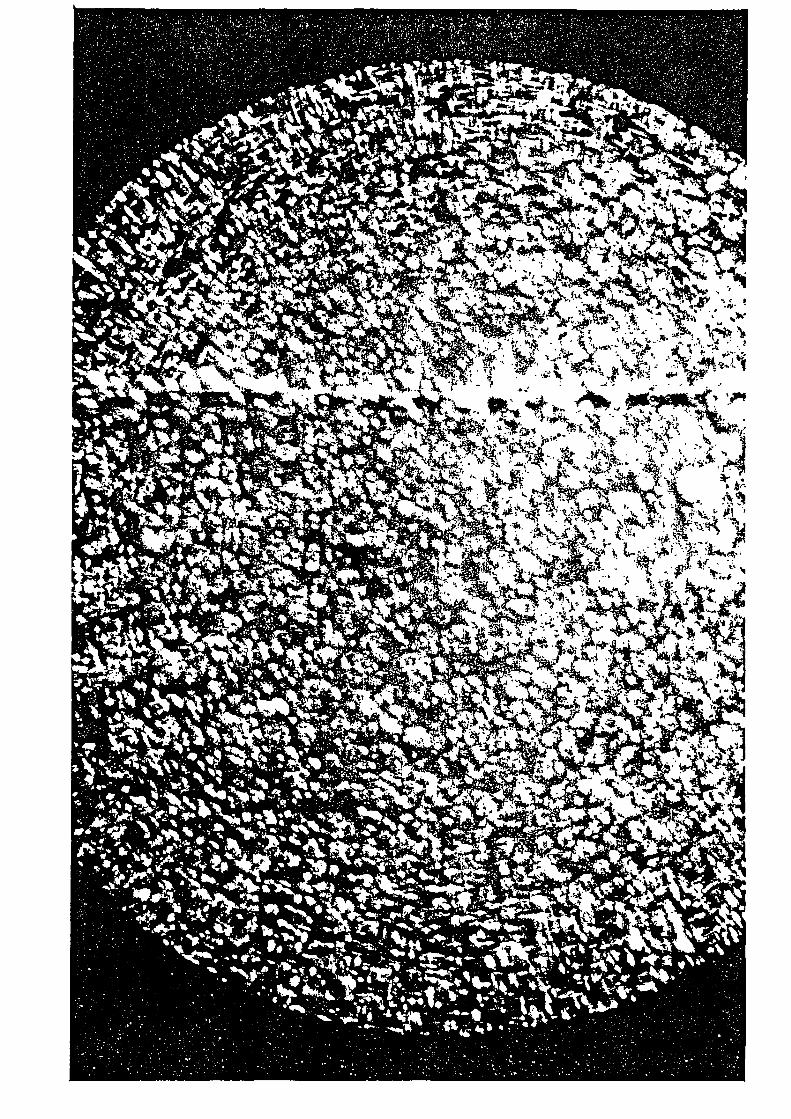

PRESSURE 10 (psi)
LIQUID FLOWRATE 10cc/sec
PHOTOGRAPH 7


PRESSURE 20 (psi)
LIQUID FLOWRATE 1 Occ/sec
PHOTOGRAPH 8


PRESSURE 30 (psi)
LIQUID FLOWRATE 1 Occ/sec
PHOTOGRAPH 9
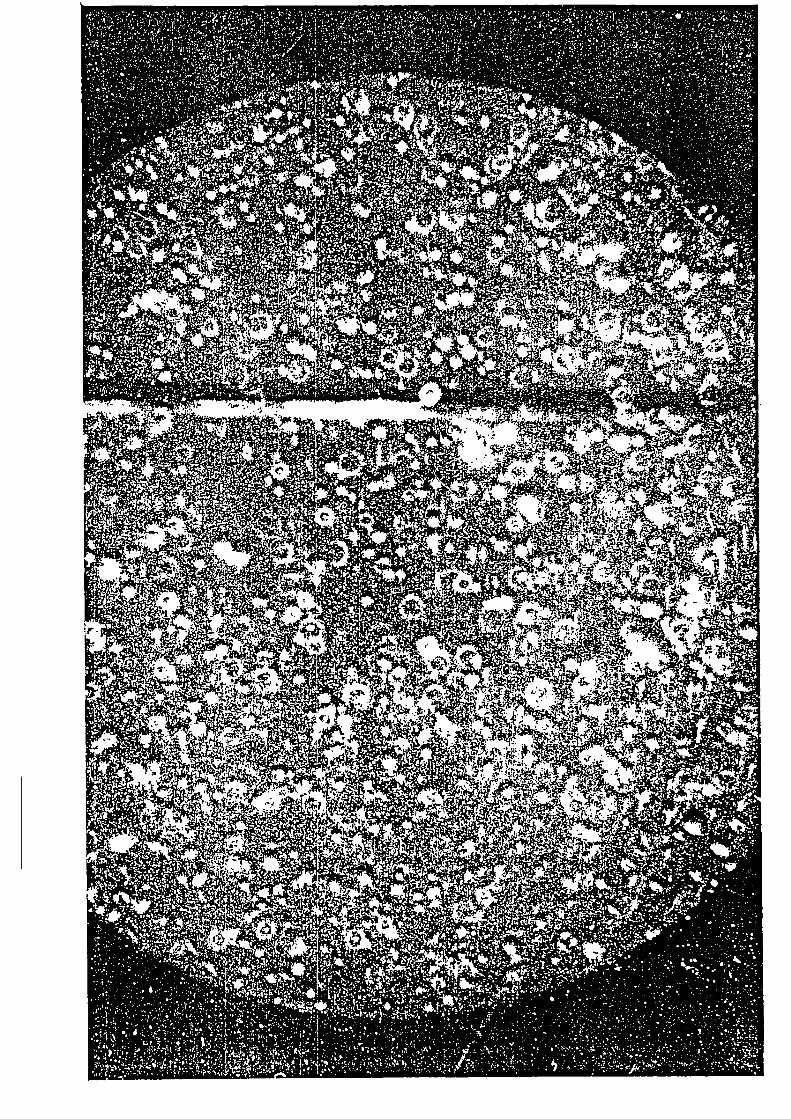

PRESSURE 40 (psi)
LIQUID FLOWRATE 10cc/sec
PHOTOGRAPH 10


PRESSURE 50 (psi)
LIQUID FLOWRATE 1 Occ/sec
PHOTOGRAPH 11
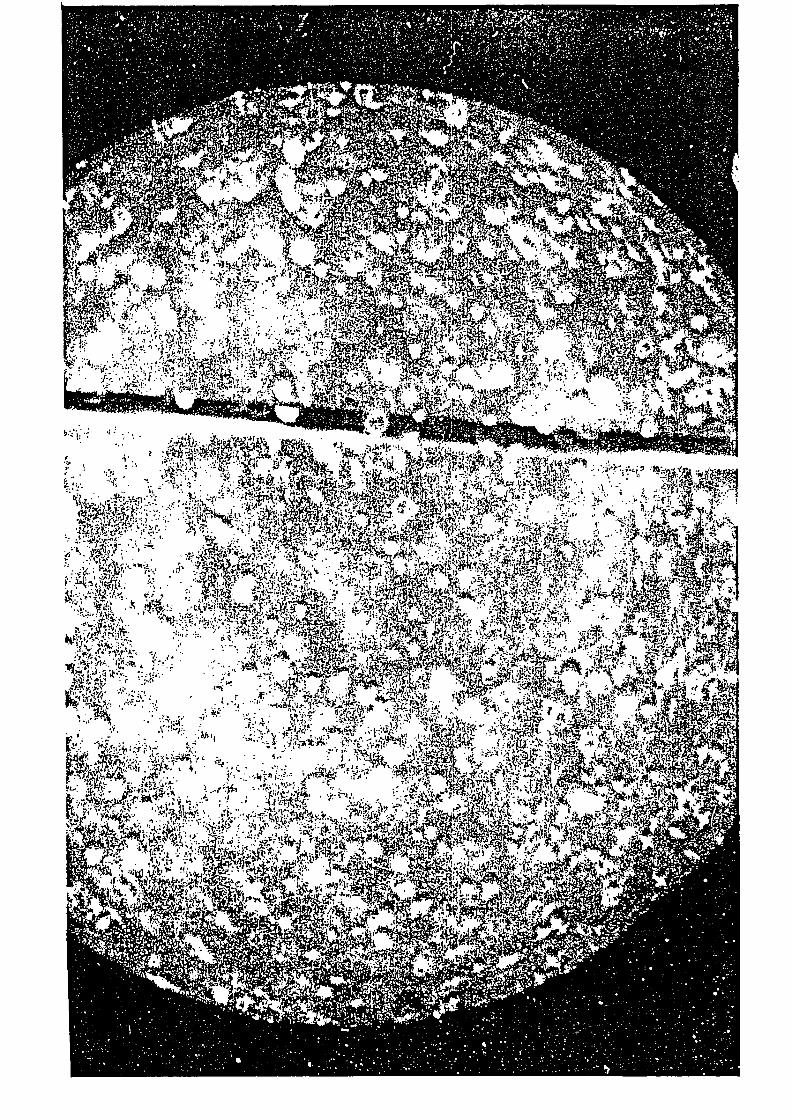
•.1!:):2*-4.:2.15:47r11:1e).7
ti.I., • .., .-il.#1
,.. .
-- ....,„,;*.m.. . 44 .:.. , .1:.!•.,:• e. ',' 4 1, 14 ::-... 7 .' vi
•• . .• .....16.1;"1'''.. • .A.L...N7
A
?;;‘
.47);,,41 :,•1,1-0 :-.,!.. :.::.:4,-... • • - ::' .t,.1. ...
4-ii' -.,,,-....4., ..z...- s: . k . .....,, ..
4.4„::.,61 • r ,.^. '
r -... 7. •c•.. • 4.7..,...u.g.:...1;1,*
fr-, ri,....1,,• l'A .,:.• .. -. t ..., . ••-, .,.--.,. tirecl • • • •1,.n -x ,--",..
,
i' s/.i:. " ". . . Vri''' :k*C1Fk 13:' • '' d'..r.: * "r ‘ . v,,...'11. r vbsolt
5' ' '!1 ""e • : . • '',.. ' ' it I .`..- . , .i ., .- '
. • - i
, 4 -"'"..•-• . • .."-Alt•rA, i.• • C. .1, tr. • , I . ': .
.r" ,•- ?-:‘1,i
1 • • b;
r fPr'. . .vi.:. . : . .. ..,..$4,....,",, ,...,.. . . .,. . • , • , ...3 K
. : • .''''s •'•;
. .1)1.t.: , 4 , - •I'•.! .. • ., !...;.., : ,,.:,4,,egt : r . .
.•It' ,:. . - A,3', .t. -.40 1. -- .. .,e .,,--tdri....e...r,-,. ' ..„ ....,,t..0.,• , .1......,;:•.1!).:••• •••••• -.: .
: ,fi. ".• •••••-''''� '1'4`, .t?'-_•-•)t.,.:,s, 44 ;,pr '`;• . T3 e',..14
;
-1t . ..):- 1.-1,:.. . ,.. . , ...,.tr
m:0.4; • • .$:;-‘,...%v:',./1....1,,,..e,t..),„ ,,M);:fid '.._- '::..6
F. 4:..; --;:-..-:. 0', .1::,";:.,-i, -' • ' —.C''' . 16 •
..;,;.., - .7,, • 1!, 4- 1,1.'4
it- • ...4 II. L ....• • C ..;0;:djsr
•.i Ai )4 9.,,, N: :1
- i :01 13.(.....:7. 11,.. tr .1.t.g0:91.',' .•

PRESSURE 60 (psi)
LIQUID FLOWRATE 1 Occ/sec
PHOTOGRAPH 12


PRESSURE 10 (psi)
LIQUID FLOWRATE 18cc/sec
PHOTOGRAPH 13

PRESSURE 20 (psi)
LIQUID FLOWRATE 18cc/sec
PHOTOGRAPH 14


PRESSURE 30 (psi)
LIQUID FLOWRATE 18cc/sec
PHOTOGRAPH 15

PRESSURE 40 (psi)
LIQUID FLOWRATE 18cc/sec
PHOTOGRAPH 16
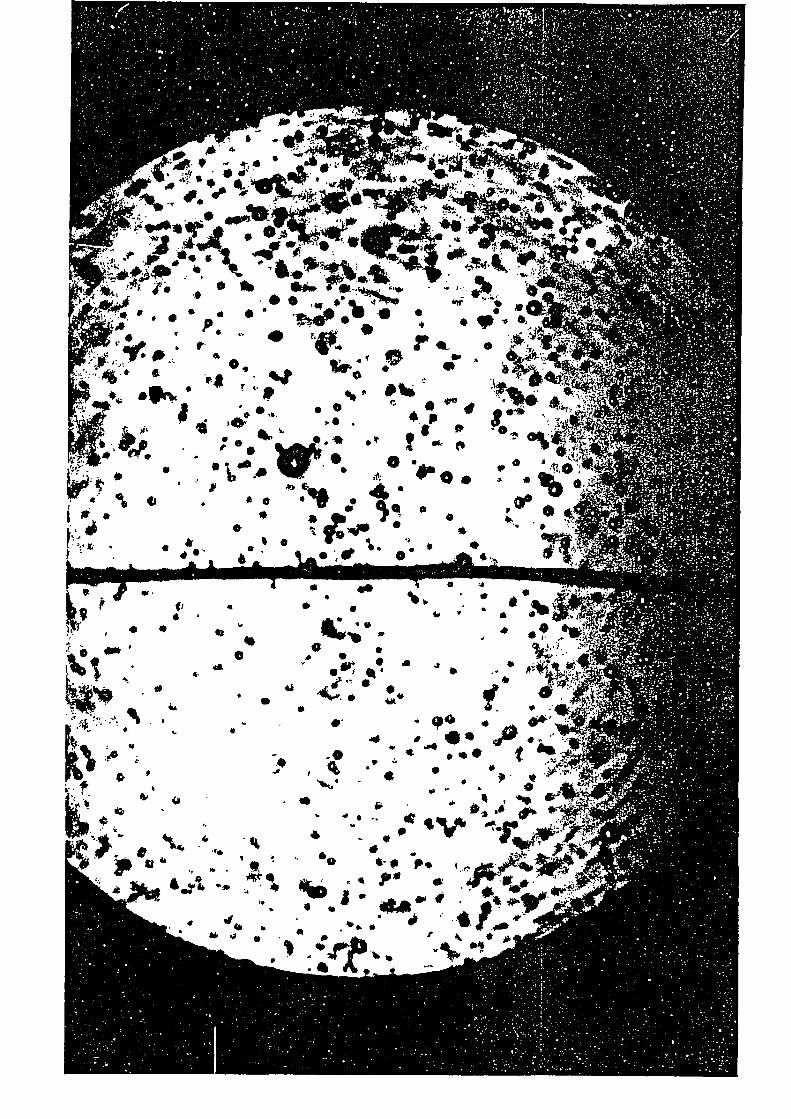
AI ‘1,
•n 44 1= • A 4
4110 416 lir
. lbsir1 4$, f .y. ••• •
tlr;,„ • • 114 114*• 0 , $
* * , • • • • • ,v400 0 e
P . • 4 • . .• , . • L.:
. t . iir4 r41. •
4 ..0,
4 I Ikft w a • .•:-4 jib
IF
0•sit
f 4. ..
C• . 'a •• - . 0 0JO r 0 •
• • 0.* ot t I IPllor '
t • 0, f.
• • 11 410 As W . • ,,e; Iv- 0 •
* 0 *Am
1 A. s fe- •
0• 1 0, 041.1 4 0 e • g. •
* 1 ;Age • 0a •
• ,:. Iv • • 1 • ! • •
16 . 9 • •? • 4 • '•., 0* 0 •
4.
•nri • •
* •
4 111.1V 110 .
V • 0
..r a ell 0 •
1:: 1 4". 4
i• di a
..,4* •
• a at are 0 a 4 6 L. •
... ,i .' • 0
*•
.4i
'IL • • ••• •• tial f
.-f ,,:„.•.,..4% . . .. .- .. 94) •.oil • • • A . ,, •
.,,. . . ....der i. + + 9 4 • 41 • t41 • .:.
$ ar 44 0 • * 0 •
I' • 4 4144,, . •0 P • ••
ok 4.010.. -
n'• 4i. *•
•4‘44 14. 4 .
.....
4
4- e
0.1 4 V °T,. .
V 41 •
•
.• •o 0- 0 P •., . . Ilk • ,:40,
ILA .. ... • *iike • 4
•4r4i i 4 P ' . •
, • 41140 LI. ...
.. ... Vk
• ti •
.if, 4 4. •. 'IP * •
0 .0 0 r• • 4, * A
•
PRESSURE 50 (psi)
LIQUID FLOWRATE 18cc/sec
PHOTOGRAPH 17
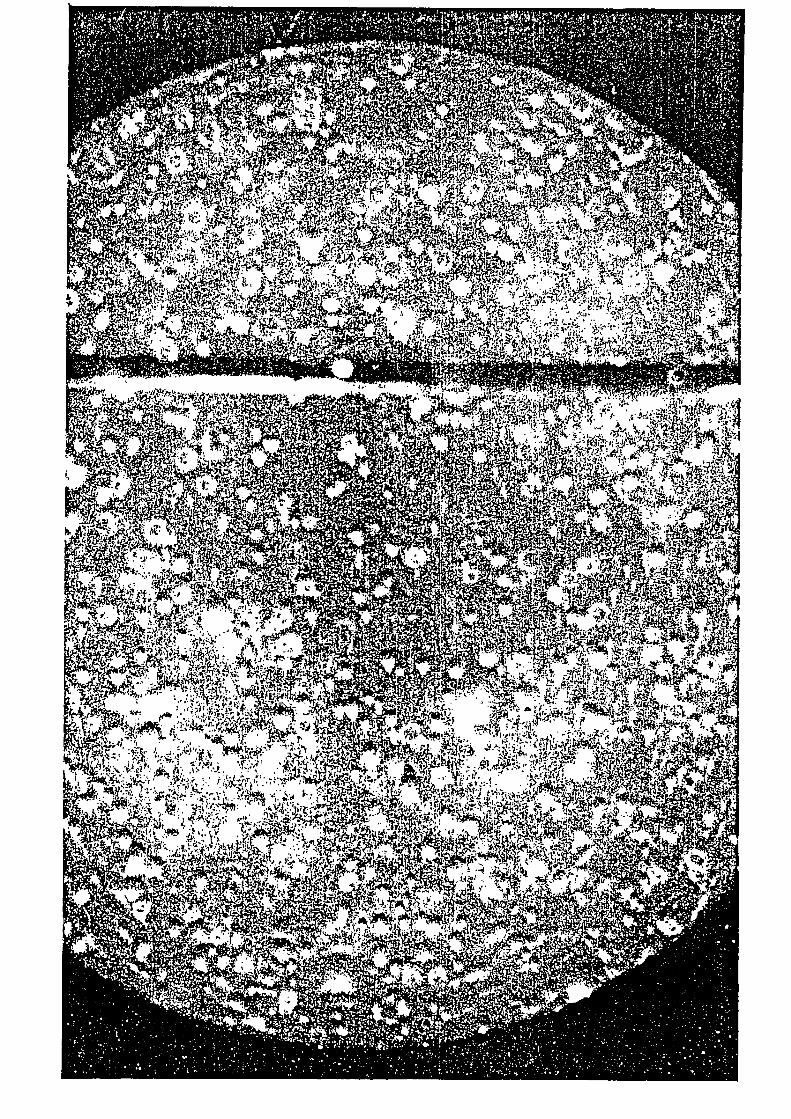

PRESSURE 60 (psi)
LIQUID FLOWRATE 18cc/sec
PHOTOGRAPH 18


1 5
u.
5
00 30 40 50 60 70 80 90 100110120130140150160170180190200
BUBBLE DIAMETER (pm)
41 .4 Aro Arg
Ang , ...41.4.,,4--egArd. at- xiwg „.—.4.Ad zorAze4w. ,A ,44,./,0211 /04 , A ,PA- ,v/wA .40PA /.F.A-zzosAve•
0 30 40 50 60 70 60 00 1001131=01=C 1401501601701801;02Ci:
BUBBLE DIAMETER (pm)
FIG. 30a-30b
134

0 30 40 50 60 70 80 90 100 110 120 130 140 150 160 170 180 190 200
BUBBLE DIAMETER (pm)
30 40 50 60 TO 8C 92 100 110 1 -'0 130 140 150 160 170 180 190 200
BUBBLE DIAMETER (pm)
FIG. 30c-30d
135
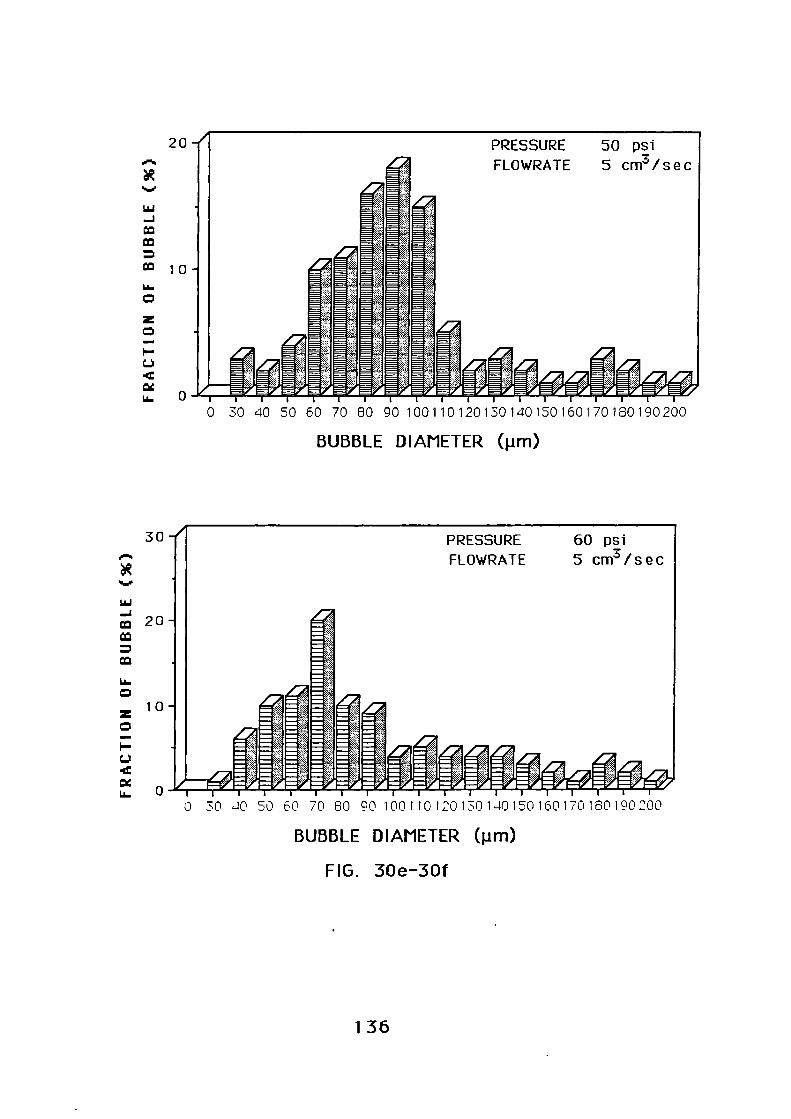
PRESSURE 50 psi
FLOWRATE 5 crn41 s e c
--.
AV : .
, , 1 . 4 /*a go, -02
--.-7.- •
A a
20
30 40 50 60 70 80 90 100 110 120 130 140 150 160 170 180 190 200
BUBBLE DIAMETER (pm)
o 30 40 50 60 70 60 90 100 110 120 130 140 150 160 170 180 190 200
BUBBLE DIAMETER (pm)
FIG. 30e-301
136
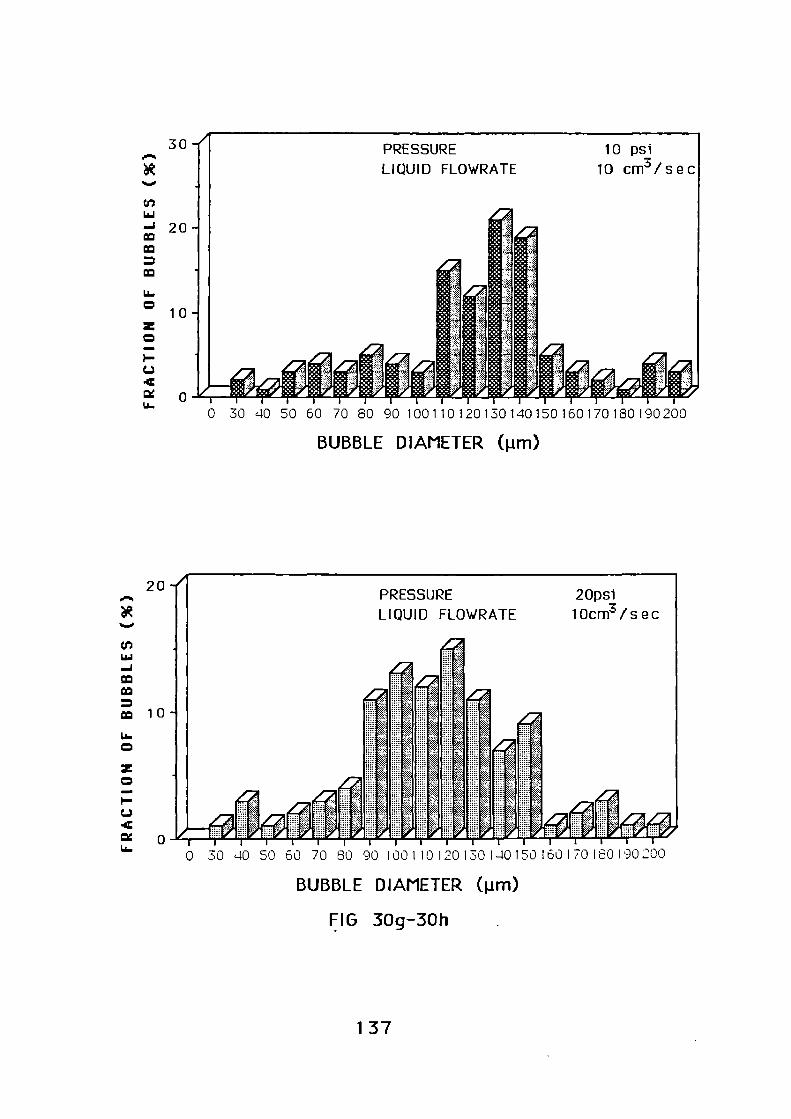
0 30 40 50 60 70 80 90 100 110 120 130 140 150 160 170 180 190 200
BUBBLE DIAMETER (pm)
0 30 40 50 60 70 80 90 100 110 120 130 140 150 160 170 180 l'000
BUBBLE DIAMETER (pm)
FIG 30g-30h .
137
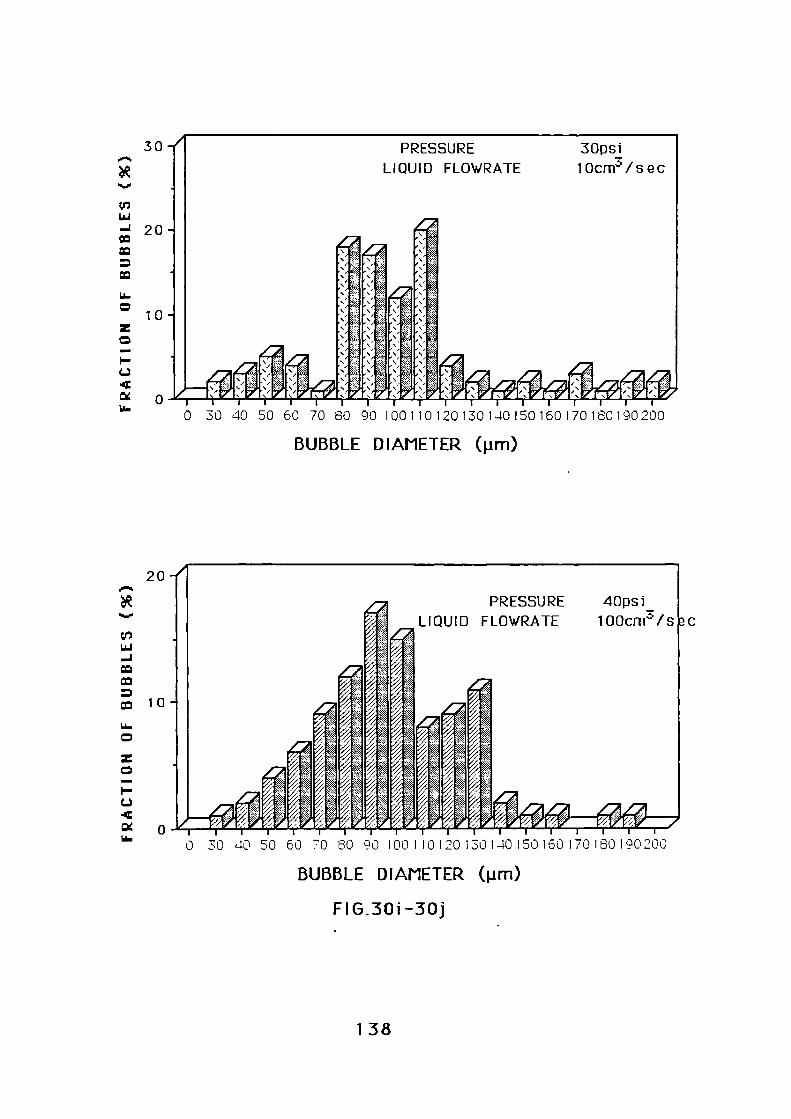
0 30 40 50 60 70 80 90 100 110 120 130 140 150 160 170 180 190 200
BUBBLE DIAMETER (pm)
0 30 40 50 60 70 80 90 100 110 120 130 140 150 160 170 160 190 200
BUBBLE DIAMETER (pm)
FIG.30i-30j
138

0 30 40 50 60 70 80 90 100 110 120 130 140 150 160 170 180 190 200
BUBBLE DIAMETER (pm)
0 3,.? 40 50 50 70 en 90 100110 1'0130 140 150 160 170160190200
BUBBLE DIAMETER (pm)
FIG 30k-301
139

20
PRESSURE
1Cosi
LIQUID FLOWRATE
18 cm/sec
0 30 40 50 60 70 80 90 100110120130140150160170180190200
0 30 40 50 60 70 80 90 100110120130140150160170180190200
4)t
BUBBLE DIAMETER (pm)
BUBBLE DIAMETER (pm)
FIG. 30m-30n
140

0 30 40 50 60 70 80 90 100 110 120 130 140 150 160 170 180 190 200
BUBBLE DIAMETER (pm)
30 40 50 60 70 80 90 100110120130140150160170180190200
BUBBLE DIAMETER (pm)
FIG. 300-30p
141
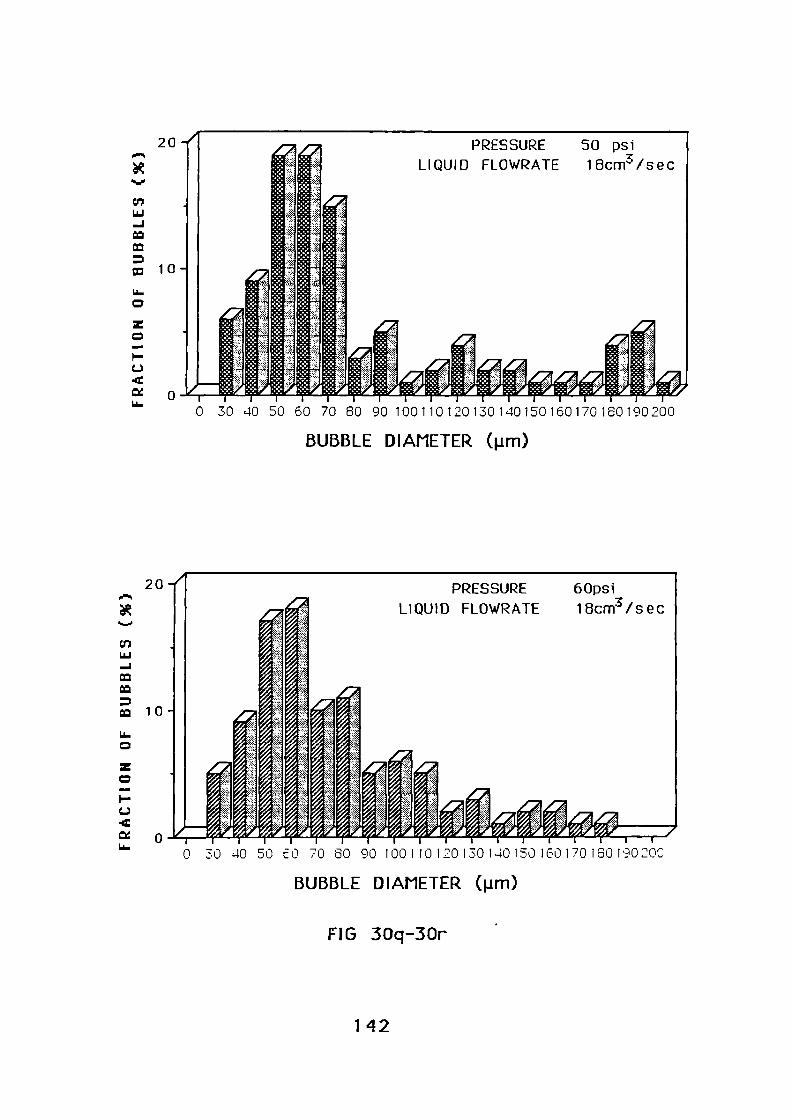
PRESSURE 50 psi
LIQUID FLOWRATE 1 8cm3 /sec
0 30 40 50 60 70 80 90 100 110 120 130 140 150 160 170 160 190 200
X
BUBBLE DIAMETER (pm)
0 30 40 5 E0 70 60 90 100 110 120 130 140 150 160 170 180 190 20C
BUBBLE DIAMETER (pm)
FIG 30q-30r
142
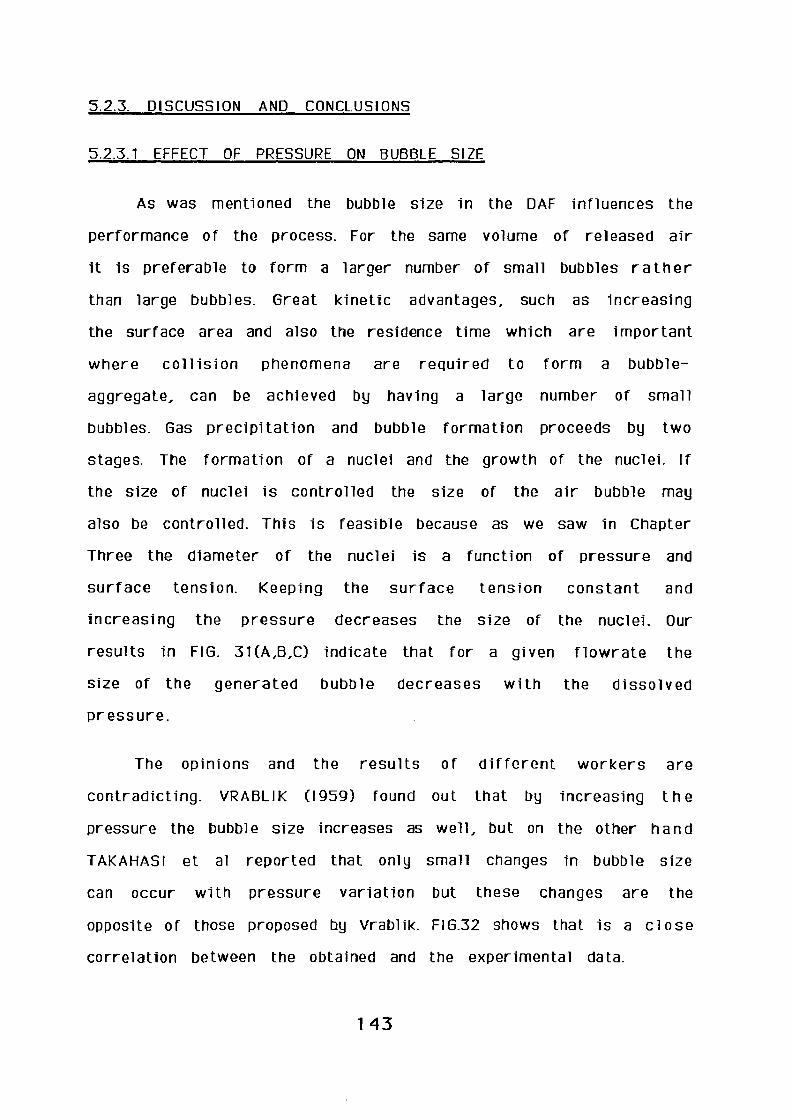
5.2.3. DISCUSSION AND CONCLUSIONS
5.2.3.1 EFFECT OF PRESSURE ON BUBBLE SIZE
As was mentioned the bubble size in the DAF influences the
performance of the process. For the same volume of released air
it is preferable to form a larger number of small bubbles rather
than large bubbles. Great kinetic advantages, such as increasing
the surface area and also the residence time which are important
where collision phenomena are required to form a bubble-
aggregate, can be achieved by having a large number of small
bubbles. Gas precipitation and bubble formation proceeds by two
stages. The formation of a nuclei and the growth of the nuclei. If
the size of nuclei is controlled the size of the air bubble may
also be controlled. This is feasible because as we saw in Chapter
Three the diameter of the nuclei is a function of pressure and
surface tension. Keeping the surface tension constant and
increasing the pressure decreases the size of the nuclei_ Our
results in FIG. 31(A,B,C) indicate that for a given flowrate the
size of the generated bubble decreases with the dissolved
pr essure.
The opinions and the results of different workers are
contradicting. VRABLIK (1959) found out that by increasing the
pressure the bubble size increases as well, but on the other hand
TAKAHASI et al reported that only small changes in bubble size
can occur with pressure variation but these changes are the
opposite of those proposed by Vrablik. F16.32 shows that is a close
correlation between the obtained and the experimental data.
143
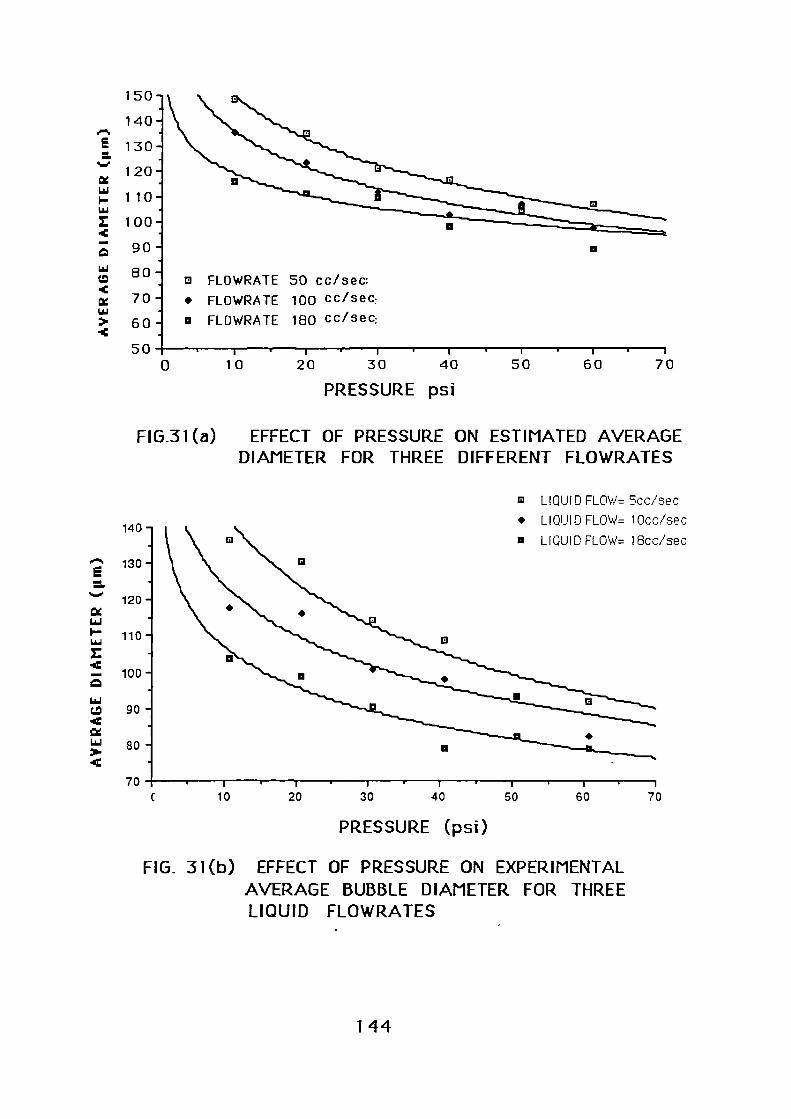
60 70
131 LIQUID FLOW= 5ecisec
• LIQUID FLOW= 1 Occ/sec
• L IQUID FLOW. I 8ccisec
9
10 20 30 40 50 7060
150 —
140:
130:
120:
110:
100:
90
80 :
70
60 -
ci
•FLOWRATE
FLOWRATE
FLOWRATE
50 cc/sec:
100 cc/sec:
180 cc/sec:
5010 20 30 40 50
PRESSURE psi
FIG.31 (a) EFFECT OF PRESSURE ON ESTIMATED AVERAGEDIAMETER FOR THREE DIFFERENT FLOWRATES
PRESSURE (psi)
FIG_ 31(b) EFFECT OF PRESSURE ON EXPERIMENTALAVERAGE BUBBLE DIAMETER FOR THREELIQUID FLOWRATES
144
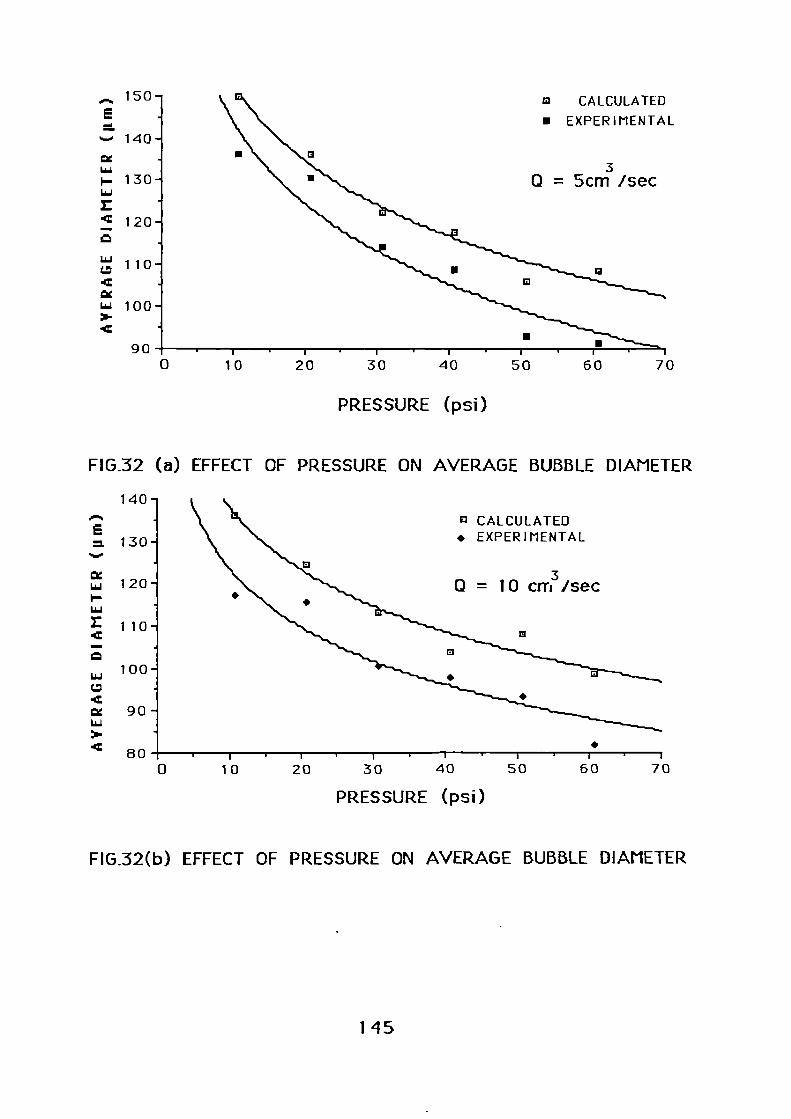
0 10 20 30 40 50 60 70
30 = 5cm /sec
II
CI
.
i i
130 -
120 -
-
110 -
100 -
90 I
9 CALCULATED
• EXPERIMENTAL
1
140 -••••••
Ew. 130-.-.
IXLw 120-I-1.6.1
Z 110-it
2100 -
90 -
BOo
FIG.32 (a) EFFECT
PRESSURE (psi)
OF PRESSURE ON AVERAGE BUBBLE DIAMETER
El CALCULATED• EXPERIMENTAL
0 = 10 cm /sec
.
CI
.
I•
I
I
'
• 1 . t
10 20 30 40 50 610 70
PRESSURE (psi)
FIG.32(b) EFFECT OF PRESSURE ON AVERAGE BUBBLE DIAMETER
145
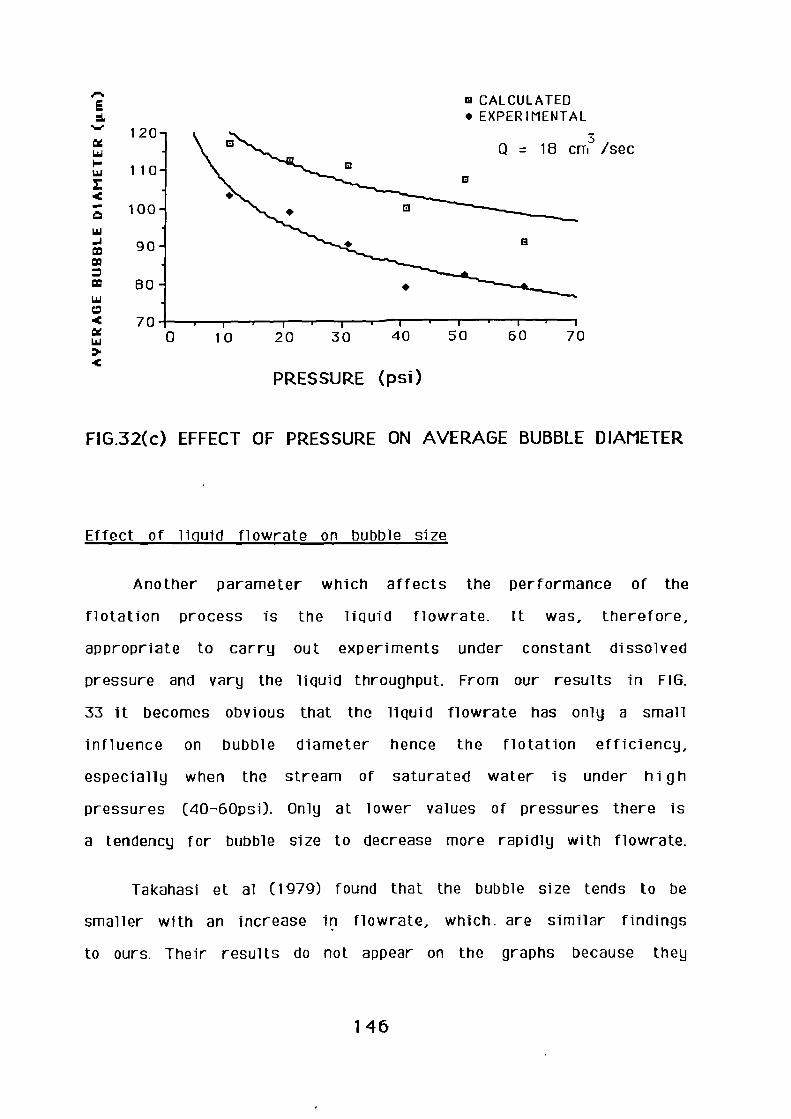
O CALCULATED• EXPERIMENTAL
Q = 18 cm3 /sec
El
B
13
90 -,
BO - •
70 I I . I . I I • I • 1
0
1 0 20 30 40 50 60 70
PRESSURE (psi)
FIG.32(c) EFFECT OF PRESSURE ON AVERAGE BUBBLE DIAMETER
Effect of liquid fl owrate on bubble size
Another parameter which affects the performance of the
flotation process is the liquid flowrate. It was, therefore,
appropriate to carry out experiments under constant di ssolved
pressure and vary the liquid throughput. From our results in FIG.
33 it becomes obvious that the liquid flowrate has only a small
influence on bubble diameter hence the flotation efficiency,
especially when the stream of saturated water is under hi gh
pressures (40-60psa Only at lower values of pressures there is
a tendency for bubble size to decrease more rapidly with flowrate.
Takahasi et al (1979) found that the bubble size tends to be
smaller with an increase in fl ovv rate, which. are similar findings
to ours. Their results do not appear on the graphs because they
1 46
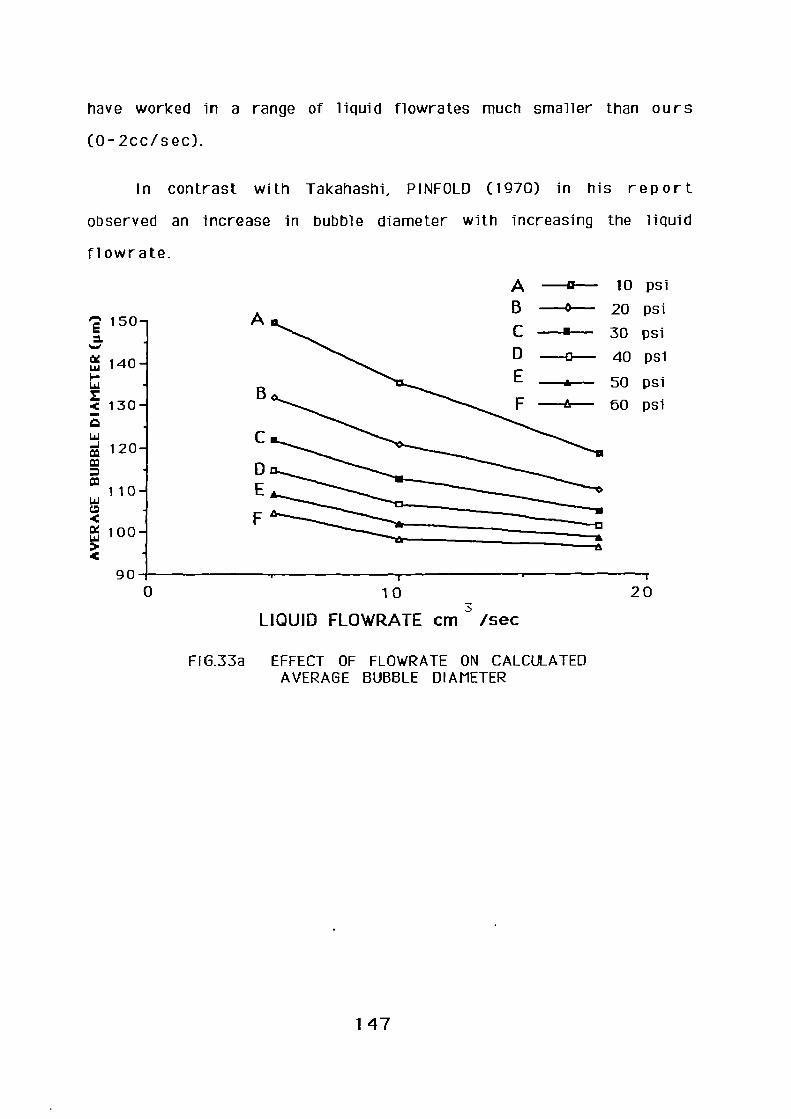
T
10 psi
20 psi
30 psi
40 psi
50 psi
60 psi
have worked in a range of liquid flowrates much smaller than ours
(0- 2cc/sec).
In contrast with Takahashi, PINFOLD (1970) in his report
observed an increase in bubble diameter with increasing the liquid
flowrate.
7 150—=
N•se
cg 140 —1.61
1•••
Lia
.
4 130—ELi.1_J
mmMI
110—wm4eg 100—w><
90 0 10 20
3LIQUID FLOWRATE cm /sec
FIG 33a EFFECT OF FLOWRATE ON CALCULATEDAVERAGE BUBBLE DIAMETER
147

cg
L.61
160
140 —
14.1
120 —
1.61
CO= 100 —
B 0 —
60
A 10 psi
B --0-- 20 psi
30i
D-0— 40 psi
50 psi
F -6- 60 psi
0
10
20
3
LIQUID FLOWRATE cm /sec
FIG.33b EFFECT OF FLOWRATE ON EXPERIMENTALAVERAGE BUBBLE DIAMETER
Derivation of an equation relating pressure with bubble
numbers
Obviously the number of bubbles per unit volume will have a
strong influence on flotation efficiency thus the number of bubbles
was estimated from our experimental results using Eq. 56. These
results are shown in the log-scale plot. In FIG.34. A log-scale
plot was chosen because a linear scale produce a wide spread and
an attempt to generate a design equation was made. It is obvious
that the effect of pressure is important and that the number o f
bubbles per cm 3 increases as we increase the pressure. The liquid
flowrate seems to play an unimportant role. , As has been revealed
through out our analysis, the pressure is the variable which most
148

affects the bubble size. At this point it is important to derive an
empirical equation which will relate the number of the formed
bubbles and the imposed pressure. With the help of regression
analysis from FIG. 34 we derived that the equation for the line of
best fit is:
Nb = a * Pc[71]
where : a=175
c= 1 .64
P= pressure (psi)
N b= number of bubbles /cm3
This equation can be a useful guide in applications where a
certain amount of bubbles of a known diameter would be important
for the subsequent removal of particles of a known size.
149

1067
a
1 0 5 -:.
1 0 4 -: a
'
1 0 3 / (,1 0 1
PRESSURE (psi)
FIG 34 EFFECT OF PRESSURE ON THE NUMBER OF BUBBLES
Effect of pressure on the uniformity of bubbles
Another important parameter for good flotation is the uniformity of
bubble sizes.
In our literature survey Section (3.2.2.3) an index which
describes the uniformity of the bubbles. (Eq.58). In our
experiments this index was calculated and plotted in FIG.35(a,b)
against the pressure and liquid flowrate respectively. It is clear
that at large pressures and high flowrates, the uniformity of
bubbles is better. The pressure is evident and it is also clear that
the liquid flowrate plays a lesser role. The value of the index
1 0 2
150

5 -
— o— Q = 5cc /sec
—.-- 0= 10 cc /sec
— 61— 0= 18 CC /s e c)e 4-wC:z
1 I 1 1 1 1 1 1
decreased and reached a limited value when at high pressure
causing the generation of bubbles with a more uniform size.
0 10 20 30 40 50 60 70
PRESSURE (psi)
FIG.35(a) EFFECT OF PRESSURE ON THE UNIFORMITY INDEX
151

5
10 psi A
20 psi g30 psi c
40 psi D50 psi
60 psi
-..-..0-.A
B
C
D
E
F
-di-EF
NOES
1 I • I
0 10 20
FLOWRATE cc /sec
FIG.35( b) EFFECT OF FLOWRATE ON THE UNIFORMITY INDEX
5_3 HYDRODYNAMIC STUDIES
It is clear from the Higee studies that high volumes of
supersaturated liquid can be produced and, provided the bubbles
can be nucleated, this should provide a useful way of ensuring a
better distribution of the liquid and any associated bubbles than
the conventional high velocity single nozzle system.
Since the bubble size and the flow patterns into flotation
tank is an important issue, a computer fluid dynamic package
;FLUENT", was adapted to study the following.
a) Flow patterns with experimental nozzle.
152
b) Flow patterns with multi-nozzle configuration.
FLUENT has been useful in modelling the complex of bubble
trajectories encountered in flotation processes. The programme
uses finite difference numerical procedures to solve Navi er-
Stokes. Equations, governing fluid flow. The numerical technique
involves the subdivision of domain of interest into a finite number
of control volumes and cells to obtain the set of simultaneous
algebraic relation. Due to non linearity and the interdependence of
the differential equation, an iterative procedure had to be adapted.
The number of iterations depended upon the complexity of the
initial conditions and boundary conditions.
The package was limited to 2251 finite elements nodes which
is the product of the cells of the co-ordinates. To develop the
geometry of the flotation tank having a narrow inlet of order of
mm it was necessary to use a modified version having its upper
limit of 40000 nodes. By changes in the actual package routines
the distribution of number of modes for x-y-z co-ordinates were
41-11-13 respectively.
5.3.1 Single experimental nozzle
Fig.36 shows a simulated tank with the same dimensions as
the flotation tank in our experiments. The inlet nozzle and t h e
outlet pipe are also shown_ F1g.37 shows the v-velocity vectors of
a stream of water saturated. with air entering the tank through the
nozzle which had the same diameter as ours. Fig.38-39-40 are the
153
cross sections of the v-velocity in the 8th plane namely near in
front of the nozzle, (10cm), 5th plane in the middle of the tank
(35cm from the nozzle) and 2nd plane close to outlet respectively
(80 cm from the nozzle).
5.3.2 Multi nozzle sustem
Alternatively Fig.41 shows a simulated tank with the same
dimensions as ours but having this time 4 inlets along one side
each having the same diameter with our experimental nozzle but as
the throughput is the same, the velocity vectors are smaller than
in the single nozzle case.
Fig.42 represents the vectors of velocity throughout the
vessel and FIG. 43-44-45 show the cross sections of v-velocity in
the same planes as in FIG.38-39-40.
5.3.3 Analusis and conclusions
From FIG. 37 and 42 the vectors of the jet velocity seem t o
have the highest values as they enter the vessel as expected
however, they remain constant until the jet hits the opposite wall.
In case where there is one nozzle in the tank, there seem to be
stagnant points close to the corners while in the multi nozzle
system the velocity vectors distributed uniformly in the tank. The
minimum and maximum values in m/sec are given in the
corresponding graphs. As we examine the contours of v-velocity in
the 8th plane which is close to the inlet area in the single nozzle
system, we can observe, that the bubbles tend to move
perpendicular to the flow.(FIG.38). In the case of multi-nozzle
154

system a more uniformly contoured picture is revealed.(FIG.43)
The picture changes in the middle of the domain where in the four
nozzle system a larger number of bubbles have tend in a circular
motion_ This area seems to be effected by turbulence for both
systems. Finally in the 2nd plane, the one, furthest away from the
inlet area the contours of u-velocity were examined. With the
single experimental nozzle, the stream enters the basin, reaches
its maximum velocity at the far wall, it hits on the wall and as a
result the bubbles move in all directions. The multi-nozzle system
appears to be more uniform as the bubbles move along the bottom
and side walls of the basin.
The distribution of the velocities was shown in colour on the
monitor. But this can not be seen clearly from the printed graphs.
As we have observed the maximum velocities are appeared in the
centre of the domain for both the nozzle systems and the lowest
are close to the walls.
The minus sign of velocity also, which appears in FIG. 38-
39-40-43-44-45 means that the v or u-velocity that moment is
opposite to the direction in which the jet stream enters the vessel
through the nozzle vessel
The above data conclusively, shows that a better distribution
of u an v velocities achieved using a multi-nozzle system. The
lack of stagnant points and the uniform distribution of the
contours of the velocity throughout the basin are the basic
features of the multi-nozzle system.
155
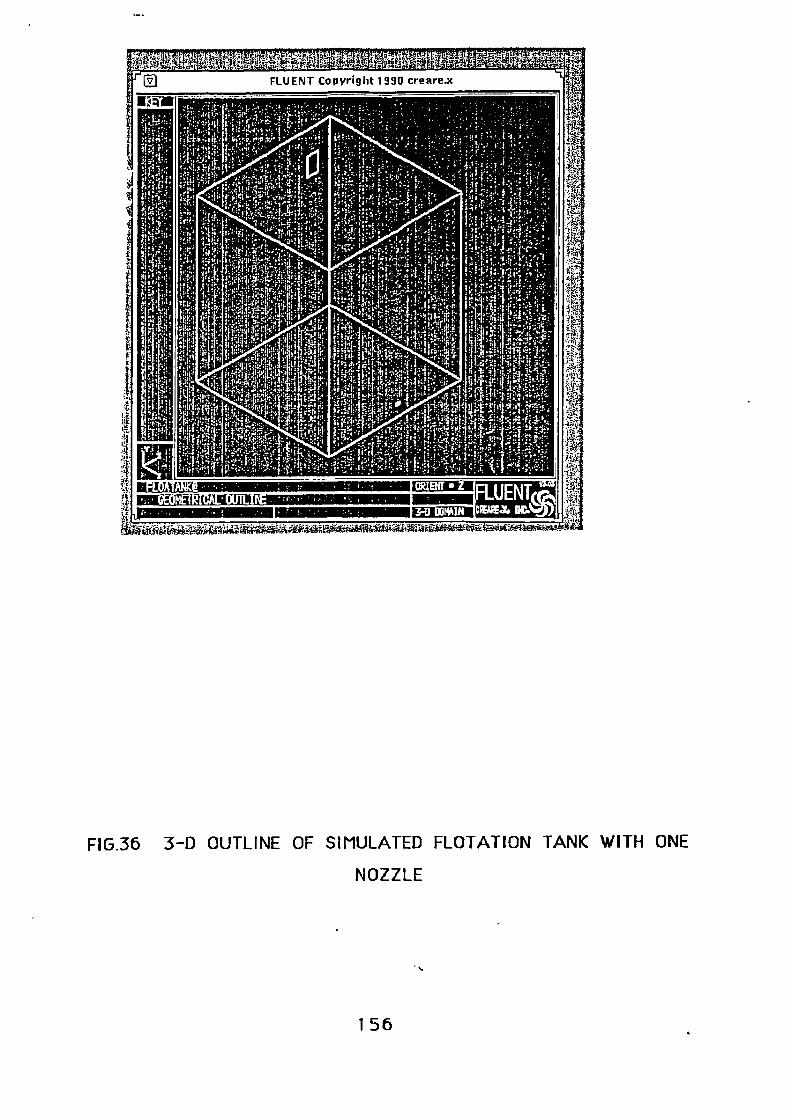
RalafilajlOIEIEMMIMIFIMEMMEEMII.M
11151F0;11;14INW:14101111G 1111=1111111111a1M111111111141,
AigigiMitaligWiteseitaiowaciagauilzufaufragita4simuomak,wgil
ORIENT • Z
3-0 OONAIN
11:411111
FIG.36 3-0 OUTLINE OF SIMULATED FLOTATION TANK WITH ONE
NOZZLE
156

nagainRSV: ti-AT*111TAff fekT14 MENNENjraficium
FIG.37 DISTRIBUTION OF VELOCITIES VECTORS IN A
SIMULATED TANK WITH ONE NOZZLE
157
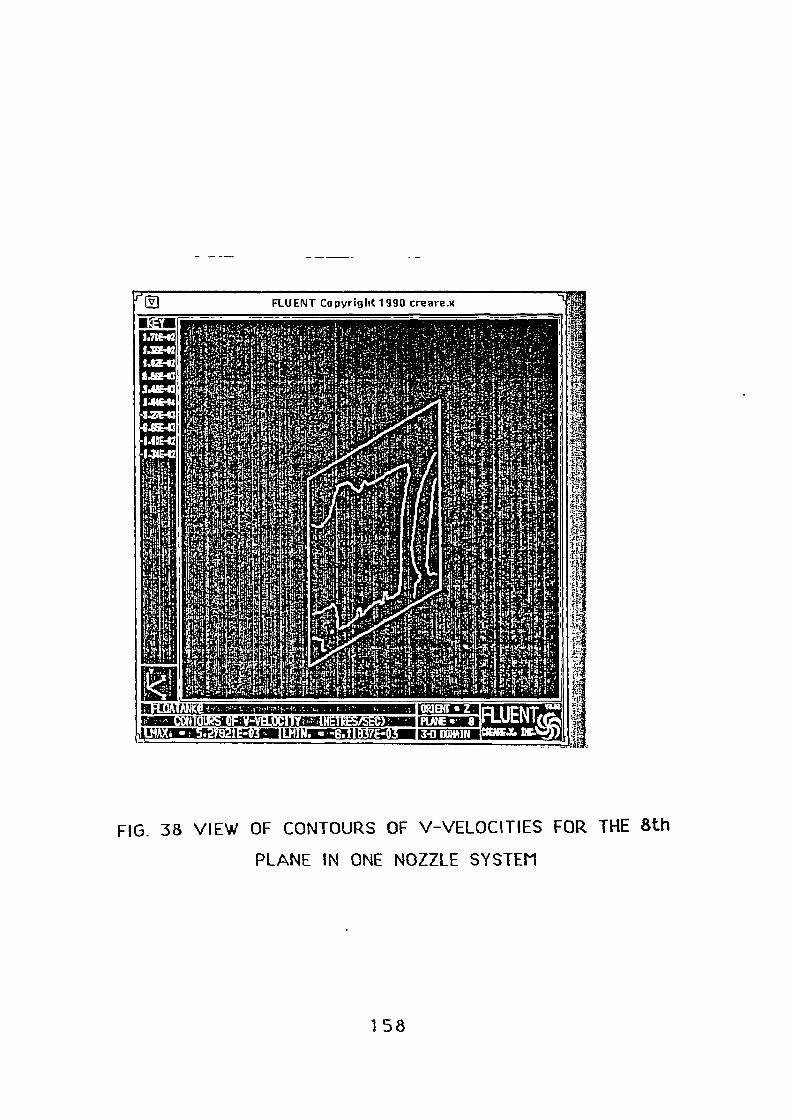
FLUENT Copyright 1990 creare.x
/.71)E42
LIE42
LIZE4/2
ILISEE43
3641E43
1.14E44
•.27E43
44E43
-1.11E-a-144E42
•tt
417
gukammourimussgammusiumml01151105: n1 (;14 !T:::ftzi ;raffia
DA1311,-ftWr-4 I :nail 11 ;) CPCIIVI I tiffITIMII
FLUIttgicTi."1,ORIEtff • Z
PLA1E 'B. 8
341 IXI4A1N
FIG. 38 VIEW OF CONTOURS OF V-VELOCITIES FOR THE 8th
PLANE IN ONE NOZZLE SYSTEM
158
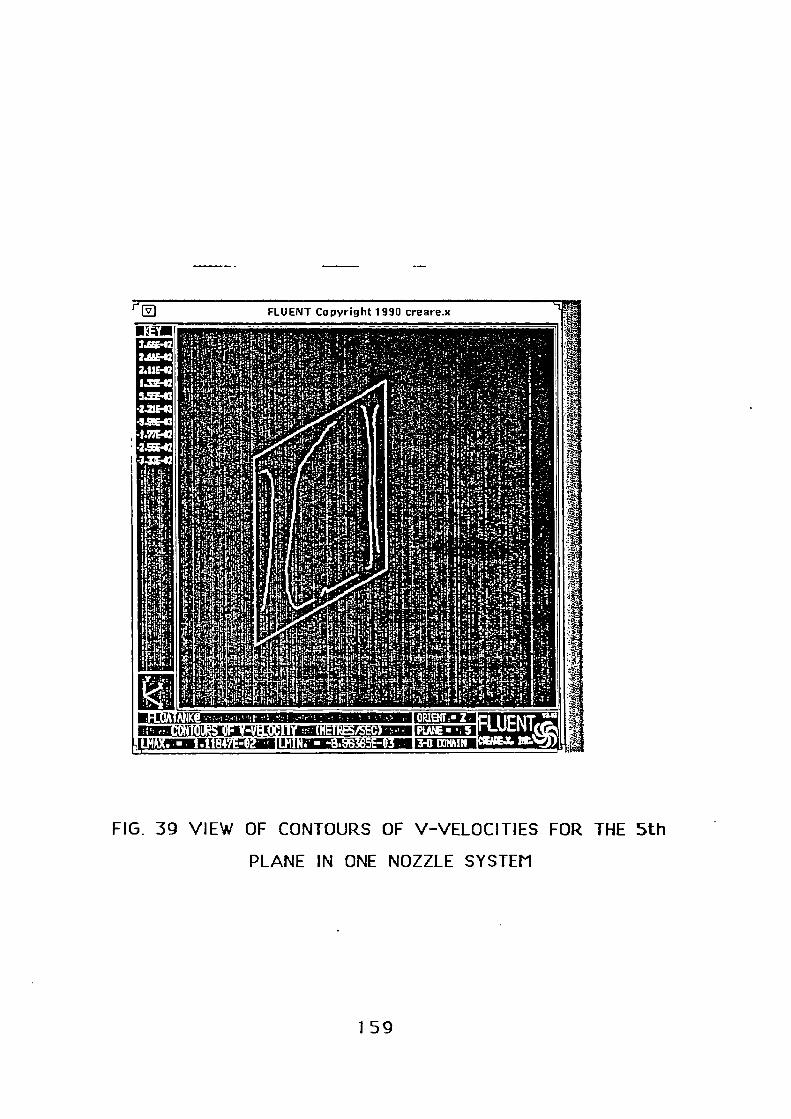
F. V FLUENT Copyright 1990 creare.x
.141113.661-122452422.115421.13E-C!5.52-C
4.21E43-LE-S31.77E-E
-2.55E42-14242
.1? •
FLUENTORIEN1 t • ZiSZKiiCa[11:-Alia:Vg0.13 tilIEVIAIN:W4UIREA
1 V 7 - 11;11:NEIVE37::=I2111PLME 53-0 DOMAIN
FIG. 39 VIEW OF CONTOURS OF V-VELOCITIES FOR THE 5th
PLANE IN ONE NOZZLE SYSTEM
159
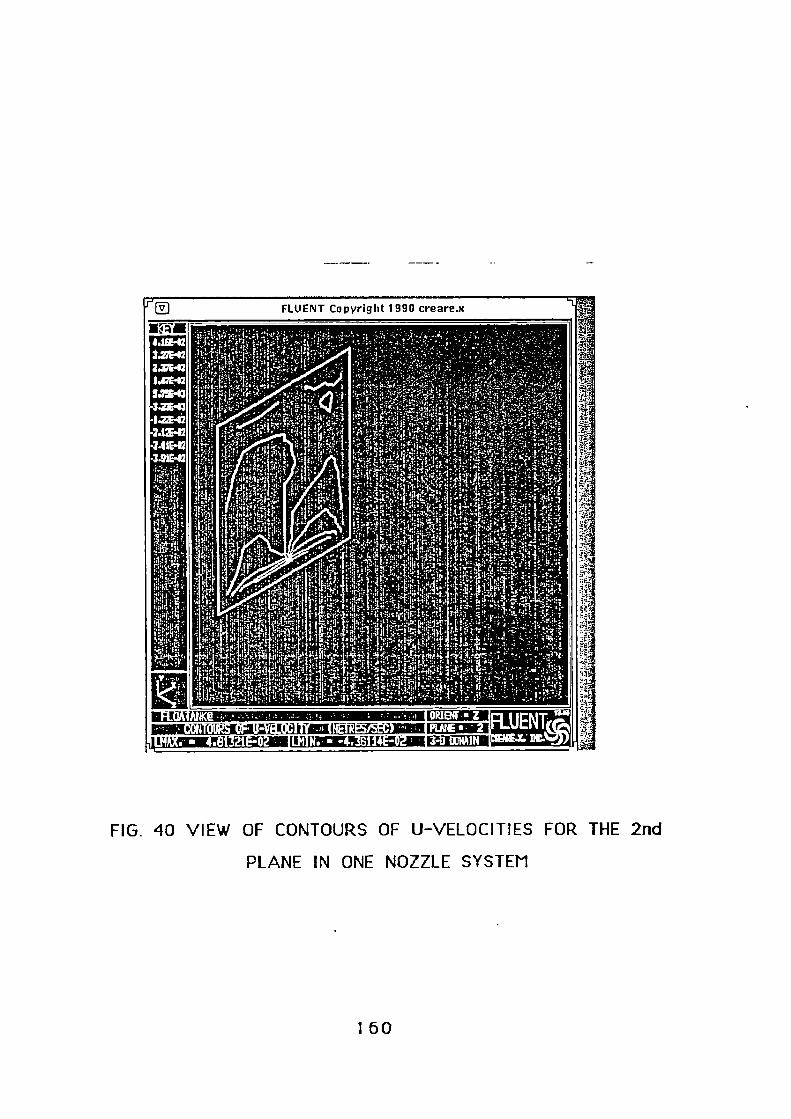
FLUENT Copyright 1990 creare.x
11:41114.11E42227E422XE42142E425.7243
•3471E13-I.ZE42.242E42441E42-19243
• If
mommuzfAiguaKofini';1 uriccEricitili11111
FLUENTClEAILX: DC.
ORIENT • ZPLANE 2 ' 23.11 IONA INiii;rxramr
FIG. 40 VIEW OF CONTOURS OF U-VELOCITIES FOR THE 2nd
PLANE IN ONE NOZZLE SYSTEM
160

FIG.41 3-D OUTLINE OF. SIMULATED FLOTATION TANK WITH
FOUR NOZZLE
161
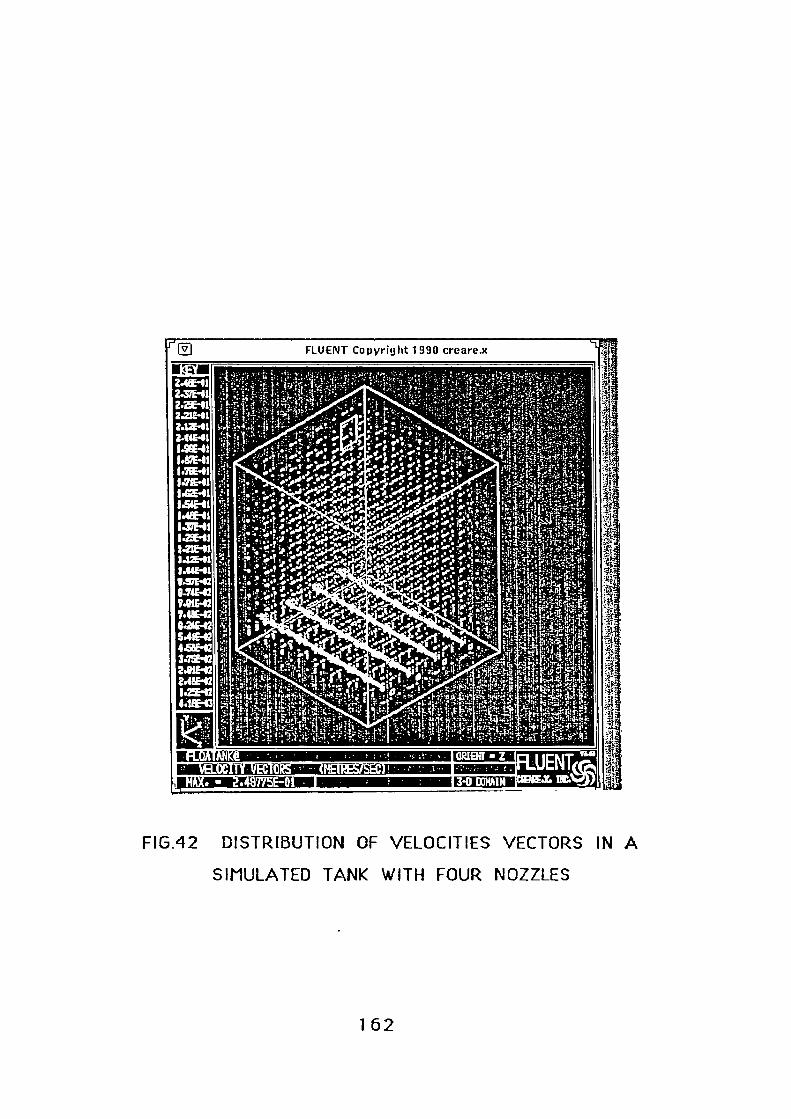
FLUENT Copyright 1990 creare.x
2.4E42.37542.21E4221E4242E4244E4
.912445E4.70E4.71E41E2E4ZAN.424.22E423E4.224421444E4
1.57E42O.71E429.91E42744E4211.24E425.41E424.91E423.75E•C241E42241E4/14242441E43
' OT MK@ ORM • ZfiN-111Wilita$1-'i7;511111119111111111
11,TSMICEINEr: 4Y.f011111111 341 DOKAIN
FIG.42 DISTRIBUTION OF VELOCITIES VECTORS IN A
SIMULATED TANK WITH FOUR NOZZLES
162
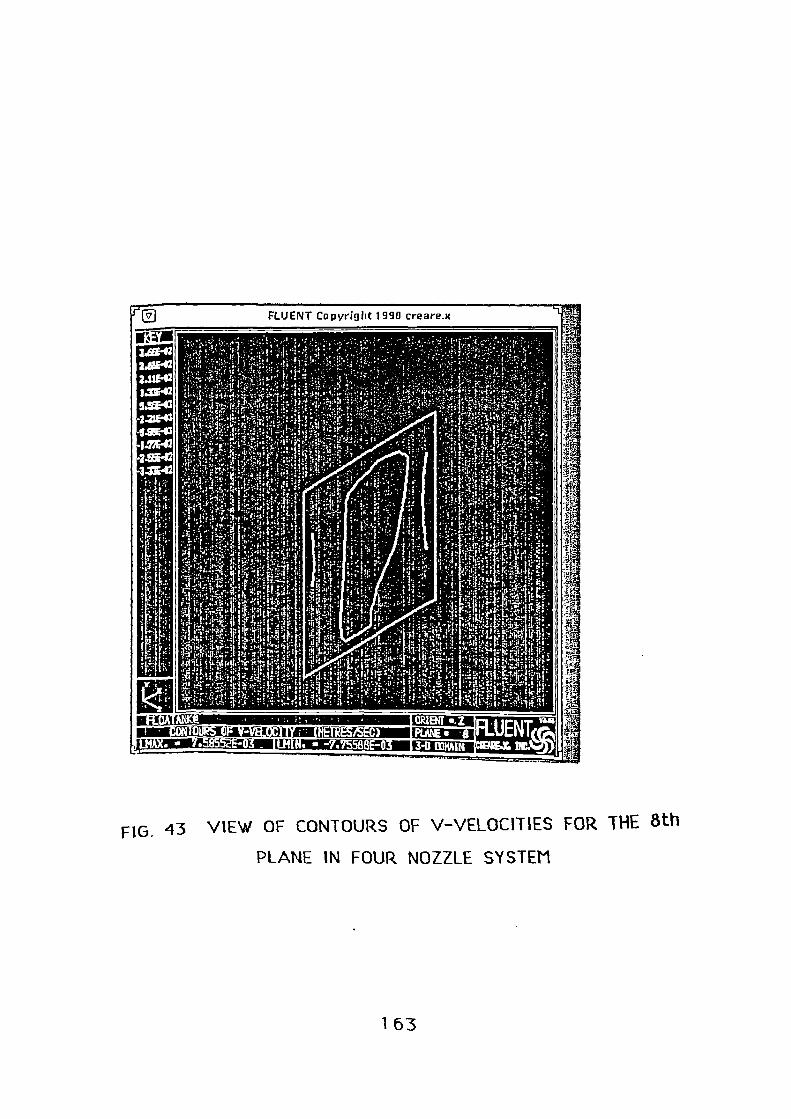
FLUENT Copyright 1990 creare.x
FIG. 43 VIEW OF CONTOURS OF V-VELOCITIES FOR THE 8th
PLANE IN FOUR NOZZLE SYSTEM
163

FLUENT Copyright 1990 creare.x
1. - ANKe11112111 0CCINIAPIallTAKI:9 killillAt:iWz.14111111/1
,CEME111215ttigtrill/111;11;PIEIVUZINItHEMIFLUENTORI13ff • Z
RAE * 5
3-0 0011,11N
FIG. 44 VIEW OF CONTOURS OF V-VELOCITIES FOR THE 5th
PLANE IN FOUR NOZZLE SYSTEM
164
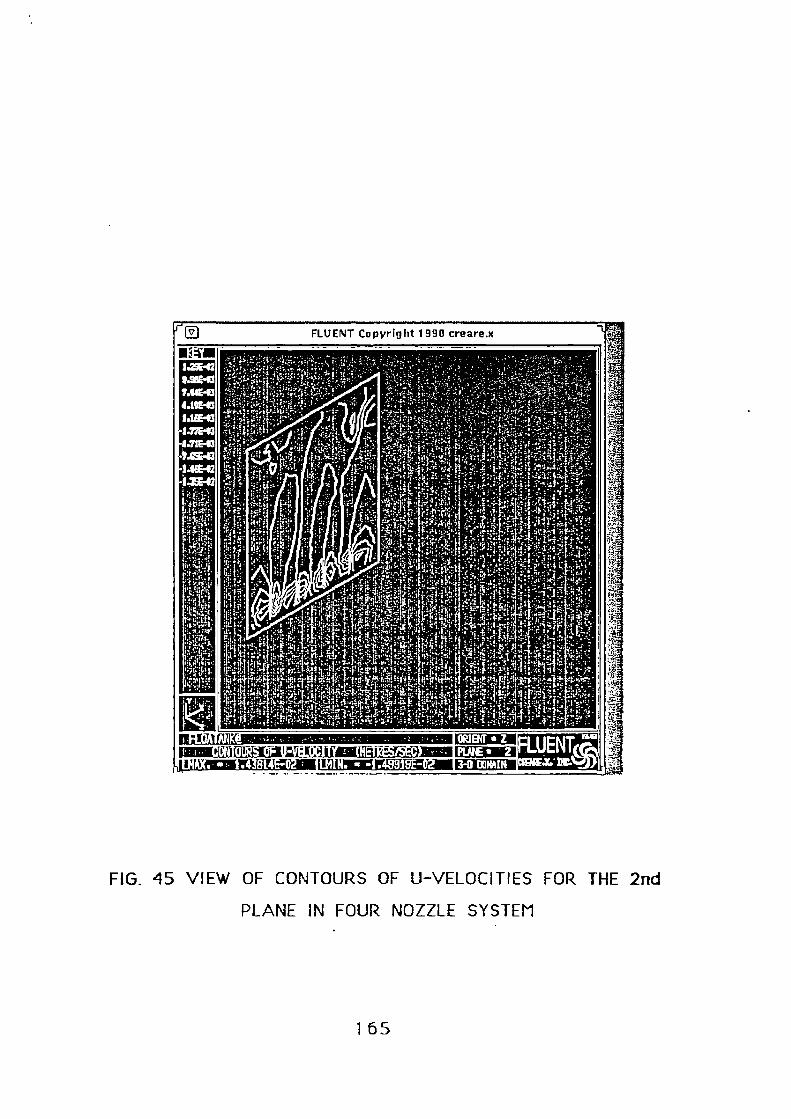
r' FLUENT Copyright 1990 creare.x
NAM11.2EC—C11.91C-07.11E-C14.111E-C11.11E-C
1.77E-C1-1.71E-134.0:641.112E-C1 4542
•
OR1BT • ZPLA1E • 23-0 ICIVIIN
rigiumanzmurismziammum.MIK a 1111A11121V1! kr.4 IA/EWA
I ; DAM PEW 'MIME UPICC PE gIRICIMIIIFLUENTCIVIC • DC.
FIG_ 45 VIEW OF CONTOURS OF U-VELOCITIES FOR THE 2nd
PLANE IN FOUR NOZZLE SYSTEM
165
CHAPTER 6
CONCLUSIONS
6.1 Conventional saturation sustem
1) Using the conventional saturator the obtained values of
released air practically obeyed Henrys Law.
2) In conventional systems a better uniformity of bubble size is
achieved with high pressures and a high liquid throughput.
3) An increase in pressure decreases the size of the generated
bubbles in the conventional saturator. The size of bubbles
produced in a conventional saturator varies in between 75-120p.m.
4) The effect of liquid flowrates on bubbles sizes in the
conventional systems seems to be unimportant for low values but
it becomes slightly significant when applying higher liquid
flowrates by causing a decrease in the bubble size.
5) An empirical correlation between number of generated bubbles
per cm's and applied pressure was derived as:
N b = a * Pc
The effect of liquid flowrate on this was not large,
therefore it did not appear in the correlation. This equation could
be useful for designing flotation tanks.
166

6.2 Hiqee Saturator results
6) In the Higee Absorber the effect of packing was found not to be
beneficial at low liquid flowrates (<1000cc/sec) and high
gas/liquid ratios (>10). Under these operating conditions a very
high degree of saturation was found.
7) When compared at the low flowrate conditions, in the Hi gee
Absorber, we can achieve a higher degree of saturation at lower
pressures compared with the conventional saturator.
8) The effect of pressure (linked to rotational speed) is not
marked in the Higee Saturator and in particular at low throughputs
the degree of saturation is higher than Henry's Law and remains
constant with the pressure. It is clear from this result that
supersaturati on is occuring.
9) Bubbles were not observed in the saturated solution coming
from the Higee system.
10) The effect of the thickness of a packing was investigated for
high liquid throughputs. When a thin packing is used in conjunction
with the Higee Absorber, there is a slight increase in the degree
of the absorption of air due to reduced back-mixing within the
packing.
167

6.3 Hudrodunamic Studies
11) From the simulation graphs it is obvious that a multi-nozzle
system dramatically performs in a better way than the single
nozzle system due to the fact that the bubbles disperse over a
wider spectrum.
12) The vectors of the velocity stream in the one nozzle system
appeared larger than in the multi nozzle system where the bubble
path seemed not to disturb the homogeneity of the system.
168
CHAPTER 7
RECOMMENDATIONS FOR FUTURE WORK
1) By using more advanced bubble size and bubble movement
techniques we will be able to more accurately observe the main
factors which are fundamental to understand the hydrodynamics of
the flotation process. These include:
a) Measurement of the number density of the generated bubbles
which will enable the validity of the derived correlation to be
confirmed.
b) The motion of the bubbles in the flotation tank can be
correlated against the FLUENT models and thus a better
understanding of the regimes by which bubbles move in tanks can
be obtained and eventually better tank design achieved.
Knowing the velocity of formed bubbles will allow designs
which reduce turbulence in systems where fragile flocs appear.
2) More results should be obtained using the Higee absorber.
Throughout our research the Hi gee rotary saturator seems to
operate better than the conventional system as far as the better
level of saturation which can be achieved. In order to utilize this
169

high degree of saturation a better technique of removing the fluid
from the system should be developed which would result in full
utilization of the above system by allowing the bubbles to be
generated at 1 atmosphere which is the pressure of the liquid at
the outlet end.
3) With the aid of the simulation model there is a vast field of
exploration available examining different designs of flotation
tanks and nozzle structure. Different gases can also be introduced
and there is a great scope for investigating the effects of their
properties. Finally, bubbles at different sizes could be introduced
and examined in order to evaluate the optimum flotation
performance.
170

CHAPTER 8
REFERENCES
1) ADVANCED STUDY INSTITUTE
"The scientific Basis of Flotation"
Proc., N.A.T.O., Cambridge U.K., 5-16 July, (1982).
2) APLAN F.F.
"Flotation", Ch. in "Encycl. of Chem. Tech.", Kirk-Othmer, (eds.), vol.9, J. Wiley and sons, U.S.A. (1966)
"Flotation", Ch. in "Handbook of Separation Techniques for ChemicalEngineers", P.A. Schweitzer, (ed.), Mc-Graw Hill, N.York, (1979).
3) ASTARITA G. & SAVAGE D.
"Gas treating with chemical solvents"
John Wiley and Sons, New York, (1983)
4) AZBEL D.
"Two phase flow in chemical engineering"
Cambridge University Press ,pp161, (1981)
5) BALASUNDARAM V. & PORTER J.E.
Department of Chemical and Process Engineering,
The University of Newcastle Upon Tyne, England, 1990, (Privatecommunication).
6) BELL C.
Ph.D. Thesis
University of Newcastle Upon Tyne, (1975)
7) BENZINGR.J. & MYERS J.E.
"Low frequency bubble formation at horizontal circular orifices"
Ind. Eng. Chem. 48, 2087, (1955)

8) BIESINGER M.G. & VINING T.S.
"Industrial Experience with Dissolved Air Flotation"
Ind. Waste Conf. (1974)
9) BISWAS A.
"The role of Carbon Dioxide in flotation of carbonate minerals"
Indian Journal Tech. 15, 6, 187, (1967).
10) BRATBY J.
"Aspects of sludge thickening by Dissolved Air Flotation"
Water Pollution, 421, (1978)
11) BRATBY J. & MARAIS G.V.R.
"Saturator Performance in Dissolved Air Flotation"
Water Res., 9, 929, (1975)
12) BUREAU OF MINES
**Mineral Facts and problems"
Bulletin 667, U.S.A., (1975)
13) BURFITT M.
-The performance of full-scale Sludge flotation plant"
Water Pollution Control, 474, (1975)
14) BUSEV A.I. & IVANOV V.N.
"Analytical Chemistry of Rear Elements"
Mir. Publ., Moscow, (1981)
15) CALDERBANK P.N.
"Gas liquid contacting on plates"
Trans. Inst. Chem. Eng. 34, 79, (1956)
16) CASSEL A.E. & KAUFMAN K.M.
"The effects of size on microflotation"
Water research, 9 1017, (1975)
17) CLARK A .N. & WILSON D.J.
"Foam Flotation-Theory and Applications"
N. Dekker, N.York, (1983)
18) COLLI NS G.L. & JAMESON G.J.
Chem. Eng. sc., 31,985, (1976)
19) CONWAY A. & NELSON R.
"High-solubility gas Flotation"
Journal of WPFC, 53, 1199, (1981)
20) DANCKWERTS P.V. & SHARNA II.
"The absorption of Carbon Dioxide into solutions of Alkalis andAmi nes"
The Chemical Engineers, (1966)
21) DAVIDSON L. & AMI CK E.H.
"Formation of gas bubbles at horizontal orifices"
A.Lch.E. Journal, 2, No 3, 337, (1956)
22) DAVIDSON J.F. & SCHULER B.O.G.
"Bubble formation at an orifice in a viscous liquid"
Trans. Inst. Chem. Eng. 38 144, (1960)
23) DAVIDSON J.F. & SCHULER 8.0.6.
"Bubble formation at an orifice in an inviscid liquid"
Trans. Inst. Chem. Eng. 38, 335, (1960)
24) DICK R.I.
"Sludge Treatment"
"Physicochemical Processes for Water Quality Control"
Weber W.J., (ed.), ch. 12 559, Wiley I nterscience, Toronto, (1972).
25) EVERSOL W.G. & WA GNER G.H. & STACKHOUSE E.
"Rapid formation of gas bubbles in liquids"
Industrial Eng. Chem. 33 No 11, 1459, (1941)
26) FLINT L.R. & HOWARTH W.J.
Chem. Eng. Sc., 26, 1155, (1971)
27) FUERSTENAU D.W. (ed.)
"Froth Flotation", 50th A nni v., AIME., N. York, (1962)
28) FUKUI Y. & YUU S.
"Measurement of the charge on small gas bubbles"
A I ChE Journal 28, 866,( 1982)
29) GADD IS E.S. & VOGELPOHL A.
"Bubble formation in quiescent liquids under constant flow conditions"
Chem. Eng. Sc., 41, 97, (1986)
30) GEHR R. & HENRY J.G.
a) "Laboratory Techniques for Evaluating Batch Flotation of ActivatedSludge"
Proc. 11th Canadian Symp., Water Pollution Research in Canada (1976).
b) **Measuring and predicting flotation performance"
Journal of WPCF, pp 203, February (1978)
31) HUGHES R.R. & HANDLOS A.A.
The formation of bubbles at simple orifices"
Chem. Eng. Progr. 51 557, (1955)
32) JACKSON R.
"The formation and coalescence of bubbles and drops in liquids"
The Chem. Eng., 107, May (1964)
33) KARGER BL
"Nomenclature Recommendations for Adsorptive bubble separationme thod"
Sep.Sci., 2, 401, (1967)
34) KATT! S. & LANGE! TT B.
"Development of a simulator for commercial absorption based on masstransfer rate approach"
65th Annual Convection Gas Processors Association, San Antonio, Texas,
35) KHURANA A.K. & KUMAR R.
-Studies in bubble formation III"
Chem. Eng. Sci. a. 1711, (1969)
36) KIRK R.E. & OTHMER D.F.
Encyclopedia of Chemical Technology, 6, 597, (1951)
37) KITCHENER J.A.
Seminar, "Technologically Important Aspects of Interface S ci en ce-,Imperial College of Sci. and Techn., London, June 27-July 1, (1983).
38) KLASSEN V.I. & MOKROUSOV
"An introduction to theory of Flotation-
Butterworths, London, (1963)
39) KUMAR. R. & KULOOR N.R
"Bubble formation in viscous liquids under constant flow conditions"
The Canadian Journal of Chem. Eng. 48, 383, (1970)
40) KUMAR R. & KULOOR R.
-The formation of bubbles and drops"
Advanced in chemical Engineering, 8 256, (1972)
41) LANAUZE R.D. & HARRIS I.J.
"A note on gas bubble formation"
Chem Eng. Sci. 29 1663, (1974)
42) LEIBSON I. & HOLCOMB E.G. & CACOSO A.G.
"Rate of flow and mechanics of bubbles formation from singlesubmerged orifices"
A.I.ch.E. Journal, 2, No 3, 296, (1956)
43) LEML I CH R.
"A dsorpi ve Bubble Separati an Techniques"
Academic Press, New York (1972)

44) LEVENSPI EL 0.
"Chemical Reaction Engineering"
Wiley Int. Ed. (1972)
45) LEWIS D.A. & DAVIDSON J.F.
"Bubble sizes produced by shear and turbulence in a bubble column"
Chem. Eng. Sci. 38, 161, (1983)
46) MARAIS G.v.R.
"Dissolved Air Flotation-art evaluation of inter-relationships betweenProcess variables and their optimisation for design"
Water S.A. 1, 57, (1975)
47) MARMUR A. & RUBIN E.
"A theoretical model for bubble formation at an orifice submerged inav inviscid liquid"
Chem. Eng. Sci. 31, 453, (1976)
48) MARTIN M.J.J.
"Dissolved Air Flotation- An Alternative Method to Solids/LiquidSeparation.", Water Trt. Jour. Refocus, (1974)
49) MATIS K.A.
a) Ph.D. Thesis, University of Newcastle Upon Tyne, (1977)
b) Chem. Chron., 44 54, May 1979
c) Chem. Chron., 46, 27, March 1981
50) McCAN D.J. & PRINCE R.G.H.
"Regimes of bubbling at submerged orifice"
Chem. Eng. Sci. 26, 1505, (1971)
51) NEMEROW N.L.
"Industrial Water Pollution"
Addisn-Wesley, U.S.A., (1971)
52) PINFOLD T.A
Sep.sci. 5, 379, (1970)
53) PLAKSIN I.N.
**Interaction of minerals with gases and reagents in the flotation"
Trans. AIME 214, 319, (1959)
54) RAMAKRISHNAN S. & KUMAR. R. & KULOOR N.R.
"Studies in bubble formation I under constant flow conditions"
Chem. Eng. Sci. 24, 731, (1969)
55) RAMIREZ R.ERNEST
-Comparative physicochemical study of industrial wastewater treatmentby electrolytic, dispersed air and dissolved air flotation technologies"
Proceedings of the 31st Industrial Water Conference, PurdueUniversity (1976)
56) PEA'? D. & RATCLIFF G.A
a) Can. J. of Chem. Eng.,
b) Can. J. of Chem. Eng.,
51,
53,
2,178,
481,
(1973)
(1975)
57) RUFF K.
Chem. Ing.Technik., 4 8, 759, (1976)
58) SARDAR S. & WEILAND R.H.
-A non equilibrium stage approach for the design and simulation of gastreating units"
Annual Meeting, A.I.Ch.E. San Fransisco, (1984)
59) SEBBA F.
- Ion flotation"
Elsevier Publications, N. York, (1962)
60) SHANNON W.T. & BUSSON D.H.
-Dissolved Air Flotation in Hot Water"
Water Research 14, 759, (1980)
61) SHERWOOD T.K. & DI GFORD R.L.
"Mass transfer"
McGraw-Hill, New York, (1975)
62) SUTHERLAND K.L & WARK I.W.
"Principles of flotation"
Austr. Inst. Min_ & Metal. (1955)
63) TAKAHASHI T. & MI VAHARA
-Fundamental studies of bubble formation in Dissolved Air PressureFl otation''
Journal of Chem. Eng. of Japan, 12, 275, (1979)
64) UNNO H. & INOE I.
-Size reduction of bubbles by orifice mixer"
Chem. Eng. Sci. 35, 1571, (1980)
65) VAN KREVELEN D.W. & HOFTIJZER P.J.
-Studies of gas bubbles formation. Calculation of interfacial area inbubble contactors
Chem Eng. Progr. 46, No 1, 29, (1950)
66) VESILIND P.A.
•*Treatment and Disposal of Wastewater Sludges"
An. Arbor Sciences, (Publishers), (1974)
67) VRABLIK E.R.
-Fundamental Principles of Dissolved Air Flotation of IndustrialWastes"
Proceedings of the 14th Purdue Industrial Waste Conference, 743—779, (1959)
68) WARD C.A. & BALAKRISHNAN F.
Trans. ASME, J.Basic Eng. 695, (1970)
69) WRAITH A.E.
-Two stages bubble growth at a submerged plate orifice."
Chem. Eng. Sci. 26,1659, (1971)
70) LABEL F.THOMAS & MELBOURNE J.D.
FLOTATION

"Developments in water treatment, Vol.1, p. 139-191 London (1980)

APPENDIX I
RESULTS OF BUBBLES SIZE MEASUREMENT FOR DIFFERENT PRESSURE AND LIQUID FLOWRATES
Operating conditions: Conventional saturator, Tap water
The following Tables give the number of bubbles which havecount for three different liquid flowrates

TABLE 1.1
LIQUID FLOWRATE 5 cc/sec
PRESSURE (psi)
10 20 30 40 50 60
No OF PHOTOGRAPH
1 2 3 4 5 6
BUBBLE DIAMETER NUMBER OF BUBBLES(pm)
30 1 1 1 2 3 140 3 2 1 1 2 650 2 2 2 2 4 1060 3 1 1 1 10 1170 2 1 2 1 11 2080 7 2 2 15 16 10g o 6 2 10 13 18 9100 7 1 24 17 15 4110 5 5 21 14 5 5120 4 14 13 15 2 4130 3 25 a 4 3 4140 2 20 1 1 2 4150 11 14 2 5 1 3160 10 3 4 2 1 2170 12 3 2 3 3 1180 9 2 3 2 2 3190 a 1 2 1 1 2200 5 1 1 1 1 1

TABLE 1.2
LIQUID FLOWRATE 10 cc/sec
PRESSURE (psi)
10 20 30 40 50 60
No OF PHOTOGRAPH
7 8 9 10 11 12
BUBBLE DIAMETER NUMBER OF BUBBLES(pm)
30 2 1 2 1 2 640 1 3 3 2 4 750 3 1 5 4 6 1060 4 2 4 6 11 1570 3 3 1 9 13 1780 5 4 18 12 12 1190 4 11 17 17 17 8100 3 13 12 15 9 6110 15 12 20 a a 6120 12 15 4 9 2 2130 21 11 2 11 1 3140 19 7 1 2 4 1150 5 9 2 1 3 1160 3 1 1 1 2 2170 2 2 3 o 1 1180 1 3 1 1 1 2190 4 1 2 o 2 1200 3 1 2 0 2 1

TABLE L3
LIQUID FLOWRATE 18 cc/sec
PRESSURE (psi)
10 20 30 40 50 60
No OF PHOTOGRAPH
13 14 15 16 17 18
BUBBLE DIAMETER(pm)
30 4
NUMBER
3
OF BUBBLES
2 7 6 540 4 2 5 a g 950 3 5 22 18 19 1760 4 4 10 20 19 1870 2 18 10 14 15 1080 17 14 8 4 3 11g o 15 12 6 4 5 5100 13 9 5 5 1 6110 7 7 10 5 2 5120 6 2 3 1 4 2130 4 5 4 2 2 3140 5 3 2 1 2 1150 5 6 2 1 1 2160 4 4 1 3 1 2170 2 2 2 3 1 1180 1 2 2 2 4 1190 2 1 3 1 5 0200 2 1 3 1 1 0

APPENDIX 2
RESULTS OF CALCULATED AND OBSERVED AVERAGE BUBBLE DIAMETER FOR DIFFERENT PRESSURES
Operating conditions Tap water, Conventional saturator
The following Tables give the calculated and theobserved value of the average bubble diameter f ordifferent liquid flowrates.
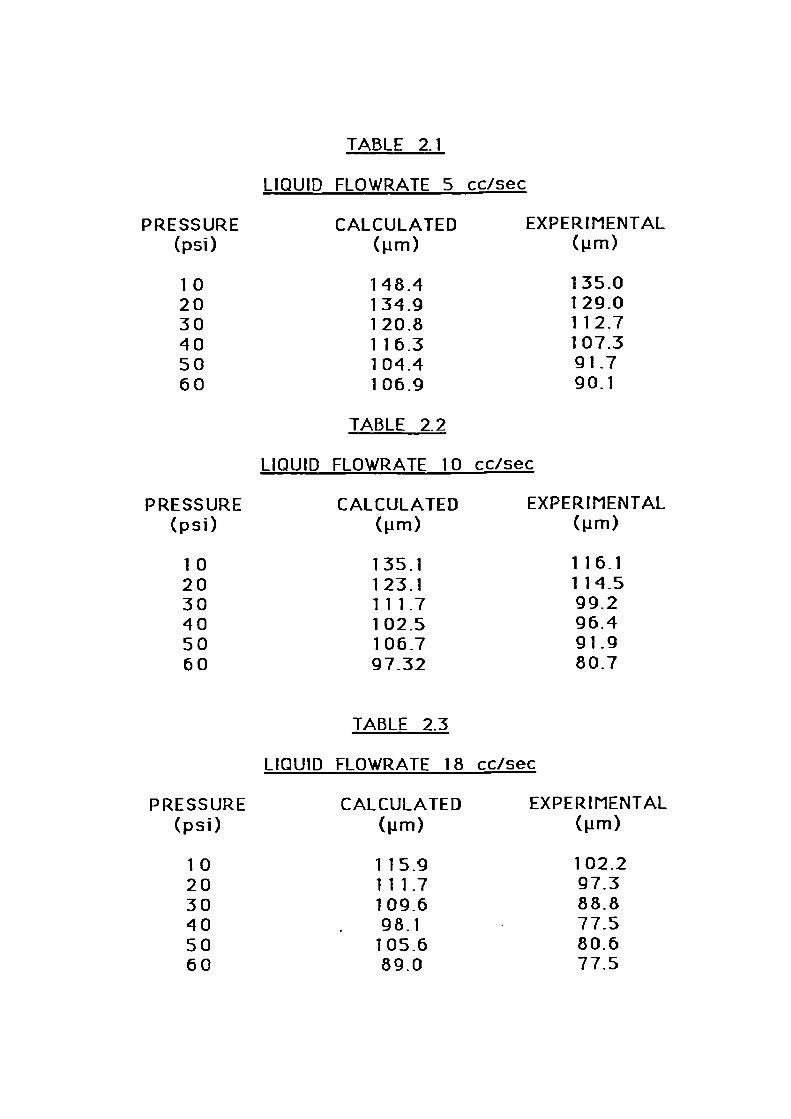
TABLE 2.1
LIQUID FLOWRATE 5 cc/sec
PRESSURE(psi)
CALCULATED(gm)
EXPERIMENTAL(pm)
10 148.4 135.020 134.9 129_030 120.8 112.740 116.3 107.350 104.4 91.760 106.9 90.1
TABLE 2.2
LIQUID FLOWRATE 10 cc/sec
PRESSURE(psi)
CALCULATED(gm)
EXPERIMENTAL(Pm)
10 135.1 116.120 123.1 114_530 111.7 99.240 102.5 96.450 106.7 91.960 97.32 80.7
TABLE 2.3
LIQUID FLOWRATE 18 cc/sec
PRESSURE CALCULATED EXPERIMENTAL(psi) (11m) (11m)
10 115.9 102.220 111.7 97.330 109.6 88.840 98.1 77.550 105.6 80.660 89.0 77.5

APPENDIX 3
OBTAINED RESULTS USING THE HIGEE ROTATING DISK UNDER DIFFERENT CONDITIONS
In the following tables are listed the results which wereobtained using the Higee rotating disk under different gasflowrates, liquid flowrates, pressures and packings.
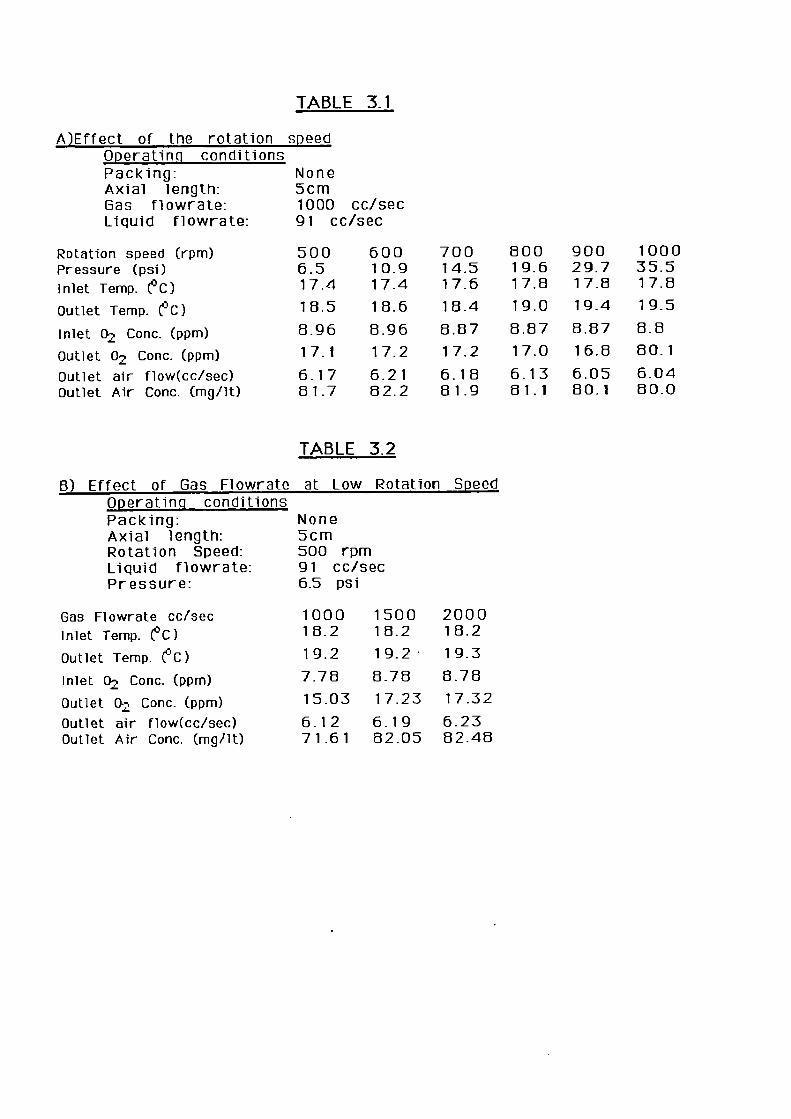
TABLE 3.1
A)Effect of the rotation speed Operating conditions Packing: NoneAxial length: 5cmGas flowrate: 1000 cc/secLiquid flowrate: 91 cc/sec
Rotation speed (rpm) 500 600 700 800 900 1000Pressure (psi) 6.5 10.9 14.5 19.6 29.7 35.5
Inlet Temp. (°C) 17.4 17.4 17.6 17.8 17.8 17.8
cOutlet Temp. ( IC) 18.5 18.6 18.4 19.0 19.4 19.5
Inlet 0.7. Conc. (PPrn) 8.96 8.96 8.87 8.87 8.87 8.8
Outlet 0-7. Conc. (ppm) 17.1 17.2 17.2 17.0 16.8 80.1
Outlet air flow(cc/sec) 6.17 6.21 6.18 6.13 6.05 6.04Outlet Air Conc. (mg/it) 81.7 82.2 81.9 81.1 80.1 80.0
TABLE 3.2
B) Effect of Gas Flowrate at Low Rotation Speed Operating conditions Packing: NoneAxial length: 5cmRotation Speed: 500 rpmLiquid flowrate: 91 cc/secPressure: 6.5 psi
Gas Flowrate cc/sec 1000 1500 2000Inlet Temp. (°C) 18.2 18.2 18.2
Outlet Temp. (°C) 19.2 19.2 • 19.3
Inlet 0-7. Conc. (ppm) 7.78 8.78 8.78
Outlet 0•, Conc. (ppm) 15.03 17.23 17.32
Outlet air flow(cc/sec) 6.12 6.19 6.23Outlet Air Conc. (mg/lt) 71.61 82.05 82.48

TABLE 3.3
C) Effect of Gas flowrate at High Rotation SpeedOperating conditions Packing: NoneAxial length: 5cmRotation Speed: 1000 rpmLiquid flowrate: 91 cc/secPressure: 35.5 psi
Inlet Temp. (°C) 18.4 18.4200018.4
Outlet Temp. C-C) 18.8 19.7 19.8
Inlet 0, Conc. (ppm) 8.74 8.74 8.74
Outlet G? Conc. (ppm) 16.46 16.6 16.68
Otlet air flow (cc/sec) 5.92 5.94 5.99Outlet Air Conc. (mg/10 78.4 76.07 79.42
TABLE 3.4
13) Effect of Rotation SpeedOperating conditions Packing:
Thick DECLONAxial length:
5cmLiquid flowrate:
147 cc/secGas flowrate:
1000 cc/sec
Rotation speed (rpm) 500 600 700 800 900 1000Pressure (psi) 6.5 10.9 14.5 19.6 29.7 35.5Inlet Temp. (1."'N 16.2 16.2 16.2 16.4 16.4 16.4
Outlet Temp. Cc) 16.9 17.4 17.6 17.8 17.8 15. 1
Inlet (}7. Conc. (ppm) 8.9 8.9 8.9 8.86 8.26 8.26
Outlet 02 Conc. (PPrn) 16.38 16.07 16.20 15.94 15.29 15.19
Outlet air flow (cc/sec) 5.89 5.78 5.82 5.73 5.50 5.46Outlet Air Conc. (mg/10 78.02 76.53 77.13 75.9 72.81 72.35
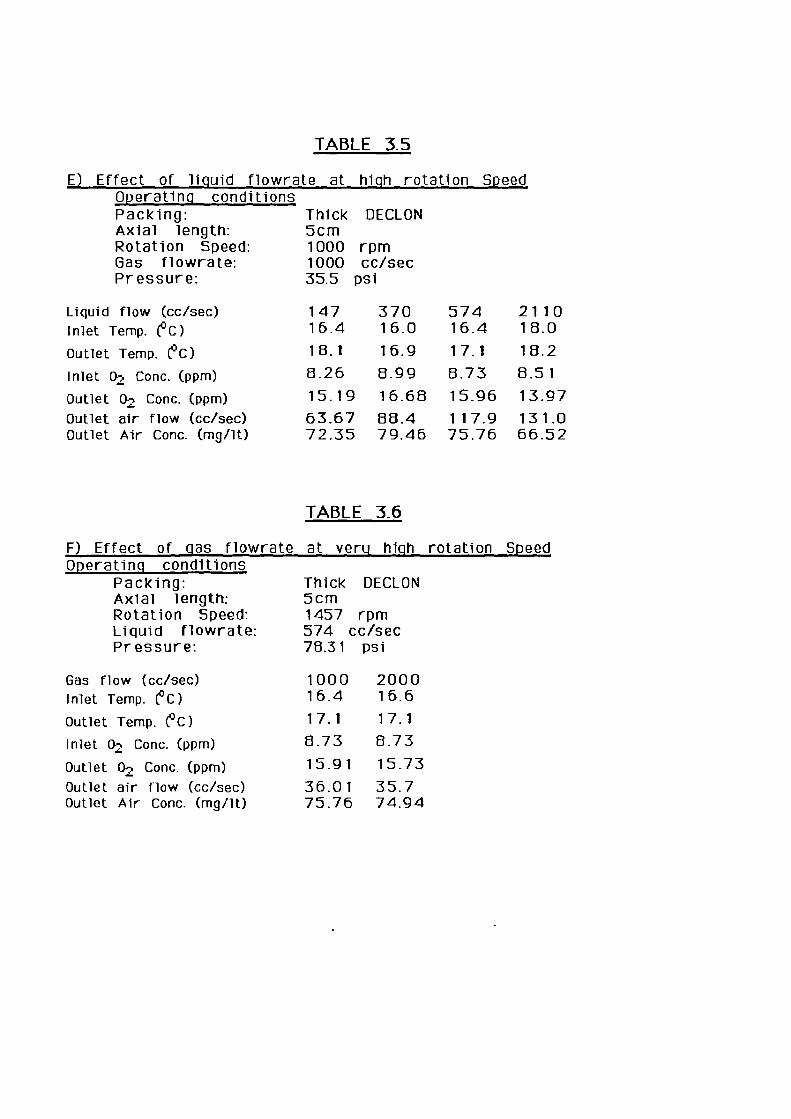
TABLE 3.5
E) Effect of liquid flowrate at high rotation SpeedOperating conditions
Thick DECLON5cm
Packing:Axial length:Rotation Speed: 1000 rpmGas flowrate: 1000 cc/secPressure: 35.5 psi
Liquid flow (cc/sec) 147 370 574 2110Inlet Temp. (°C) 16.4 16.0 16.4 18.0
Outlet Temp. (°C) 18.1 16.9 17.1 18.2
Inlet 02 Conc. (OPrn) 8.26 8.99 8.73 8.51
Outlet 02 Conc. (PPrn) 15.19 16.68 15.96 13.97
Outlet air flow (cc/sec) 63.67 88.4 117.9 131.0Outlet Air Conc. (mg/lt) 72.35 79.46 75.76 66.52
TABLE 3.6
F) Effect of gas flowrate at veru high rotation Speed Operating conditions
Packing: Thick DECLONAxial length: 5cmRotation Speed: 1457 rpmLiquid flowrate: 574 cc/secPressure: 78.31 psi
Gas flow (cc/sec)
1000 2000Inlet Temp. (°C)
16.4 16.6
Outlet Temp. (1)C)
17.1 17.1
Inlet 02 Conc. (ppm)
8.73 8.73
Outlet 0-, Conc. (ppm) 15.91 15.73
Outlet air flow (cc/sec) 36.01 35.7Outlet Air Conc. (mg/it) 75.76 74.94
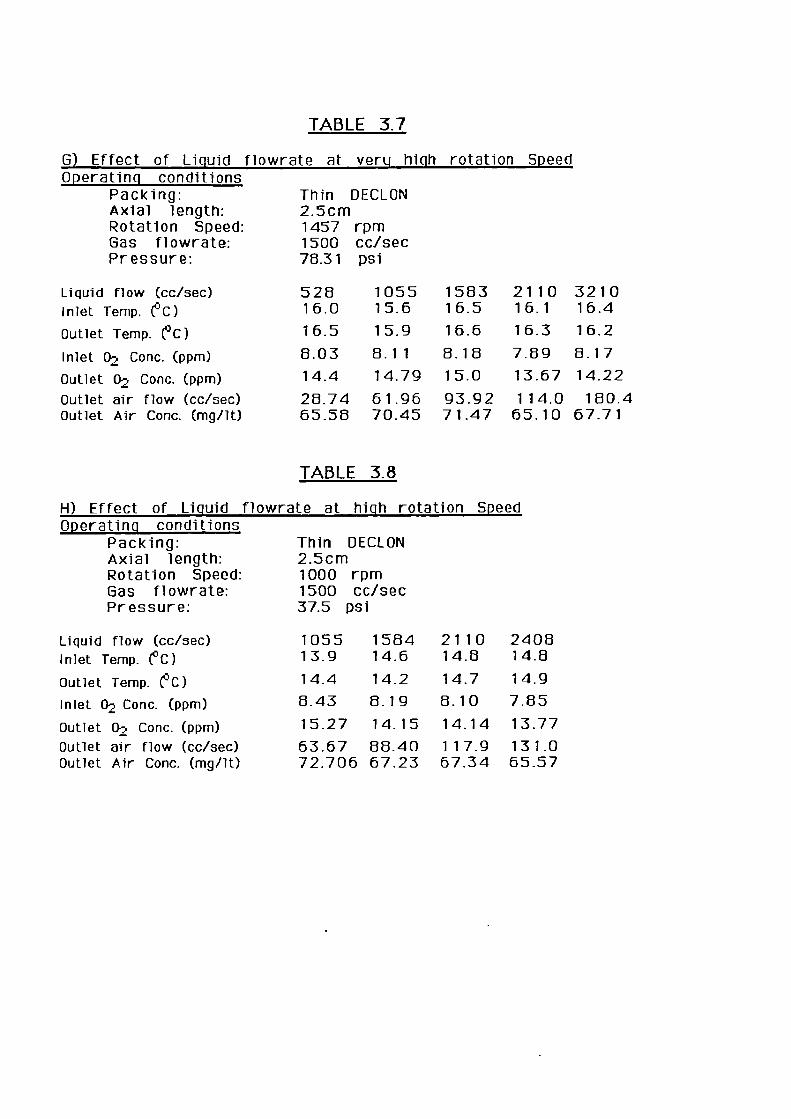
TABLE 3.7
G) Effect of Liquid flowrate at veru high rotation SpeedOperating conditions
Thin DECLON2.5cm1457 rpm1500 cc/sec78.31 psi
Packing:Axial length:Rotation Speed:Gas fl owrate:Pr essure:
Liquid flow (cc/sec) 528 1055 1583 2110 3210Inlet Temp. (°C) 16.0 15.6 16.5 16.1 16.4
Outlet Temp. ((t) 16.5 15.9 16.6 16.3 16.2
Inlet 0, Conc. (ppm) 8.03 8.11 8.18 7.89 8.17
Outlet 02 Conc. (ppm) 14.4 14.79 15.0 13.67 14.22
Outlet air flow (cc/sec) 28.74 61.96 93.92 114.0 180.4Outlet Air Conc. (mg/it) 65.58 70.45 71.47 65.10 67.71
TABLE 3.8
H) Effect of Liquid flowrate at high rotation Speed Operating conditions
Packing: Thin DECLONAxial length: 2.5cmRotation Speed: 1000 rpmGas fl owrate: 1500 cc/secPressure: 37.5 psi
Liquid flow (cc/sec) 1055 1584 2110 2408Inlet Temp. (°C) 13.9 14.6 14.8 14.8
Outlet Temp. (°C)
14.4 14.2 14.7 14.9
Inlet 0, Conc. (ppm)
8.43 8.19 8.10 7.85
Outlet 0, Conc. (ppm) 15.27 14.15 14.14 13.77
Outlet air flow (cc/sec) 63.67 88.40 117.9 131.0Outlet Air Conc. (mg/it) 72.706 67.23 67.34 65.57
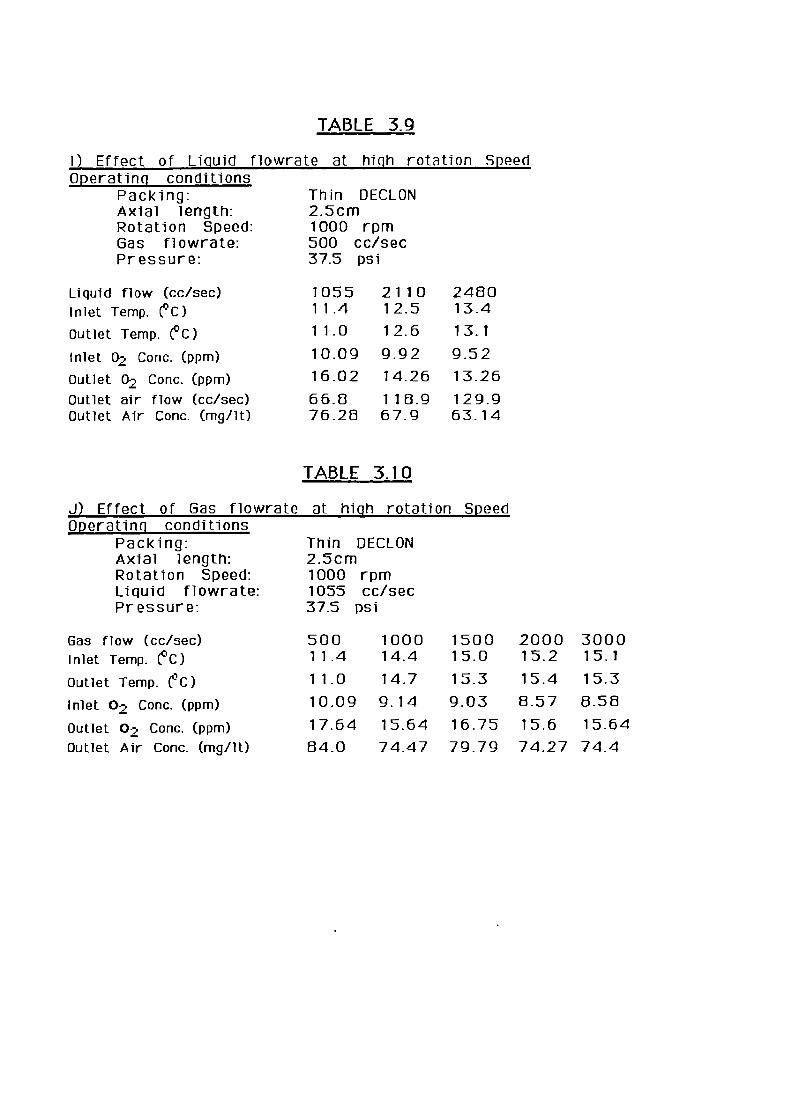
TABLE 3.9
I) Effect of Liquid flowrate at hiqh rotation SpeedOperating conditions
Packing: Thin DECLONAxial length: 2.5cmRotation Speed:Gas flowrate:Pressure:
1000 rpm500 cc/sec37.5 psi
Liquid flow (cc/sec) 1055 2110 2480Inlet Temp. (°C) 11.4 12.5 13.4
Outlet Temp. (°C) 11.0 12.6 13.1
Inlet 02 Conc. (ppm) 10.09 9.92 9.52
Outlet 02 Conc. (ppm) 16.02 14.26 13.26
Outlet air flow (cc/sec) 66.8 118.9 129.9Outlet Air Conc. (rnq/lt) 76.28 67.9 63.14
J) Effect of Gas flowrate
TABLE 3.10
Speedat high rotationOperating conditions
Thin DECLON2.5cm
Packing:Axial length:Rotation Speed: 1000 rpmLiquid flowrate: 1055 cc/secPressure: 37.5 psi
Gas flow (cc/sec) 500 1000 1500 2000 3000Inlet Temp. (1°C) 11.4 14.4 15.0 15.2 15.1
Outlet Temp. CC) 11.0 14.7 15.3 15.4 15.3
Inlet 02 Conc. (ppm) 10.09 9.14 9.03 8.57 8_58
Outlet 0-, Conc. (ppm) 17.64 15.64 16.75 15.6 15.64
Outlet Air Conc. (mg/it) 84.0 74.47 79.79 74.27 74.4
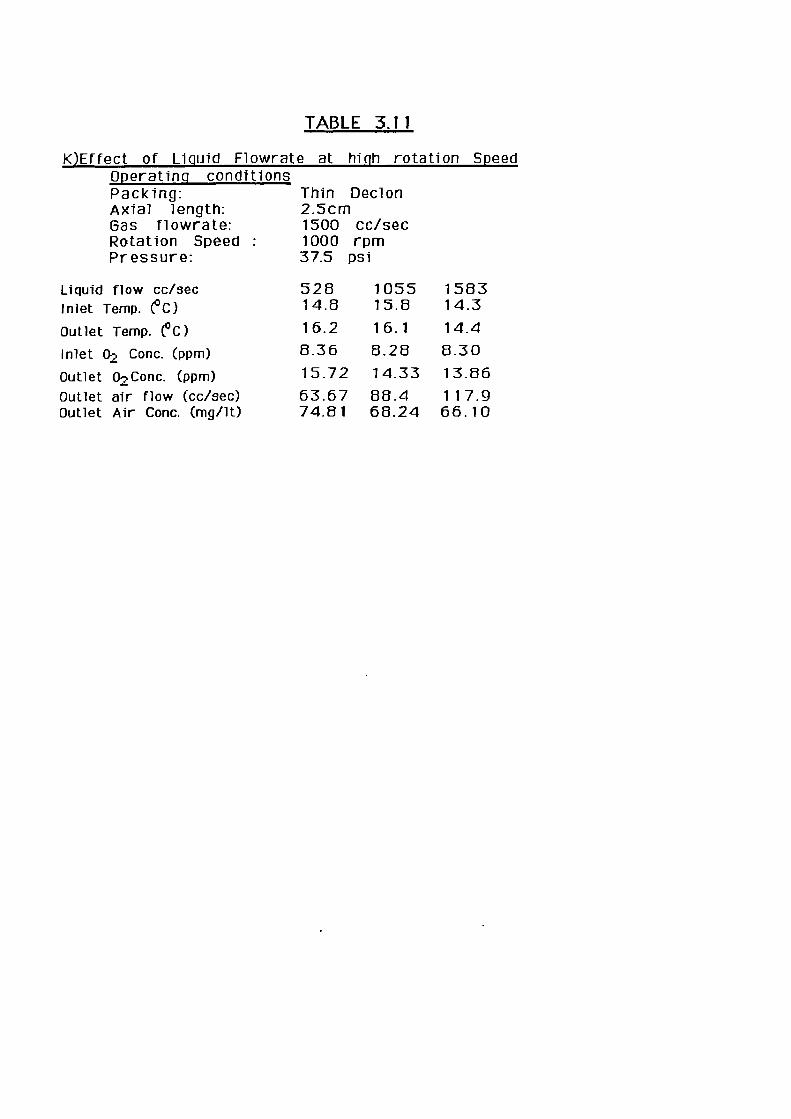
K)Effect of Liquid Flowrate
TABLE 3.11
Speedat high rotationOperating conditions
158314.3
14.4
8.30
Packing:Axial length:Gas flowrate:Rotation SpeedPressure:
Liquid flow cc/secInlet Temp. (°C)
Outlet Temp. (°C)
Inlet % Conc. (ppm)
:
Thin Declon2.5cm1500 cc/sec1000 rpm37.5 psi
528 105514.8 15.8
16.2 16.1
8.36 8.28
Outlet 0-,Conc. (ppm) 15.72 14.33 13.86
Outlet air flow (cc/sec) 63.67 88.4 117.9Outlet Air Conc. (mg/lt) 74.81 68.24 66.10
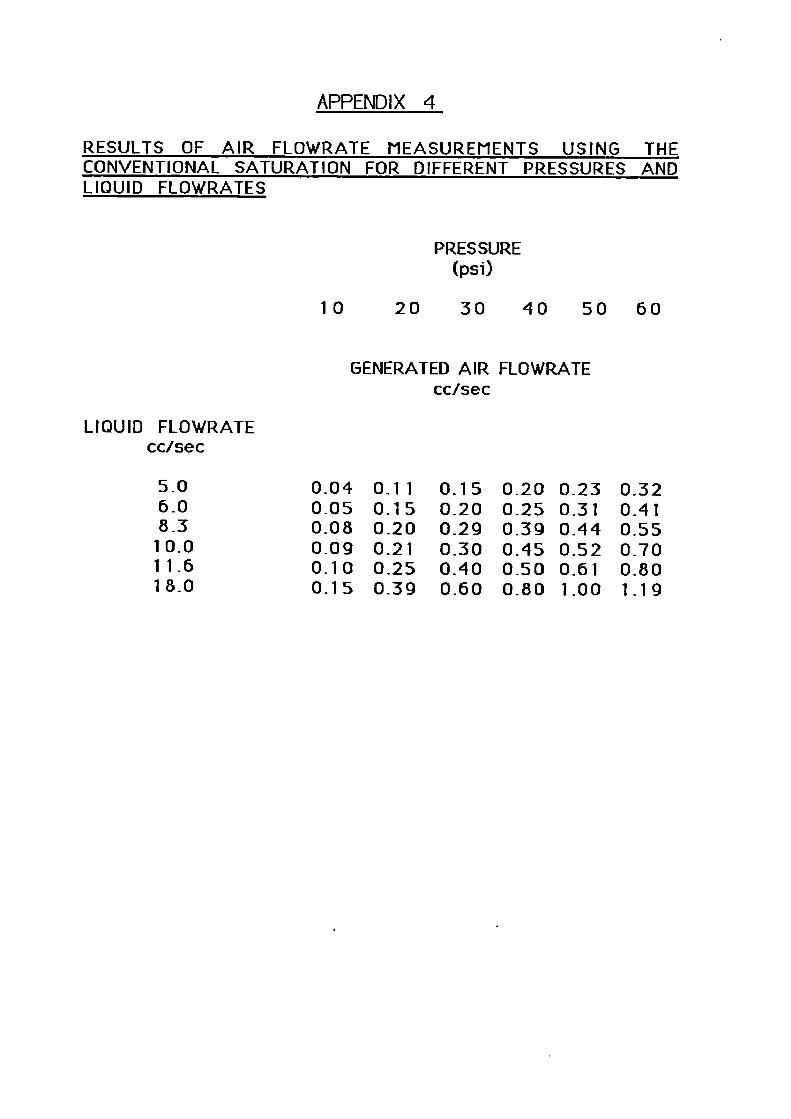
APPENDIX 4
RESULTS OF AIR FLOWRATE MEASUREMENTS USING THE CONVENTIONAL SATURATION FOR DIFFERENT PRESSURES AND LIQUID FLOWRATES
PRESSURE(psi)
10 20 30 40 50 60
GENERATED AIR FLOWRATEcc/sec
LIQUID FLOWRATEcc/sec
5.0 0.04 0.11 0.15 0.20 0_23 0326_0 0.05 0.15 0.20 0_25 0_31 0.418.3 0.08 0.20 0.29 0.39 0.44 0.5510.0 0.09 0.21 0.30 0.45 0.52 0.7011.6 0.10 0.25 0.40 0.50 0.61 0_8018.0 0.15 0.39 0.60 0_80 1_00 1.19
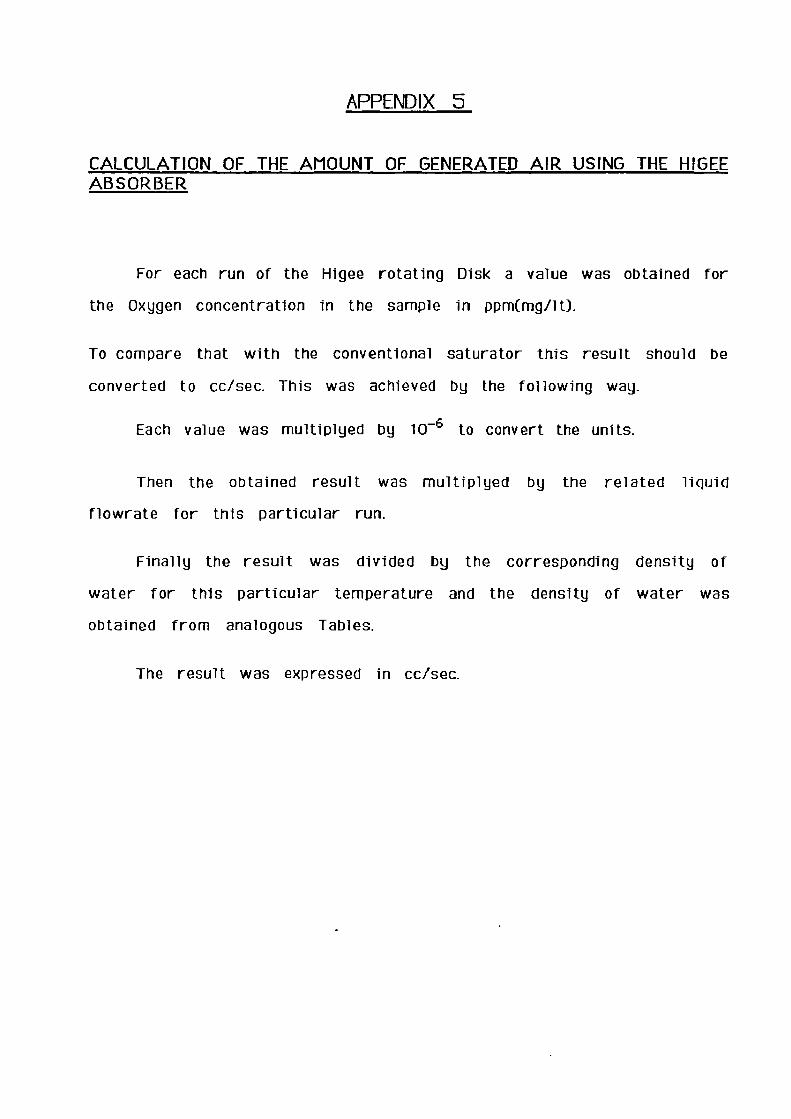
APPENDIX 5
CALCULATION OF THE AMOUNT OF GENERATED AIR USING THE HIGEEABSORBER
For each run of the Higee rotating Disk a value was obtained for
the Oxygen concentration in the sample in ppm(mg/lt).
To compare that with the conventional saturator this result should be
converted to cc/sec. This was achieved by the following way.
Each value was multiplyed by 10-6 to convert the units.
Then the obtained result was multiplyed by the related liquid
flowrate for this particular run.
Finally the result was divided by the corresponding density of
water for this particular temperature and the density of water was
obtained from analogous Tables.
The result was expressed in cc/sec.