GRIETAS INGENIERIA CIVIL CONSTRUCCION LOSA TRABE PANDEO CORTANTE


To my parents,
who threw me in the air and caught me in a net as much as necessary.
To my grandmother,
to who I owe more than I can ever give back.

Study on possibilities for low-cost monitoring of historical structures
Erasmus Mundus Programme
ADVANCED MASTERS IN STRUCTURAL ANALYSIS OF MONUMENTS AND HISTORICAL CONSTRUCTIONS i
ABSTRACT
With the purpose of bringing monitoring techniques to heritage sites that cannot afford a
high budget to survive or in order to prevent them to reach endangered situations, this thesis
was elaborated.
Aiming to ensure a precise but affordable solution, a Do-It-Yourself digitally controlled
monitoring system was built and implemented. It consisted on a crack monitoring system,
thought from the combination of three power sources (solar power, battery and direct
current), three data transferring systems (Bluetooth, xBee, SD card) and three sensors(
temperature, humidity and LVDT). The system worked well and provided satisfactory
results.
An economic analysis was performed by comparing the instruments built with other
commercially available options. Also, advantages that are not comparable were exposed. It
was evidenced that due to learning costs it was not economically reliable to build single and
simple instruments, but there is a clear advantage in building several similar devices or more
complex instrumentation.
Ideas and prototypes for more powerful or less expensive instruments were developed and
explained. It was observed that the amount of tools and instruments available in the market
for DIY solutions can provide more affordable options, possibility of refinement and
freedom for creation.
Keywords: Monitoring Systems, Historical constructions, Do-It-Yourself, Arduino.

Study on possibilities for low-cost monitoring of historical structures
Erasmus Mundus Programme
ii ADVANCED MASTERS IN STRUCTURAL ANALYSIS OF MONUMENTS AND HISTORICAL CONSTRUCTIONS
Study on possibilities for low-cost monitoring of historical structures
Erasmus Mundus Programme
ADVANCED MASTERS IN STRUCTURAL ANALYSIS OF MONUMENTS AND HISTORICAL CONSTRUCTIONS iii
ABSTRACT
Con el objetivo de llevar técnicas de monitorización al patrimonio que necesita sobrevivir
con bajos presupuestos o para evitar a una situación de riesgo, se decidió elaborar este
estudio.
Tratando de conseguir una solución de precisión y asequible, un sistema de monitorización
digital en una solución "Do-It-Yourself" fue construido e implementado. Este consistía en
un sistema de monitoreo de grietas hecho por la combinación de tres fuentes de energía
(solar, batería y corriente eléctrica), tres sistemas de transferencia de información (Bluetooth,
XBee y SD) y tres sensores (temperatura, humedad y LVDT). El sistema funcionó
correctamente y proporcionó resultados satisfactorios.
Se ha hecho un análisis económico comparando los instrumentos construidos con otros
disponibles en el mercado. Además se han expuesto ventajas que no eran comparables. Se
hay evidenciado que debido a los costos de aprendizaje, no era económicamente viable para
construir sólo un instrumento, pero hay ventajas para construir varios instrumentos similares
o más complejos.
Se han desarrollado y expuesto a otras ideas y prototipos de instrumentos con más capacidad
o más económico. También se observó que la cantidad de componentes y herramientas
disponibles en el mercado para soluciones "Do-It-Yourself" ofrecen otras opciones más
económicas, posibilidad de mejora y libertad creativa.
Palabras clave: Sistemas de monitorización, construcciones históricas, Do-It-Yourself,
Arduino.
Study on possibilities for low-cost monitoring of historical structures
Erasmus Mundus Programme
iv ADVANCED MASTERS IN STRUCTURAL ANALYSIS OF MONUMENTS AND HISTORICAL CONSTRUCTIONS
Study on possibilities for low-cost monitoring of historical structures
Erasmus Mundus Programme
ADVANCED MASTERS IN STRUCTURAL ANALYSIS OF MONUMENTS AND HISTORICAL CONSTRUCTIONS v
Resumo
Com o propósito de trazer técnicas de monitorização ao património que necessita sobreviver
com orçamentos baixos ou para prevenir que cheguem a situações de risco, decidiu-se
elaborar este estudo.
Tentando conseguir uma solução precise e economicamente acessível, um sistema de
monitorização digital numa solução “faça-você-mesmo” foi construído e implementado.
Este consistiu num sistema de monitorização de fendas realizado a partir da combinação de
três fontes de alimentação (energia solar, bateria e corrente elétrica), três sistemas de
transferência de informação (Bluetooth, xBee e cartões SD) e três sensores (temperatura,
humidade e LVDT). O sistema funcionou corretamente e forneceu resultados satisfatórios.
Efetuou-se uma análise económica comparando os instrumentos construídos com outros
disponíveis no mercado. Adicionalmente, expuseram-se vantagens que não eram
comparáveis. Foi assim evidenciado que devido aos custos de aprendizagem, não era
economicamente viável construir apenas um instrumento, mas que há vantagens em
construir vários instrumentos semelhantes ou outros mais complexos.
Desenvolveram-se e expuseram-se outras ideias e protótipos para instrumentos com mais
capacidades ou mais económicos. Observou-se também que a quantidade de componentes
e ferramentas disponíveis no mercado para soluções “faça-você-mesmo” oferecem outras
opções mais económicas, possibilidade de melhoramento e liberdade de criação.
Palavras-chave: Sistemas de Monitorização, Construções Históricas, Faça-você-mesmo,
Arduino.

Study on possibilities for low-cost monitoring of historical structures
Erasmus Mundus Programme
vi ADVANCED MASTERS IN STRUCTURAL ANALYSIS OF MONUMENTS AND HISTORICAL CONSTRUCTIONS
Study on possibilities for low-cost monitoring of historical structures
Erasmus Mundus Programme
ADVANCED MASTERS IN STRUCTURAL ANALYSIS OF MONUMENTS AND HISTORICAL CONSTRUCTIONS vii
Index
Chapter 1. Introduction ................................................................................................................ 1
1.1. Motivation of the research ............................................................................................................... 1
1.2. Aims and methodology ..................................................................................................................... 2
1.3. Outline of the Thesis ......................................................................................................................... 2
Chapter 2. State-of-the-Art .......................................................................................................... 3
2.1. Review of standard Structural Health Monitoring (SHM) ................................................................. 3
2.2. Review of Digital Fabrication processes............................................................................................ 7
Chapter 3. Possibilities for low-cost monitoring..................................................................... 11
3.1. Approach to the problem ................................................................................................................ 11
3.2. Energy Supply.................................................................................................................................. 11
3.2.1. Direct Current ..................................................................................................................... 12
3.2.2. Battery ................................................................................................................................ 13
3.2.3. Solar System ....................................................................................................................... 14
3.3. Measurement Gauges..................................................................................................................... 18
3.3.1. Arduino digital controller ................................................................................................... 18
3.3.2. Analog temperature sensor LM35 ...................................................................................... 21
3.3.3. Humidity and temperature sensor DHT22 ......................................................................... 22
3.3.4. LVDT Solartron AX/5/S ........................................................................................................ 23
3.4. Data transfer................................................................................................................................... 24
3.4.1. Bluetooth HC-06 Module .................................................................................................... 25
3.4.2. XBee S2 Module .................................................................................................................. 28
3.4.3. Micro SD card ..................................................................................................................... 30
3.5. Data management .......................................................................................................................... 32
3.5.1. File and data format ........................................................................................................... 32
3.5.2. Time control ....................................................................................................................... 33
3.5.3. Loss of connection .............................................................................................................. 35
3.5.4. Error alert ........................................................................................................................... 36
3.6. Post-processing ............................................................................................................................... 37
3.6.1. Compiling files .................................................................................................................... 37
3.6.2. Creating continuous time axis ............................................................................................ 38
3.6.3. Plotting results .................................................................................................................... 38
3.7. Data acquisition program ............................................................................................................... 38
Chapter 4. Implementation of a low-cost monitoring system .............................................. 41
4.1. Instrumentation built ...................................................................................................................... 41
4.1.1. Temperature Sensor ........................................................................................................... 41
4.1.2. LVDT sensor ........................................................................................................................ 44
4.1.3. Humidity sensor .................................................................................................................. 46
Study on possibilities for low-cost monitoring of historical structures
Erasmus Mundus Programme
viii ADVANCED MASTERS IN STRUCTURAL ANALYSIS OF MONUMENTS AND HISTORICAL CONSTRUCTIONS
4.2. Set-up of the monitoring system ..................................................................................................... 48
4.3. Results of the monitoring system ................................................................................................... 50
4.4. Performance of the system ............................................................................................................. 53
Chapter 5. Economic analysis .................................................................................................... 55
5.1. Cost of Built instruments ................................................................................................................. 55
5.2. Costs and characteristics of similar instrumentation available in the market ................................ 56
5.3. Comparison of instruments ............................................................................................................. 61
5.3.1. Temperature sensor ........................................................................................................... 61
5.3.2. Humidity sensor .................................................................................................................. 61
5.3.3. LVDT Data acquisition system ............................................................................................ 62
5.3.4. Solar energy system ............................................................................................................ 63
5.4. Comparison of system ..................................................................................................................... 64
Chapter 6. Possibilities of Improvement .................................................................................. 65
6.1. Optical light LVDT ........................................................................................................................... 65
6.1.1. 3D Rotational Optical light LVDT ........................................................................................ 66
6.1.2. 3D Translation Optical light LVDT ....................................................................................... 69
6.2. Optical light Inclinometers .............................................................................................................. 70
6.2.1. Spectral receiver ................................................................................................................. 70
6.2.2. Pendulum Optical inclinometer .......................................................................................... 71
6.2.3. Mirror enhancer ................................................................................................................. 71
6.3. Casing and waterproofing .............................................................................................................. 72
6.4. Solar orientation optimization ........................................................................................................ 72
6.5. Energy saving .................................................................................................................................. 73
6.6. Other Arduino boards ..................................................................................................................... 74
Chapter 7. Conclusions ............................................................................................................... 75
7.1. Summary ......................................................................................................................................... 75
7.2. Specific conclusions ......................................................................................................................... 75
7.3. General conclusions and observations ............................................................................................ 76
7.4. Suggestions for future work ............................................................................................................ 77
Chapter 8. References ................................................................................................................. 78
8.1. Documents ...................................................................................................................................... 78
8.2. Online References: .......................................................................................................................... 79

Study on possibilities for low-cost monitoring of historical structures
Erasmus Mundus Programme
ADVANCED MASTERS IN STRUCTURAL ANALYSIS OF MONUMENTS AND HISTORICAL CONSTRUCTIONS ix
Index of Figures
Figure 2.1. On-site testing and monitoring (Casarin, 2009)........................................................ 3
Figure 2.2. Crack width movement of a monitored crack in Mallorca cathedral .................... 4
Figure 2.3. Flowchart of intervention in Historical constructions (NIKER 9) ....................... 4
Figure 2.4. Example of crack pattern, model and monitoring system in Frari Cathedral,
Venice (Lorenzoni, 2015) ................................................................................................................ 5
Figure 2.5. Figurative example of static and dynamic readings along time .............................. 6
Figure 2.6. Data log and transfer systems by (Mufti 2008) ......................................................... 6
Figure 2.7. Buildings monitored using automated algorithms by Padova University
(Lorenzoni 2015) ............................................................................................................................... 7
Figure 2.8. Premiere issue of make magazine ............................................................................... 8
Figure 2.9. BASIC Stamp 2 prototyping platform [OR 30] ........................................................ 9
Figure 2.10. Wiring prototyping board .......................................................................................... 9
Figure 2.11. Key-components for developing Arduino (Cooper, B. 2011)............................ 10
Figure 2.12. BBC Microbit, children oriented prototyping platform ...................................... 10
Figure 3.1. Assumed division of a monitoring system .............................................................. 11
Figure 3.2. Explored energy supply possibilities ........................................................................ 11
Figure 3.3. Laptop power adapter ................................................................................................ 12
Figure 3.4. ATX power adapter pinout ....................................................................................... 13
Figure 3.5. ATX power supply Dell OptiPlex GX280 .............................................................. 13
Figure 3.6. Battery’s aspect and dimensions ............................................................................... 14
Figure 3.7. Battery with ATX connection cable ......................................................................... 14
Figure 3.8. Components of the assembled solar system ........................................................... 15
Figure 3.9. Assembled solar system .............................................................................................. 17
Figure 3.10. Charge controller with ATX cables ........................................................................ 17
Figure 3.11. Solar panel seen from outside, oriented South. .................................................... 18
Figure 3.12. Explored sensors ....................................................................................................... 18
Figure 3.13. Arduino Uno Rev 3 board ....................................................................................... 19
Figure 3.14. Arduino IDE ............................................................................................................. 20
Figure 3.15. LM35 temperature sensor ........................................................................................ 21
Figure 3.16. DHT22 Humidity and temperature sensor ........................................................... 22
Figure 3.17. Solartron AX/5/S LVDT ........................................................................................ 23
Figure 3.18. Resistive divider ......................................................................................................... 24
Figure 3.19. Explored data management possibilities ............................................................... 24
Figure 3.20. Elecfreaks HC-06 Bluetooth radio modem .......................................................... 25
Figure 3.21. Assigning an fixed Bluetooth incoming port in Windows .................................. 27
Figure 3.22. Trust Bluetooth 4.0 adapter ..................................................................................... 28
Figure 3.23. Different types of xBee network architectures ..................................................... 28
Figure 3.24. Communication path assembled for xBee communication ................................ 29
Figure 3.25. General aspect of the XCTU graphic environment ............................................. 29
Figure 3.26. SD card and SD card holder ................................................................................... 30
Study on possibilities for low-cost monitoring of historical structures
Erasmus Mundus Programme
x ADVANCED MASTERS IN STRUCTURAL ANALYSIS OF MONUMENTS AND HISTORICAL CONSTRUCTIONS
Figure 3.27. Pinout of SD card holder ......................................................................................... 31
Figure 3.28. SD card holder’s connection diagram .................................................................... 31
Figure 3.29. Dating and timing using a pc. .................................................................................. 33
Figure 3.30. Octopus RTC clock .................................................................................................. 33
Figure 3.31. Dating and timing using RTC ................................................................................. 34
Figure 3.32. Observable loss of connection in local time registrations .................................. 35
Figure 3.33. Recovering data from SD card ................................................................................ 35
Figure 3.34. Warning LED assembled in one of the made devices ........................................ 36
Figure 3.35. Compiling files example ........................................................................................... 37
Figure 3.36. Flowchart of the data acquisition program ........................................................... 39
Figure 3.37. Configuration file for data acquisition program. .................................................. 40
Figure 3.38. Aspect of data acquisition program running ......................................................... 40
Figure 4.1. Instruments made for monitoring campaign .......................................................... 41
Figure 4.2. Wiring of Temperature sensor .................................................................................. 42
Figure 4.3. Final aspect of temperature sensor without cover ................................................. 42
Figure 4.4. Temperature sensor’s flowchart ................................................................................ 43
Figure 4.5. Wiring of LVDT sensor ............................................................................................. 44
Figure 4.6. Final aspect of the LVDT sensor’s power and circuitry ....................................... 45
Figure 4.7. LVDT sensor’s Flowchart ......................................................................................... 45
Figure 4.8. Wiring of Humidity sensor ........................................................................................ 46
Figure 4.9. Final aspect of humidity sensor without cover ....................................................... 47
Figure 4.10. Humidity sensor’s flowchart .................................................................................... 47
Figure 4.11. Location of building B1 ........................................................................................... 48
Figure 4.12. Initial crack width ...................................................................................................... 49
Figure 4.13. LVDT installed over crack ...................................................................................... 49
Figure 4.14. Temperature sensor in balcony ............................................................................... 50
Figure 4.15. Values of temperature and humidity over time .................................................... 50
Figure 4.16. Values from temperature sensor when outside .................................................... 51
Figure 4.17. Weather conditions in Barcelona for June 2015 ................................................... 51
Figure 4.18. Results from LVDT sensor ..................................................................................... 52
Figure 4.19. Temperature and crack width parallelism .............................................................. 52
Figure 4.20. Average temperature in Barcelona in first semester of 2015 [OR 21] .............. 53
Figure 4.21. Average Crack width movements ........................................................................... 53
Figure 6.1. LED and light resistor in darkness ........................................................................... 65
Figure 6.2. Prototype to analyze optical LVDT ......................................................................... 65
Figure 6.3. Calibration of the light sensor prototype ................................................................. 66
Figure 6.4. Typical movements to be measured ......................................................................... 66
Figure 6.5. 3D Optical crack monitor .......................................................................................... 67
Figure 6.6. Important triangulations ............................................................................................ 67
Figure 6.7. Mesh distortion for the crack movements .............................................................. 67
Figure 6.8. Optical crack monitor positioning piece.................................................................. 68
Figure 6.9. Possible readings for temperature distortion control ............................................ 68
Study on possibilities for low-cost monitoring of historical structures
Erasmus Mundus Programme
ADVANCED MASTERS IN STRUCTURAL ANALYSIS OF MONUMENTS AND HISTORICAL CONSTRUCTIONS xi
Figure 6.10. 3 possible translations measurable by this device................................................. 69
Figure 6.11. Perspectives of idea for 3D translation crack monitor. ....................................... 69
Figure 6.12. Spectral receiver example ......................................................................................... 70
Figure 6.13. Examples of results for spectral receiver. .............................................................. 70
Figure 6.14. Pendulum inclinometer general concept ............................................................... 71
Figure 6.15. Angle multiplication .................................................................................................. 72
Figure 6.16. Best solar panel orientation for Barcelona according to [OR 22] ...................... 73
Figure 6.17. Arduino Pro Nano from DCCduino ..................................................................... 74
Figure 7.1. A possible cycle from openness of data and knowledge ....................................... 76
Index of Tables
Table 1. Summary of investment in the monitoring system build ................................... 56
Table 2. Examples of commercial available temperature sensors .................................... 57
Table 3. Examples of commercial available Humidity and temperature sensors ........... 58
Table 4. Examples of commercial available data acquisition systems ............................. 59
Table 5. Examples of commercially available solar energy systems ................................. 60
Index of Appendices
Appendix 1
Data acquisition program
Appendix 2
Arduino programming of Temperature sensor
Appendix 3
Arduino programming of LVDT sensor
Appendix 4
Arduino programming of Humidity sensor
Appendix 5
Arduino programming of Prototype testing with direct results
Appendix 6
Arduino programming of Prototype testing with averages
Appendix 7
Arduino programming of programs for testing Arduino Reading frequency

Study on possibilities for low-cost monitoring of historical structures
Erasmus Mundus Programme
xii ADVANCED MASTERS IN STRUCTURAL ANALYSIS OF MONUMENTS AND HISTORICAL CONSTRUCTIONS

Study on possibilities for low-cost monitoring of historical structures
Erasmus Mundus Programme
ADVANCED MASTERS IN STRUCTURAL ANALYSIS OF MONUMENTS AND HISTORICAL CONSTRUCTIONS xiii
ACKNOWLEDGEMENTS
I would like to thank,
My family, for all the support they gave me before and during the past year.
To my supervisors, Professors Rolando Chacón and Prof. Luca Pelà, for their support,
openness and for sharing my enthusiasm for this thesis.
All of the SAHC Masters consortium participants for their knowledge and will to share it.
To SAHC masters consortium for providing me the grant that enabled my participation in
the program.
To Professor Paulo Barbosa Lourenço, who took the patience to answer my doubts and
become convinced that this Masters was the right choice for me.
My colleagues for so many fruitful discussions about science and culture during this year in
which common interests led us to become a team.
To ZSófia Salát, Huan Zhou and Maria Kyriakou for so many good experiences and
common goals achieved.
To my friends who visited me, erasing the time for which we were separated.
This research work has received the financial support from the MINECO (Ministerio de
Economia y Competitividad of the Spanish Government) and the ERDF (Euripean Regional
Development Fund) through the research project MICROPAR (Identification of mechanical
and strength parameters of structural masonry by experimental methods and numerical
micro-modeling, ref num. BIA2012-32234).

Study on possibilities for low-cost monitoring of historical structures
Erasmus Mundus Programme
xiv ADVANCED MASTERS IN STRUCTURAL ANALYSIS OF MONUMENTS AND HISTORICAL CONSTRUCTIONS
Study on possibilities for low-cost monitoring of historical structures
Erasmus Mundus Programme
ADVANCED MASTERS IN STRUCTURAL ANALYSIS OF MONUMENTS AND HISTORICAL CONSTRUCTIONS 1
Chapter 1. Introduction
1.1. Motivation of the research
The ability to see value in our legacy has never been stronger than today. The will to preserve
our material and cultural heritage has grown in the last few centuries, culminating in today’s
respect and legal protection for them. Due to the nature, diversity and size of valuables,
everyone is invited to help in the effort to prolong the life or memory of the heritage in a
sustainable way. Only with mutual respect and individual contribution of each owns skills
can we hope to attain such a difficult task. With that in mind, this study was performed.
One of the most difficult properties to assess are the long-term behaviors in the life of the
sites. For this, monitoring systems provide very good clues. They are a valuable tool to help
predict and prolong their future life. Unfortunately nowadays options for this process are
still considerably expensive and are usually reserved for either the highly valuable patrimony
or the eminently endangered one.
With the purpose of bringing monitoring techniques to other sites that cannot afford a high
budget to survive or in order to prevent them to reach endangered situations, this thesis was
proposed and readily accepted by the first author.
Engineering has historically been diversifying and specializing. The amount of knowledge
available requires people to work on more dedicated fields and because of that bigger and
more multi-disciplinary teams. Civil engineering is multi-disciplinary from its birth but
recurrently absorbs techniques from chemistry, electronics, mechanics and computer
sciences.
Taking advantage of a new sources of information such as high diversity of online tutorials,
big online enthusiastic communities, modern easy-to-use electronic tools and a great amount
of examples of codes to run applications or program micro-controllers, a leap between Civil
and Electronic Engineering seemed possible and was attempted.

Study on possibilities for low-cost monitoring of historical structures
Erasmus Mundus Programme
2 ADVANCED MASTERS IN STRUCTURAL ANALYSIS OF MONUMENTS AND HISTORICAL CONSTRUCTIONS
1.2. Aims and methodology
This study focuses on the following main goals:
- Build and test a reproducible DIY (Do-It-Yourself) monitoring system
- Make a technical and economic analysis of the produced system.
- Develop ideas to increase the system’s performance
- Develop ideas to further decrease the costs
For this, the following steps were to be made:
- Divide the monitoring system into simpler components
- Choosing different technologies and possibilities that apparently lead to a low-cost
solution
- Building the system
- Testing the system by applying it to a real case study
- Analyzing the performance, costs, difficulty and time consumption of the system
- Developing ideas and find alternatives to increase the system’s performance and
to further decrease the costs
- Concluding and exposing other interesting observations gathered on the process
1.3. Outline of the Thesis
The thesis follows the same order as the developed works with the following content:
- In Chapter 2, an introduction to the history of monitoring in historical
constructions and DIY history is presented.
- In Chapter 3, the approach to the problem is explained. The chosen components
are presented and their choice is justified. Their advantages\disadvantages,
construction, assembly, instructions to operate, costs and time investment are
stated. Other created tools necessary for operating the monitoring system are also
here exposed.
- In Chapter 4, a monitoring system is assembled using the previously exposed
components and tested in a real case study. The results from this study are
presented and also comments on the performance of the system are made.
- In Chapter 5, the system’s cost and effort is evaluated and compared with other
commercial options.
- In Chapter 6, possibilities of improvement either of cost or of performance are
stated.
- In Chapter 7, conclusions and suggestions for future work.
- In appendix, information to copy the implemented system is provided.
Study on possibilities for low-cost monitoring of historical structures
Erasmus Mundus Programme
ADVANCED MASTERS IN STRUCTURAL ANALYSIS OF MONUMENTS AND HISTORICAL CONSTRUCTIONS 3
Chapter 2. State-of-the-Art
2.1. Review of standard Structural Health Monitoring (SHM)
“Engineering structures are designed to be safe. The difficulty one trading in this regard is
the desire to construct something for a specific purpose out of a material of which one can
never know enough in terms of the material’s properties as well as the environment the
structure is going to operate in.“ (Boller, C., 2009)
In order to ensure an existing structure’s safety, it is necessary to acquire knowledge about
its current condition and what will it be submitted to. For this, it is possible to implement an
inspection program which will deliver information through observation and measurements.
Inspections are mostly divided into two different types, the periodical or routine inspections
and the detailed inspections. The routine inspection is used to timely alert to risk of
significant damage. The detailed inspection is usually a consequence of this alert and intends
to provide data to better understand damages, behaviors or other characteristics of the
building (FIB, 2003). This inspection usually requires on-site measurements to be performed
in order to better understand the mechanical parameters of the building. These
measurements can be made in order to characterize the construction in a moment in time or
describe its evolution over time.
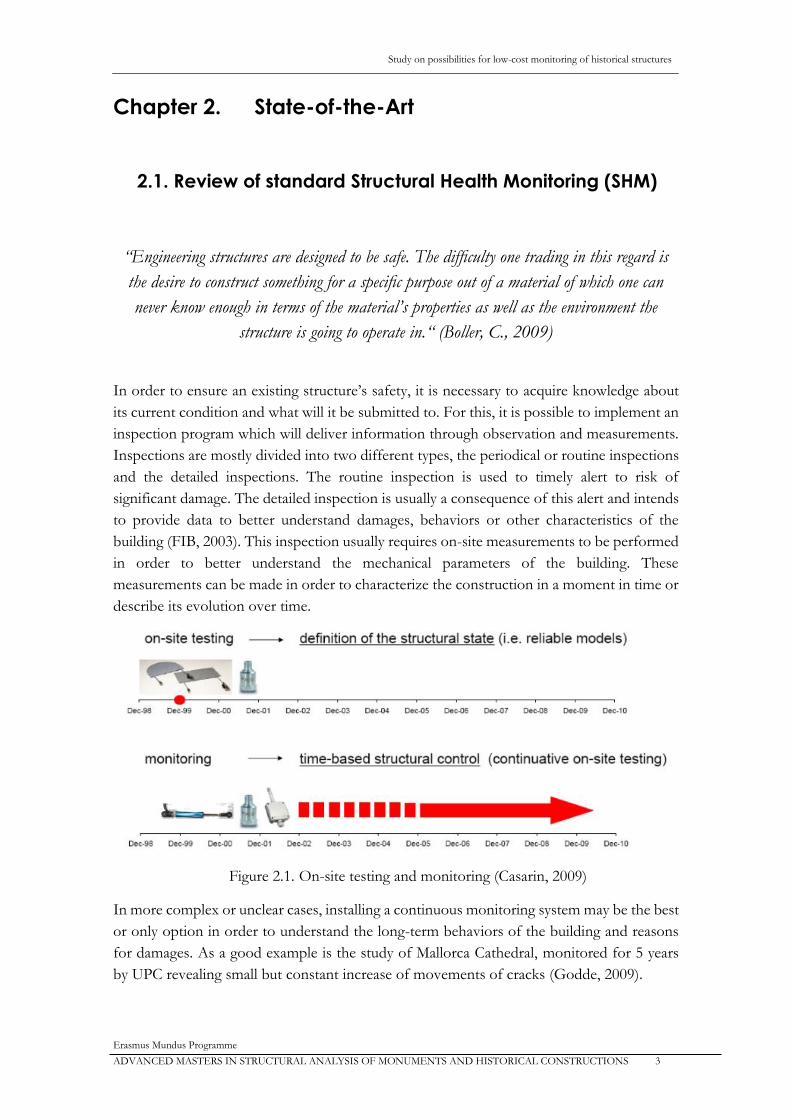
Figure 2.1. On-site testing and monitoring (Casarin, 2009)
In more complex or unclear cases, installing a continuous monitoring system may be the best
or only option in order to understand the long-term behaviors of the building and reasons
for damages. As a good example is the study of Mallorca Cathedral, monitored for 5 years
by UPC revealing small but constant increase of movements of cracks (Godde, 2009).
Study on possibilities for low-cost monitoring of historical structures
Erasmus Mundus Programme
4 ADVANCED MASTERS IN STRUCTURAL ANALYSIS OF MONUMENTS AND HISTORICAL CONSTRUCTIONS
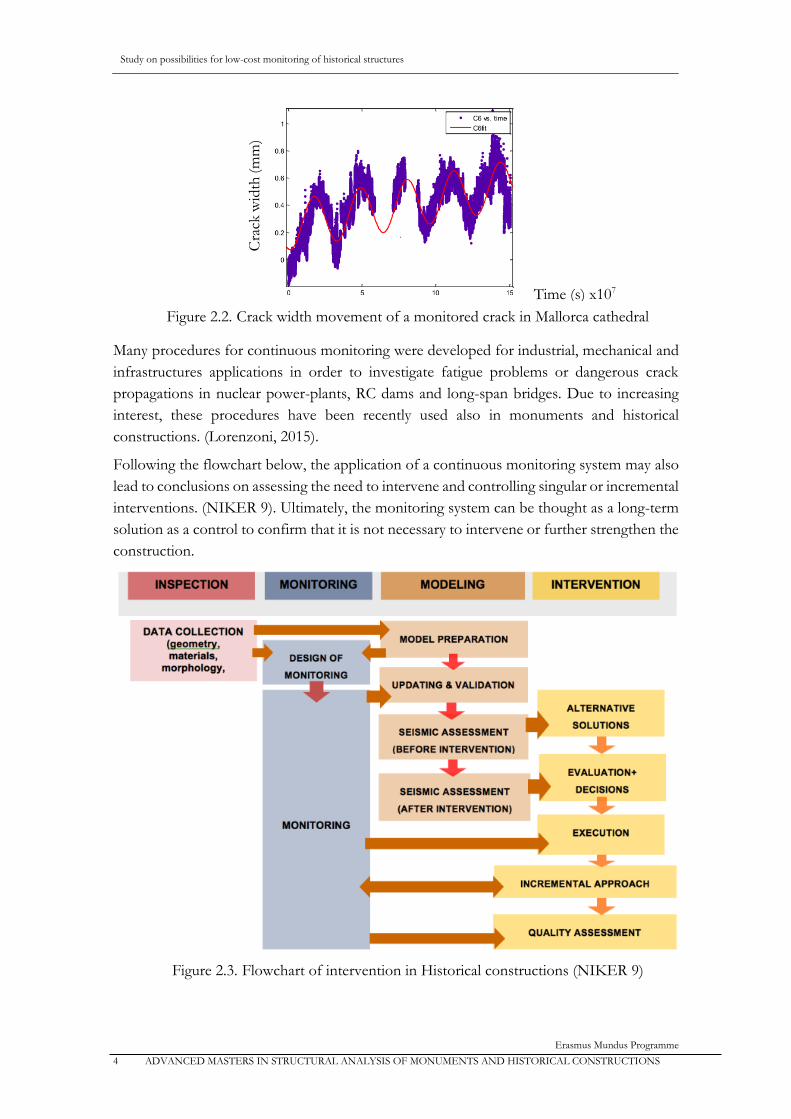
Figure 2.2. Crack width movement of a monitored crack in Mallorca cathedral
Many procedures for continuous monitoring were developed for industrial, mechanical and
infrastructures applications in order to investigate fatigue problems or dangerous crack
propagations in nuclear power-plants, RC dams and long-span bridges. Due to increasing
interest, these procedures have been recently used also in monuments and historical
constructions. (Lorenzoni, 2015).
Following the flowchart below, the application of a continuous monitoring system may also
lead to conclusions on assessing the need to intervene and controlling singular or incremental
interventions. (NIKER 9). Ultimately, the monitoring system can be thought as a long-term
solution as a control to confirm that it is not necessary to intervene or further strengthen the
construction.
Figure 2.3. Flowchart of intervention in Historical constructions (NIKER 9)
Time (s) x107
Cra
ck w
idth
(m
m)
Study on possibilities for low-cost monitoring of historical structures
Erasmus Mundus Programme
ADVANCED MASTERS IN STRUCTURAL ANALYSIS OF MONUMENTS AND HISTORICAL CONSTRUCTIONS 5
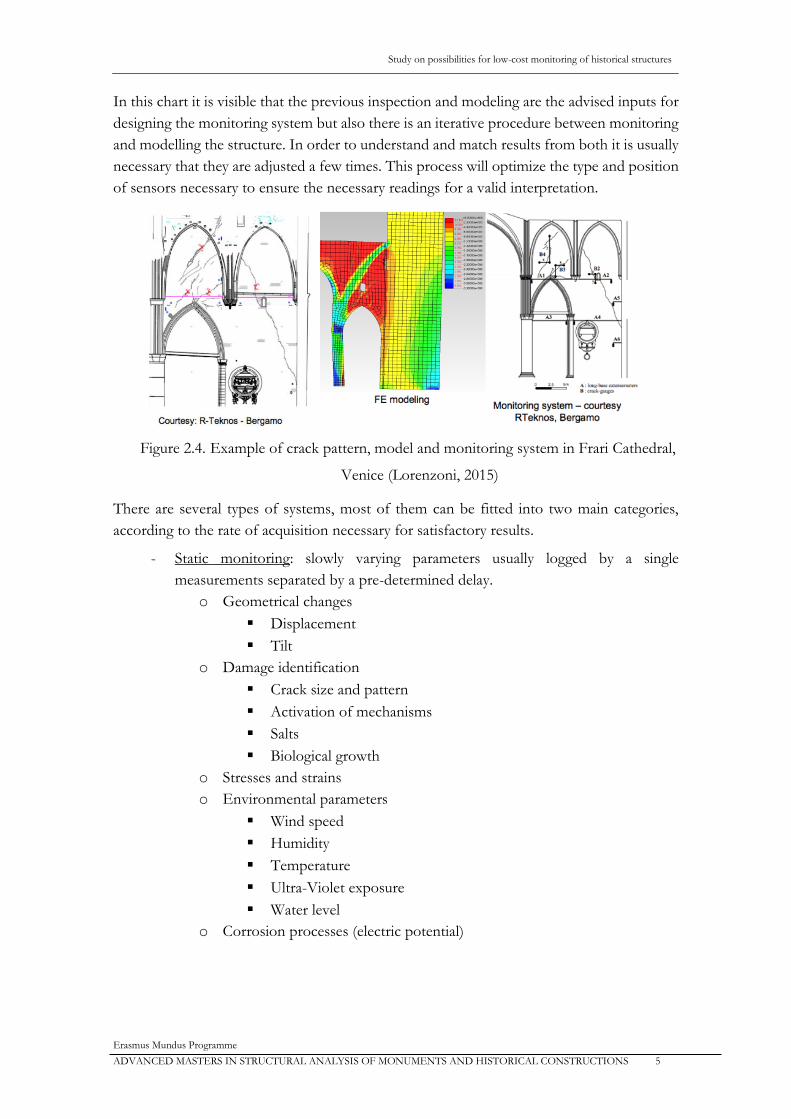
In this chart it is visible that the previous inspection and modeling are the advised inputs for
designing the monitoring system but also there is an iterative procedure between monitoring
and modelling the structure. In order to understand and match results from both it is usually
necessary that they are adjusted a few times. This process will optimize the type and position
of sensors necessary to ensure the necessary readings for a valid interpretation.
Figure 2.4. Example of crack pattern, model and monitoring system in Frari Cathedral,
Venice (Lorenzoni, 2015)
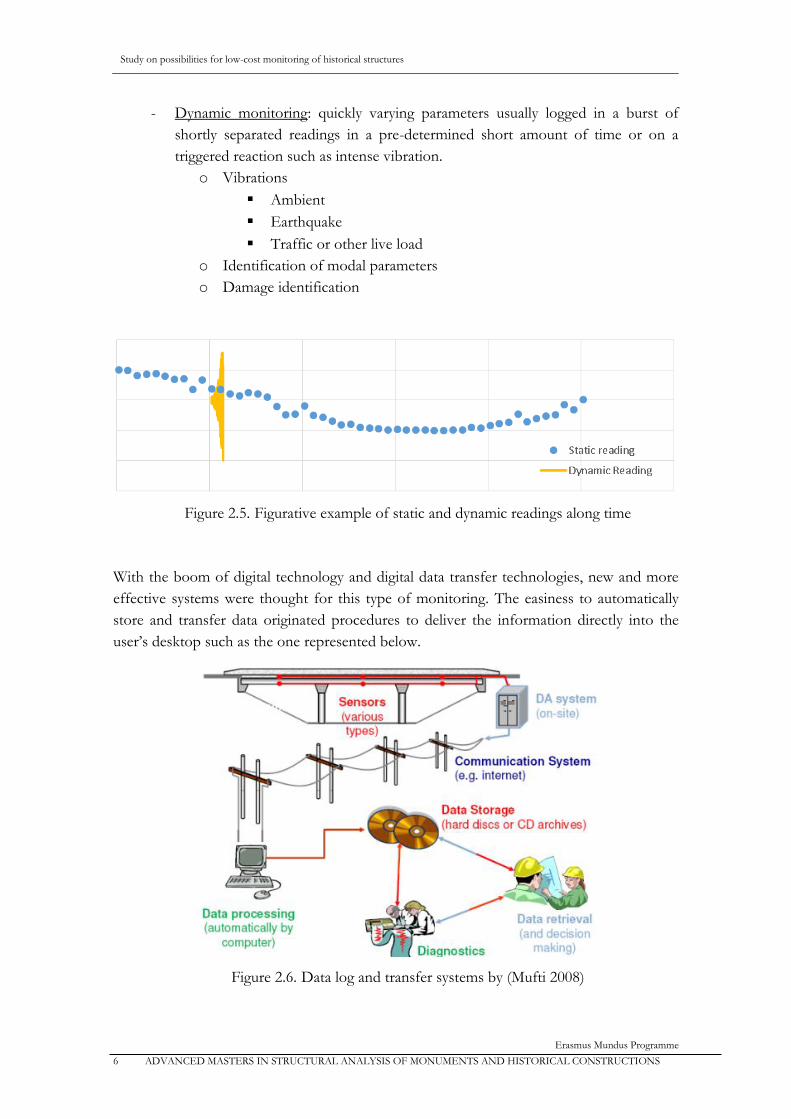
There are several types of systems, most of them can be fitted into two main categories,
according to the rate of acquisition necessary for satisfactory results.
- Static monitoring: slowly varying parameters usually logged by a single
measurements separated by a pre-determined delay.
o Geometrical changes
Displacement
Tilt
o Damage identification
Crack size and pattern
Activation of mechanisms
Salts
Biological growth
o Stresses and strains
o Environmental parameters
Wind speed
Humidity
Temperature
Ultra-Violet exposure
Water level
o Corrosion processes (electric potential)
Study on possibilities for low-cost monitoring of historical structures
Erasmus Mundus Programme
6 ADVANCED MASTERS IN STRUCTURAL ANALYSIS OF MONUMENTS AND HISTORICAL CONSTRUCTIONS
- Dynamic monitoring: quickly varying parameters usually logged in a burst of
shortly separated readings in a pre-determined short amount of time or on a
triggered reaction such as intense vibration.
o Vibrations
Ambient
Earthquake
Traffic or other live load
o Identification of modal parameters
o Damage identification
Figure 2.5. Figurative example of static and dynamic readings along time
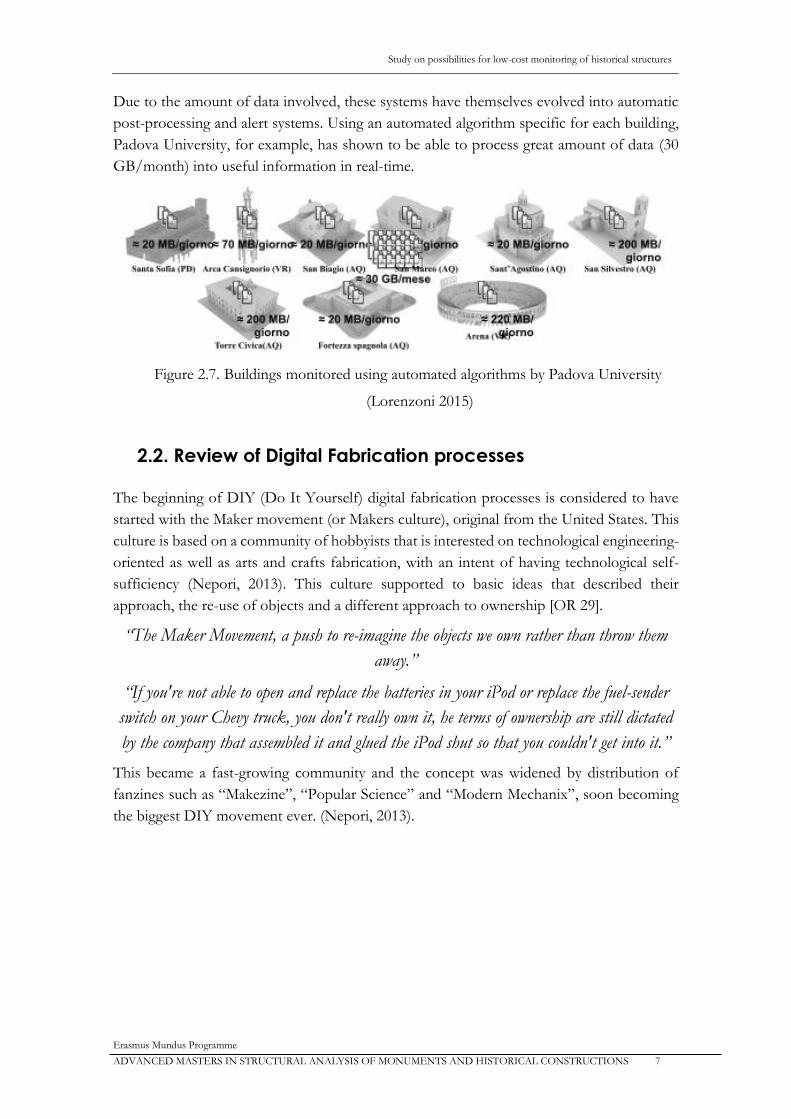
With the boom of digital technology and digital data transfer technologies, new and more
effective systems were thought for this type of monitoring. The easiness to automatically
store and transfer data originated procedures to deliver the information directly into the
user’s desktop such as the one represented below.
Figure 2.6. Data log and transfer systems by (Mufti 2008)
Study on possibilities for low-cost monitoring of historical structures
Erasmus Mundus Programme
ADVANCED MASTERS IN STRUCTURAL ANALYSIS OF MONUMENTS AND HISTORICAL CONSTRUCTIONS 7
Due to the amount of data involved, these systems have themselves evolved into automatic
post-processing and alert systems. Using an automated algorithm specific for each building,
Padova University, for example, has shown to be able to process great amount of data (30
GB/month) into useful information in real-time.
Figure 2.7. Buildings monitored using automated algorithms by Padova University
(Lorenzoni 2015)
2.2. Review of Digital Fabrication processes
The beginning of DIY (Do It Yourself) digital fabrication processes is considered to have
started with the Maker movement (or Makers culture), original from the United States. This
culture is based on a community of hobbyists that is interested on technological engineering-
oriented as well as arts and crafts fabrication, with an intent of having technological self-
sufficiency (Nepori, 2013). This culture supported to basic ideas that described their
approach, the re-use of objects and a different approach to ownership [OR 29].
“The Maker Movement, a push to re-imagine the objects we own rather than throw them
away.”
“If you're not able to open and replace the batteries in your iPod or replace the fuel-sender
switch on your Chevy truck, you don't really own it, he terms of ownership are still dictated
by the company that assembled it and glued the iPod shut so that you couldn't get into it.”
This became a fast-growing community and the concept was widened by distribution of
fanzines such as “Makezine”, “Popular Science” and “Modern Mechanix”, soon becoming
the biggest DIY movement ever. (Nepori, 2013).

Study on possibilities for low-cost monitoring of historical structures
Erasmus Mundus Programme
8 ADVANCED MASTERS IN STRUCTURAL ANALYSIS OF MONUMENTS AND HISTORICAL CONSTRUCTIONS
Figure 2.8. Premiere issue of make magazine
Involving so many inventors with increasingly affordable tools and technology, this curious
community started having ideas suitable for market. Dougherty identified this community as
having three main types of segments (Dougherty 2013):
- Zero to maker: Starters who have the ability and will to learn the requisite skills
and access the necessary means of production.
- Maker to maker: People who undergo more powerful works, share expertise and
collaborate in community with others. The desire to improve and share with others
catalyzes the segment.
- Maker to market: “Knowledge flows and concentrates. Some of the inventions
and creations will appeal to a broader audience than the original makers. Some may
even find commercial appeal. However, even if only a few makers pursue market
opportunities, the impact may be huge”.
In the process not only final products are produced but also many tools as well. They include
electronic and digital prototyping and programming platforms. The development of a
programmable digital controller comes as one of the latest developments. It is a long-
expected powerful a tool made from makers to makers which allow a process of sketching
with hardware. While not a final product itself, it widens the possibilities and eases the
Study on possibilities for low-cost monitoring of historical structures
Erasmus Mundus Programme
ADVANCED MASTERS IN STRUCTURAL ANALYSIS OF MONUMENTS AND HISTORICAL CONSTRUCTIONS 9
creation of a digitally controlled instrument. Furthermore, this was accompanied by the same
ideologies using and producing open-source software and hardware, giving way to further
developments.
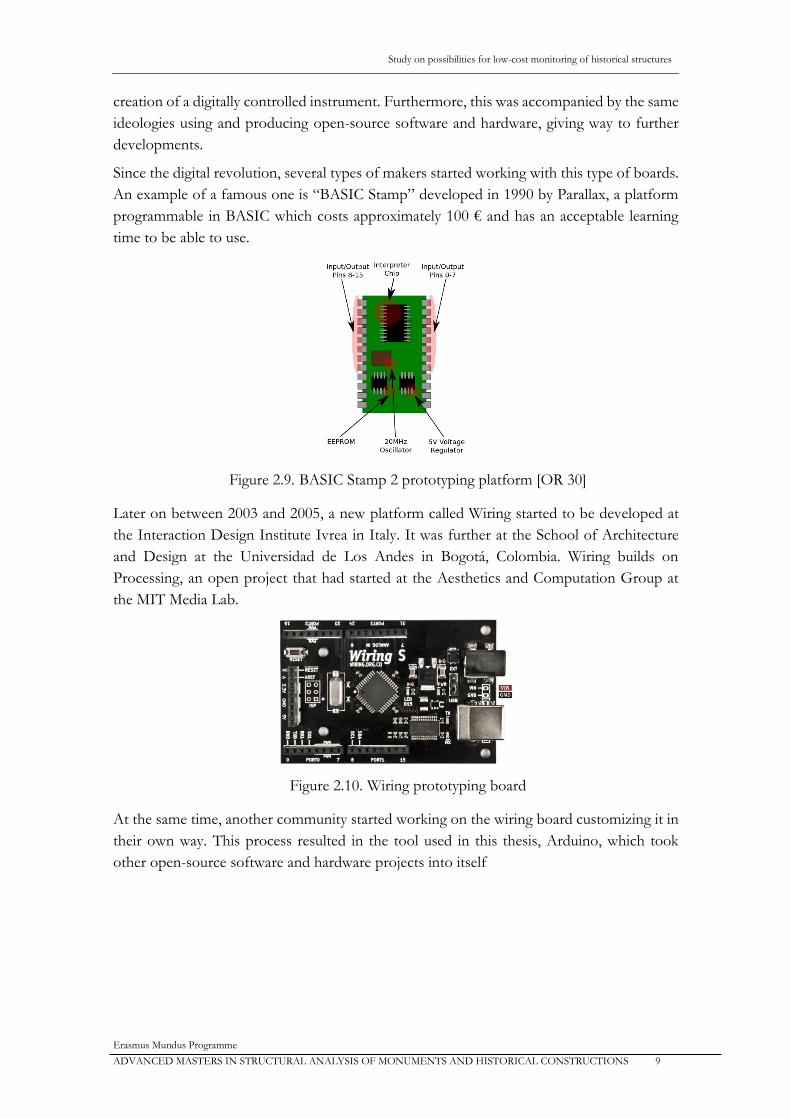
Since the digital revolution, several types of makers started working with this type of boards.
An example of a famous one is “BASIC Stamp” developed in 1990 by Parallax, a platform
programmable in BASIC which costs approximately 100 € and has an acceptable learning
time to be able to use.
Figure 2.9. BASIC Stamp 2 prototyping platform [OR 30]
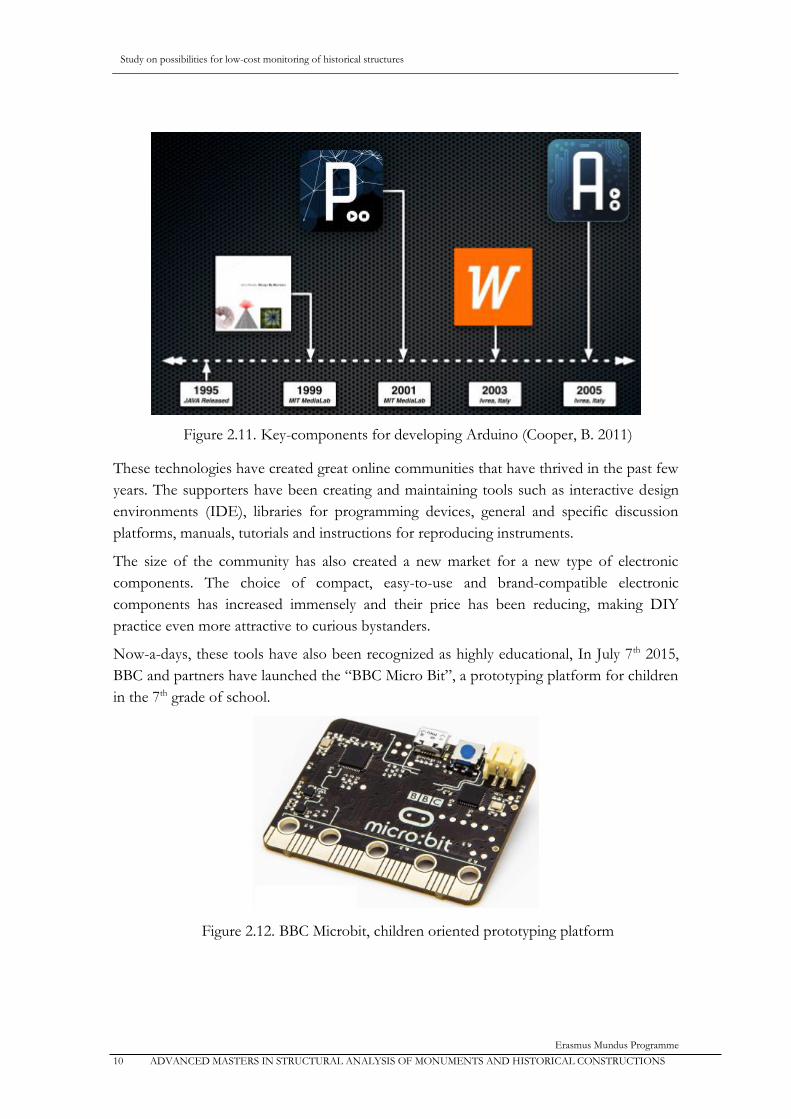
Later on between 2003 and 2005, a new platform called Wiring started to be developed at
the Interaction Design Institute Ivrea in Italy. It was further at the School of Architecture
and Design at the Universidad de Los Andes in Bogotá, Colombia. Wiring builds on
Processing, an open project that had started at the Aesthetics and Computation Group at
the MIT Media Lab.
Figure 2.10. Wiring prototyping board
At the same time, another community started working on the wiring board customizing it in
their own way. This process resulted in the tool used in this thesis, Arduino, which took
other open-source software and hardware projects into itself
Study on possibilities for low-cost monitoring of historical structures
Erasmus Mundus Programme
10 ADVANCED MASTERS IN STRUCTURAL ANALYSIS OF MONUMENTS AND HISTORICAL CONSTRUCTIONS
Figure 2.11. Key-components for developing Arduino (Cooper, B. 2011)
These technologies have created great online communities that have thrived in the past few
years. The supporters have been creating and maintaining tools such as interactive design
environments (IDE), libraries for programming devices, general and specific discussion
platforms, manuals, tutorials and instructions for reproducing instruments.
The size of the community has also created a new market for a new type of electronic
components. The choice of compact, easy-to-use and brand-compatible electronic
components has increased immensely and their price has been reducing, making DIY
practice even more attractive to curious bystanders.
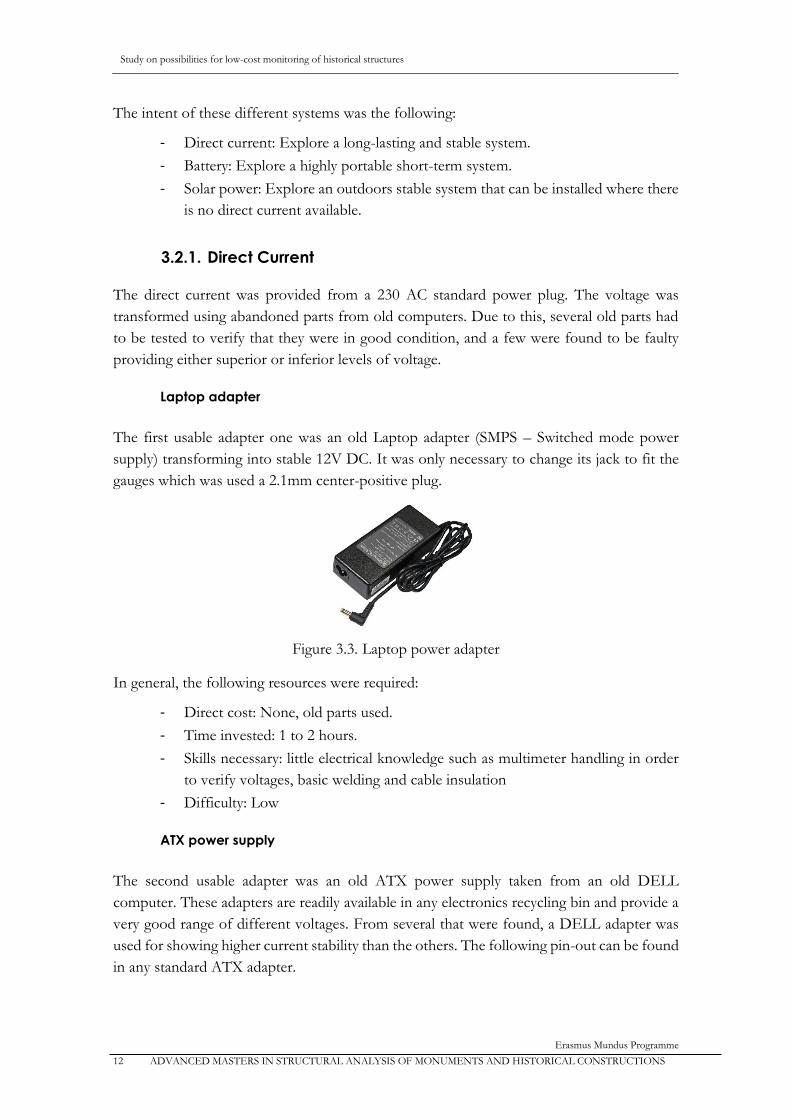
Now-a-days, these tools have also been recognized as highly educational, In July 7th 2015,
BBC and partners have launched the “BBC Micro Bit”, a prototyping platform for children
in the 7th grade of school.
Figure 2.12. BBC Microbit, children oriented prototyping platform

Study on possibilities for low-cost monitoring of historical structures
Erasmus Mundus Programme
ADVANCED MASTERS IN STRUCTURAL ANALYSIS OF MONUMENTS AND HISTORICAL CONSTRUCTIONS 11
Chapter 3. Possibilities for low-cost monitoring
3.1. Approach to the problem
In order to understand the different possibilities and make different combination of
components, the system of the monitoring system was divided as following:
Figure 3.1. Assumed division of a monitoring system
These groups intend to individually ensure the following demands:
- Energy supply: Ensure a power supply adequate for the electronic instruments.
- Measurements: Instruments that can interpret physical variations into a numerical
description
- Data Transmission: Systems that can log and bring the information to the user.
- Post-Processing: Transformation of the data into a more interpretable form.
In this study, post-processing was only mildly explored.
3.2. Energy Supply
In order to use electronic devices, it is necessary to power them with adequate voltage and
intensity.
Three different possibilities were made in an attempt to cover the most different possibilities,
without significantly increasing the difficulty and price of execution.
Figure 3.2. Explored energy supply possibilities
Study on possibilities for low-cost monitoring of historical structures
Erasmus Mundus Programme
12 ADVANCED MASTERS IN STRUCTURAL ANALYSIS OF MONUMENTS AND HISTORICAL CONSTRUCTIONS
The intent of these different systems was the following:
- Direct current: Explore a long-lasting and stable system.
- Battery: Explore a highly portable short-term system.
- Solar power: Explore an outdoors stable system that can be installed where there
is no direct current available.
3.2.1. Direct Current
The direct current was provided from a 230 AC standard power plug. The voltage was
transformed using abandoned parts from old computers. Due to this, several old parts had
to be tested to verify that they were in good condition, and a few were found to be faulty
providing either superior or inferior levels of voltage.
Laptop adapter
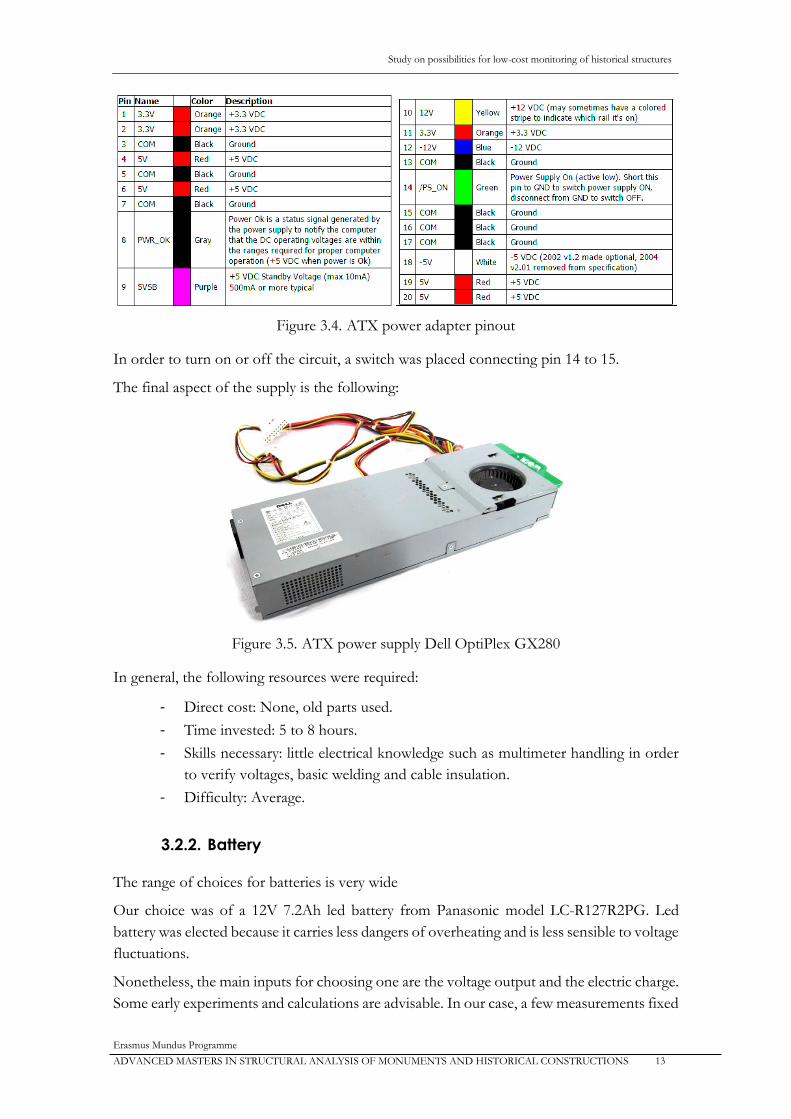
The first usable adapter one was an old Laptop adapter (SMPS – Switched mode power
supply) transforming into stable 12V DC. It was only necessary to change its jack to fit the
gauges which was used a 2.1mm center-positive plug.
Figure 3.3. Laptop power adapter
In general, the following resources were required:
- Direct cost: None, old parts used.
- Time invested: 1 to 2 hours.
- Skills necessary: little electrical knowledge such as multimeter handling in order
to verify voltages, basic welding and cable insulation
- Difficulty: Low
ATX power supply
The second usable adapter was an old ATX power supply taken from an old DELL
computer. These adapters are readily available in any electronics recycling bin and provide a
very good range of different voltages. From several that were found, a DELL adapter was
used for showing higher current stability than the others. The following pin-out can be found
in any standard ATX adapter.
Study on possibilities for low-cost monitoring of historical structures
Erasmus Mundus Programme
ADVANCED MASTERS IN STRUCTURAL ANALYSIS OF MONUMENTS AND HISTORICAL CONSTRUCTIONS 13
Figure 3.4. ATX power adapter pinout
In order to turn on or off the circuit, a switch was placed connecting pin 14 to 15.
The final aspect of the supply is the following:
Figure 3.5. ATX power supply Dell OptiPlex GX280
In general, the following resources were required:
- Direct cost: None, old parts used.
- Time invested: 5 to 8 hours.
- Skills necessary: little electrical knowledge such as multimeter handling in order
to verify voltages, basic welding and cable insulation.
- Difficulty: Average.
3.2.2. Battery
The range of choices for batteries is very wide
Our choice was of a 12V 7.2Ah led battery from Panasonic model LC-R127R2PG. Led
battery was elected because it carries less dangers of overheating and is less sensible to voltage
fluctuations.
Nonetheless, the main inputs for choosing one are the voltage output and the electric charge.
Some early experiments and calculations are advisable. In our case, a few measurements fixed

Study on possibilities for low-cost monitoring of historical structures
Erasmus Mundus Programme
14 ADVANCED MASTERS IN STRUCTURAL ANALYSIS OF MONUMENTS AND HISTORICAL CONSTRUCTIONS
an approximate maximum consumption of 100 mA, meaning the chosen battery could
theoretically last for approximately 72 hours.
Figure 3.6. Battery’s aspect and dimensions
In order to create a system in which batteries could be easily added in parallel, old ATX
cables were used.
Figure 3.7. Battery with ATX connection cable
In general, the following resources were required:
- Direct cost: 15€ + old ATX cables.
- Time invested: Neglectable.
- Skills necessary: little electrical knowledge such as multimeter handling in order
to verify voltages and cable insulation.
- Difficulty: Easy.
3.2.3. Solar System
Several possibilities are available for solar systems. The system selected was chosen for being
a good compromise between simplicity, effectiveness and cost. Specifically, the resources
necessary and time invested in assembly are a great benefit.
The system functions in a simple way. Energy is produced in the solar panel, which outputs
it to the charge controller at an unstable voltage and intensity. The charge controller then

Study on possibilities for low-cost monitoring of historical structures
Erasmus Mundus Programme
ADVANCED MASTERS IN STRUCTURAL ANALYSIS OF MONUMENTS AND HISTORICAL CONSTRUCTIONS 15
regulates this energy and delivers it to the battery at a steady rate, which is vital to keep the
battery operational. Then, from the battery, the power is drained and delivered at the required
voltage.
Figure 3.8. Components of the assembled solar system
In order to select the proper components, some simple calculations can be made using the
power consumption of the equipment (technically referred as load) and the time in which
the solar panel is expected to be charging or not. The charging parameters are very unstable,
so it’s advised to have some extra availability. Many more accurate estimations and tricks can
be found in literature or online [OR 1], but only the performed one is explained below.
The following variables are to be considered:
- VL: Load Voltage, In our case 9 to 12V
- IL: Load intensity (energy consumption), in our case measured to be under 100
mA
- TL: Time of operation of the Load, in our case 24h meaning always on.
- JL: Total energy spent in a day by the Load (V∙mA∙h)
- VB: Battery Voltage (V)
- BB: Battery Power bank (mA∙h)
- VSP: Solar Panel Voltage(V)
- ISP: Solar Panel Intensity (mA)
- JSP: Total energy produced in a day by the solar panel (V∙mA∙h)
- S: Approximate average of Sun-Hours during the day (h), assumed 12h.
- L: Loss due to several factors (mostly weather), 1.5 to 2.5 are generally used
values. In our case 2 was used.
In order to simplify the system, it was specified that VB =VL=12V
The total power spent in a day is then:
JL= VL ∙ IL ∙TL= 12∙100∙24 = 28800 V∙mA∙h

Study on possibilities for low-cost monitoring of historical structures
Erasmus Mundus Programme
16 ADVANCED MASTERS IN STRUCTURAL ANALYSIS OF MONUMENTS AND HISTORICAL CONSTRUCTIONS
This means, of course, that your solar system must produce at least this amount daily. It
should definitely have a safety margin.
Empirically, good results seem to have been achieved (several references online) using a solar
panel with voltage 150% of the battery, meaning:
VSP =1.5∙V B= 18V
The power produced by the solar panel comes:
JSP=VSP∙ISP∙S/L
Equaling the power produced to the power spent, JL=JSP:
28800=18∙ISP∙12/2 ISP= 266.6 mA
Thus meaning we need a solar panel capable of producing 266.6 mA or, equivalently, with a
power of 266.6∙18=4800 mW = 4.8W (Power = Voltage∙Intensity). In our case, because we
have already slightly overestimated the intensity of the gauge, a 5W solar panel was
considered acceptable.
Finally, the total capacity of the battery is necessary. The minimum is of course, the necessary
to resist the night, meaning it should bank the energy for
JB =VL ∙ IL ∙(24 - TL )
But, the existence of episodes of days with very little light is common, it is so advised to keep
a larger bank available, that could last for 2 or 3 days. Assuming 3 days:
JL (3 days) =VL ∙ IL ∙(24*3)= 12∙100∙72 = 86400 V∙mA∙h
BB = JL (3 days) /VB =57600/12= 7200 mA∙h
Note that, because our voltages of battery and load are equal, the equations could be
simplified.
The choice of charge controller should then adapt to all these results.
Due to limitation of availability in the market, it is advised to keep the used ratios for voltages
of VB =VL and VSP =1.5∙V B .
The assembled system is then composed by:
- Solar Panel (no brand) 18V, 277 mA (5 W)
- Charge Controller XSOURCE DC12V 20A with USB 5V LD358
- Panasonic 12V 7.2Ah led battery model LC-R127R2PG
The final aspect of the solar system is the following:

Study on possibilities for low-cost monitoring of historical structures
Erasmus Mundus Programme
ADVANCED MASTERS IN STRUCTURAL ANALYSIS OF MONUMENTS AND HISTORICAL CONSTRUCTIONS 17
Figure 3.9. Assembled solar system
Old ATX cables were used to connect the components in order to allow the parallel
connection of up to 3 solar panels and 3 batteries.
Figure 3.10. Charge controller with ATX cables
In general, the following resources were required:
- Direct cost:
o Solar Panel: 18€
o Charge Controller: 15€
o Battery: 15€
Total: 48€
o Old support to mount panel, old ATX cables
- Time invested: 12 hours of research, 4 hours of assembly and testing
- Skills necessary: Average electrical knowledge such as multimeter handling in
order to verify voltages, basic soldering and cable insulation.
- Difficulty: Average
Study on possibilities for low-cost monitoring of historical structures
Erasmus Mundus Programme
18 ADVANCED MASTERS IN STRUCTURAL ANALYSIS OF MONUMENTS AND HISTORICAL CONSTRUCTIONS
Figure 3.11. Solar panel seen from outside, oriented South.
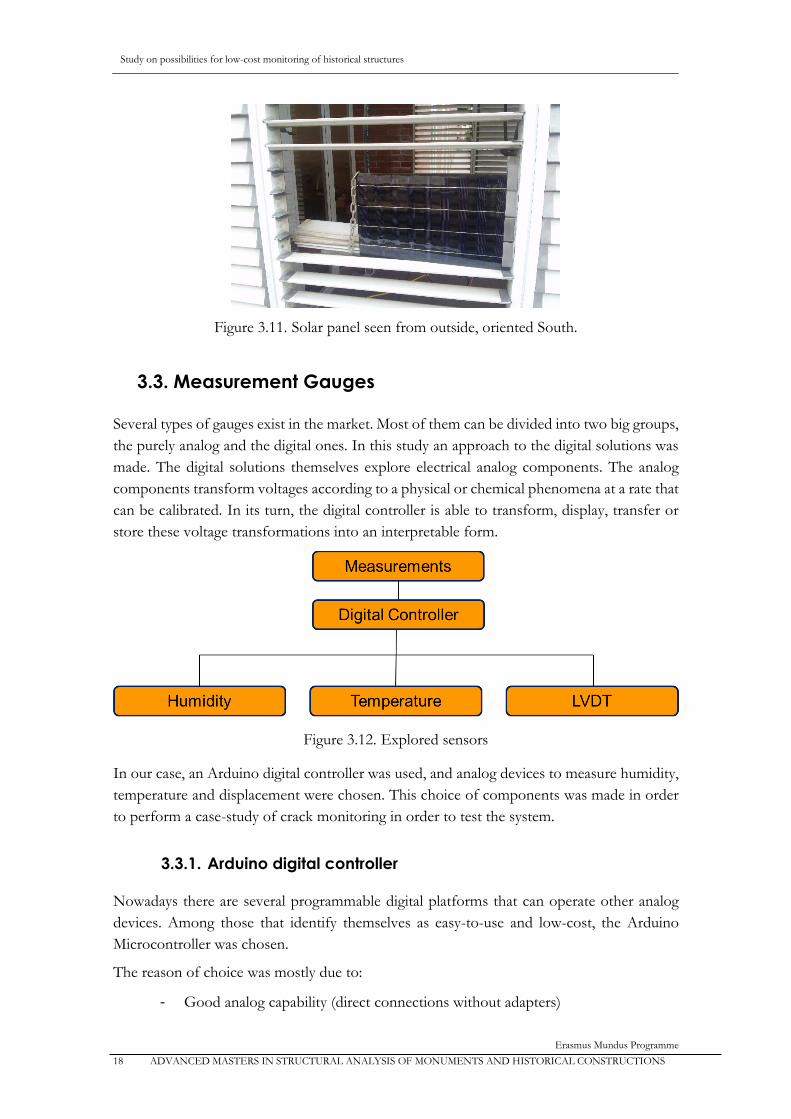
3.3. Measurement Gauges
Several types of gauges exist in the market. Most of them can be divided into two big groups,
the purely analog and the digital ones. In this study an approach to the digital solutions was
made. The digital solutions themselves explore electrical analog components. The analog
components transform voltages according to a physical or chemical phenomena at a rate that
can be calibrated. In its turn, the digital controller is able to transform, display, transfer or
store these voltage transformations into an interpretable form.
Figure 3.12. Explored sensors
In our case, an Arduino digital controller was used, and analog devices to measure humidity,
temperature and displacement were chosen. This choice of components was made in order
to perform a case-study of crack monitoring in order to test the system.
3.3.1. Arduino digital controller
Nowadays there are several programmable digital platforms that can operate other analog
devices. Among those that identify themselves as easy-to-use and low-cost, the Arduino
Microcontroller was chosen.
The reason of choice was mostly due to:
- Good analog capability (direct connections without adapters)

Study on possibilities for low-cost monitoring of historical structures
Erasmus Mundus Programme
ADVANCED MASTERS IN STRUCTURAL ANALYSIS OF MONUMENTS AND HISTORICAL CONSTRUCTIONS 19
- Great number of compatible analog devices.
- Multi-Platform, being possible to program from Windows, Mac OSX and Linux
- High quantity of tutorials and examples in the internet.
- Easy to program using C++ language
- Open-source and extensible hardware and software
- Direct material availability in the University’s Lab
Figure 3.13. Arduino Uno Rev 3 board
Although it is many times referenced as the best choice for an easy-to-use programmable
analog reader, there are good competitors. For example, Raspberry Pi which is not only a
microcontroller but a fully functioning computer with a competitive price, is one of the most
interesting alternatives being stated as a better post-acquisition data manager [OR 2]. It is
also possible to explore both potentials because they can be easily connected together.
Although not limiting a limiting factor for the devices created in this project, some of the
most indicated [OR 4] downsides of Arduino are:
- Low RAM and flash memory
- Limited IDE programing platform
- No debugging systems
The Arduino Uno rev3 is based on the ATmega328 chip [OR 5]. It has 14 digital
input/output pins (of which 6 can be used as PWM outputs, meaning they can simulate being
analog), 6 analog inputs, a 16 MHz ceramic resonator (processor), a USB connection (5 V),
a power jack (9 to 12 V), an ICSP header and a reset button [OR 6].
Study on possibilities for low-cost monitoring of historical structures
Erasmus Mundus Programme
20 ADVANCED MASTERS IN STRUCTURAL ANALYSIS OF MONUMENTS AND HISTORICAL CONSTRUCTIONS
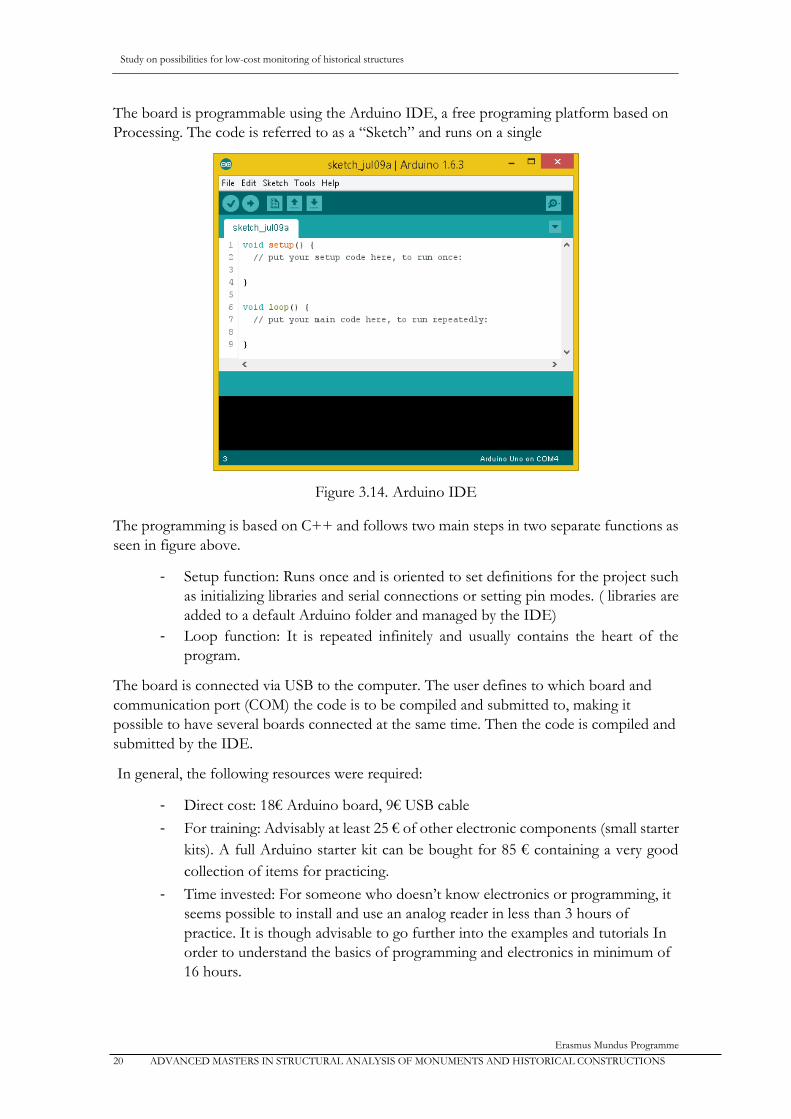
The board is programmable using the Arduino IDE, a free programing platform based on
Processing. The code is referred to as a “Sketch” and runs on a single
Figure 3.14. Arduino IDE
The programming is based on C++ and follows two main steps in two separate functions as
seen in figure above.
- Setup function: Runs once and is oriented to set definitions for the project such
as initializing libraries and serial connections or setting pin modes. ( libraries are
added to a default Arduino folder and managed by the IDE)
- Loop function: It is repeated infinitely and usually contains the heart of the
program.
The board is connected via USB to the computer. The user defines to which board and
communication port (COM) the code is to be compiled and submitted to, making it
possible to have several boards connected at the same time. Then the code is compiled and
submitted by the IDE.
In general, the following resources were required:
- Direct cost: 18€ Arduino board, 9€ USB cable
- For training: Advisably at least 25 € of other electronic components (small starter
kits). A full Arduino starter kit can be bought for 85 € containing a very good
collection of items for practicing.
- Time invested: For someone who doesn’t know electronics or programming, it
seems possible to install and use an analog reader in less than 3 hours of
practice. It is though advisable to go further into the examples and tutorials In
order to understand the basics of programming and electronics in minimum of
16 hours.

Study on possibilities for low-cost monitoring of historical structures
Erasmus Mundus Programme
ADVANCED MASTERS IN STRUCTURAL ANALYSIS OF MONUMENTS AND HISTORICAL CONSTRUCTIONS 21
3.3.2. Analog temperature sensor LM35
As one of the simplest temperature sensors, it is one of the most common, cheap and readily
available. It has the following characteristics:
- Manufacturer: Texas Instruments
- Direct Cost: <1€
- Time invested: 1 hour
- Range: -55 to 150 ºC
- Current: <60 μA
- Accuracy: ±0.75 ºC
- Knowledge required to operate: Basic wiring, basic programming
In our case, the range had to be limited to 0 to 150ºC in order to not provide negative voltage
to Arduino, which would damage its circuits.
It has three pins to be wired as follows:
- 1: VDD: 4 to 30 Volt power supply, in Arduino connects to 5V
- 2: Analog output signal, in Arduino connects to an analog receiver
- 3: Ground
Figure 3.15. LM35 temperature sensor
Because it is powered at 5V, the analog output signal is variable from 5 to 0 volts depending
on the temperature, which Arduino transforms into 0 to 1023. Then, from these Arduino-
transformed values, the following equation transforms the 0-1023 input (here referred as
Analog Val) to temperature in ºC:
𝑇𝑒𝑚𝑝𝑒𝑟𝑎𝑡𝑢𝑟𝑒 =𝐴𝑛𝑎𝑙𝑜𝑔 𝑉𝑎𝑙 × 500
1024

Study on possibilities for low-cost monitoring of historical structures
Erasmus Mundus Programme
22 ADVANCED MASTERS IN STRUCTURAL ANALYSIS OF MONUMENTS AND HISTORICAL CONSTRUCTIONS
3.3.3. Humidity and temperature sensor DHT22
It is an overall good sensor with a digital response at a good price. It is common and easy to
find and can also be referred as the AM2302.
It has the following characteristics:
- Manufacturer: Aosong(Guangzhou) Electronics Co.,Ltd
- Direct cost: 10€
- Time invested: 2 hours
- Range: -40 to 80 ºC , 0-100%RH
- Current:
o datasheet: 1-1.5 mA
o Measured: 0.040 mA in standby, 1.6 mA while reading (≈1/12 of the time)
- Accuracy: ±0.5 ºC , ±2.5%RH between 10-90%RH and ±5%RH at extremes
- Knowledge required to operate: Basic wiring, basic programming including
library managing.
Figure 3.16. DHT22 Humidity and temperature sensor
It has four pins to be wired as follows:
- 1: VDD: 3.3 to 5.5 Volt power supply, recommended 5V
- 2: Digital Data signal, in Arduino connects to a digital port
- 3: NC (empty)
- 4: Ground
In order to manage the digital information outputted by the sensor, it is advised to use one
of several C++ libraries available online. In our case an Arduino library written by Mark
Ruys, downloadable at [OR 7]. The measurements can then be obtained using simple
commands as can be seen in the codes for the produced devices.
Study on possibilities for low-cost monitoring of historical structures
Erasmus Mundus Programme
ADVANCED MASTERS IN STRUCTURAL ANALYSIS OF MONUMENTS AND HISTORICAL CONSTRUCTIONS 23
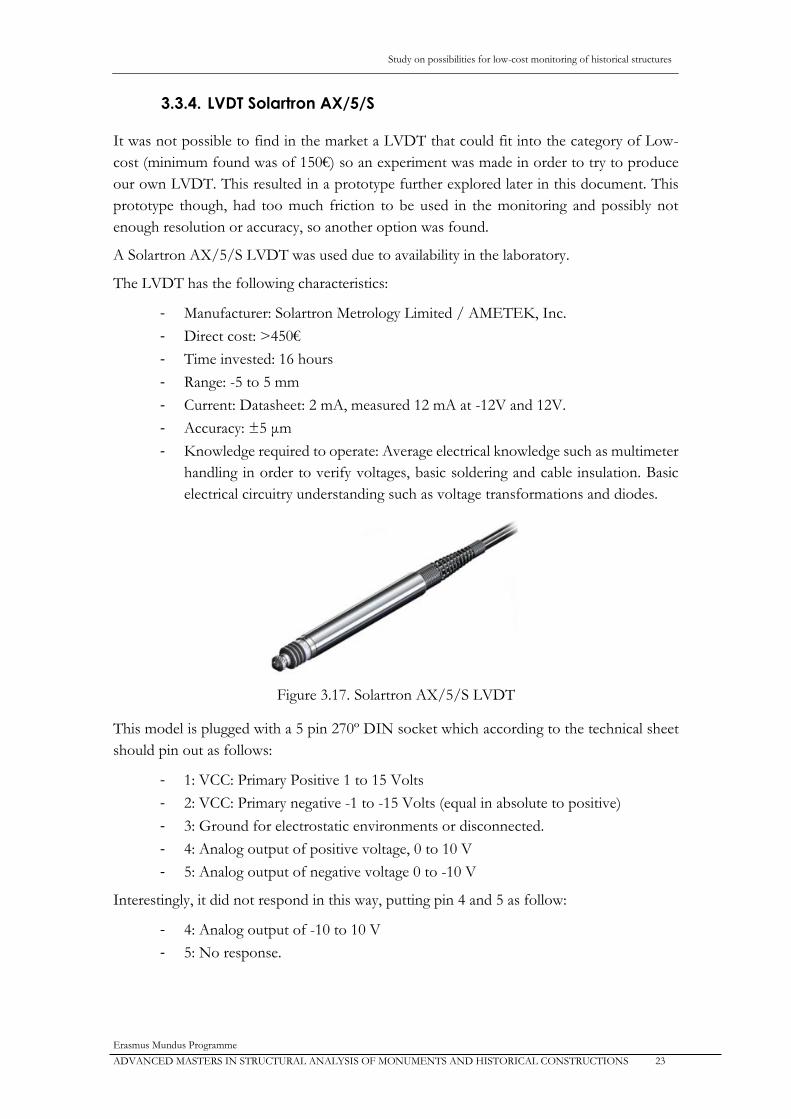
3.3.4. LVDT Solartron AX/5/S
It was not possible to find in the market a LVDT that could fit into the category of Low-
cost (minimum found was of 150€) so an experiment was made in order to try to produce
our own LVDT. This resulted in a prototype further explored later in this document. This
prototype though, had too much friction to be used in the monitoring and possibly not
enough resolution or accuracy, so another option was found.
A Solartron AX/5/S LVDT was used due to availability in the laboratory.
The LVDT has the following characteristics:
- Manufacturer: Solartron Metrology Limited / AMETEK, Inc.
- Direct cost: >450€
- Time invested: 16 hours
- Range: -5 to 5 mm
- Current: Datasheet: 2 mA, measured 12 mA at -12V and 12V.
- Accuracy: ±5 μm
- Knowledge required to operate: Average electrical knowledge such as multimeter
handling in order to verify voltages, basic soldering and cable insulation. Basic
electrical circuitry understanding such as voltage transformations and diodes.
Figure 3.17. Solartron AX/5/S LVDT
This model is plugged with a 5 pin 270º DIN socket which according to the technical sheet
should pin out as follows:
- 1: VCC: Primary Positive 1 to 15 Volts
- 2: VCC: Primary negative -1 to -15 Volts (equal in absolute to positive)
- 3: Ground for electrostatic environments or disconnected.
- 4: Analog output of positive voltage, 0 to 10 V
- 5: Analog output of negative voltage 0 to -10 V
Interestingly, it did not respond in this way, putting pin 4 and 5 as follow:
- 4: Analog output of -10 to 10 V
- 5: No response.

Study on possibilities for low-cost monitoring of historical structures
Erasmus Mundus Programme
24 ADVANCED MASTERS IN STRUCTURAL ANALYSIS OF MONUMENTS AND HISTORICAL CONSTRUCTIONS
Because the Arduino cannot absorb negative voltage, it was protected using a diode and so,
only the positive voltages were read. In fact, the usage of half of the range (5 mm) was
considered enough to monitor a crack.
Also, because the Arduino analog ports can only receive a maximum voltage of 5V, it had to
be transformed into half. This was done using a voltage divider (more specifically a resistive
divider) with the following scheme [OR 8]:
Figure 3.18. Resistive divider
In this case, Vin connects to pin 4 of the LVDT and Vout connects to Arduino. This voltage
divider is governed by the following equation:
𝑉𝑂𝑈𝑇 = 𝑉𝐼𝑁
𝑅2
𝑅1 + 𝑅2
Which can be simplified to R1 = R2 if we want to divide the voltage in half, as is in our case.
So, two 10 kΩ resistors were used for R1 and R2.
3.4. Data transfer
This chapter refers to the organization and transportation of the acquired data from the
instrument to a personal computer. The Arduino board has a readily available data transfer
system by USB but other possibilities were explored. In order to focus on the most practical
aspects, systems were thought for transferring data to a personal computer, although they
could be easily tweaked to reach other devices such as cellphones or tablets.
In this study, the following options were studied:
Figure 3.19. Explored data management possibilities
Study on possibilities for low-cost monitoring of historical structures
Erasmus Mundus Programme
ADVANCED MASTERS IN STRUCTURAL ANALYSIS OF MONUMENTS AND HISTORICAL CONSTRUCTIONS 25
The Bluetooth connection was explored for being one of the cheapest wireless possibilities.
The xBee technology was studied for providing a very good range and the possibility of an
easy to use grid of devices that intercommunicate. Finally, the SD storage card was chosen
in order to be the most portable and independent possibility.
Other interesting possible options that were not explored are for example Wi-Fi connections,
Ethernet connections and 3G or GPRS connection which can provide direct data transfer
to a LAN or directly to the internet. If connected by Ethernet or Wi-Fi, it is also possible to
access the contents of an SD card directly.
3.4.1. Bluetooth HC-06 Module
At the time of this study, most of the Arduino compatible Bluetooth modems available are
based in the HC-05 and HC-06 modems. The main difference between them is that HC-05
can be configured to be master or slave in the connection and the HC-06 must be slave. This
limitation comes along with the benefit of being cheaper. This particular modem was chosen
due to availability of online tutorials, price and market availability.
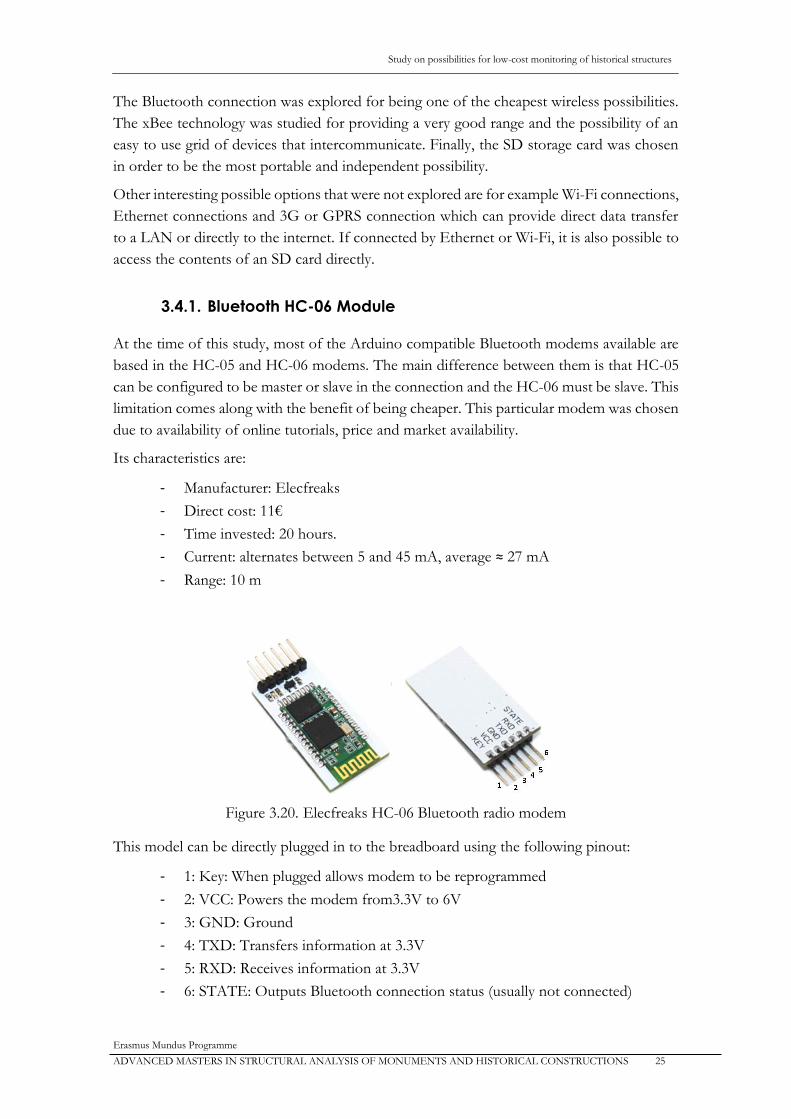
Its characteristics are:
- Manufacturer: Elecfreaks
- Direct cost: 11€
- Time invested: 20 hours.
- Current: alternates between 5 and 45 mA, average ≈ 27 mA
- Range: 10 m
Figure 3.20. Elecfreaks HC-06 Bluetooth radio modem
This model can be directly plugged in to the breadboard using the following pinout:
- 1: Key: When plugged allows modem to be reprogrammed
- 2: VCC: Powers the modem from3.3V to 6V
- 3: GND: Ground
- 4: TXD: Transfers information at 3.3V
- 5: RXD: Receives information at 3.3V
- 6: STATE: Outputs Bluetooth connection status (usually not connected)
Study on possibilities for low-cost monitoring of historical structures
Erasmus Mundus Programme
26 ADVANCED MASTERS IN STRUCTURAL ANALYSIS OF MONUMENTS AND HISTORICAL CONSTRUCTIONS
Because Arduino’s digital ports are powered at 5V when emitting, the port that is transferring
information to the modem (connected to RXD), must have its voltage transformed to 3.3V.
In this case, VIN connects to the Arduino emitting port and VOUT to HC-06’s Rxd. In our
case, a resistor of 10 kΩ was assumed for R2 thus calculating R2 as following:
𝑉𝑂𝑈𝑇 = 𝑉𝐼𝑁
𝑅2
𝑅1 + 𝑅2↔ 3.3 = 5
10
𝑅2 + 10↔ 𝑅2 = 5 𝑘𝛺
Because no 5kΩ were available, a sum of a 4700Ω and a 220Ω resistors was considerate
adequate and proved to work.
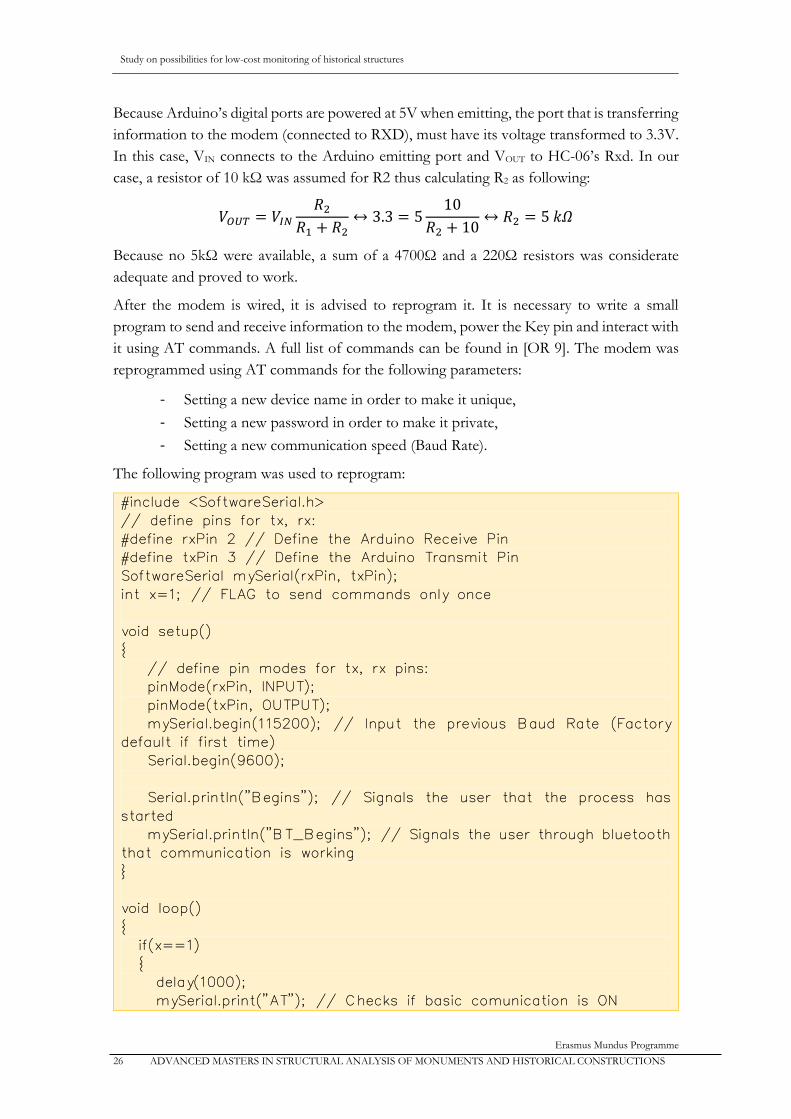
After the modem is wired, it is advised to reprogram it. It is necessary to write a small
program to send and receive information to the modem, power the Key pin and interact with
it using AT commands. A full list of commands can be found in [OR 9]. The modem was
reprogrammed using AT commands for the following parameters:
- Setting a new device name in order to make it unique,
- Setting a new password in order to make it private,
- Setting a new communication speed (Baud Rate).
The following program was used to reprogram:
#include <SoftwareSerial.h>
// define pins for tx, rx:
#define rxPin 2 // Define the Arduino Receive Pin
#define txPin 3 // Define the Arduino Transmit Pin
SoftwareSerial mySerial(rxPin, txPin);
int x=1; // FLAG to send commands only once
void setup()
{
// define pin modes for tx, rx pins:
pinMode(rxPin, INPUT);
pinMode(txPin, OUTPUT);
mySerial.begin(115200); // Input the previous Baud Rate (Factory
default if first time)
Serial.begin(9600);
Serial.println("Begins"); // Signals the user that the process has
started
mySerial.println("BT_Begins"); // Signals the user through bluetooth
that communication is working
}
void loop()
{
if(x==1)
{
delay(1000);
mySerial.print("AT"); // Checks if basic comunication is ON
Study on possibilities for low-cost monitoring of historical structures
Erasmus Mundus Programme
ADVANCED MASTERS IN STRUCTURAL ANALYSIS OF MONUMENTS AND HISTORICAL CONSTRUCTIONS 27
delay(1000);
mySerial.print("AT+VERSION"); // Ask for version
delay(1000);
mySerial.print("AT+PIN4444"); // Set pin to 4444
delay(1000);
mySerial.print("AT+NAMESAHC-HC06"); // Set the name to
"SAHC-HC06"
delay(1000);
mySerial.print("AT+BAUD4"); // Set baud Rate to 9600
delay(1000);
x=0;
}
}
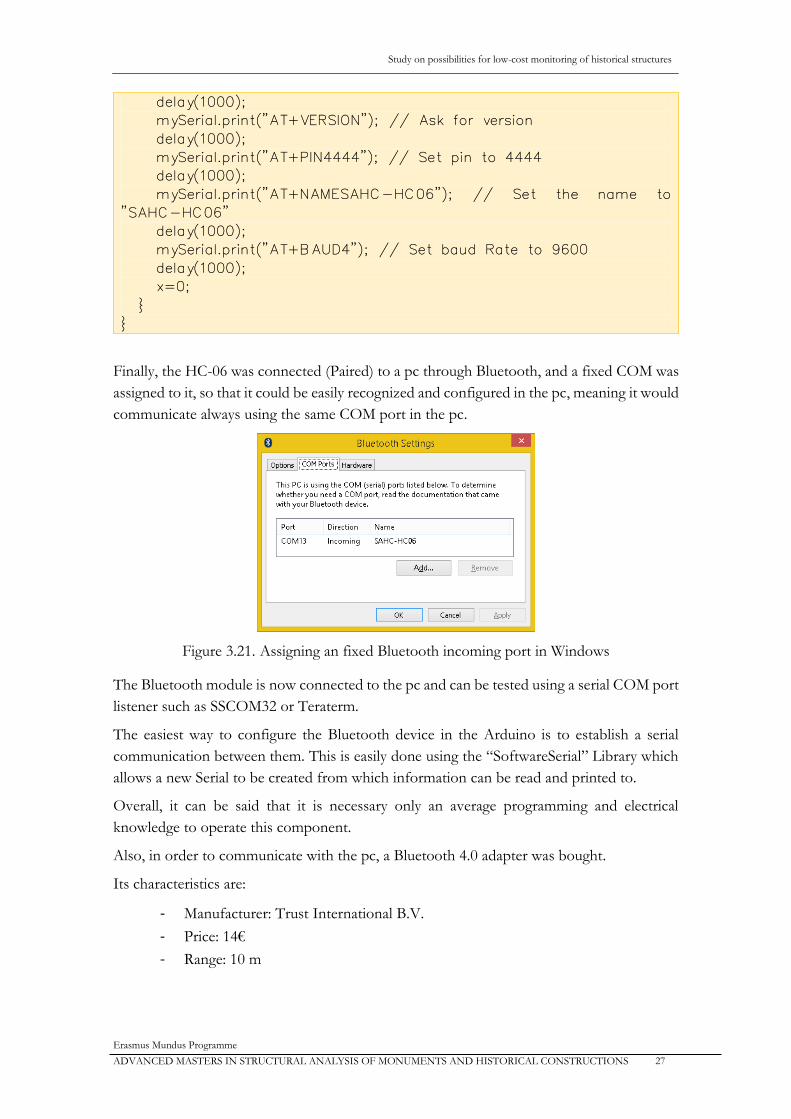
Finally, the HC-06 was connected (Paired) to a pc through Bluetooth, and a fixed COM was
assigned to it, so that it could be easily recognized and configured in the pc, meaning it would
communicate always using the same COM port in the pc.
Figure 3.21. Assigning an fixed Bluetooth incoming port in Windows
The Bluetooth module is now connected to the pc and can be tested using a serial COM port
listener such as SSCOM32 or Teraterm.
The easiest way to configure the Bluetooth device in the Arduino is to establish a serial
communication between them. This is easily done using the “SoftwareSerial” Library which
allows a new Serial to be created from which information can be read and printed to.
Overall, it can be said that it is necessary only an average programming and electrical
knowledge to operate this component.
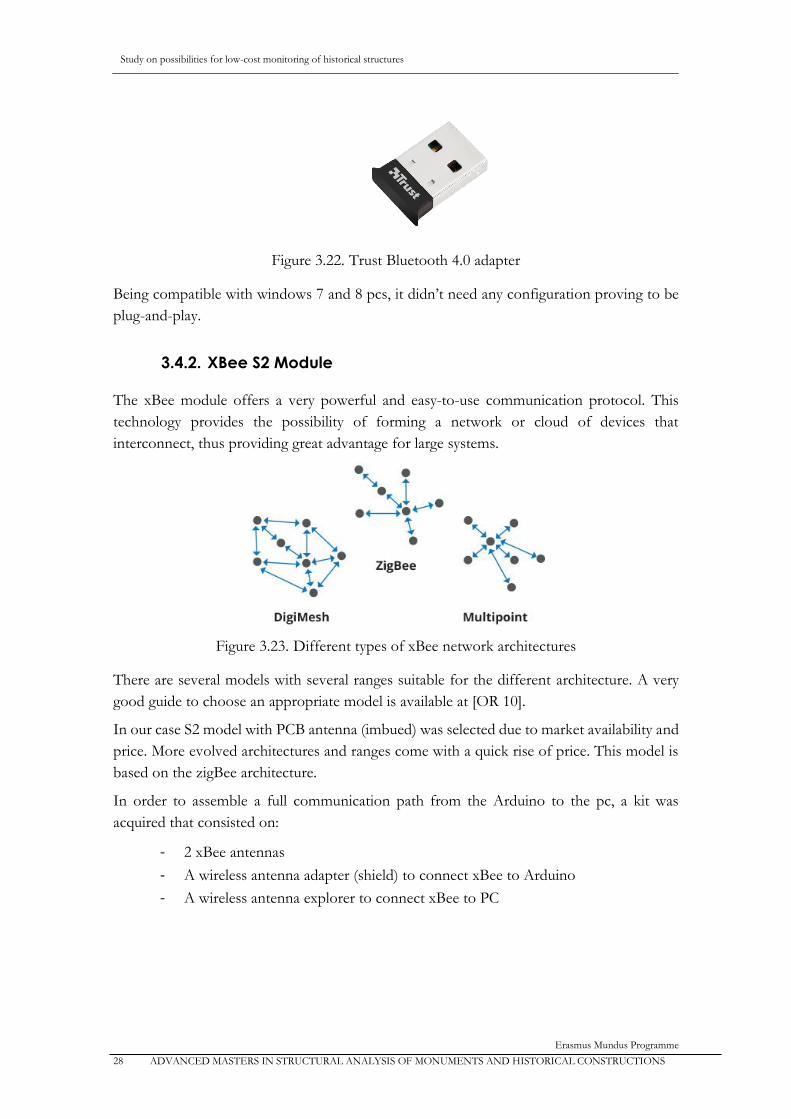
Also, in order to communicate with the pc, a Bluetooth 4.0 adapter was bought.
Its characteristics are:
- Manufacturer: Trust International B.V.
- Price: 14€
- Range: 10 m
Study on possibilities for low-cost monitoring of historical structures
Erasmus Mundus Programme
28 ADVANCED MASTERS IN STRUCTURAL ANALYSIS OF MONUMENTS AND HISTORICAL CONSTRUCTIONS
Figure 3.22. Trust Bluetooth 4.0 adapter
Being compatible with windows 7 and 8 pcs, it didn’t need any configuration proving to be
plug-and-play.
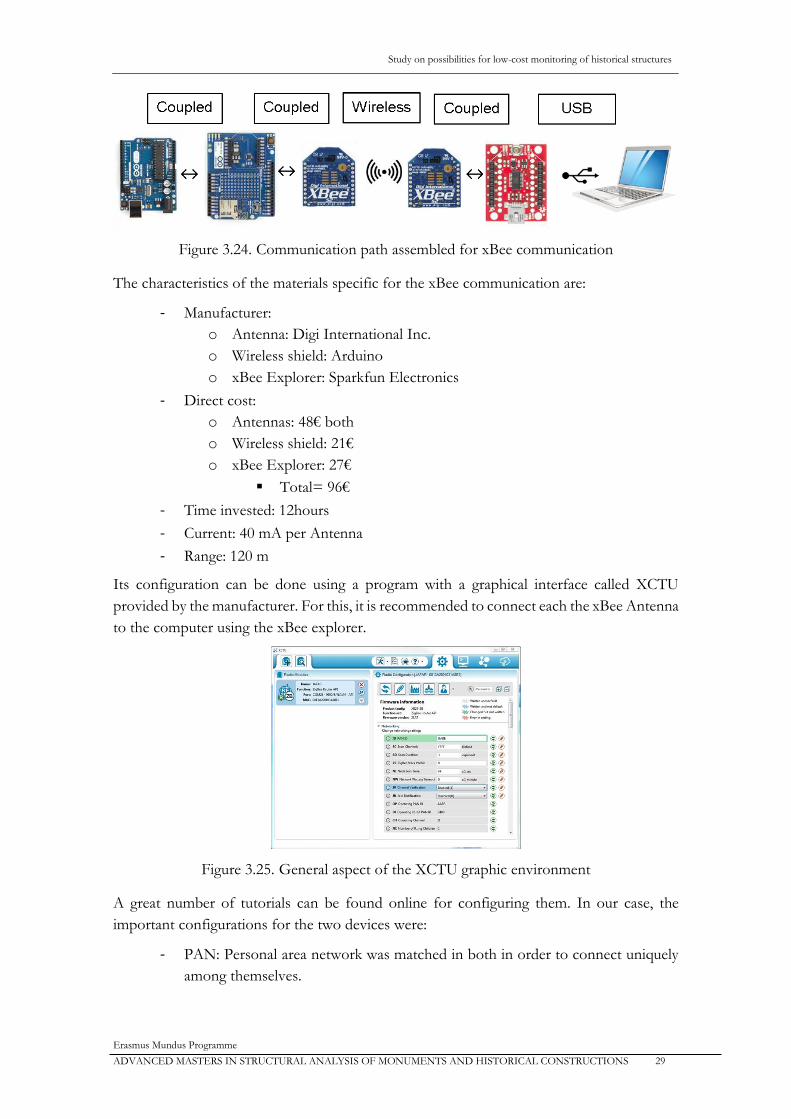
3.4.2. XBee S2 Module
The xBee module offers a very powerful and easy-to-use communication protocol. This
technology provides the possibility of forming a network or cloud of devices that
interconnect, thus providing great advantage for large systems.
Figure 3.23. Different types of xBee network architectures
There are several models with several ranges suitable for the different architecture. A very
good guide to choose an appropriate model is available at [OR 10].
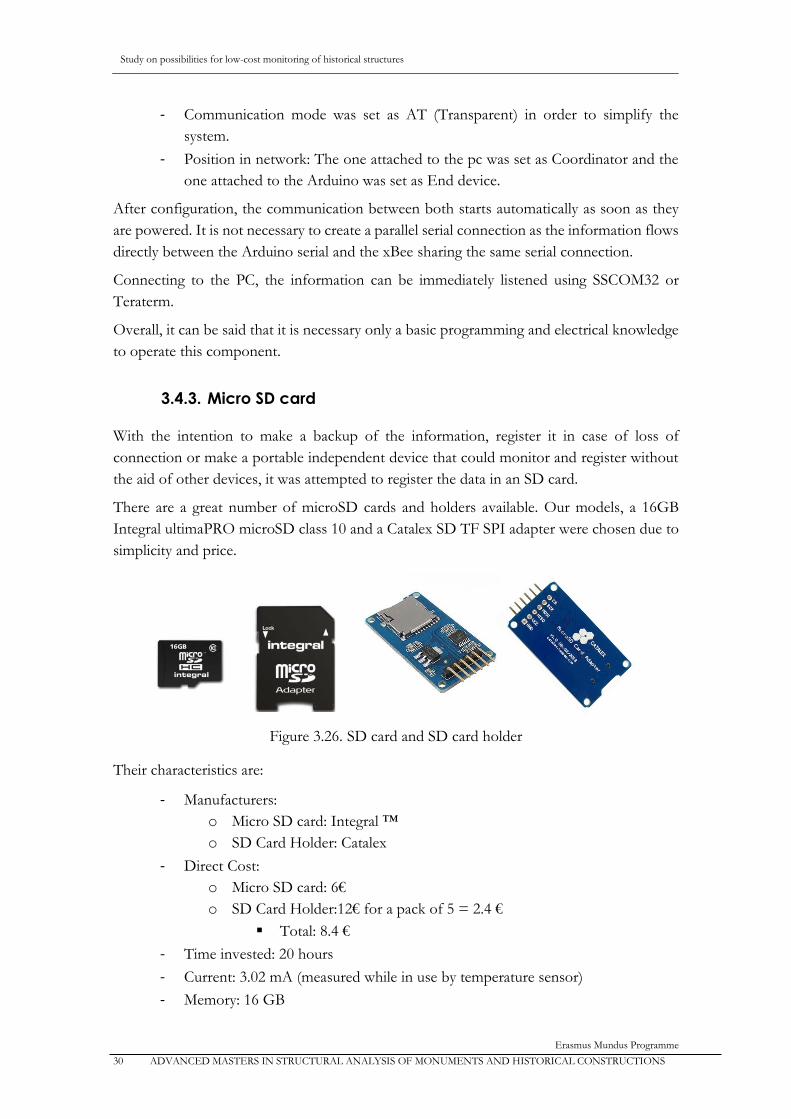
In our case S2 model with PCB antenna (imbued) was selected due to market availability and
price. More evolved architectures and ranges come with a quick rise of price. This model is
based on the zigBee architecture.
In order to assemble a full communication path from the Arduino to the pc, a kit was
acquired that consisted on:
- 2 xBee antennas
- A wireless antenna adapter (shield) to connect xBee to Arduino
- A wireless antenna explorer to connect xBee to PC
Study on possibilities for low-cost monitoring of historical structures
Erasmus Mundus Programme
ADVANCED MASTERS IN STRUCTURAL ANALYSIS OF MONUMENTS AND HISTORICAL CONSTRUCTIONS 29
Figure 3.24. Communication path assembled for xBee communication
The characteristics of the materials specific for the xBee communication are:
- Manufacturer:
o Antenna: Digi International Inc.
o Wireless shield: Arduino
o xBee Explorer: Sparkfun Electronics
- Direct cost:
o Antennas: 48€ both
o Wireless shield: 21€
o xBee Explorer: 27€
Total= 96€
- Time invested: 12hours
- Current: 40 mA per Antenna
- Range: 120 m
Its configuration can be done using a program with a graphical interface called XCTU
provided by the manufacturer. For this, it is recommended to connect each the xBee Antenna
to the computer using the xBee explorer.
Figure 3.25. General aspect of the XCTU graphic environment
A great number of tutorials can be found online for configuring them. In our case, the
important configurations for the two devices were:
- PAN: Personal area network was matched in both in order to connect uniquely
among themselves.
Study on possibilities for low-cost monitoring of historical structures
Erasmus Mundus Programme
30 ADVANCED MASTERS IN STRUCTURAL ANALYSIS OF MONUMENTS AND HISTORICAL CONSTRUCTIONS
- Communication mode was set as AT (Transparent) in order to simplify the
system.
- Position in network: The one attached to the pc was set as Coordinator and the
one attached to the Arduino was set as End device.
After configuration, the communication between both starts automatically as soon as they
are powered. It is not necessary to create a parallel serial connection as the information flows
directly between the Arduino serial and the xBee sharing the same serial connection.
Connecting to the PC, the information can be immediately listened using SSCOM32 or
Teraterm.
Overall, it can be said that it is necessary only a basic programming and electrical knowledge
to operate this component.
3.4.3. Micro SD card
With the intention to make a backup of the information, register it in case of loss of
connection or make a portable independent device that could monitor and register without
the aid of other devices, it was attempted to register the data in an SD card.
There are a great number of microSD cards and holders available. Our models, a 16GB
Integral ultimaPRO microSD class 10 and a Catalex SD TF SPI adapter were chosen due to
simplicity and price.
Figure 3.26. SD card and SD card holder
Their characteristics are:
- Manufacturers:
o Micro SD card: Integral ™
o SD Card Holder: Catalex
- Direct Cost:
o Micro SD card: 6€
o SD Card Holder:12€ for a pack of 5 = 2.4 €
Total: 8.4 €
- Time invested: 20 hours
- Current: 3.02 mA (measured while in use by temperature sensor)
- Memory: 16 GB
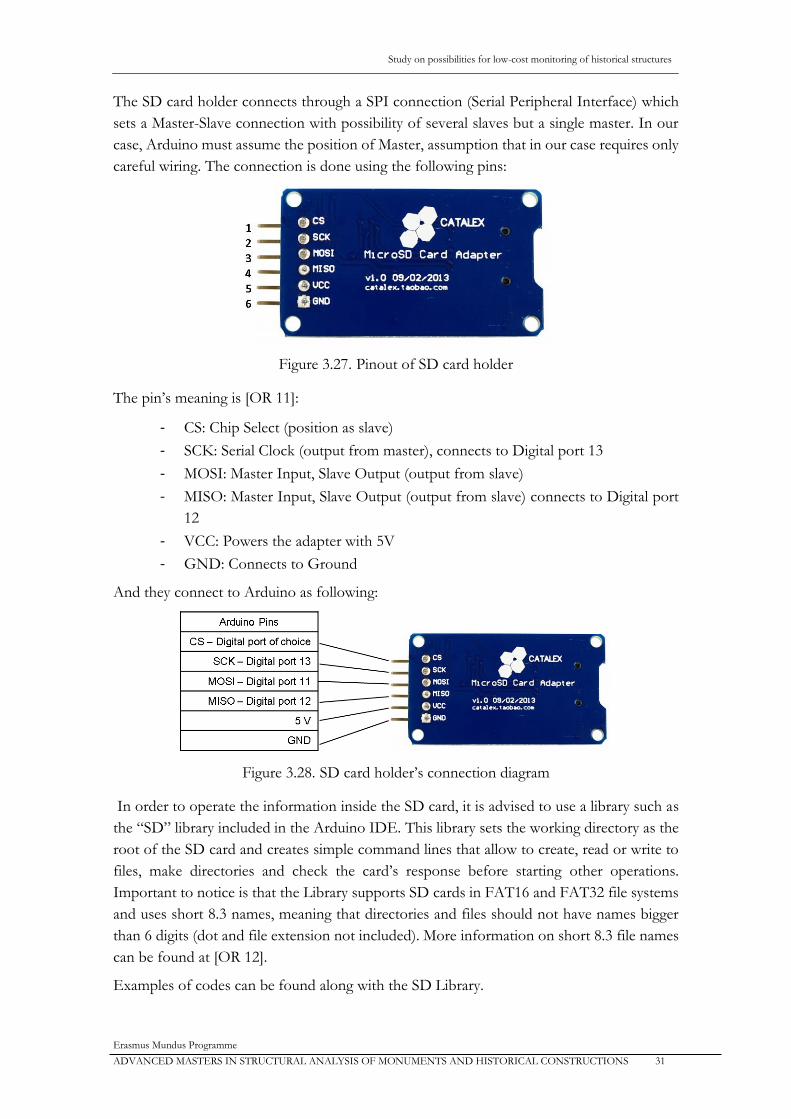
Study on possibilities for low-cost monitoring of historical structures
Erasmus Mundus Programme
ADVANCED MASTERS IN STRUCTURAL ANALYSIS OF MONUMENTS AND HISTORICAL CONSTRUCTIONS 31
The SD card holder connects through a SPI connection (Serial Peripheral Interface) which
sets a Master-Slave connection with possibility of several slaves but a single master. In our
case, Arduino must assume the position of Master, assumption that in our case requires only
careful wiring. The connection is done using the following pins:
Figure 3.27. Pinout of SD card holder
The pin’s meaning is [OR 11]:
- CS: Chip Select (position as slave)
- SCK: Serial Clock (output from master), connects to Digital port 13
- MOSI: Master Input, Slave Output (output from slave)
- MISO: Master Input, Slave Output (output from slave) connects to Digital port
12
- VCC: Powers the adapter with 5V
- GND: Connects to Ground
And they connect to Arduino as following:
Figure 3.28. SD card holder’s connection diagram
In order to operate the information inside the SD card, it is advised to use a library such as
the “SD” library included in the Arduino IDE. This library sets the working directory as the
root of the SD card and creates simple command lines that allow to create, read or write to
files, make directories and check the card’s response before starting other operations.
Important to notice is that the Library supports SD cards in FAT16 and FAT32 file systems
and uses short 8.3 names, meaning that directories and files should not have names bigger
than 6 digits (dot and file extension not included). More information on short 8.3 file names
can be found at [OR 12].
Examples of codes can be found along with the SD Library.

Study on possibilities for low-cost monitoring of historical structures
Erasmus Mundus Programme
32 ADVANCED MASTERS IN STRUCTURAL ANALYSIS OF MONUMENTS AND HISTORICAL CONSTRUCTIONS
Overall, it can be said that it is necessary only an average programming and electrical
knowledge to operate this component.
3.5. Data management
What data to store and how to store it makes a huge difference in how easy is to interpret it
and how useful. In this chapter several problems and decisions are approached.
3.5.1. File and data format
The rate of the readings, the amount of data per file and any primary treatment of the data
are defined inside the Arduino program. Using the three following variables declared in the
beginning of all the Arduino programs its possible to set:
- “int AverageNumber”: Makes a reading from an average of read values. Very
useful for unstable sensors.
- “int DelayReadings”: Sets the time separation between readings in milliseconds
- “int ReadingsPerFile”: Sets the total number of readings inside each file
In our case, additional data treatments were done such as transforming the analog values into
temperature or distances, thus reducing the amount of post-processing operations necessary.
The file format selected was CSV (comma separated values), which provide a quick matrix-
like data format. It is also a file format compatible with many table and graphing programs.
One reading is equivalent to a row and each type of value has its own column.
For example, here is the information outputted for 7 readings of date, time, running time,
random value 0-50, temperature reading through LM35, temperature reading through
DHT22, humidity reading through DHT 22.
20150607;180657;176439909;41;31.25;28.70;40.70
20150607;180700;176442972;34;30.27;28.70;40.70
20150607;180703;176446034;0;30.27;28.70;40.70
20150607;180706;176449117;33;31.25;28.70;40.70
20150607;180709;176452179;23;31.74;28.70;40.70
20150607;180712;176455242;49;31.74;28.70;40.80
20150607;180715;176458305;37;29.79;28.70;40.80
Also, no beginning or end of file information was added in order not to create discontinuities
which could require more post-processing work.
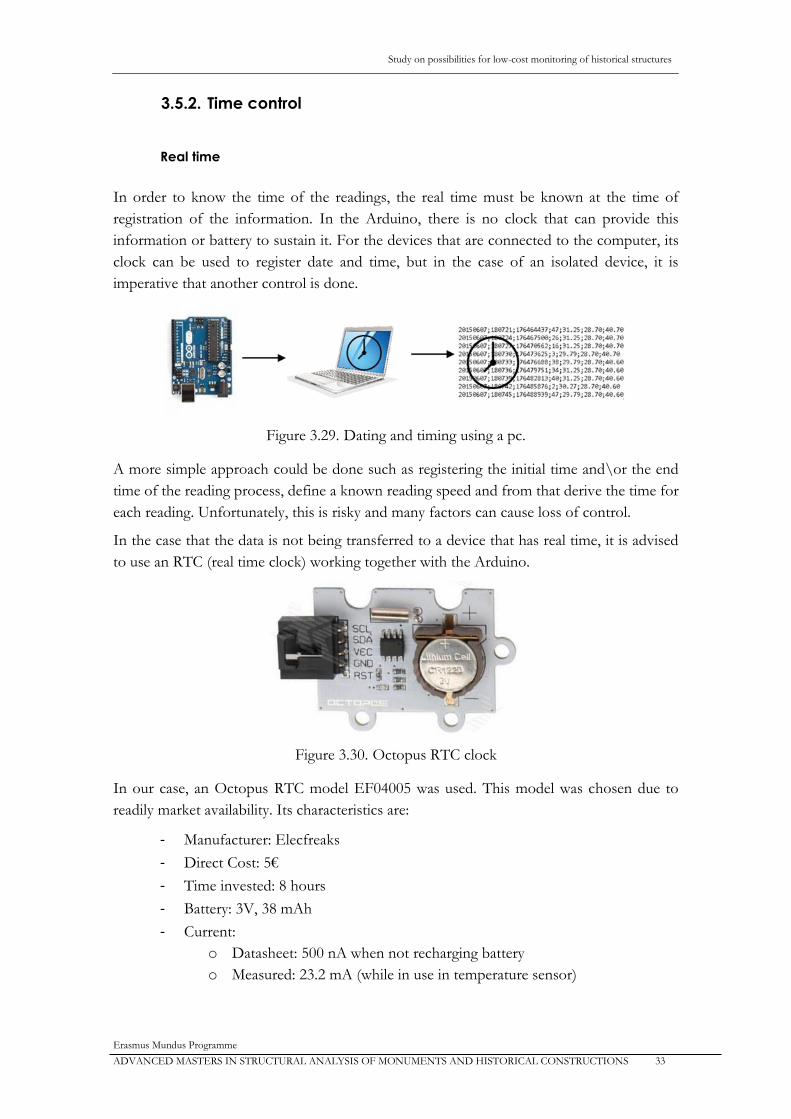
Study on possibilities for low-cost monitoring of historical structures
Erasmus Mundus Programme
ADVANCED MASTERS IN STRUCTURAL ANALYSIS OF MONUMENTS AND HISTORICAL CONSTRUCTIONS 33
3.5.2. Time control
Real time
In order to know the time of the readings, the real time must be known at the time of
registration of the information. In the Arduino, there is no clock that can provide this
information or battery to sustain it. For the devices that are connected to the computer, its
clock can be used to register date and time, but in the case of an isolated device, it is
imperative that another control is done.
Figure 3.29. Dating and timing using a pc.
A more simple approach could be done such as registering the initial time and\or the end
time of the reading process, define a known reading speed and from that derive the time for
each reading. Unfortunately, this is risky and many factors can cause loss of control.
In the case that the data is not being transferred to a device that has real time, it is advised
to use an RTC (real time clock) working together with the Arduino.
Figure 3.30. Octopus RTC clock
In our case, an Octopus RTC model EF04005 was used. This model was chosen due to
readily market availability. Its characteristics are:
- Manufacturer: Elecfreaks
- Direct Cost: 5€
- Time invested: 8 hours
- Battery: 3V, 38 mAh
- Current:
o Datasheet: 500 nA when not recharging battery
o Measured: 23.2 mA (while in use in temperature sensor)

Study on possibilities for low-cost monitoring of historical structures
Erasmus Mundus Programme
34 ADVANCED MASTERS IN STRUCTURAL ANALYSIS OF MONUMENTS AND HISTORICAL CONSTRUCTIONS
The clock communicates using I2C (Inter-Integrated Circuit) protocol [OR 13] and as such,
connects with the following pinout:
- SCL: Clock Signal
- SDA: Data Signal
- VCC: Powers the clock with 3.3 to 5V
- GND: Connects to ground
- RST: Square wave output interface (Unplugged in our case)
Following the manufacturer’s instructions [OR 14], the clock was plugged as following:
- SCL: Connects to Analog port 4
- SDA: Connects to Analog port 5
- VCC: Connects to 5V
- GND: Connects to Ground
There are several types of technology for micro-controlled real time clocks. In this case, it is
based on DS1307 clock chip for which there is a good library [OR 15] that makes it easier to
use. Along with the library examples can be found to synchronize the clock with the PC (only
needs to be done once and then the battery keeps the correct time counting), and examples
of how to read the time from the clock.
There are several techniques and commands to acquire time. In Our case, using the Time
Library, a time variable is created at a certain instant and its value fixed reading information
from the clock. The values of Year, Month, Day, Hour, Minute and Second can then be
calculated by processing this variable.
Figure 3.31. Dating and timing using RTC
Also, in order for the time to follow an alphabetical order and for the readings to be easily
chronologically organized, it is advised to always print the dates and time with the same
number of digits.
Local Arduino time
In order to understand the continuity of the readings and functioning of the device, it is
advised to store the local clock time (using the command millis() in the Arduino) which will
register any restart or loss of power that the device has gone through.
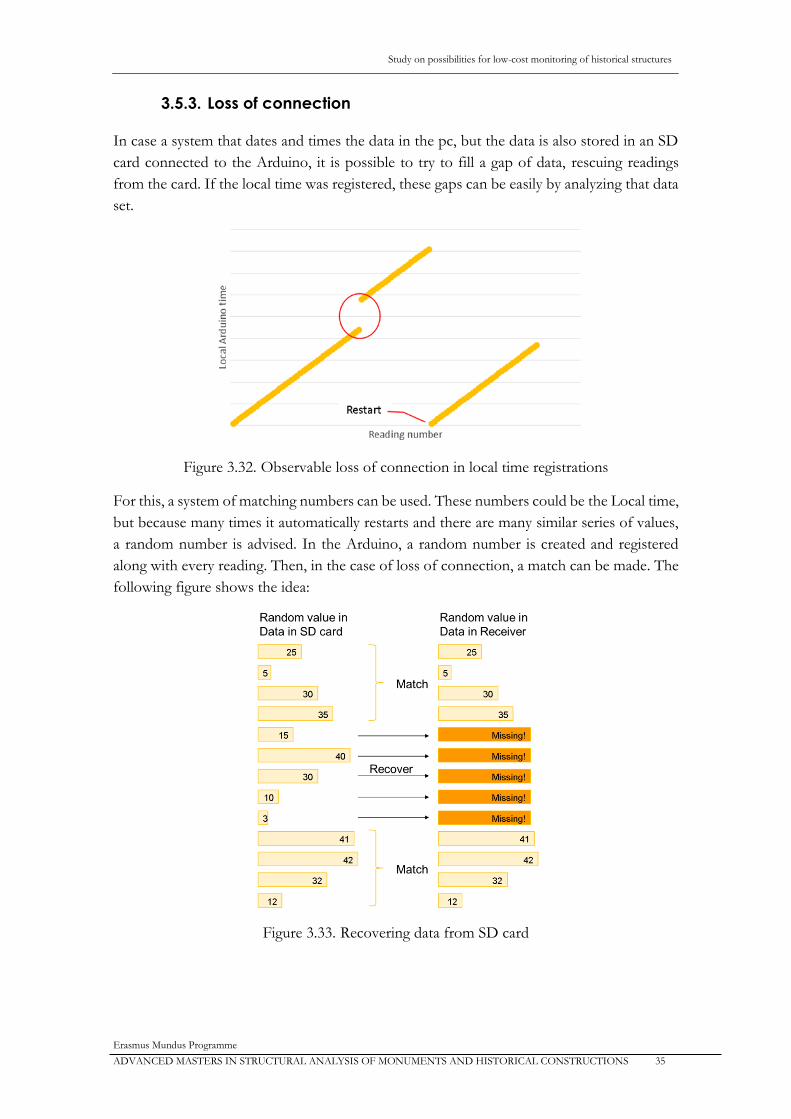
Study on possibilities for low-cost monitoring of historical structures
Erasmus Mundus Programme
ADVANCED MASTERS IN STRUCTURAL ANALYSIS OF MONUMENTS AND HISTORICAL CONSTRUCTIONS 35
3.5.3. Loss of connection
In case a system that dates and times the data in the pc, but the data is also stored in an SD
card connected to the Arduino, it is possible to try to fill a gap of data, rescuing readings
from the card. If the local time was registered, these gaps can be easily by analyzing that data
set.
Figure 3.32. Observable loss of connection in local time registrations
For this, a system of matching numbers can be used. These numbers could be the Local time,
but because many times it automatically restarts and there are many similar series of values,
a random number is advised. In the Arduino, a random number is created and registered
along with every reading. Then, in the case of loss of connection, a match can be made. The
following figure shows the idea:
Figure 3.33. Recovering data from SD card
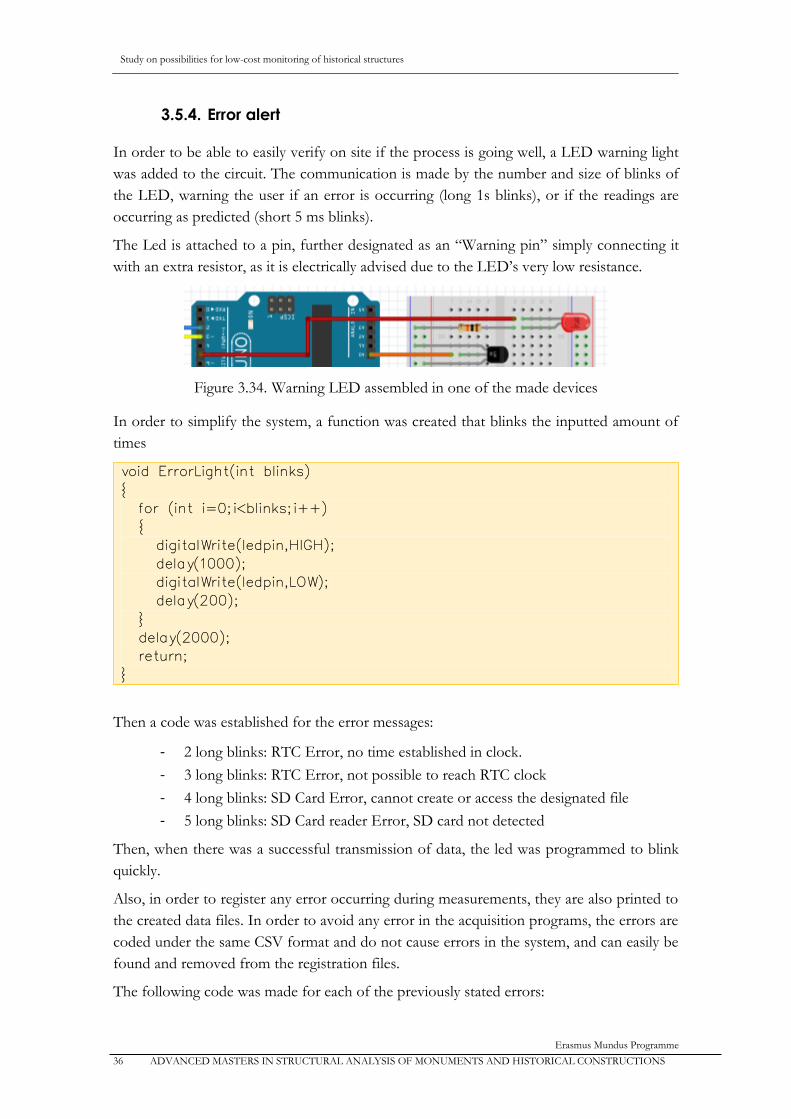
Study on possibilities for low-cost monitoring of historical structures
Erasmus Mundus Programme
36 ADVANCED MASTERS IN STRUCTURAL ANALYSIS OF MONUMENTS AND HISTORICAL CONSTRUCTIONS
3.5.4. Error alert
In order to be able to easily verify on site if the process is going well, a LED warning light
was added to the circuit. The communication is made by the number and size of blinks of
the LED, warning the user if an error is occurring (long 1s blinks), or if the readings are
occurring as predicted (short 5 ms blinks).
The Led is attached to a pin, further designated as an “Warning pin” simply connecting it
with an extra resistor, as it is electrically advised due to the LED’s very low resistance.
Figure 3.34. Warning LED assembled in one of the made devices
In order to simplify the system, a function was created that blinks the inputted amount of
times
void ErrorLight(int blinks)
{
for (int i=0;i<blinks;i++)
{
digitalWrite(ledpin,HIGH);
delay(1000);
digitalWrite(ledpin,LOW);
delay(200);
}
delay(2000);
return;
}
Then a code was established for the error messages:
- 2 long blinks: RTC Error, no time established in clock.
- 3 long blinks: RTC Error, not possible to reach RTC clock
- 4 long blinks: SD Card Error, cannot create or access the designated file
- 5 long blinks: SD Card reader Error, SD card not detected
Then, when there was a successful transmission of data, the led was programmed to blink
quickly.
Also, in order to register any error occurring during measurements, they are also printed to
the created data files. In order to avoid any error in the acquisition programs, the errors are
coded under the same CSV format and do not cause errors in the system, and can easily be
found and removed from the registration files.
The following code was made for each of the previously stated errors:

Study on possibilities for low-cost monitoring of historical structures
Erasmus Mundus Programme
ADVANCED MASTERS IN STRUCTURAL ANALYSIS OF MONUMENTS AND HISTORICAL CONSTRUCTIONS 37
- "100;104;0;0;": RTC Error, no time established in clock.
- "100;105;0;0;": RTC Error, not possible to reach RTC clock
- "100;103;0;0;": SD Card Error, cannot create or access the designated file
- "100;101;0;0;": SD Card reader Error, SD card not detected
3.6. Post-processing
As previously referred, the post-processing was not deeply analyzed in this study, but some
advices for a quick and unelaborated analysis are here given.
3.6.1. Compiling files
In order to join the different files from all the readings, the least time consuming way seems
to be using command prompt. Place all the files to be joined together in the same directory
and then use the command “copy” in order to compile them all into a single file by stating.
They will be compiled in alphabetical order as shown in the following example.
Figure 3.35. Compiling files example
This way, all the CSV files in the directory were compiled into the new file
“20150605_to_20150615.CSV”, which will appear in the same directory.
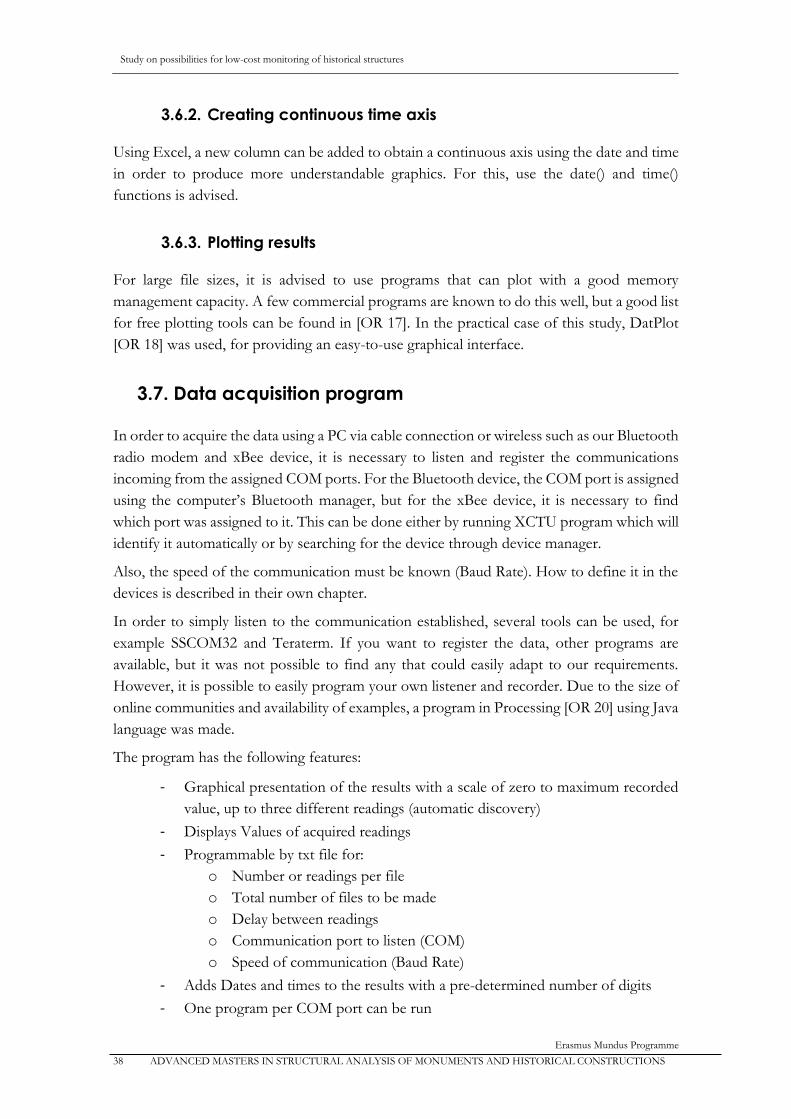
Study on possibilities for low-cost monitoring of historical structures
Erasmus Mundus Programme
38 ADVANCED MASTERS IN STRUCTURAL ANALYSIS OF MONUMENTS AND HISTORICAL CONSTRUCTIONS
3.6.2. Creating continuous time axis
Using Excel, a new column can be added to obtain a continuous axis using the date and time
in order to produce more understandable graphics. For this, use the date() and time()
functions is advised.
3.6.3. Plotting results
For large file sizes, it is advised to use programs that can plot with a good memory
management capacity. A few commercial programs are known to do this well, but a good list
for free plotting tools can be found in [OR 17]. In the practical case of this study, DatPlot
[OR 18] was used, for providing an easy-to-use graphical interface.
3.7. Data acquisition program
In order to acquire the data using a PC via cable connection or wireless such as our Bluetooth
radio modem and xBee device, it is necessary to listen and register the communications
incoming from the assigned COM ports. For the Bluetooth device, the COM port is assigned
using the computer’s Bluetooth manager, but for the xBee device, it is necessary to find
which port was assigned to it. This can be done either by running XCTU program which will
identify it automatically or by searching for the device through device manager.
Also, the speed of the communication must be known (Baud Rate). How to define it in the
devices is described in their own chapter.
In order to simply listen to the communication established, several tools can be used, for
example SSCOM32 and Teraterm. If you want to register the data, other programs are
available, but it was not possible to find any that could easily adapt to our requirements.
However, it is possible to easily program your own listener and recorder. Due to the size of
online communities and availability of examples, a program in Processing [OR 20] using Java
language was made.
The program has the following features:
- Graphical presentation of the results with a scale of zero to maximum recorded
value, up to three different readings (automatic discovery)
- Displays Values of acquired readings
- Programmable by txt file for:
o Number or readings per file
o Total number of files to be made
o Delay between readings
o Communication port to listen (COM)
o Speed of communication (Baud Rate)
- Adds Dates and times to the results with a pre-determined number of digits
- One program per COM port can be run
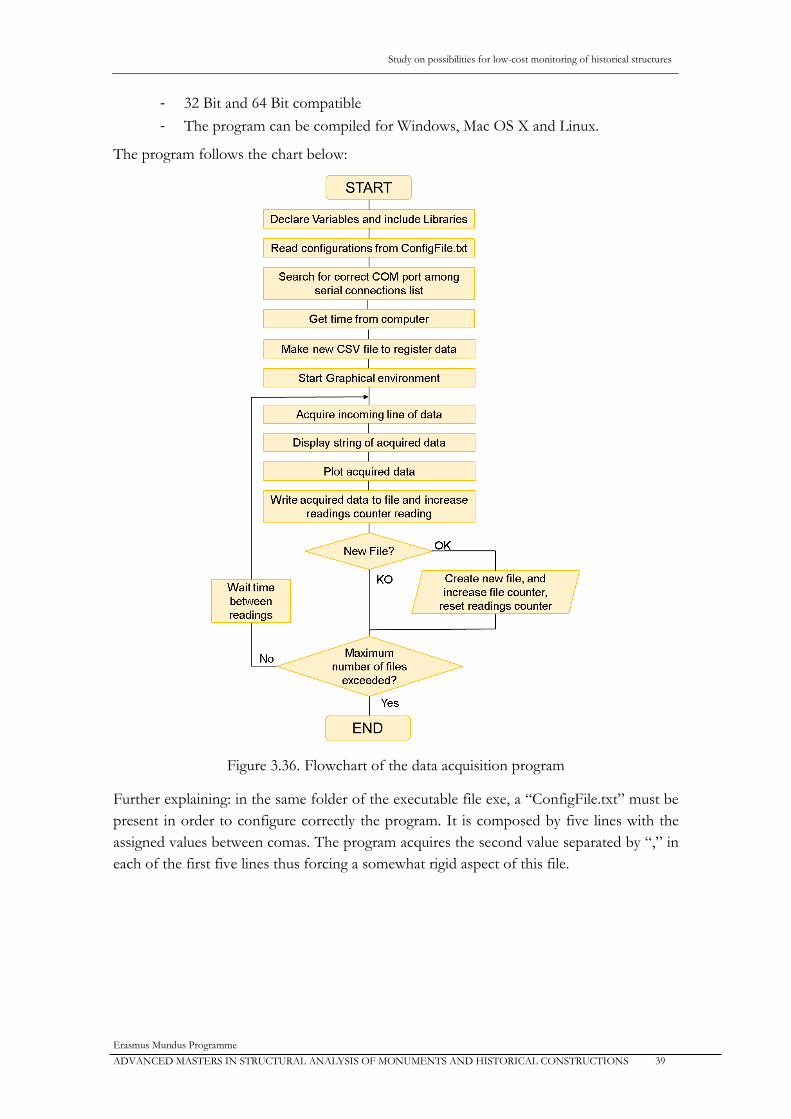
Study on possibilities for low-cost monitoring of historical structures
Erasmus Mundus Programme
ADVANCED MASTERS IN STRUCTURAL ANALYSIS OF MONUMENTS AND HISTORICAL CONSTRUCTIONS 39
- 32 Bit and 64 Bit compatible
- The program can be compiled for Windows, Mac OS X and Linux.
The program follows the chart below:
Figure 3.36. Flowchart of the data acquisition program
Further explaining: in the same folder of the executable file exe, a “ConfigFile.txt” must be
present in order to configure correctly the program. It is composed by five lines with the
assigned values between comas. The program acquires the second value separated by “,” in
each of the first five lines thus forcing a somewhat rigid aspect of this file.

Study on possibilities for low-cost monitoring of historical structures
Erasmus Mundus Programme
40 ADVANCED MASTERS IN STRUCTURAL ANALYSIS OF MONUMENTS AND HISTORICAL CONSTRUCTIONS
Figure 3.37. Configuration file for data acquisition program.
Configuring from a file provides the advantage of not having to re-compile the program
every time it is turned off or when is necessary to change the parameters. Also and maybe
more importantly, it can be added to the auto-run processes which
The program displays the acquired reading and displays it on top, and draws a point for each
reading. Bellow, there is an example of a reading of the LVDT and temperature sensor.
Figure 3.38. Aspect of data acquisition program running
In this case, the acquired reading coming from the Arduino was “1450011201;15;20;2579;”,
being the first two values the local Arduino time in milliseconds and a random value of 1-
50. The last two values correspond to the LVDT is at the value of 2579 μm (Red), near its
maximum ever recorded, and the temperature is at 20ºC, approximately half of its maximum.
After this, the program will add the date and time before the whole reading and save it into
a csv file.
In order to make the program it was necessary to invest approximately 40 hours of work,
including learning and debugging. The program is of course still very limited, but provides a
good base for developing more specific, resistant and powerful tool. Its code can be found
in appendix.

Study on possibilities for low-cost monitoring of historical structures
Erasmus Mundus Programme
ADVANCED MASTERS IN STRUCTURAL ANALYSIS OF MONUMENTS AND HISTORICAL CONSTRUCTIONS 41
Chapter 4. Implementation of a low-cost monitoring
system
In order to test the components and codes made in laboratory, a monitoring system was
implemented in an existing building that displayed a severe cracking problem.
4.1. Instrumentation built
In order to use all the components previously shown, the possibilities of power supply,
measuring gauges and data transferring systems were combined and three different
instruments were made.
Figure 4.1. Instruments made for monitoring campaign
Even though the LVDT and Humidity sensors have those primary functions, they were
equipped with temperature sensors as well. Nonetheless those instruments will be hereon
referred only by their primary function.
4.1.1. Temperature Sensor
The temperature sensor was made using the following components:
- Arduino UNO Rev.3 board (18€)
- BreadBoard 830 points and wiring cables (6€)
- SD TF card holder + microSD 16 GB cards (8.4€)
- Octopus RTC module (5€)
- LM35 temperature sensor (1€)
- 1 Red LED (<0.5€)
- 1 kΩ resistor (<0.1€)
- Solar power kit (48€)
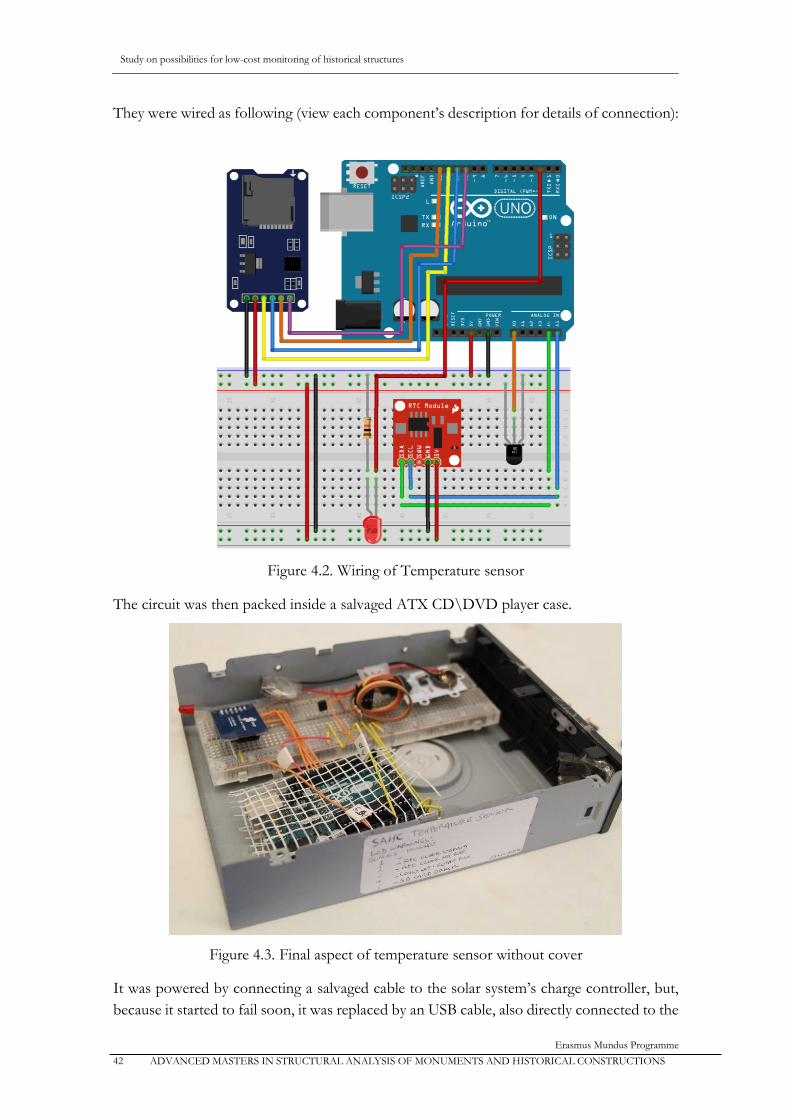
Study on possibilities for low-cost monitoring of historical structures
Erasmus Mundus Programme
42 ADVANCED MASTERS IN STRUCTURAL ANALYSIS OF MONUMENTS AND HISTORICAL CONSTRUCTIONS
They were wired as following (view each component’s description for details of connection):
Figure 4.2. Wiring of Temperature sensor
The circuit was then packed inside a salvaged ATX CD\DVD player case.
Figure 4.3. Final aspect of temperature sensor without cover
It was powered by connecting a salvaged cable to the solar system’s charge controller, but,
because it started to fail soon, it was replaced by an USB cable, also directly connected to the
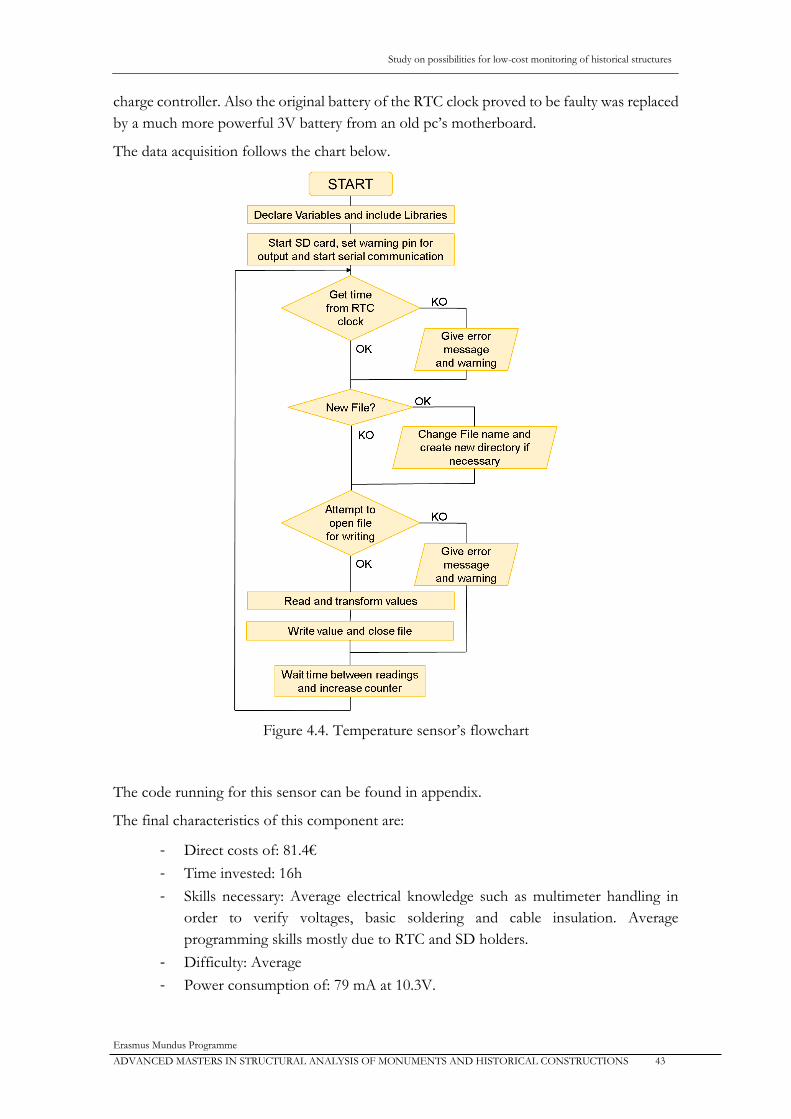
Study on possibilities for low-cost monitoring of historical structures
Erasmus Mundus Programme
ADVANCED MASTERS IN STRUCTURAL ANALYSIS OF MONUMENTS AND HISTORICAL CONSTRUCTIONS 43
charge controller. Also the original battery of the RTC clock proved to be faulty was replaced
by a much more powerful 3V battery from an old pc’s motherboard.
The data acquisition follows the chart below.
Figure 4.4. Temperature sensor’s flowchart
The code running for this sensor can be found in appendix.
The final characteristics of this component are:
- Direct costs of: 81.4€
- Time invested: 16h
- Skills necessary: Average electrical knowledge such as multimeter handling in
order to verify voltages, basic soldering and cable insulation. Average
programming skills mostly due to RTC and SD holders.
- Difficulty: Average
- Power consumption of: 79 mA at 10.3V.

Study on possibilities for low-cost monitoring of historical structures
Erasmus Mundus Programme
44 ADVANCED MASTERS IN STRUCTURAL ANALYSIS OF MONUMENTS AND HISTORICAL CONSTRUCTIONS
4.1.2. LVDT sensor
The temperature sensor was made using the following components:
- Arduino UNO Rev.3 board (18€)
- BreadBoard 830 points and wiring cables (6€)
- SD TF card holder + microSD 16 GB cards (8.4€)
- LM35 temperature sensor (1€)
- 1 Red LED (<0.5€)
- 1 kΩ resistor (<0.1€)
- Solartron AX/5/S LVDT (>450€, unknown)
- xBee communication kit (96€)
- ATX power supply (Salvaged)
They were wired as following (view each component’s description for details of connection):
Figure 4.5. Wiring of LVDT sensor
As previously referred, only the positive voltage outputs could be read by Arduino, in order
to protect it, the LVDT’s output signal was filtered using a diode.
Due to the size of the device, it was not cased.
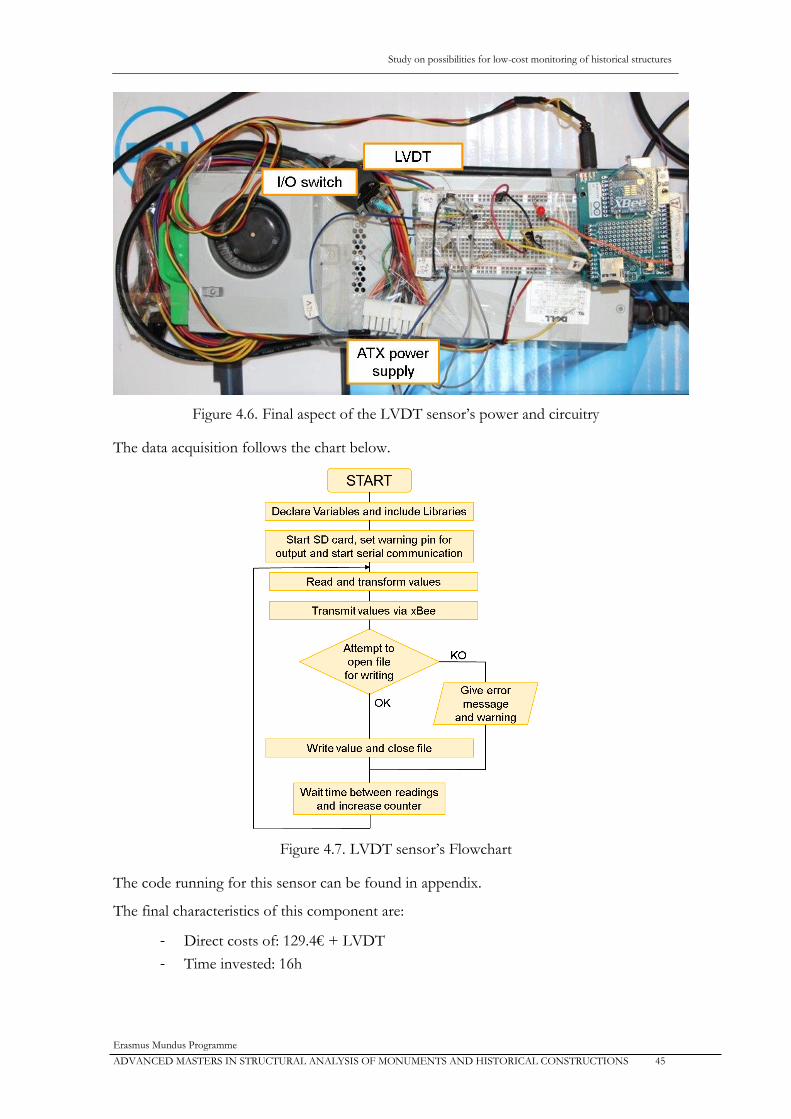
Study on possibilities for low-cost monitoring of historical structures
Erasmus Mundus Programme
ADVANCED MASTERS IN STRUCTURAL ANALYSIS OF MONUMENTS AND HISTORICAL CONSTRUCTIONS 45
Figure 4.6. Final aspect of the LVDT sensor’s power and circuitry
The data acquisition follows the chart below.
Figure 4.7. LVDT sensor’s Flowchart
The code running for this sensor can be found in appendix.
The final characteristics of this component are:
- Direct costs of: 129.4€ + LVDT
- Time invested: 16h
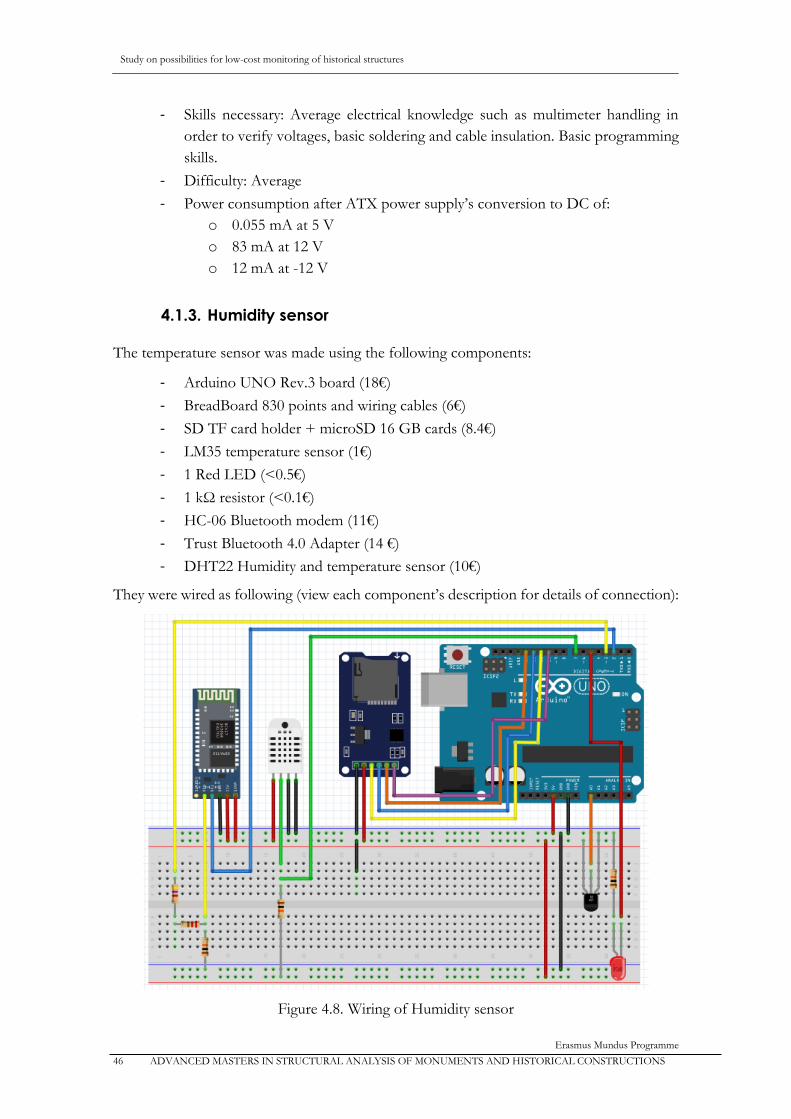
Study on possibilities for low-cost monitoring of historical structures
Erasmus Mundus Programme
46 ADVANCED MASTERS IN STRUCTURAL ANALYSIS OF MONUMENTS AND HISTORICAL CONSTRUCTIONS
- Skills necessary: Average electrical knowledge such as multimeter handling in
order to verify voltages, basic soldering and cable insulation. Basic programming
skills.
- Difficulty: Average
- Power consumption after ATX power supply’s conversion to DC of:
o 0.055 mA at 5 V
o 83 mA at 12 V
o 12 mA at -12 V
4.1.3. Humidity sensor
The temperature sensor was made using the following components:
- Arduino UNO Rev.3 board (18€)
- BreadBoard 830 points and wiring cables (6€)
- SD TF card holder + microSD 16 GB cards (8.4€)
- LM35 temperature sensor (1€)
- 1 Red LED (<0.5€)
- 1 kΩ resistor (<0.1€)
- HC-06 Bluetooth modem (11€)
- Trust Bluetooth 4.0 Adapter (14 €)
- DHT22 Humidity and temperature sensor (10€)
They were wired as following (view each component’s description for details of connection):
Figure 4.8. Wiring of Humidity sensor
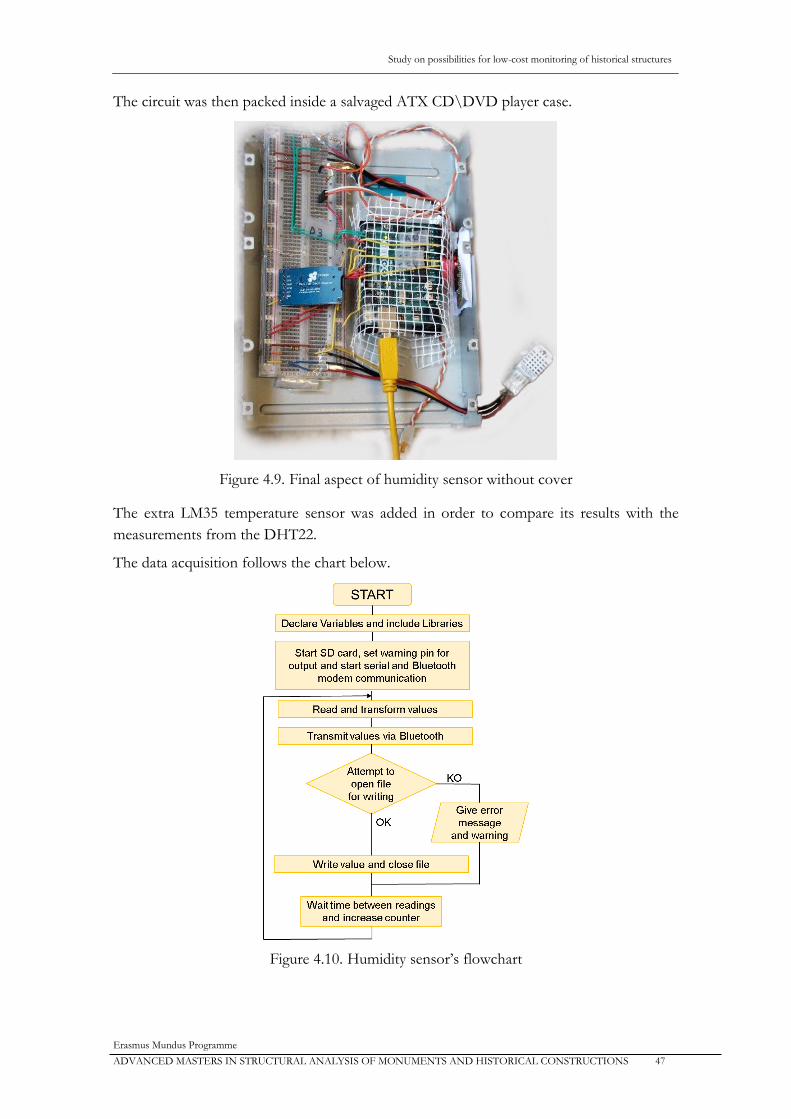
Study on possibilities for low-cost monitoring of historical structures
Erasmus Mundus Programme
ADVANCED MASTERS IN STRUCTURAL ANALYSIS OF MONUMENTS AND HISTORICAL CONSTRUCTIONS 47
The circuit was then packed inside a salvaged ATX CD\DVD player case.
Figure 4.9. Final aspect of humidity sensor without cover
The extra LM35 temperature sensor was added in order to compare its results with the
measurements from the DHT22.
The data acquisition follows the chart below.
Figure 4.10. Humidity sensor’s flowchart
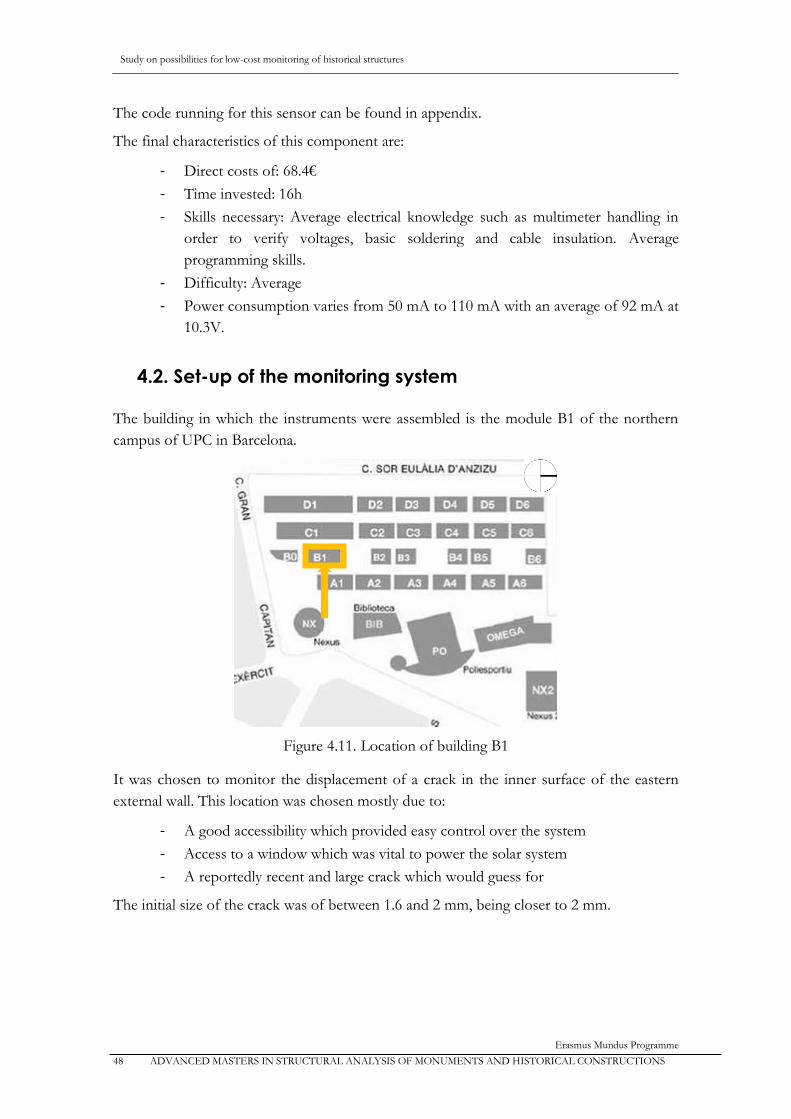
Study on possibilities for low-cost monitoring of historical structures
Erasmus Mundus Programme
48 ADVANCED MASTERS IN STRUCTURAL ANALYSIS OF MONUMENTS AND HISTORICAL CONSTRUCTIONS
The code running for this sensor can be found in appendix.
The final characteristics of this component are:
- Direct costs of: 68.4€
- Time invested: 16h
- Skills necessary: Average electrical knowledge such as multimeter handling in
order to verify voltages, basic soldering and cable insulation. Average
programming skills.
- Difficulty: Average
- Power consumption varies from 50 mA to 110 mA with an average of 92 mA at
10.3V.
4.2. Set-up of the monitoring system
The building in which the instruments were assembled is the module B1 of the northern
campus of UPC in Barcelona.
Figure 4.11. Location of building B1
It was chosen to monitor the displacement of a crack in the inner surface of the eastern
external wall. This location was chosen mostly due to:
- A good accessibility which provided easy control over the system
- Access to a window which was vital to power the solar system
- A reportedly recent and large crack which would guess for
The initial size of the crack was of between 1.6 and 2 mm, being closer to 2 mm.
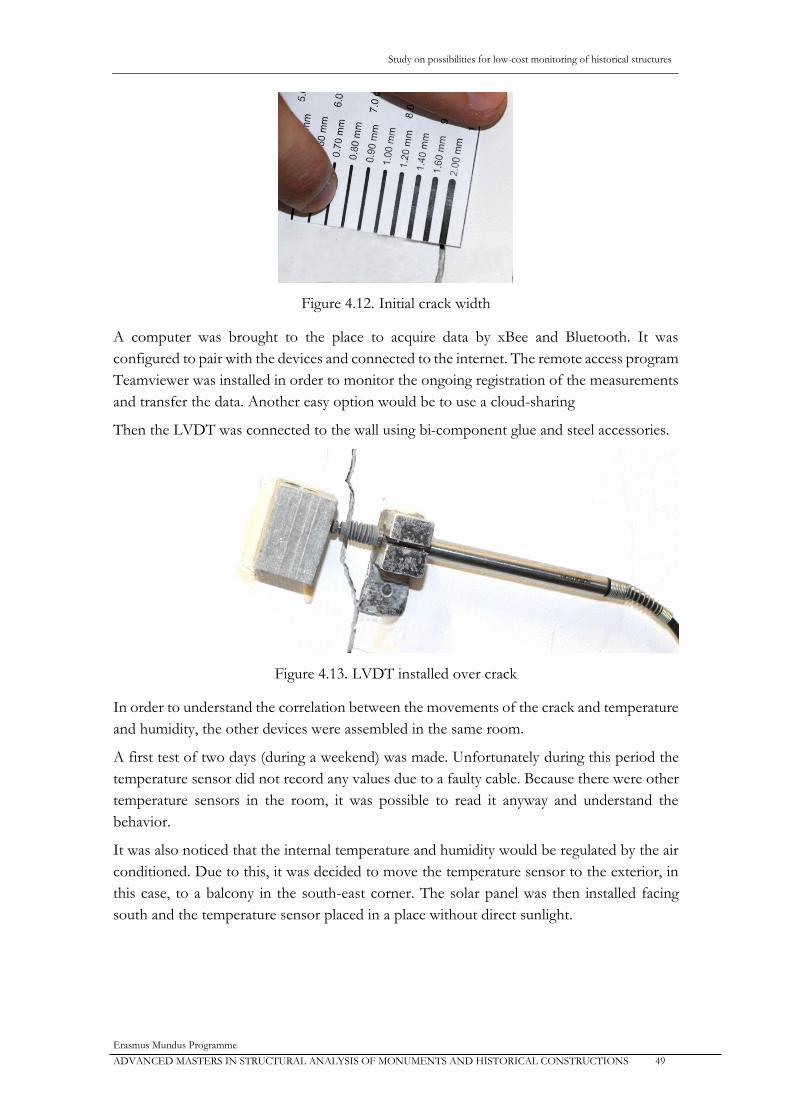
Study on possibilities for low-cost monitoring of historical structures
Erasmus Mundus Programme
ADVANCED MASTERS IN STRUCTURAL ANALYSIS OF MONUMENTS AND HISTORICAL CONSTRUCTIONS 49
Figure 4.12. Initial crack width
A computer was brought to the place to acquire data by xBee and Bluetooth. It was
configured to pair with the devices and connected to the internet. The remote access program
Teamviewer was installed in order to monitor the ongoing registration of the measurements
and transfer the data. Another easy option would be to use a cloud-sharing
Then the LVDT was connected to the wall using bi-component glue and steel accessories.
Figure 4.13. LVDT installed over crack
In order to understand the correlation between the movements of the crack and temperature
and humidity, the other devices were assembled in the same room.
A first test of two days (during a weekend) was made. Unfortunately during this period the
temperature sensor did not record any values due to a faulty cable. Because there were other
temperature sensors in the room, it was possible to read it anyway and understand the
behavior.
It was also noticed that the internal temperature and humidity would be regulated by the air
conditioned. Due to this, it was decided to move the temperature sensor to the exterior, in
this case, to a balcony in the south-east corner. The solar panel was then installed facing
south and the temperature sensor placed in a place without direct sunlight.
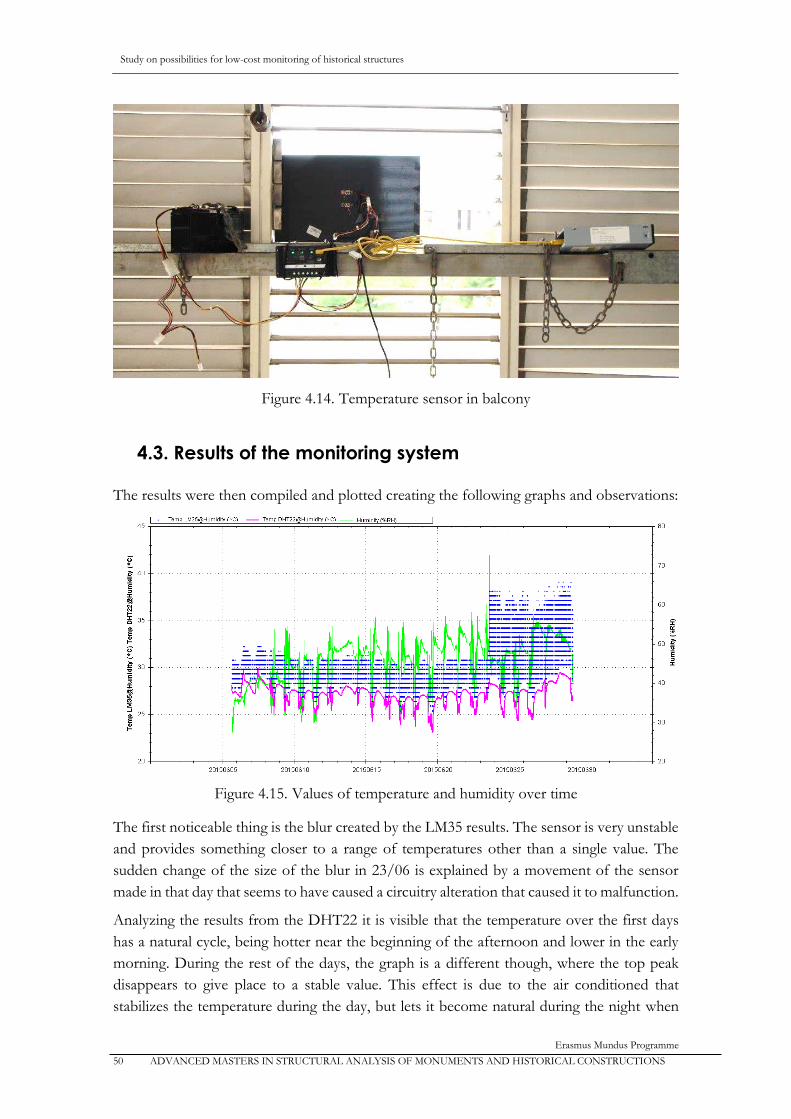
Study on possibilities for low-cost monitoring of historical structures
Erasmus Mundus Programme
50 ADVANCED MASTERS IN STRUCTURAL ANALYSIS OF MONUMENTS AND HISTORICAL CONSTRUCTIONS
Figure 4.14. Temperature sensor in balcony
4.3. Results of the monitoring system
The results were then compiled and plotted creating the following graphs and observations:
Figure 4.15. Values of temperature and humidity over time
The first noticeable thing is the blur created by the LM35 results. The sensor is very unstable
and provides something closer to a range of temperatures other than a single value. The
sudden change of the size of the blur in 23/06 is explained by a movement of the sensor
made in that day that seems to have caused a circuitry alteration that caused it to malfunction.
Analyzing the results from the DHT22 it is visible that the temperature over the first days
has a natural cycle, being hotter near the beginning of the afternoon and lower in the early
morning. During the rest of the days, the graph is a different though, where the top peak
disappears to give place to a stable value. This effect is due to the air conditioned that
stabilizes the temperature during the day, but lets it become natural during the night when

Study on possibilities for low-cost monitoring of historical structures
Erasmus Mundus Programme
ADVANCED MASTERS IN STRUCTURAL ANALYSIS OF MONUMENTS AND HISTORICAL CONSTRUCTIONS 51
it’s turned off. The humidity values are very random though. Some regularity can also be
found during the weekend when the room is resting, but during workdays the values have
very high variations related to opening of windows and doors.
Figure 4.16. Values from temperature sensor when outside
These recordings are marked by the instability due to power losses. The solar panel has not
produced as much power as predicted. Weather registration from online website Weather
underground [OR 21] identifies some of the moments with less sunlight which caused the
power production to drop, but this is not the only cause.
Figure 4.17. Weather conditions in Barcelona for June 2015
For the successful measurements, a stable sinusoidal temperature variation along the days
can be seen.
As for the LVDT sensor, it registers a continuous sinusoidal result, but with a general
tendency to grow. In total, the crack widened approximately 209μm in the observed period.
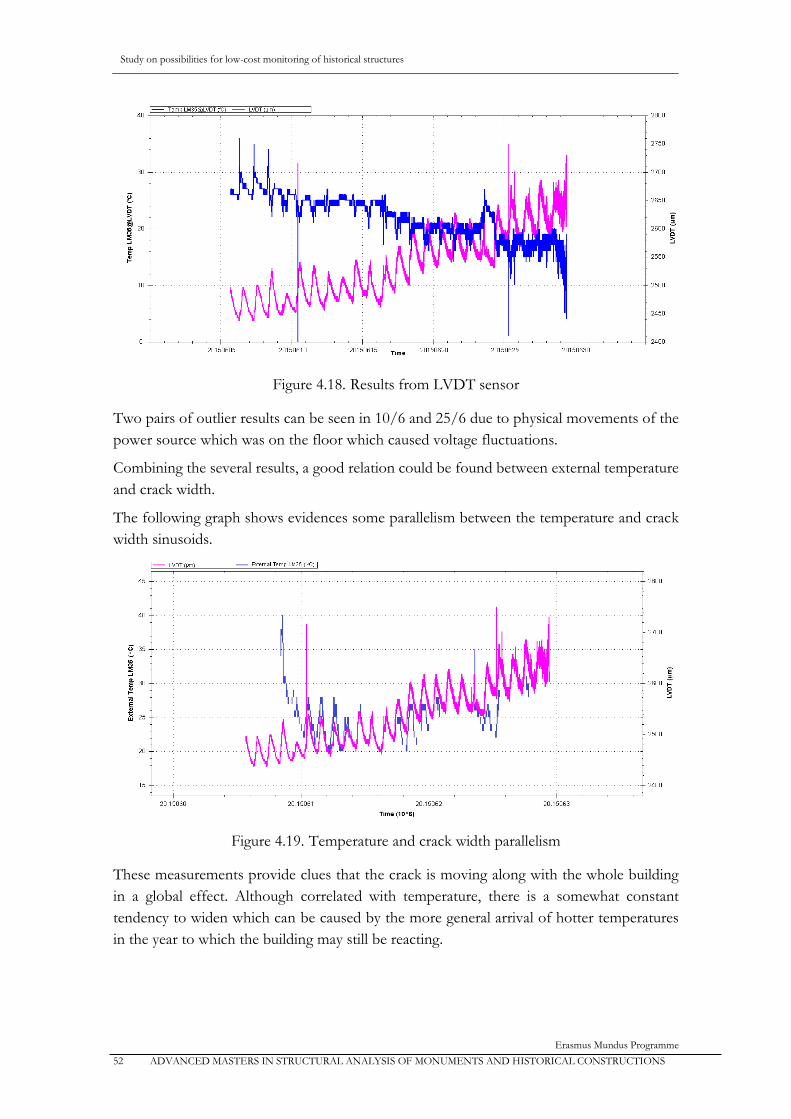
Study on possibilities for low-cost monitoring of historical structures
Erasmus Mundus Programme
52 ADVANCED MASTERS IN STRUCTURAL ANALYSIS OF MONUMENTS AND HISTORICAL CONSTRUCTIONS
Figure 4.18. Results from LVDT sensor
Two pairs of outlier results can be seen in 10/6 and 25/6 due to physical movements of the
power source which was on the floor which caused voltage fluctuations.
Combining the several results, a good relation could be found between external temperature
and crack width.
The following graph shows evidences some parallelism between the temperature and crack
width sinusoids.
Figure 4.19. Temperature and crack width parallelism
These measurements provide clues that the crack is moving along with the whole building
in a global effect. Although correlated with temperature, there is a somewhat constant
tendency to widen which can be caused by the more general arrival of hotter temperatures
in the year to which the building may still be reacting.
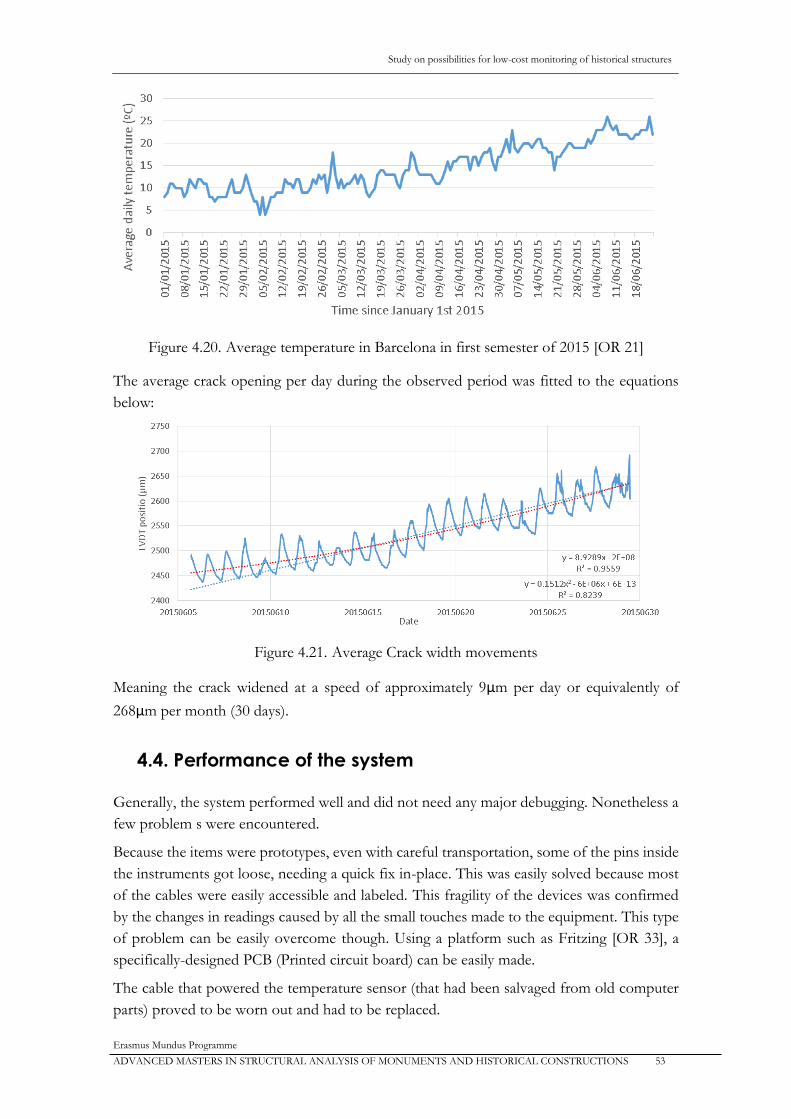
Study on possibilities for low-cost monitoring of historical structures
Erasmus Mundus Programme
ADVANCED MASTERS IN STRUCTURAL ANALYSIS OF MONUMENTS AND HISTORICAL CONSTRUCTIONS 53
Figure 4.20. Average temperature in Barcelona in first semester of 2015 [OR 21]
The average crack opening per day during the observed period was fitted to the equations
below:
Figure 4.21. Average Crack width movements
Meaning the crack widened at a speed of approximately 9μm per day or equivalently of
268μm per month (30 days).
4.4. Performance of the system
Generally, the system performed well and did not need any major debugging. Nonetheless a
few problem s were encountered.
Because the items were prototypes, even with careful transportation, some of the pins inside
the instruments got loose, needing a quick fix in-place. This was easily solved because most
of the cables were easily accessible and labeled. This fragility of the devices was confirmed
by the changes in readings caused by all the small touches made to the equipment. This type
of problem can be easily overcome though. Using a platform such as Fritzing [OR 33], a
specifically-designed PCB (Printed circuit board) can be easily made.
The cable that powered the temperature sensor (that had been salvaged from old computer
parts) proved to be worn out and had to be replaced.
Study on possibilities for low-cost monitoring of historical structures
Erasmus Mundus Programme
54 ADVANCED MASTERS IN STRUCTURAL ANALYSIS OF MONUMENTS AND HISTORICAL CONSTRUCTIONS
The solar system did not perform as well as predicted, producing less power than expected.
This is believed to be related to its position. Because the system was not impermeable and
didn’t have a polyvalent support, it was not possible to place it in a better angle or position.
The battery responded as expected when powering the devices, but then was replaced by
direct current in order to maintain the instruments continuously ON.
Study on possibilities for low-cost monitoring of historical structures
Erasmus Mundus Programme
ADVANCED MASTERS IN STRUCTURAL ANALYSIS OF MONUMENTS AND HISTORICAL CONSTRUCTIONS 55
Chapter 5. Economic analysis
An economic analysis on the built instruments was made. In order to be possible to compare
with commercial products, the components had to be separated. So, the following
comparisons were made:
- Solar energy system
- Temperature sensor
- Humidity sensor
- Data acquisition system for LVDT (LVDT sensor without LVDT)
Then, other aspects of the system that are not comparable with other commercial options
are referred to.
5.1. Cost of Built instruments
There were several types of costs involved in the construction of the instruments. They were
here simplified in order to try to make an understandable and reasonable comparison to
other commercial options. For this, it was mostly necessary to take into account the direct
costs and the time spent in training and in building. There is also a global initial cost on
equipment and training, this cost will be estimated, but will not be compared.
The costs were then divided into:
- Initial investment
o Direct costs: Material necessary to work
Starter Kit of Pliers, Screwdrivers, Welding kit, Multimeter: 45€
Starter kit of electronic components: 85 €
o Time: General investment on studies and research
Arduino platforms, testing and wiring: 16 h
Electronic tools as multimeter or welding: 8 h
- Direct investment
o Direct costs: Material necessary to produce items
o Time: Investment to understand, plan, program and assemble
Making the following considerations:
- Costs from initial investment are not considered
- The investment in an instrument is equal to the sum of the investment in its
components plus the necessary to put them together.
- Usage of SD card holder is considered in data transfer for all instruments
- LVDT Solartron AX/5/sis not considered
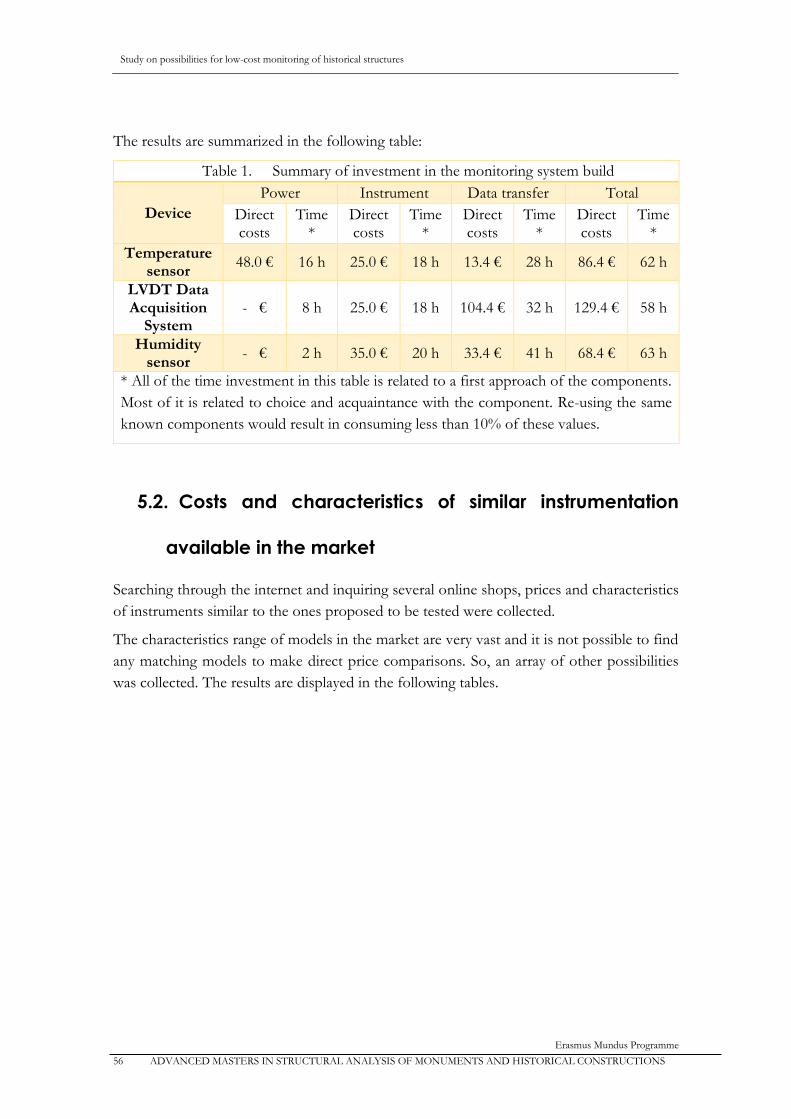
Study on possibilities for low-cost monitoring of historical structures
Erasmus Mundus Programme
56 ADVANCED MASTERS IN STRUCTURAL ANALYSIS OF MONUMENTS AND HISTORICAL CONSTRUCTIONS
The results are summarized in the following table:
Table 1. Summary of investment in the monitoring system build
Device
Power Instrument Data transfer Total
Direct costs
Time*
Direct costs
Time*
Direct costs
Time*
Direct costs
Time*
Temperature sensor
48.0 € 16 h 25.0 € 18 h 13.4 € 28 h 86.4 € 62 h
LVDT Data Acquisition
System - € 8 h 25.0 € 18 h 104.4 € 32 h 129.4 € 58 h
Humidity sensor
- € 2 h 35.0 € 20 h 33.4 € 41 h 68.4 € 63 h
* All of the time investment in this table is related to a first approach of the components.
Most of it is related to choice and acquaintance with the component. Re-using the same
known components would result in consuming less than 10% of these values.
5.2. Costs and characteristics of similar instrumentation
available in the market
Searching through the internet and inquiring several online shops, prices and characteristics
of instruments similar to the ones proposed to be tested were collected.
The characteristics range of models in the market are very vast and it is not possible to find
any matching models to make direct price comparisons. So, an array of other possibilities
was collected. The results are displayed in the following tables.
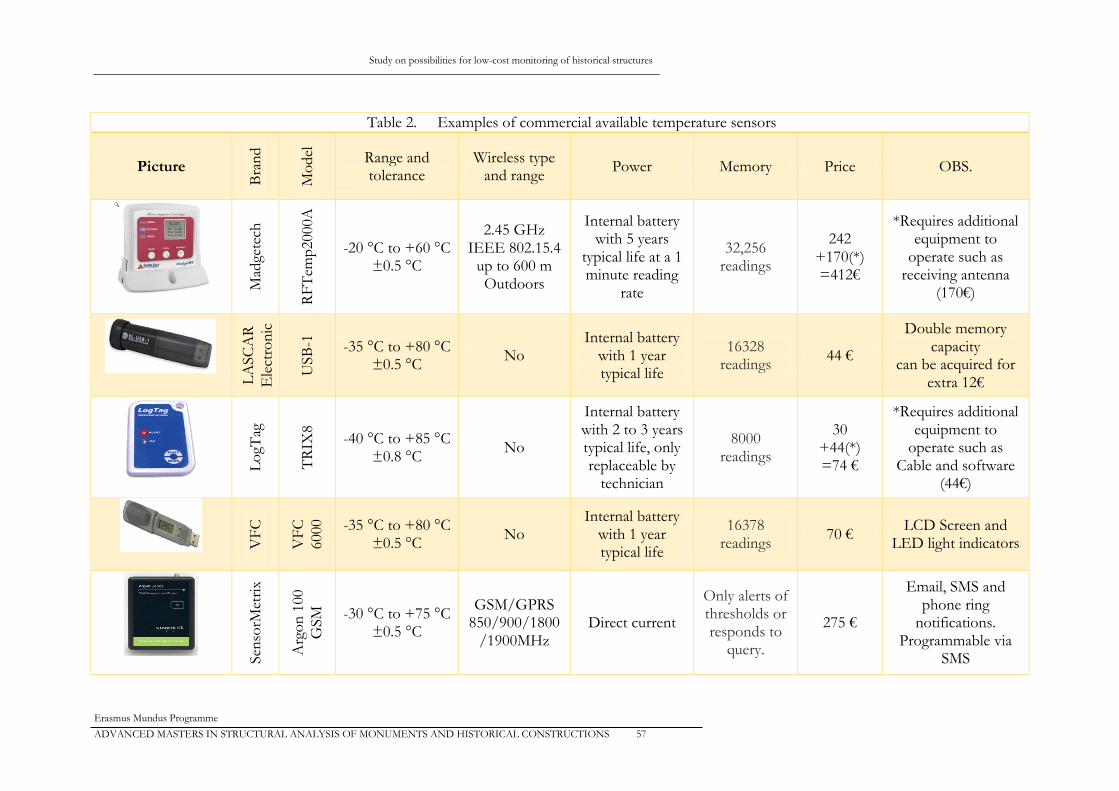
Study on possibilities for low-cost monitoring of historical structures
Erasmus Mundus Programme
ADVANCED MASTERS IN STRUCTURAL ANALYSIS OF MONUMENTS AND HISTORICAL CONSTRUCTIONS 57
Table 2. Examples of commercial available temperature sensors
Picture
Bra
nd
Mo
del
Range and tolerance
Wireless type and range
Power Memory Price OBS.
Mad
gete
ch
RF
Tem
p2000A
-20 °C to +60 °C ±0.5 °C
2.45 GHz IEEE 802.15.4
up to 600 m Outdoors
Internal battery with 5 years
typical life at a 1 minute reading
rate
32,256 readings
242 +170(*) =412€
*Requires additional equipment to
operate such as receiving antenna
(170€)
L
ASC
AR
Ele
ctro
nic
s
USB
-1
-35 °C to +80 °C ±0.5 °C
No Internal battery
with 1 year typical life
16328 readings
44 €
Double memory capacity
can be acquired for extra 12€
Lo
gTag
TR
IX8
-40 °C to +85 °C ±0.8 °C
No
Internal battery with 2 to 3 years typical life, only replaceable by
technician
8000 readings
30 +44(*) =74 €
*Requires additional equipment to
operate such as Cable and software
(44€)
VF
C
VF
C
6000
-35 °C to +80 °C ±0.5 °C
No Internal battery
with 1 year typical life
16378 readings
70 € LCD Screen and
LED light indicators
S
enso
rMet
rix
Arg
on
100
GSM
-30 °C to +75 °C ±0.5 °C
GSM/GPRS 850/900/1800
/1900MHz Direct current
Only alerts of thresholds or responds to
query.
275 €
Email, SMS and phone ring
notifications. Programmable via
SMS
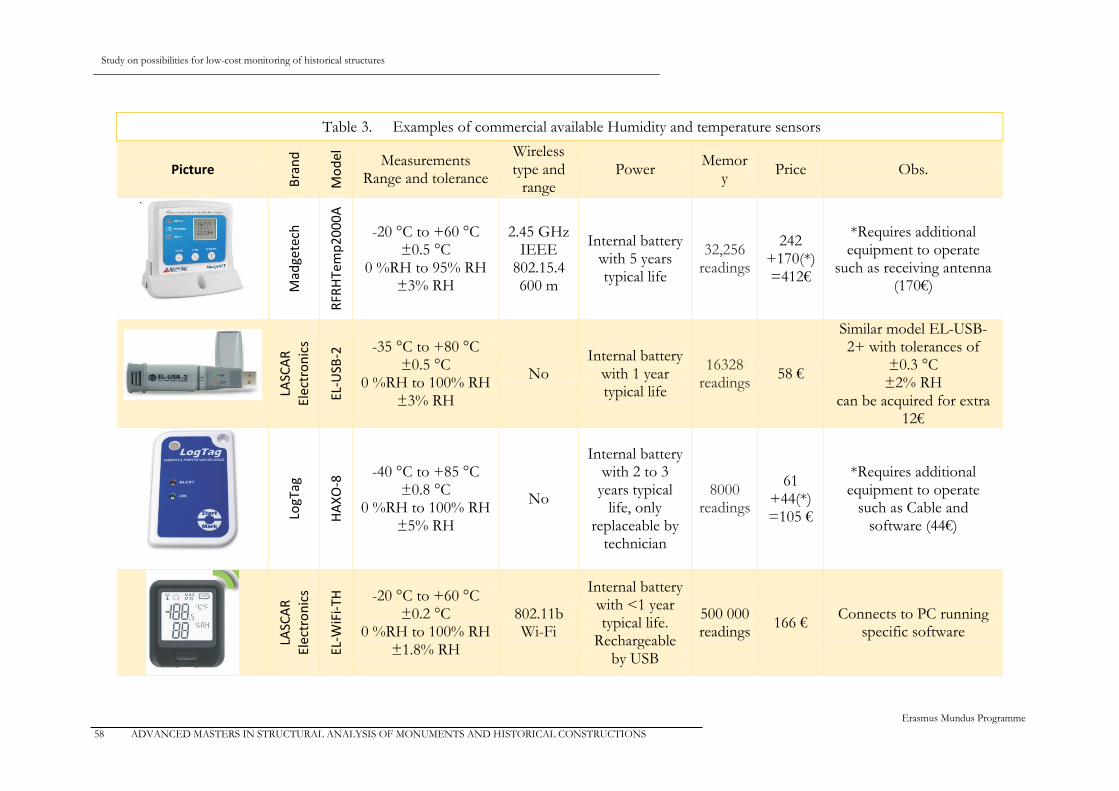
Study on possibilities for low-cost monitoring of historical structures
Erasmus Mundus Programme
58 ADVANCED MASTERS IN STRUCTURAL ANALYSIS OF MONUMENTS AND HISTORICAL CONSTRUCTIONS
Table 3. Examples of commercial available Humidity and temperature sensors
Picture
Bra
nd
Mo
del
Measurements Range and tolerance
Wireless type and
range Power
Memory
Price Obs.
Mad
gete
ch
RFR
HTe
mp
20
00
A
-20 °C to +60 °C ±0.5 °C
0 %RH to 95% RH ±3% RH
2.45 GHz IEEE
802.15.4 600 m
Internal battery with 5 years typical life
32,256 readings
242 +170(*) =412€
*Requires additional equipment to operate
such as receiving antenna (170€)
LASC
AR
El
ectr
on
ics
EL-U
SB-2
-35 °C to +80 °C ±0.5 °C
0 %RH to 100% RH ±3% RH
No Internal battery
with 1 year typical life
16328 readings
58 €
Similar model EL-USB-2+ with tolerances of
±0.3 °C ±2% RH
can be acquired for extra 12€
LogT
ag
HA
XO
-8 -40 °C to +85 °C
±0.8 °C 0 %RH to 100% RH
±5% RH
No
Internal battery with 2 to 3
years typical life, only
replaceable by technician
8000 readings
61 +44(*) =105 €
*Requires additional equipment to operate
such as Cable and software (44€)
LASC
AR
El
ectr
on
ics
EL-W
iFi-
TH
-20 °C to +60 °C ±0.2 °C
0 %RH to 100% RH ±1.8% RH
802.11b Wi-Fi
Internal battery with <1 year typical life.
Rechargeable by USB
500 000 readings
166 € Connects to PC running
specific software
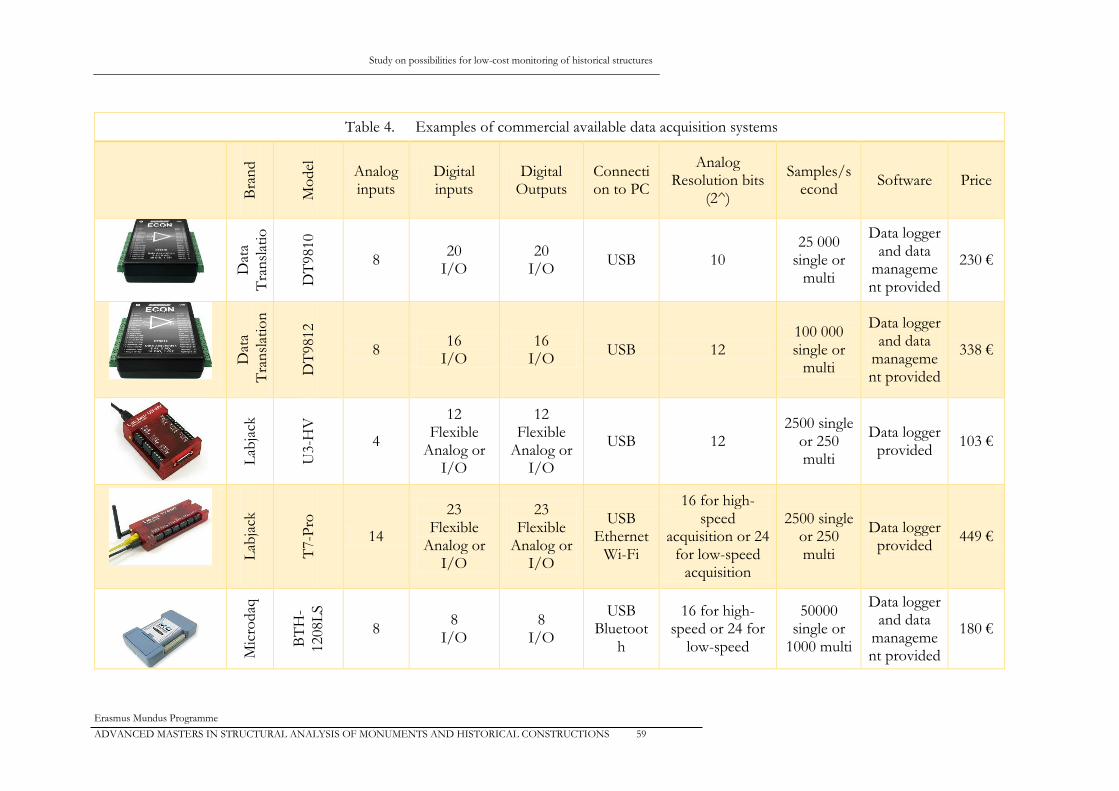
Study on possibilities for low-cost monitoring of historical structures
Erasmus Mundus Programme
ADVANCED MASTERS IN STRUCTURAL ANALYSIS OF MONUMENTS AND HISTORICAL CONSTRUCTIONS 59
Table 4. Examples of commercial available data acquisition systems
Bra
nd
Mo
del
Analog inputs
Digital inputs
Digital Outputs
Connection to PC
Analog Resolution bits
(2^)
Samples/second
Software Price
Dat
a
Tra
nsl
atio
n
DT
9810
8 20
I/O 20
I/O USB 10
25 000 single or
multi
Data logger and data
management provided
230 €
Dat
a
Tra
nsl
atio
n
DT
9812
8 16
I/O 16
I/O USB 12
100 000 single or
multi
Data logger and data
management provided
338 €
Lab
jack
U3-H
V
4
12 Flexible
Analog or I/O
12 Flexible
Analog or I/O
USB 12 2500 single
or 250 multi
Data logger provided
103 €
Lab
jack
T7-P
ro
14
23 Flexible
Analog or I/O
23 Flexible
Analog or I/O
USB Ethernet
Wi-Fi
16 for high-speed
acquisition or 24 for low-speed
acquisition
2500 single or 250 multi
Data logger provided
449 €
Mic
rodaq
BT
H-
1208L
S
8 8
I/O 8
I/O
USB Bluetoot
h
16 for high-speed or 24 for
low-speed
50000 single or
1000 multi
Data logger and data
management provided
180 €
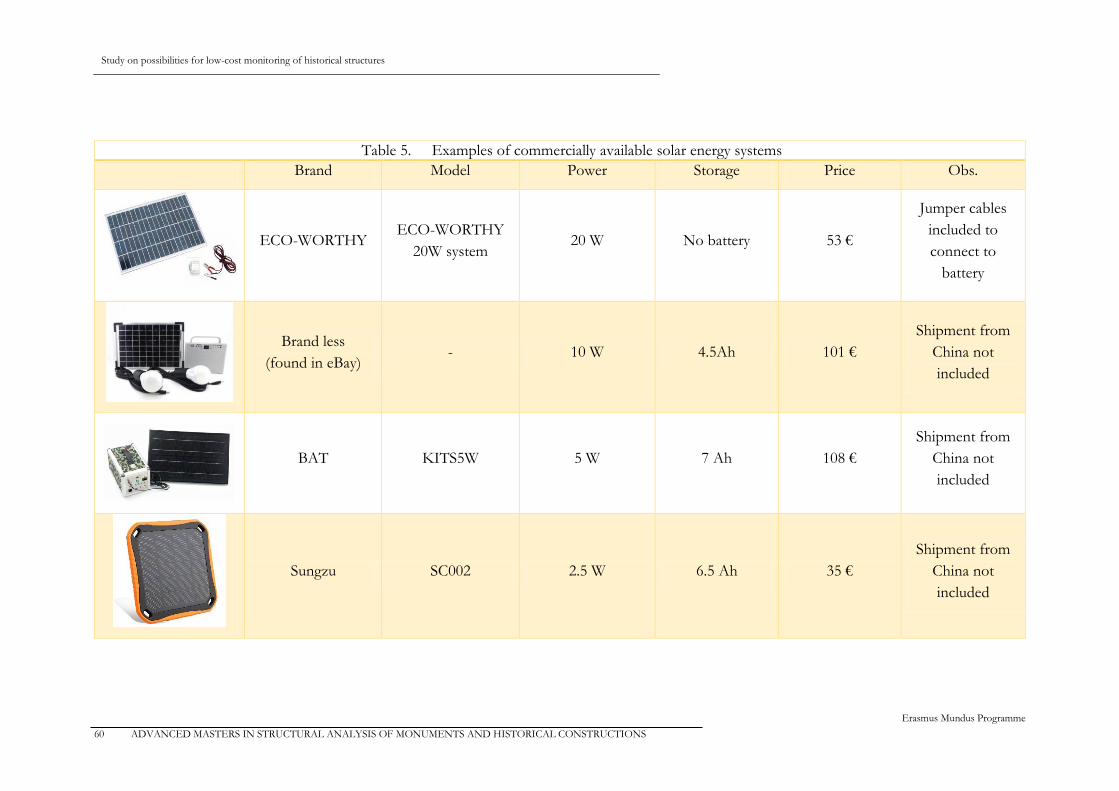
Study on possibilities for low-cost monitoring of historical structures
Erasmus Mundus Programme
60 ADVANCED MASTERS IN STRUCTURAL ANALYSIS OF MONUMENTS AND HISTORICAL CONSTRUCTIONS
Table 5. Examples of commercially available solar energy systems
Brand Model Power Storage Price Obs.
ECO-WORTHY ECO-WORTHY
20W system 20 W No battery 53 €
Jumper cables
included to
connect to
battery
Brand less
(found in eBay) - 10 W 4.5Ah 101 €
Shipment from
China not
included
BAT KITS5W 5 W 7 Ah 108 €
Shipment from
China not
included
Sungzu SC002 2.5 W 6.5 Ah 35 €
Shipment from
China not
included

Study on possibilities for low-cost monitoring of historical structures
Erasmus Mundus Programme
ADVANCED MASTERS IN STRUCTURAL ANALYSIS OF MONUMENTS AND HISTORICAL CONSTRUCTIONS 61
5.3. Comparison of instruments
The instruments are compared as is, not considering advantage of versatility of the Arduino
system.
5.3.1. Temperature sensor
The equivalent characteristics of our temperature sensor as it was produced are:
Range and tolerance
Wireless type and
range Power Memory Price OBS.
-55 °C to +150 °C ±0.75 °C
(*)
No Solar
powered >500x106 readings
86.4 € 62 h
*The rest of the components probably wouldn’t support so
extreme temperatures.
This provides us the following comparison:
Strengths:
- Range of temperature of the sensor
- Memory
Weaknesses:
- High energy consumption denies long life with battery
Using a building cost of 10€/hour for a single usage (full learning costs) or for repetition
(10% of the time used), we can estimate the following total costs:
- One time use: 86.4+62*10=706 €
- Multiple use: 86.4+62*10*0.1=148.4 €
For the production of a single device this option shows to be very expensive not giving
enough advantages to consider it viable.
For the multiple use, it provides advantage only in case it is necessary to acquire a large
number of readings.
5.3.2. Humidity sensor
Similarly to our sensor, commercial options also evaluate Humidity and temperature at the
same time.
The equivalent characteristics of our sensor to compare are:

Study on possibilities for low-cost monitoring of historical structures
Erasmus Mundus Programme
62 ADVANCED MASTERS IN STRUCTURAL ANALYSIS OF MONUMENTS AND HISTORICAL CONSTRUCTIONS
Measurements Range and tolerance
Wireless type and
range Power Memory Price Obs.
-40 °C to +80 °C (*)
±0.5 °C 0 %RH to 100%
RH ±2.5% RH
Bluetooth 10m USB
Direct current
>500x106 readings
68.4 € 63 h
*The rest of the components probably wouldn’t support so
extreme temperatures.
This provides us the following comparison:
Strengths:
- Wireless connection
- Memory
Weaknesses:
- High energy consumption denies long life with battery
Using a building cost of 10€/hour for a single usage (full learning costs) or for repetition
(10% of the time used), we can estimate the following total costs:
- One time use: 68.4+63*10=698.4 €
- Multiple use: 68.4+63*10*0.1=131 €
Once again, the price for initial production, is very high do to time consumption. On the
other hand, for the next devices, the instrument starts becoming competitive, mostly due to
its wireless capabilities.
5.3.3. LVDT Data acquisition system
The characteristics of the system are directly related to the characteristics of the chosen
Arduino board. A different choice of Arduino board could bring a totally different
comparison table. For our case, the equivalent characteristics to compare are:
Analog inputs
Digital inputs
Digital Outputs
Connection to PC
Analog Resolution bits (2^)
Samples/second
Price
6 14
I/O 14
I/O
USB xBee (100 m
range) 10
48 single 97 multi
(*)
129.4 € 58 h
* - Test done using the programs in appendix
This provides us the following comparison:
Strengths:
- Wireless connectivity
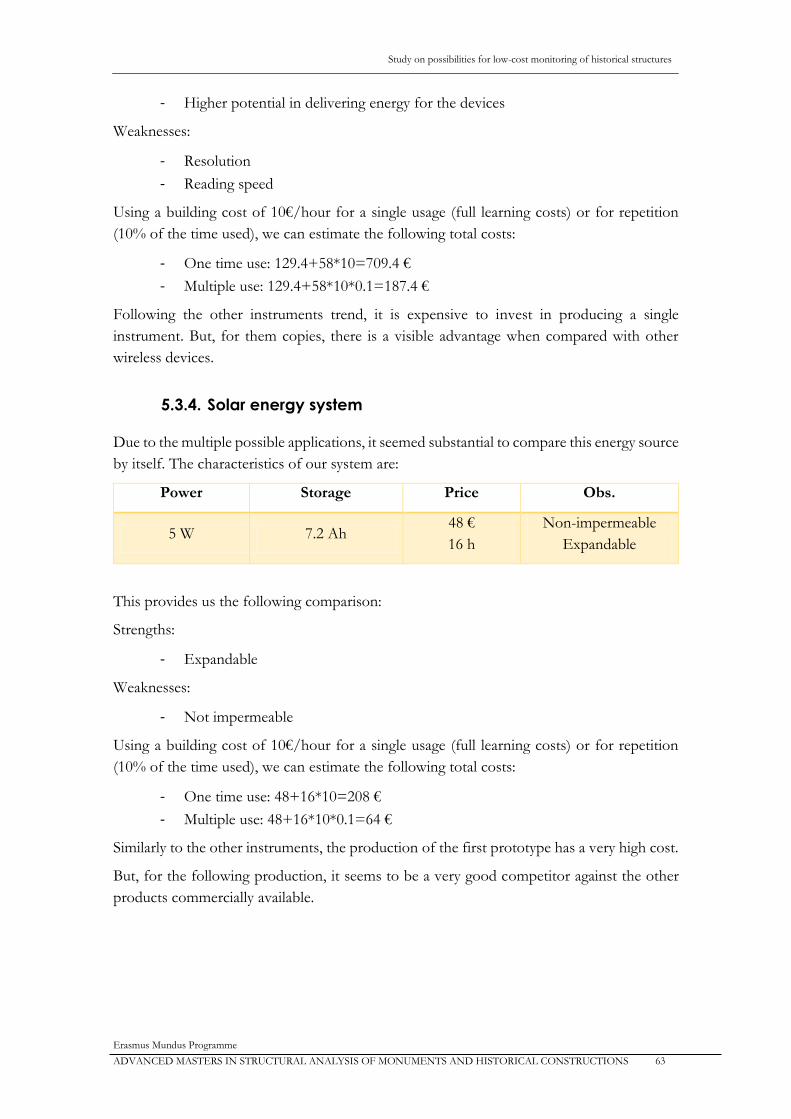
Study on possibilities for low-cost monitoring of historical structures
Erasmus Mundus Programme
ADVANCED MASTERS IN STRUCTURAL ANALYSIS OF MONUMENTS AND HISTORICAL CONSTRUCTIONS 63
- Higher potential in delivering energy for the devices
Weaknesses:
- Resolution
- Reading speed
Using a building cost of 10€/hour for a single usage (full learning costs) or for repetition
(10% of the time used), we can estimate the following total costs:
- One time use: 129.4+58*10=709.4 €
- Multiple use: 129.4+58*10*0.1=187.4 €
Following the other instruments trend, it is expensive to invest in producing a single
instrument. But, for them copies, there is a visible advantage when compared with other
wireless devices.
5.3.4. Solar energy system
Due to the multiple possible applications, it seemed substantial to compare this energy source
by itself. The characteristics of our system are:
Power Storage Price Obs.
5 W 7.2 Ah 48 €
16 h
Non-impermeable
Expandable
This provides us the following comparison:
Strengths:
- Expandable
Weaknesses:
- Not impermeable
Using a building cost of 10€/hour for a single usage (full learning costs) or for repetition
(10% of the time used), we can estimate the following total costs:
- One time use: 48+16*10=208 €
- Multiple use: 48+16*10*0.1=64 €
Similarly to the other instruments, the production of the first prototype has a very high cost.
But, for the following production, it seems to be a very good competitor against the other
products commercially available.
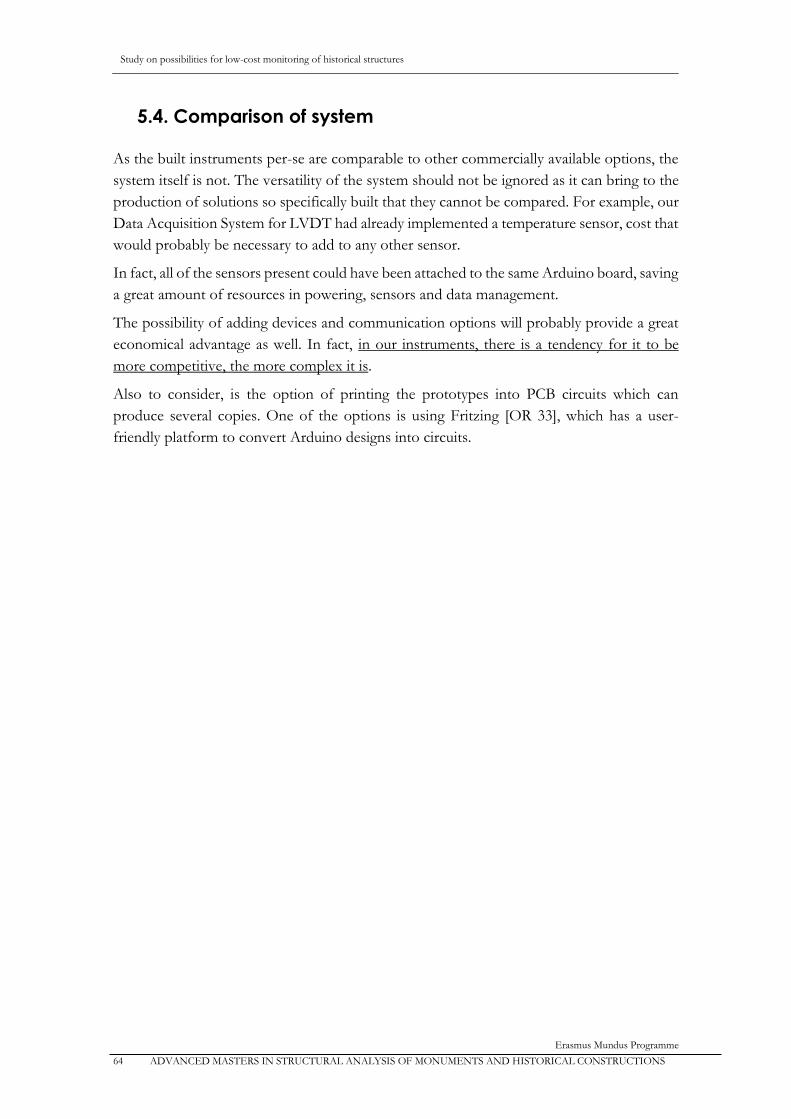
Study on possibilities for low-cost monitoring of historical structures
Erasmus Mundus Programme
64 ADVANCED MASTERS IN STRUCTURAL ANALYSIS OF MONUMENTS AND HISTORICAL CONSTRUCTIONS
5.4. Comparison of system
As the built instruments per-se are comparable to other commercially available options, the
system itself is not. The versatility of the system should not be ignored as it can bring to the
production of solutions so specifically built that they cannot be compared. For example, our
Data Acquisition System for LVDT had already implemented a temperature sensor, cost that
would probably be necessary to add to any other sensor.
In fact, all of the sensors present could have been attached to the same Arduino board, saving
a great amount of resources in powering, sensors and data management.
The possibility of adding devices and communication options will probably provide a great
economical advantage as well. In fact, in our instruments, there is a tendency for it to be
more competitive, the more complex it is.
Also to consider, is the option of printing the prototypes into PCB circuits which can
produce several copies. One of the options is using Fritzing [OR 33], which has a user-
friendly platform to convert Arduino designs into circuits.

Study on possibilities for low-cost monitoring of historical structures
Erasmus Mundus Programme
ADVANCED MASTERS IN STRUCTURAL ANALYSIS OF MONUMENTS AND HISTORICAL CONSTRUCTIONS 65
Chapter 6. Possibilities of Improvement
In the process of idealization of the devices, several ideas and paths were studied. Due to
limitation of resources, it was necessary to select where to focus. Nonetheless, there some of
those ideas could be used to improve the system and are here stated.
6.1. Optical light LVDT
Using a light resistor, it is possible to relate variations of light to variations of voltage. In an
ambient in which no light other than a controlled source exists, this behavior could be used
to assess the distance at which a light is from this sensor.
Figure 6.1. LED and light resistor in darkness
Using very cheap models of these sensors, a wooden board, cardboard and an old CD player,
a single direction prototype was made to verify the viability of the sensors.
Figure 6.2. Prototype to analyze optical LVDT

Study on possibilities for low-cost monitoring of historical structures
Erasmus Mundus Programme
66 ADVANCED MASTERS IN STRUCTURAL ANALYSIS OF MONUMENTS AND HISTORICAL CONSTRUCTIONS
Even with these rough materials it was easily possible to achieve enough darkness to get a
zero voltage reading from the resistor which means outside light was not significantly
influencing the results.
Using a rudimental scale a quick calibration test was performed. Setting the position as zero
and making movements of 0.5 mm by hand, the output voltage was read. The output voltage
of 0 to 5 V is mapped by Arduino to a value of 0 to 1023 (10 bit resolution).
Figure 6.3. Calibration of the light sensor prototype
Meaning there is an approximate variation in 36 points for each mm, making it believe its
resolution could be of 1/36 = 28 microns, which is in fact insufficient for the type of
measurement that we are trying to obtain, but it seems possible to use more accurate
materials and maybe to enhance resolution at the cost of range by transforming intermediate
readings from 0-5 volts back into 0-5. Another possibility is to use a board that has a higher
resolution such as Arduino Due which has 12 bit resolution, providing a 0 to 4095 reading.
Also, a digital response sensor could be the solution, as for example ROHM’s BH1745NUC
Digital 16bit serial output sensor delivers information directly read in 16bit and costs less
than 2€.
6.1.1. 3D Rotational Optical light LVDT
An easy to build and cheap device was imagined to measure three types of movement of a
crack, width variation, sliding and rotation.
Figure 6.4. Typical movements to be measured
The Idea for the 3D sensor was a device with 8 emitters (LED lights represented in green)
and 4 receivers (Light resistors represented in red) which could triangulate light readings
between them and from that derive what movement the crack had. In the picture below, four
columns can be seen connected in pairs. Each pair could be placed in each side of the crack.
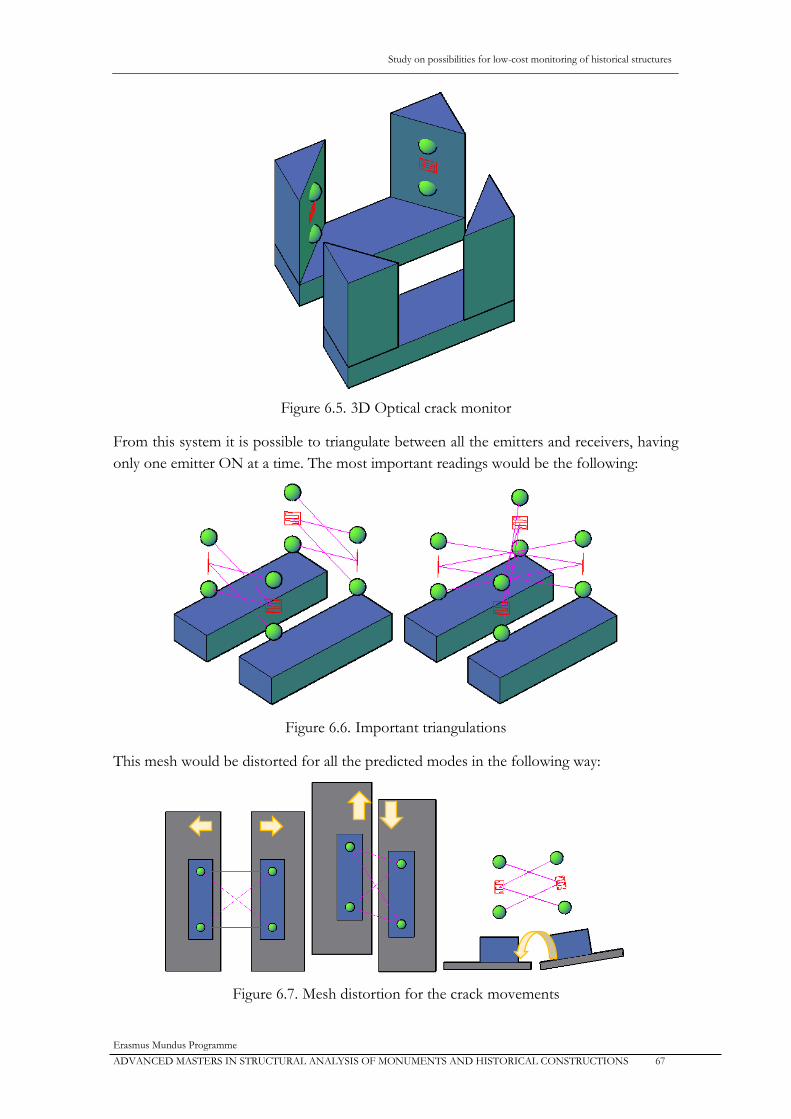
Study on possibilities for low-cost monitoring of historical structures
Erasmus Mundus Programme
ADVANCED MASTERS IN STRUCTURAL ANALYSIS OF MONUMENTS AND HISTORICAL CONSTRUCTIONS 67
Figure 6.5. 3D Optical crack monitor
From this system it is possible to triangulate between all the emitters and receivers, having
only one emitter ON at a time. The most important readings would be the following:
Figure 6.6. Important triangulations
This mesh would be distorted for all the predicted modes in the following way:
Figure 6.7. Mesh distortion for the crack movements
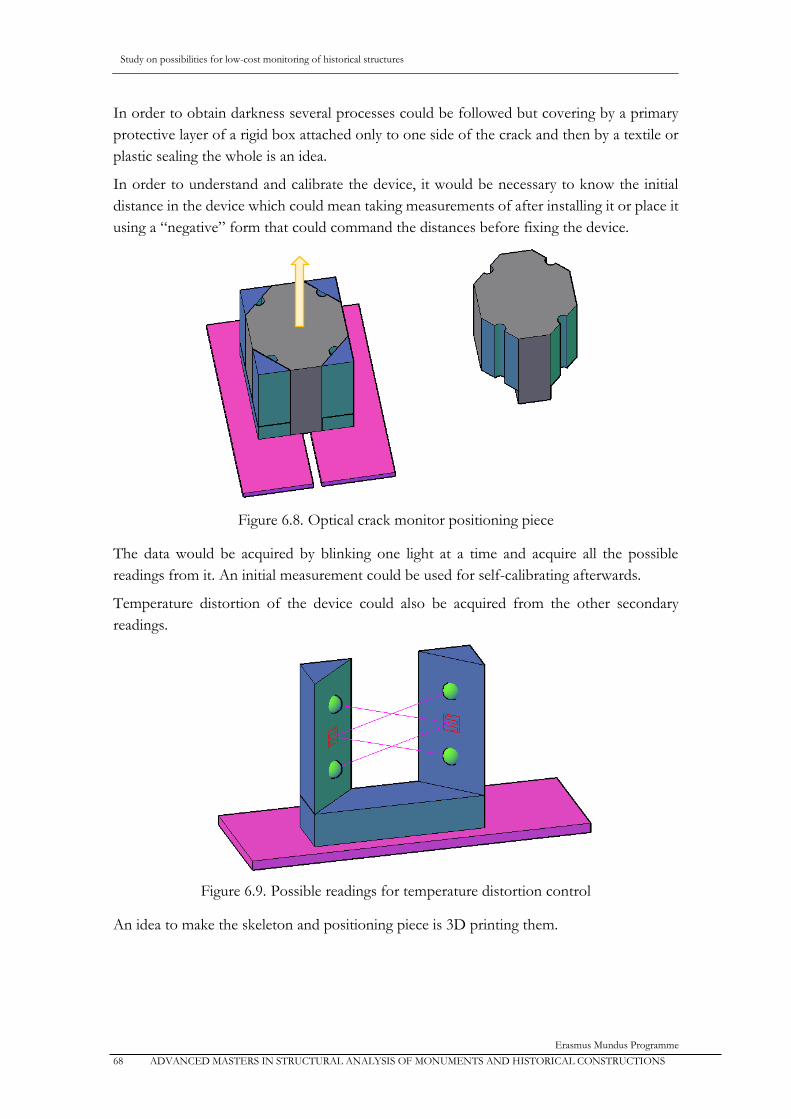
Study on possibilities for low-cost monitoring of historical structures
Erasmus Mundus Programme
68 ADVANCED MASTERS IN STRUCTURAL ANALYSIS OF MONUMENTS AND HISTORICAL CONSTRUCTIONS
In order to obtain darkness several processes could be followed but covering by a primary
protective layer of a rigid box attached only to one side of the crack and then by a textile or
plastic sealing the whole is an idea.
In order to understand and calibrate the device, it would be necessary to know the initial
distance in the device which could mean taking measurements of after installing it or place it
using a “negative” form that could command the distances before fixing the device.
Figure 6.8. Optical crack monitor positioning piece
The data would be acquired by blinking one light at a time and acquire all the possible
readings from it. An initial measurement could be used for self-calibrating afterwards.
Temperature distortion of the device could also be acquired from the other secondary
readings.
Figure 6.9. Possible readings for temperature distortion control
An idea to make the skeleton and positioning piece is 3D printing them.
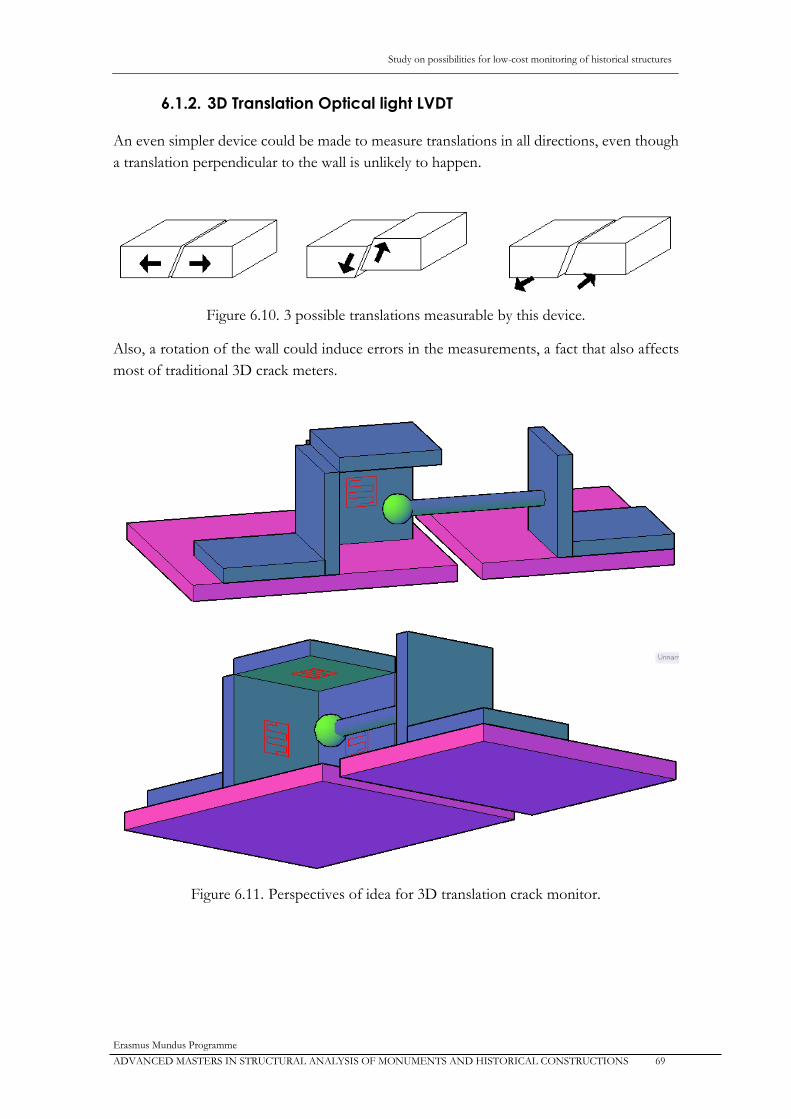
Study on possibilities for low-cost monitoring of historical structures
Erasmus Mundus Programme
ADVANCED MASTERS IN STRUCTURAL ANALYSIS OF MONUMENTS AND HISTORICAL CONSTRUCTIONS 69
6.1.2. 3D Translation Optical light LVDT
An even simpler device could be made to measure translations in all directions, even though
a translation perpendicular to the wall is unlikely to happen.
Figure 6.10. 3 possible translations measurable by this device.
Also, a rotation of the wall could induce errors in the measurements, a fact that also affects
most of traditional 3D crack meters.
Figure 6.11. Perspectives of idea for 3D translation crack monitor.

Study on possibilities for low-cost monitoring of historical structures
Erasmus Mundus Programme
70 ADVANCED MASTERS IN STRUCTURAL ANALYSIS OF MONUMENTS AND HISTORICAL CONSTRUCTIONS
6.2. Optical light Inclinometers
Several other Ideas were developed for measuring tilting of walls or other elements, most of
them taking advantage of a pendulum system.
6.2.1. Spectral receiver
Taking advantage of the price of cheap devices, the idea is to calibrate a cluster of light
sensors assigning several specters to different angles. Then, using mathematical tools such as
Fast-Fourier transformations, an angle could be found, hopefully with a good precision.
Figure 6.12. Spectral receiver example
This cluster of sensors would respond to the variation of angle in the picture above with the
values in the graphs below
Figure 6.13. Examples of results for spectral receiver.
Ultimately, a super cluster of receivers could be used such as an industrial line sensor (for
example Parallax TSL1401-DB, costs approximately 50€) or a camera’s image sensor (for
example ON’s KAI-0340 640x480 image sensor, costs approximately 150€), or many other
options.
This component must of course be mounted on a surface which angle is constant (or the
emitter’s angle to be constant), this could easily be done using pendulums (small), gyroscopes,
liquids or maybe rotation over an axis if an option with very low friction can be found.

Study on possibilities for low-cost monitoring of historical structures
Erasmus Mundus Programme
ADVANCED MASTERS IN STRUCTURAL ANALYSIS OF MONUMENTS AND HISTORICAL CONSTRUCTIONS 71
6.2.2. Pendulum Optical inclinometer
Taking advantage of a pendulum, many solutions can be found for measuring the variation
of distance in the bottom part. This distance is geometrically related to the leaning of the
wall and to the length of the pendulum. So, in order to have more accurate readings, a longer
pendulum can be used.
Figure 6.14. Pendulum inclinometer general concept
In order to measure this distance, many options are available.
- An emitter hanging in the pendulum and a photo sensor (or cluster) on the wall
(or reverse)
- Both emitter and receiver (or cluster) on the wall and a mirror hanging in the
pendulum
6.2.3. Mirror enhancer
Instead of trying to get a higher accuracy in the reading it is also possible to physically
multiply the effects caused by change of inclination (as the pendulum also does). Another
proposal is to multiply the angle using a set of mirrors in which one has a fixed angle (for
example hanging in a pendulum) and the other one varies the angle.
Following the scheme below, the angle variation of a wall be multiplied a few times using a
laser beam and two mirrors.

Study on possibilities for low-cost monitoring of historical structures
Erasmus Mundus Programme
72 ADVANCED MASTERS IN STRUCTURAL ANALYSIS OF MONUMENTS AND HISTORICAL CONSTRUCTIONS
Figure 6.15. Angle multiplication
The relation between readings and angle could be mathematically predicted but preferably
also calibrated.
With some imagination and a few more mirrors though, a 3D set of mirrors (box) can be
thought and a very big multiplication factor can be achieved.
6.3. Casing and waterproofing
In order to explore the versatility of this technology, the final shape and size of the
instrument is very random and variable. Because of this and in order to prolong the life of
the device, casing it should be taken seriously.
Several alternatives can be found and the time and money invested in them can even surpass
the cost of the instrument itself.
One good option is to 3D print a case adapted for the device. This can have immense
advantages because it allows almost all possibilities. Using 3D printing technology, it is
possible to build easily fixable and waterproof cases using external sensors, wireless
communicators, warning LEDs, easily accessible SD card slots and even LCD screens.
6.4. Solar orientation optimization
Panel orientation is directly connected to power production. The amount of energy that can
possible be absorbed is geometrically determined by the angle between the sunlight rays and
the solar panel. Because of this it is important to understand how to place the solar panel.
The orientation and tilt of the solar panel can be optimized during the day (east\west
rotation) and during the year (north\south rotation). Several online sources can be found to
understand the process and even some calculators such as the one in [OR 22].

Study on possibilities for low-cost monitoring of historical structures
Erasmus Mundus Programme
ADVANCED MASTERS IN STRUCTURAL ANALYSIS OF MONUMENTS AND HISTORICAL CONSTRUCTIONS 73
Figure 6.16. Best solar panel orientation for Barcelona according to [OR 22]
An Idea to optimize the production of energy is to rotate the panel using digitally controlled
servo motors. They could rotate the panel to a mathematically estimated optimal position
for that moment or use a few light resistors in order to find and follow the best direction of
light.
6.5. Energy saving
Although not applied in our instruments, several energy saving strategies can be used. Some
of them are:
- Using sleep modes which differ mostly by the waking up method [OR 24]
o Via external interrupt, a specific impulse.
o Via UART, when any data is received by USB
o Via an internal timer, controlling time with the internal clock
o Via the watchdog timer, controlling only the number of oscillations in the
processor.
- Shutting down several standard operating components [OR 25] such as:
o Power led
o Voltage regulator (needs external components to substitute)
o USB interface chip
- Building your own Arduino without any unnecessary circuitry for a specific
project [OR 26]
- Running all the possible components in 3.3 V instead of 5V
- Using a different type of Arduino Board (such as Mini, Micro or Nano)
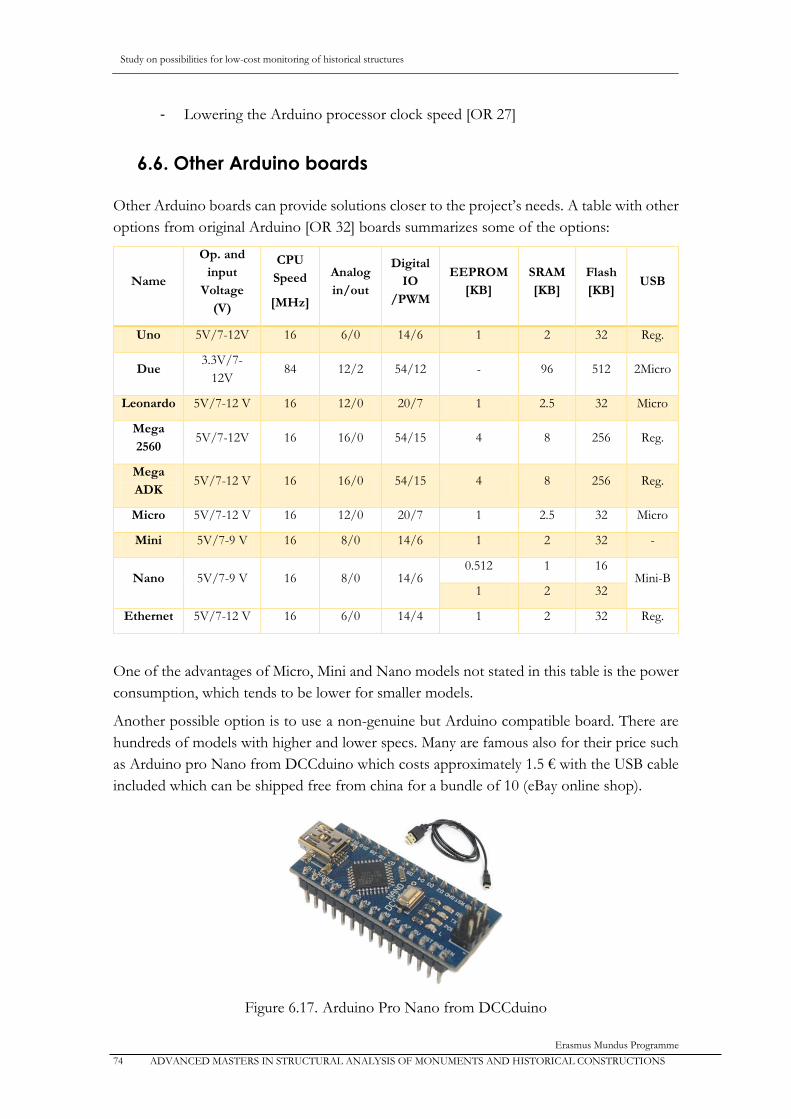
Study on possibilities for low-cost monitoring of historical structures
Erasmus Mundus Programme
74 ADVANCED MASTERS IN STRUCTURAL ANALYSIS OF MONUMENTS AND HISTORICAL CONSTRUCTIONS
- Lowering the Arduino processor clock speed [OR 27]
6.6. Other Arduino boards
Other Arduino boards can provide solutions closer to the project’s needs. A table with other
options from original Arduino [OR 32] boards summarizes some of the options:
Name
Op. and
input
Voltage
(V)
CPU
Speed
[MHz]
Analog
in/out
Digital
IO
/PWM
EEPROM
[KB]
SRAM
[KB]
Flash
[KB] USB
Uno 5V/7-12V 16 6/0 14/6 1 2 32 Reg.
Due
3.3V/7-
12V 84 12/2 54/12 - 96 512 2Micro
Leonardo 5V/7-12 V 16 12/0 20/7 1 2.5 32 Micro
Mega
2560
5V/7-12V 16 16/0 54/15 4 8 256 Reg.
Mega
ADK
5V/7-12 V 16 16/0 54/15 4 8 256 Reg.
Micro 5V/7-12 V 16 12/0 20/7 1 2.5 32 Micro
Mini 5V/7-9 V 16 8/0 14/6 1 2 32 -
Nano 5V/7-9 V 16 8/0 14/6 0.512 1 16
Mini-B 1 2 32
Ethernet 5V/7-12 V 16 6/0 14/4 1 2 32 Reg.
One of the advantages of Micro, Mini and Nano models not stated in this table is the power
consumption, which tends to be lower for smaller models.
Another possible option is to use a non-genuine but Arduino compatible board. There are
hundreds of models with higher and lower specs. Many are famous also for their price such
as Arduino pro Nano from DCCduino which costs approximately 1.5 € with the USB cable
included which can be shipped free from china for a bundle of 10 (eBay online shop).
Figure 6.17. Arduino Pro Nano from DCCduino
Study on possibilities for low-cost monitoring of historical structures
Erasmus Mundus Programme
ADVANCED MASTERS IN STRUCTURAL ANALYSIS OF MONUMENTS AND HISTORICAL CONSTRUCTIONS 75
Chapter 7. Conclusions
7.1. Summary
A research about the available components and learning platforms revealed that it was
possible to build a digitally controlled and affordable monitoring system.
A system for crack monitoring based on registering crack width, humidity, internal and
external temperature was built using Arduino technology and implemented in a real case
study for a total time of 23 days.
The performance of the system was evaluated and the meaning of the results was also briefly
approached.
An economic analysis was performed by comparing the instruments built with other
commercially available options. Also, advantages that are not comparable were exposed.
A collection of possibilities to improve the system both in performance and economically
was made.
7.2. Specific conclusions
A Do-it-yourself digitally controlled monitoring system was built and implemented. It
consisted on a crack monitoring system, thought from the combination of three power
sources (solar power, battery and direct current), three data transferring systems (Bluetooth,
xBee, SD card) and three sensors( temperature, humidity sensors and LVDT).With the
exception of the solar power system, its performance was very satisfactory.
An economic analysis of the experiment was made. The investment in the implemented
system was measured in terms of direct costs and time consumption. Using some
assumptions for cost of labor it was possible to compare the total cost with other
commercially available options. It was evidenced that due to learning costs it was not
economically reliable to build single and simple instruments, but there is a clear advantage in
building several similar devices or more complex instrumentation.
Ideas and prototypes for more powerful or less expensive instruments were developed and
explained. It was observed that the amount of tools and instruments available provide more
affordable options, possibility of refinement and freedom for creation.
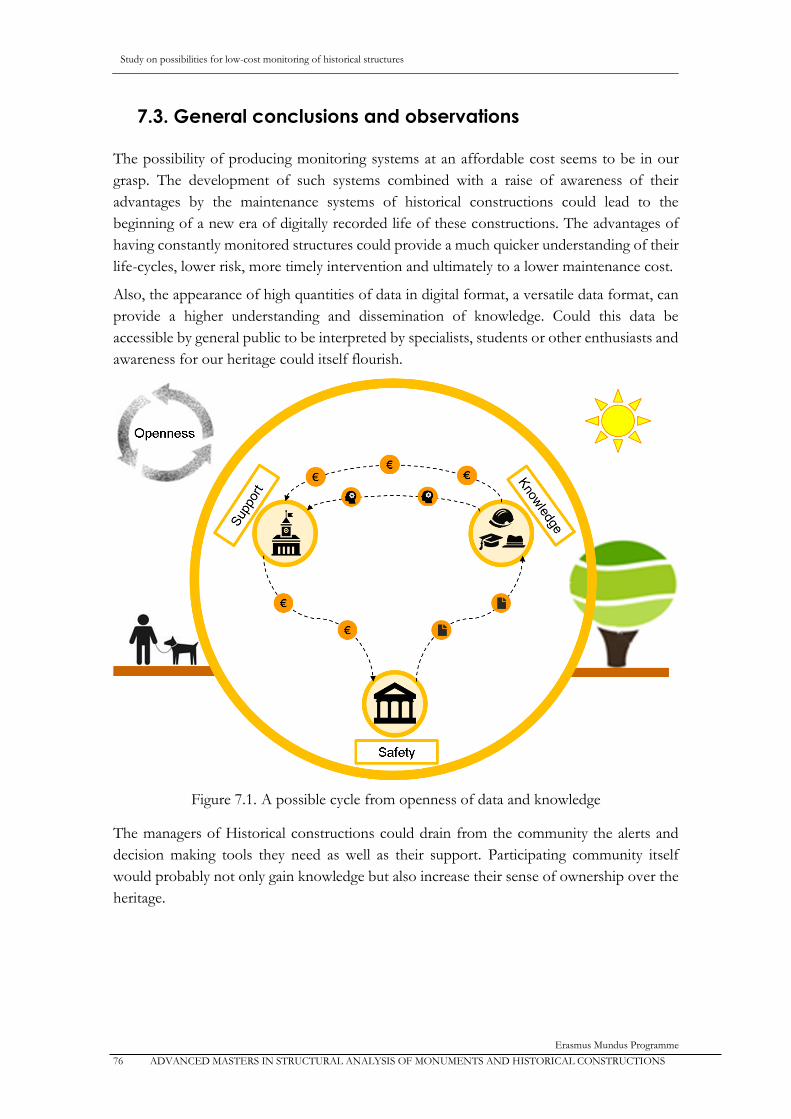
Study on possibilities for low-cost monitoring of historical structures
Erasmus Mundus Programme
76 ADVANCED MASTERS IN STRUCTURAL ANALYSIS OF MONUMENTS AND HISTORICAL CONSTRUCTIONS
7.3. General conclusions and observations
The possibility of producing monitoring systems at an affordable cost seems to be in our
grasp. The development of such systems combined with a raise of awareness of their
advantages by the maintenance systems of historical constructions could lead to the
beginning of a new era of digitally recorded life of these constructions. The advantages of
having constantly monitored structures could provide a much quicker understanding of their
life-cycles, lower risk, more timely intervention and ultimately to a lower maintenance cost.
Also, the appearance of high quantities of data in digital format, a versatile data format, can
provide a higher understanding and dissemination of knowledge. Could this data be
accessible by general public to be interpreted by specialists, students or other enthusiasts and
awareness for our heritage could itself flourish.
Figure 7.1. A possible cycle from openness of data and knowledge
The managers of Historical constructions could drain from the community the alerts and
decision making tools they need as well as their support. Participating community itself
would probably not only gain knowledge but also increase their sense of ownership over the
heritage.
Study on possibilities for low-cost monitoring of historical structures
Erasmus Mundus Programme
ADVANCED MASTERS IN STRUCTURAL ANALYSIS OF MONUMENTS AND HISTORICAL CONSTRUCTIONS 77
7.4. Suggestions for future work
Among an incredible amount of possibilities, it is easy to get lost. Interpreting this work as a
leap of civil engineers into the electronics field through a DIY approach, it seems advisable
to create and research with intent to solve a previously identified problem in mind.
With this perspective, several ideas were already given before. The list is here lengthened
with less explored ideas.
- Testing and increasing longevity of the equipment
- Increasing the prototype’s sturdiness
- Powering instruments
o Making your own solar panels
o Making self-orienting solar panel systems
- Refining of the instruments
o Choice of components
o Energy consumption
o Finding cheaper alternatives
- Data management
o Connect to LAN via Ethernet or Wi-Fi in order to spare computer on
site.
o Discover interesting programs for post-processing and adequate data
format for them.
- Prototyping sensors (voltage transducers)
o Research over Optical LVDT
o Research over proposed prototype of 3D LVDT
o Research over a simple tri-axial Optical 3D LVDT
o Creating new prototypes
- 3D Printing
o Versatility
o Protection
o Waterproofing
o Building sensors
Study on possibilities for low-cost monitoring of historical structures
Erasmus Mundus Programme
78 ADVANCED MASTERS IN STRUCTURAL ANALYSIS OF MONUMENTS AND HISTORICAL CONSTRUCTIONS
Chapter 8. References
8.1. Documents
- (Boller, C., 2009) - Encyclopedia of Structural Health Monitoring. Edited by
Christian Boller, Fu-Kuo Chang and Yozo Fujino, 2009 John Wiley & Sons, Ltd.
ISBN: 978-0-470-05822-0.
- (Marques, L., 2007) - Monitorização Estática e Dinâmica: Aplicações by Leandro
Marques and Paulo Lourenço, 2007, Universidade do Minho.
- (FIB, 2003) - “Monitoring and safety evaluation of existing concrete structures”,
Fédération Internationale du betón, State-of-art report, 2003.
- (Lorenzoni, 2015) – Structural Health Monitoring, presentation for “Inspection
and Diagnosis” Classes, “Structural Analysis of Monuments and Historical
Constructions” Masters by Filippo Lorenzoni, Padova 2015.
- (NIKER 9) – NIKER: New integrated knowledge based approaches to the
protection of cultural heritage from earthquake-induced risk, workpackage 9,
2012.
- (Mufti, 2008) - Mufti, A. Presentation at CSHM2 ’08 Sicily, Italy, 2008.
- (Nepori, 2013) - Arduino, La Rivoluzione dell’Open Hardware, by – Andrea
Nepori, Massimo Cittadini, Accademia Di Belle Arti di Carrara Scuola di Nuove
Tecnologie dell’Arte 2003.
- (Dougherty 2013) - Deloitte Center for the Edge and Maker Media, Inc.
December 2013. Impact of the Maker Movement.
- (Cooper, B. 2011) – Bradley Cooper, Object-Oriented Analysis and Design
Course, University of Colorado 2011.
- (Godde, 2009) – “Static monitoring analysis of Mallorca cathedral” by Emmanuel
Godde and Pere Roca, Polytechnic University of Catalonia, 2009.
- (Casarin, 2009) -– Structural Health Monitoring, presentation for “Inspection and
Diagnosis” Classes, “Structural Analysis of Monuments and Historical
Constructions” Masters, 2009.
- Texas instruments LM35 Precision Centigrade Temperature Sensors, SNIS159E
–August 1999 – revised January 2015
- AOSONG Temperature and humidity module AM2302
- AMTEK – Ultra high precision technologies, Solartron Metrology Analogue
Gauging datasheet
- ELECFREAKS Bluetooth HC-05/HC-06 modem user guide
- ELECFREAKS Octopus Real time clock model EF04005 user guide
Study on possibilities for low-cost monitoring of historical structures
Erasmus Mundus Programme
ADVANCED MASTERS IN STRUCTURAL ANALYSIS OF MONUMENTS AND HISTORICAL CONSTRUCTIONS 79
8.2. Online References:
- [OR 1] - http://www.batterystuff.com/kb/tools/solar-calculator.html
- [OR 2] - http://readwrite.com/2014/05/07/arduino-vs-raspberry-pi-projects-
diy-platform
- [OR 4] - http://www.hackvandedam.nl/blog/?p=762
- [OR 5] - http://www.atmel.com/images/doc8161.pdf
- [OR 6] - http://www.arduino.cc/
- [OR 7] - http://www.github.com/markruys/arduino-DHT
- [OR 8] - https://en.wikipedia.org/wiki/Voltage_divider
- [OR 9] - http://www.micro4you.com/files/ElecFreaks/Bluetooth%20HC-
06.pdf
- [OR 10] - https://www.sparkfun.com/pages/xbee_guide
- [OR 11] - https://en.wikipedia.org/wiki/Serial_Peripheral_Interface_Bus
- [OR 12] - https://en.wikipedia.org/wiki/8.3_filename
- [OR 13] - https://learn.sparkfun.com/tutorials/i2c
- [OR 14] - http://www.elecfreaks.com/wiki/index.php?title=Octopus_Real-
time_Clock
- [OR 15] - http://www.pjrc.com/teensy/td_libs_DS1307RTC.html
- [OR 16] - http://www.pjrc.com/teensy/td_libs_Time.html
- [OR 17] - https://en.wikipedia.org/wiki/Category:Free_plotting_software
- [OR 18] - http://www.datplot.com/
- [OR 20] - https://processing.org/
- [OR 21] - http://www.wunderground.com/
- [OR 22] - http://solarelectricityhandbook.com/solar-angle-calculator.html
- [OR 23] - http://www.vfcdataloggers.com/
- [OR 24] - http://donalmorrissey.blogspot.com.es/2010/04/putting-arduino-
diecimila-to-sleep-part.html
- [OR 25] - http://www.instructables.com/id/SOLAR-POWERED-
ARDUINO-WEATHER-STATION/
- [OR 26] - https://www.arduino.cc/en/Main/Standalone
- [OR 27] - https://www.youtube.com/watch?v=iMC6eG24S9g
- [OR 28] - https://en.wikipedia.org/wiki/Maker_culture
- [OR 29] -
http://www.npr.org/templates/story/story.php?storyId=92508461&ft=1&f=1
7
- [OR 30] - https://en.wikipedia.org/wiki/BASIC_Stamp
- [OR 31] - http://wiring.org.co/about.html
- [OR 32] - https://www.arduino.cc/en/Products.Compare
- [OR 33] - http://fritzing.org/home/

Study on possibilities for low-cost monitoring of historical structures
Erasmus Mundus Programme
80 ADVANCED MASTERS IN STRUCTURAL ANALYSIS OF MONUMENTS AND HISTORICAL CONSTRUCTIONS

Study on possibilities for low-cost monitoring of historical structures
Erasmus Mundus Programme
ADVANCED MASTERS IN STRUCTURAL ANALYSIS OF MONUMENTS AND HISTORICAL CONSTRUCTIONS 81
Appendix

Study on possibilities for low-cost monitoring of historical structures
Erasmus Mundus Programme
82 ADVANCED MASTERS IN STRUCTURAL ANALYSIS OF MONUMENTS AND HISTORICAL CONSTRUCTIONS
Appendix 1
Data acquisition program
To be compiled in Processing, Java language

Study on possibilities for low-cost monitoring of historical structures
Erasmus Mundus Programme
ADVANCED MASTERS IN STRUCTURAL ANALYSIS OF MONUMENTS AND HISTORICAL CONSTRUCTIONS 83
int i=0;
int nFiles=0;
int nData=0;
float maxA1=0;
float maxA2=0;
float maxA3=0;
//### Configuring from file
int[] config= new int[6];
//### Write to File
import processing.serial.*;
Serial mySerial;
PrintWriter output;
String Filename=
"Datafile1_"+year()+month()+day()+"_"+hour()+minute()+second()+".c
sv";
//### Graph data
int xPos = 1;
void setup() {
//### Configuring from file
String lines[] = loadStrings("ConfigFile.txt");
println("there are "+ lines.length + " lines in config file");
for (int i = 0 ; i < lines.length; i++)
{
println(lines[i]);
}
String myPort="";
for(i=0;i<=lines.length-1;i++)
{
String[] list = split(lines[i], ",");
config[i]=int(list[1]);
println(config[i]);
if (i==3) { myPort=list[1]; }
}
//### Write to File
for (i=0; i<Serial.list().length;i++)
{
if (Serial.list()[i].equals(myPort))
{
config[3]=i;
println("match");
println(config[3]);
}
}
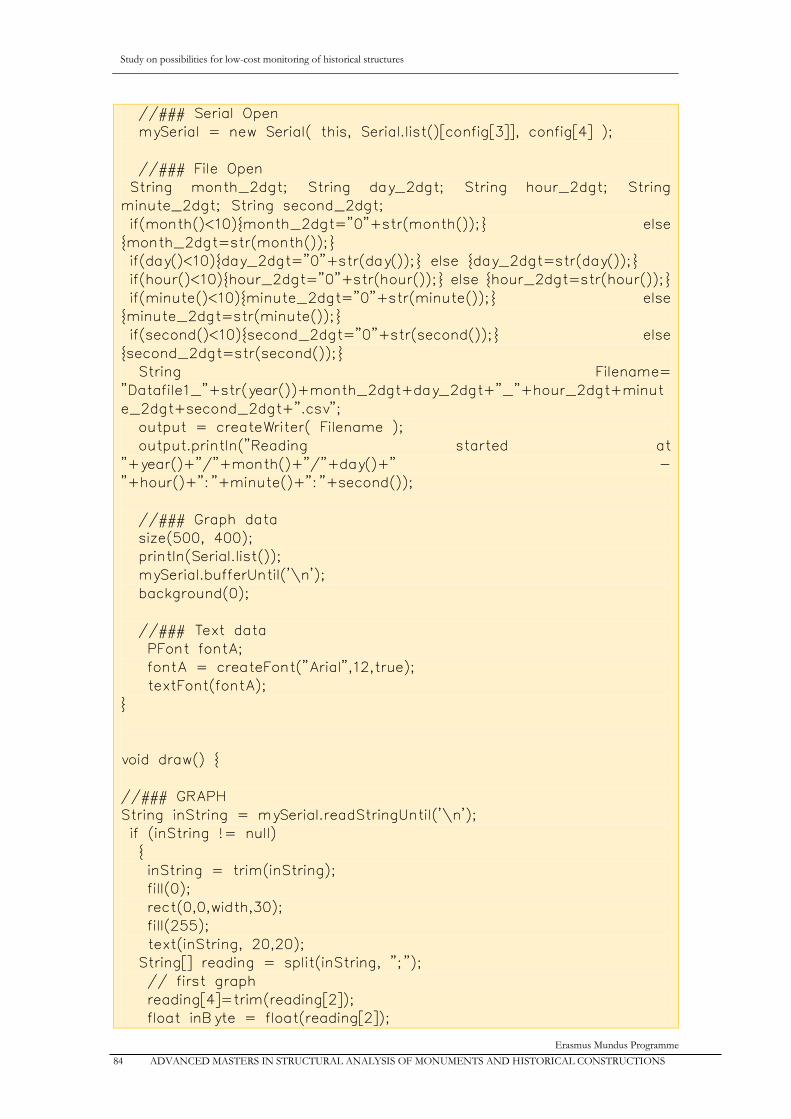
Study on possibilities for low-cost monitoring of historical structures
Erasmus Mundus Programme
84 ADVANCED MASTERS IN STRUCTURAL ANALYSIS OF MONUMENTS AND HISTORICAL CONSTRUCTIONS
//### Serial Open
mySerial = new Serial( this, Serial.list()[config[3]], config[4] );
//### File Open
String month_2dgt; String day_2dgt; String hour_2dgt; String
minute_2dgt; String second_2dgt;
if(month()<10){month_2dgt="0"+str(month());} else
{month_2dgt=str(month());}
if(day()<10){day_2dgt="0"+str(day());} else {day_2dgt=str(day());}
if(hour()<10){hour_2dgt="0"+str(hour());} else {hour_2dgt=str(hour());}
if(minute()<10){minute_2dgt="0"+str(minute());} else
{minute_2dgt=str(minute());}
if(second()<10){second_2dgt="0"+str(second());} else
{second_2dgt=str(second());}
String Filename=
"Datafile1_"+str(year())+month_2dgt+day_2dgt+"_"+hour_2dgt+minut
e_2dgt+second_2dgt+".csv";
output = createWriter( Filename );
output.println("Reading started at
"+year()+"/"+month()+"/"+day()+" -
"+hour()+":"+minute()+":"+second());
//### Graph data
size(500, 400);
println(Serial.list());
mySerial.bufferUntil('\n');
background(0);
//### Text data
PFont fontA;
fontA = createFont("Arial",12,true);
textFont(fontA);
}
void draw() {
//### GRAPH
String inString = mySerial.readStringUntil('\n');
if (inString != null)
{
inString = trim(inString);
fill(0);
rect(0,0,width,30);
fill(255);
text(inString, 20,20);
String[] reading = split(inString, ";");
// first graph
reading[4]=trim(reading[2]);
float inByte = float(reading[2]);

Study on possibilities for low-cost monitoring of historical structures
Erasmus Mundus Programme
ADVANCED MASTERS IN STRUCTURAL ANALYSIS OF MONUMENTS AND HISTORICAL CONSTRUCTIONS 85
if (inByte>maxA1)
{
maxA1=inByte;
}
inByte = map(inByte, 0, maxA1, 0, height-35);
stroke(#03FFE8);
point(xPos, height-inByte);
//Second graph
if (reading[3] != null)
{
reading[3]=trim(reading[3]);
inByte = float(reading[3]);
if (inByte>maxA2)
{
maxA2=inByte;
}
inByte = map(inByte, 0, maxA2, 0, height-35);
stroke(#FF0004);
point(xPos, height-inByte);
}
//Third graph
if (reading[4] != null)
{
reading[4]=trim(reading[4]);
inByte = float(reading[4]);
if (inByte>maxA3)
{
maxA3=inByte;
}
inByte = map(inByte, 0, maxA3, 0, height-35);
stroke(#FFF700);
point(xPos, height-inByte);
}
if (xPos >= width)
{
xPos = 0;
background(0);
}
else {
// increment the horizontal position:
xPos++;
}
}
//### Write to File
if (inString != null) {
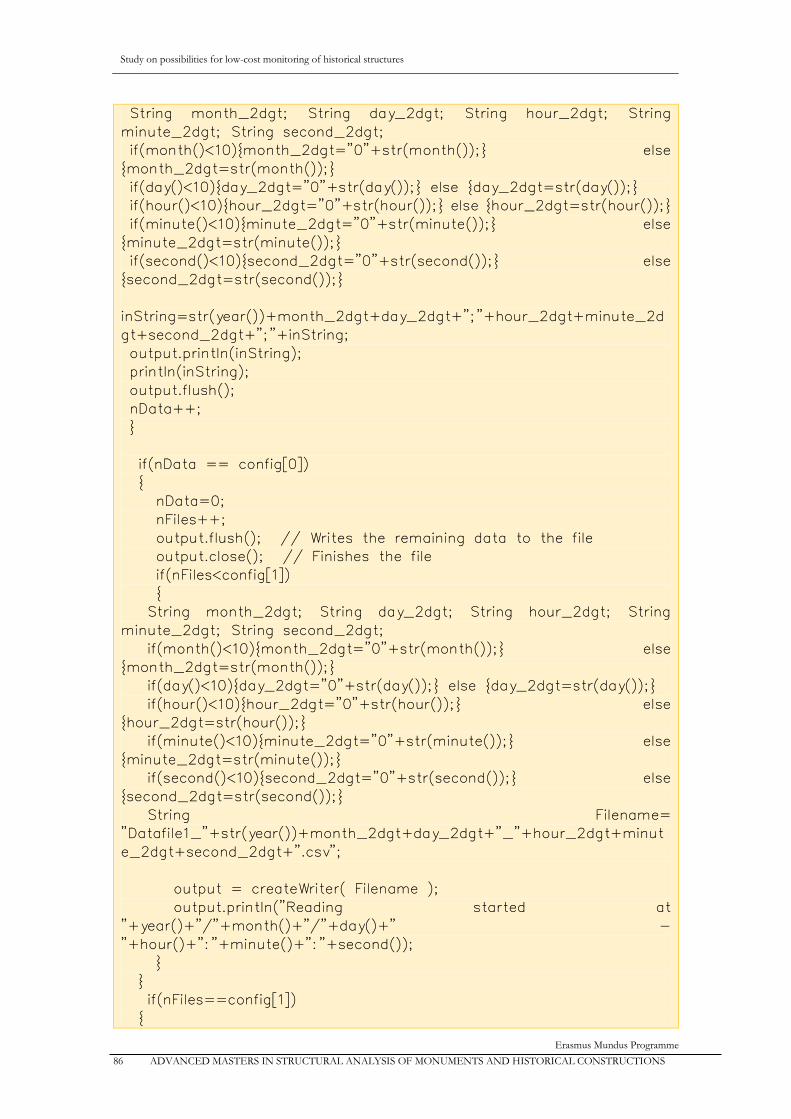
Study on possibilities for low-cost monitoring of historical structures
Erasmus Mundus Programme
86 ADVANCED MASTERS IN STRUCTURAL ANALYSIS OF MONUMENTS AND HISTORICAL CONSTRUCTIONS
String month_2dgt; String day_2dgt; String hour_2dgt; String
minute_2dgt; String second_2dgt;
if(month()<10){month_2dgt="0"+str(month());} else
{month_2dgt=str(month());}
if(day()<10){day_2dgt="0"+str(day());} else {day_2dgt=str(day());}
if(hour()<10){hour_2dgt="0"+str(hour());} else {hour_2dgt=str(hour());}
if(minute()<10){minute_2dgt="0"+str(minute());} else
{minute_2dgt=str(minute());}
if(second()<10){second_2dgt="0"+str(second());} else
{second_2dgt=str(second());}
inString=str(year())+month_2dgt+day_2dgt+";"+hour_2dgt+minute_2d
gt+second_2dgt+";"+inString;
output.println(inString);
println(inString);
output.flush();
nData++;
}
if(nData == config[0])
{
nData=0;
nFiles++;
output.flush(); // Writes the remaining data to the file
output.close(); // Finishes the file
if(nFiles<config[1])
{
String month_2dgt; String day_2dgt; String hour_2dgt; String
minute_2dgt; String second_2dgt;
if(month()<10){month_2dgt="0"+str(month());} else
{month_2dgt=str(month());}
if(day()<10){day_2dgt="0"+str(day());} else {day_2dgt=str(day());}
if(hour()<10){hour_2dgt="0"+str(hour());} else
{hour_2dgt=str(hour());}
if(minute()<10){minute_2dgt="0"+str(minute());} else
{minute_2dgt=str(minute());}
if(second()<10){second_2dgt="0"+str(second());} else
{second_2dgt=str(second());}
String Filename=
"Datafile1_"+str(year())+month_2dgt+day_2dgt+"_"+hour_2dgt+minut
e_2dgt+second_2dgt+".csv";
output = createWriter( Filename );
output.println("Reading started at
"+year()+"/"+month()+"/"+day()+" -
"+hour()+":"+minute()+":"+second());
}
}
if(nFiles==config[1])
{
Study on possibilities for low-cost monitoring of historical structures
Erasmus Mundus Programme
ADVANCED MASTERS IN STRUCTURAL ANALYSIS OF MONUMENTS AND HISTORICAL CONSTRUCTIONS 87
output.flush(); // Writes the remaining data to the file
output.close(); // Finishes the file
exit(); // Stops the program
}
delay(config[2]);
}
void keyPressed() {
output.flush(); // Writes the remaining data to the file
output.close(); // Finishes the file
int exitChoice = javax.swing.JOptionPane.showConfirmDialog(frame,
"You have unsaved changes. Are you sure you want to exit?",
"SketchName - Confirm exit",
javax.swing.JOptionPane.YES_NO_OPTION
);
if (exitChoice == javax.swing.JOptionPane.YES_OPTION)
{
exit();
}
}
Study on possibilities for low-cost monitoring of historical structures
Erasmus Mundus Programme
88 ADVANCED MASTERS IN STRUCTURAL ANALYSIS OF MONUMENTS AND HISTORICAL CONSTRUCTIONS
Appendix 2
Arduino programming of Temperature sensor
To be compiled in Arduino IDE, C++ language
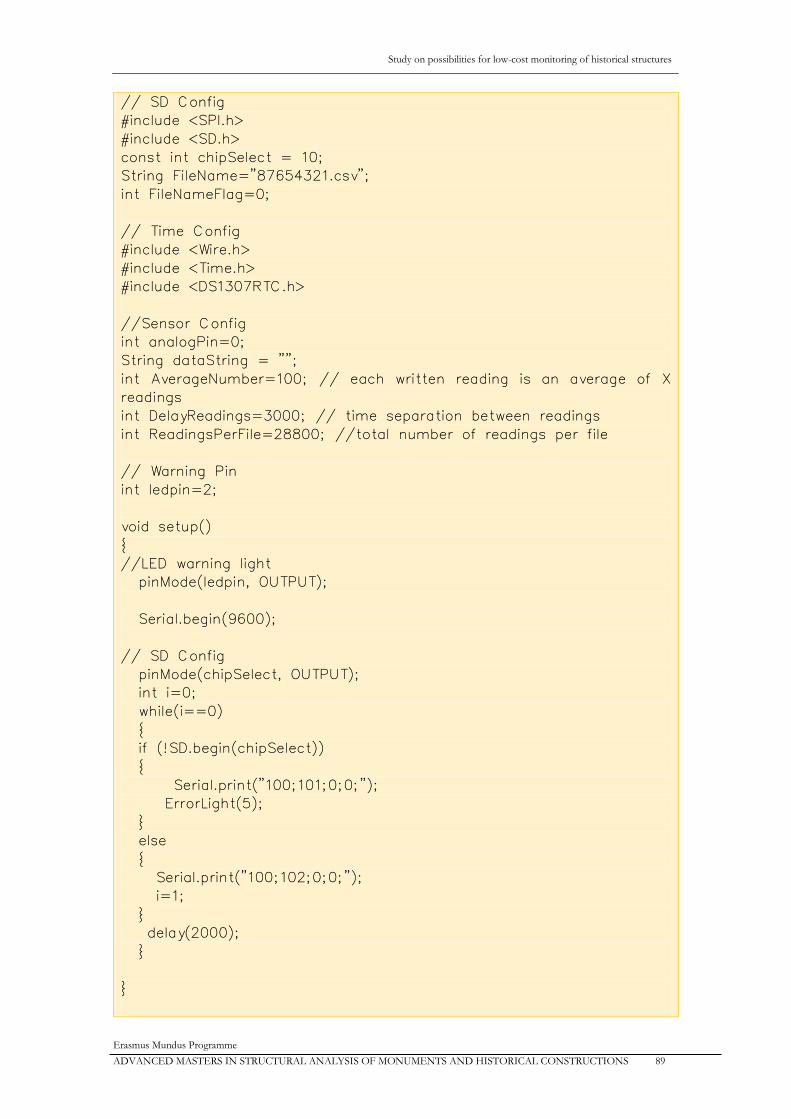
Study on possibilities for low-cost monitoring of historical structures
Erasmus Mundus Programme
ADVANCED MASTERS IN STRUCTURAL ANALYSIS OF MONUMENTS AND HISTORICAL CONSTRUCTIONS 89
// SD Config
#include <SPI.h>
#include <SD.h>
const int chipSelect = 10;
String FileName="87654321.csv";
int FileNameFlag=0;
// Time Config
#include <Wire.h>
#include <Time.h>
#include <DS1307RTC.h>
//Sensor Config
int analogPin=0;
String dataString = "";
int AverageNumber=100; // each written reading is an average of X
readings
int DelayReadings=3000; // time separation between readings
int ReadingsPerFile=28800; //total number of readings per file
// Warning Pin
int ledpin=2;
void setup()
{
//LED warning light
pinMode(ledpin, OUTPUT);
Serial.begin(9600);
// SD Config
pinMode(chipSelect, OUTPUT);
int i=0;
while(i==0)
{
if (!SD.begin(chipSelect))
{
Serial.print("100;101;0;0;");
ErrorLight(5);
}
else
{
Serial.print("100;102;0;0;");
i=1;
}
delay(2000);
}
}
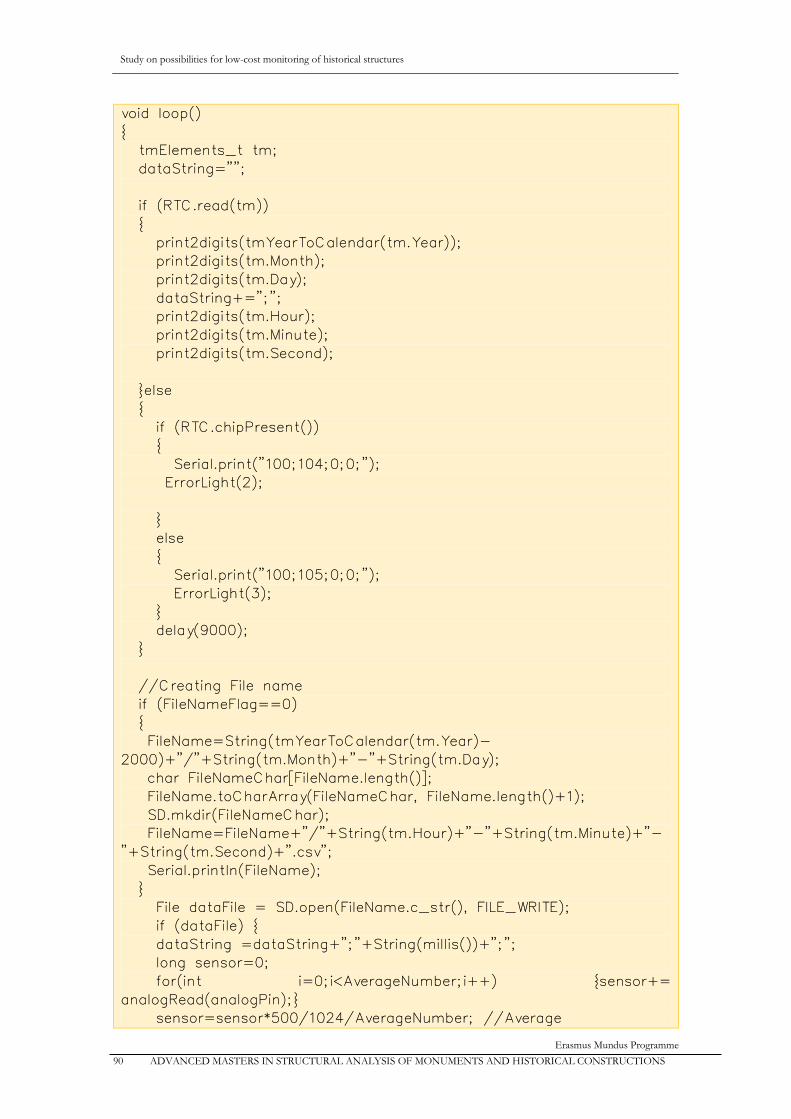
Study on possibilities for low-cost monitoring of historical structures
Erasmus Mundus Programme
90 ADVANCED MASTERS IN STRUCTURAL ANALYSIS OF MONUMENTS AND HISTORICAL CONSTRUCTIONS
void loop()
{
tmElements_t tm;
dataString="";
if (RTC.read(tm))
{
print2digits(tmYearToCalendar(tm.Year));
print2digits(tm.Month);
print2digits(tm.Day);
dataString+=";";
print2digits(tm.Hour);
print2digits(tm.Minute);
print2digits(tm.Second);
}else
{
if (RTC.chipPresent())
{
Serial.print("100;104;0;0;");
ErrorLight(2);
}
else
{
Serial.print("100;105;0;0;");
ErrorLight(3);
}
delay(9000);
}
//Creating File name
if (FileNameFlag==0)
{
FileName=String(tmYearToCalendar(tm.Year)-
2000)+"/"+String(tm.Month)+"-"+String(tm.Day);
char FileNameChar[FileName.length()];
FileName.toCharArray(FileNameChar, FileName.length()+1);
SD.mkdir(FileNameChar);
FileName=FileName+"/"+String(tm.Hour)+"-"+String(tm.Minute)+"-
"+String(tm.Second)+".csv";
Serial.println(FileName);
}
File dataFile = SD.open(FileName.c_str(), FILE_WRITE);
if (dataFile) {
dataString =dataString+";"+String(millis())+";";
long sensor=0;
for(int i=0;i<AverageNumber;i++) {sensor+=
analogRead(analogPin);}
sensor=sensor*500/1024/AverageNumber; //Average

Study on possibilities for low-cost monitoring of historical structures
Erasmus Mundus Programme
ADVANCED MASTERS IN STRUCTURAL ANALYSIS OF MONUMENTS AND HISTORICAL CONSTRUCTIONS 91
dataString += String(sensor);
dataFile.println(dataString);
dataFile.close();
digitalWrite(ledpin,HIGH);
delay(5);
digitalWrite(ledpin,LOW);
Serial.println(dataString);
}
Else
{
Serial.print("100;103;0;0;");
ErrorLight(4);
FileNameFlag=ReadingsPerFile-1;
}
//Number of readings per File
FileNameFlag++;
if (FileNameFlag==ReadingsPerFile) { FileNameFlag=0; }
//Time between Readings
delay(DelayReadings);
}
void print2digits(int number) {
if (number >= 0 && number < 10)
{
dataString+="0";
}
dataString+=number;
}
void ErrorLight(int blinks)
{
for (int i=0;i<blinks;i++)
{
digitalWrite(ledpin,HIGH);
delay(1000);
digitalWrite(ledpin,LOW);
delay(200);
}
delay(2000);
return;
}
Study on possibilities for low-cost monitoring of historical structures
Erasmus Mundus Programme
92 ADVANCED MASTERS IN STRUCTURAL ANALYSIS OF MONUMENTS AND HISTORICAL CONSTRUCTIONS
Appendix 3
Arduino programming of LVDT sensor
To be compiled in Arduino IDE, C++ language
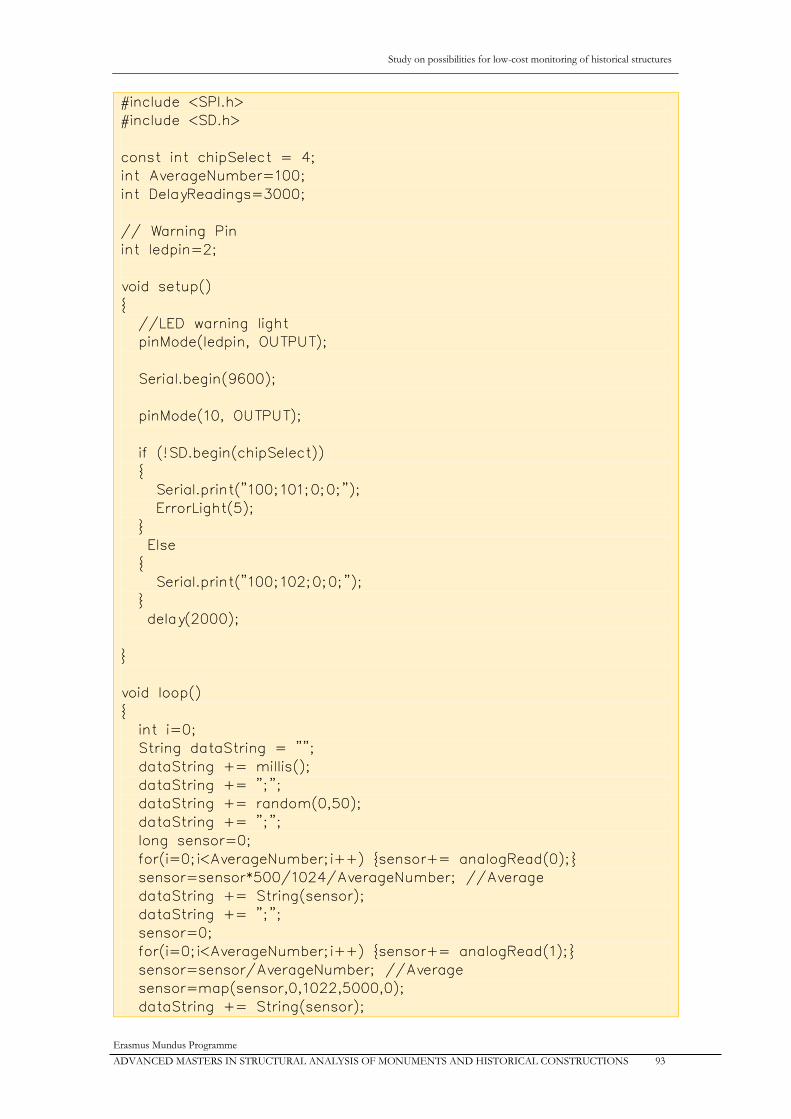
Study on possibilities for low-cost monitoring of historical structures
Erasmus Mundus Programme
ADVANCED MASTERS IN STRUCTURAL ANALYSIS OF MONUMENTS AND HISTORICAL CONSTRUCTIONS 93
#include <SPI.h>
#include <SD.h>
const int chipSelect = 4;
int AverageNumber=100;
int DelayReadings=3000;
// Warning Pin
int ledpin=2;
void setup()
{
//LED warning light
pinMode(ledpin, OUTPUT);
Serial.begin(9600);
pinMode(10, OUTPUT);
if (!SD.begin(chipSelect))
{
Serial.print("100;101;0;0;");
ErrorLight(5);
}
Else
{
Serial.print("100;102;0;0;");
}
delay(2000);
}
void loop()
{
int i=0;
String dataString = "";
dataString += millis();
dataString += ";";
dataString += random(0,50);
dataString += ";";
long sensor=0;
for(i=0;i<AverageNumber;i++) {sensor+= analogRead(0);}
sensor=sensor*500/1024/AverageNumber; //Average
dataString += String(sensor);
dataString += ";";
sensor=0;
for(i=0;i<AverageNumber;i++) {sensor+= analogRead(1);}
sensor=sensor/AverageNumber; //Average
sensor=map(sensor,0,1022,5000,0);
dataString += String(sensor);
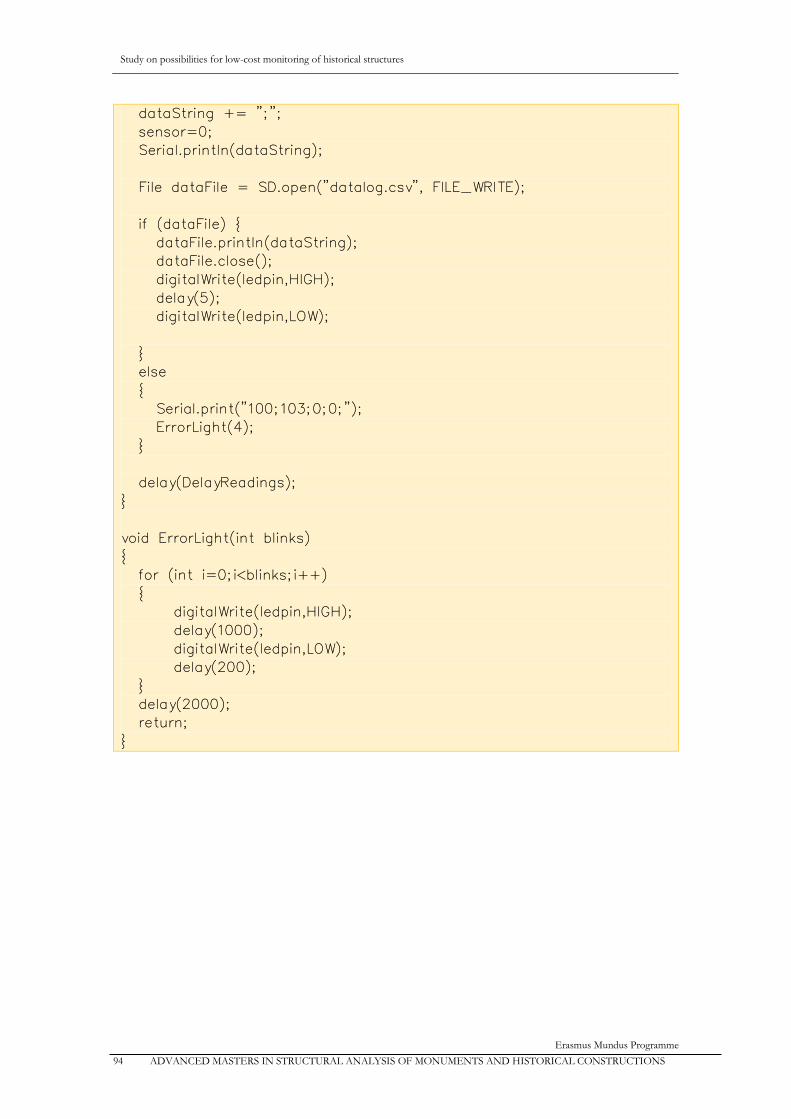
Study on possibilities for low-cost monitoring of historical structures
Erasmus Mundus Programme
94 ADVANCED MASTERS IN STRUCTURAL ANALYSIS OF MONUMENTS AND HISTORICAL CONSTRUCTIONS
dataString += ";";
sensor=0;
Serial.println(dataString);
File dataFile = SD.open("datalog.csv", FILE_WRITE);
if (dataFile) {
dataFile.println(dataString);
dataFile.close();
digitalWrite(ledpin,HIGH);
delay(5);
digitalWrite(ledpin,LOW);
}
else
{
Serial.print("100;103;0;0;");
ErrorLight(4);
}
delay(DelayReadings);
}
void ErrorLight(int blinks)
{
for (int i=0;i<blinks;i++)
{
digitalWrite(ledpin,HIGH);
delay(1000);
digitalWrite(ledpin,LOW);
delay(200);
}
delay(2000);
return;
}

Study on possibilities for low-cost monitoring of historical structures
Erasmus Mundus Programme
ADVANCED MASTERS IN STRUCTURAL ANALYSIS OF MONUMENTS AND HISTORICAL CONSTRUCTIONS 95
Appendix 4
Arduino programming of Humidity sensor
To be compiled in Arduino IDE, C++ language

Study on possibilities for low-cost monitoring of historical structures
Erasmus Mundus Programme
96 ADVANCED MASTERS IN STRUCTURAL ANALYSIS OF MONUMENTS AND HISTORICAL CONSTRUCTIONS
// SD Config
#include <SPI.h>
#include <SD.h>
const int chipSelect = 10; //was 4 for wifi shield
//Bluetooth config
#include <SoftwareSerial.h>
#define rxPin 2
#define txPin 3
SoftwareSerial mySerial(rxPin, txPin);
//DHT config
#include "DHT.h"
DHT dht;
//Sensor Config
const int AnalogPin = 0;
const int DigitalPin = 7;
float AnalogVal=0;
float DigitalVal=0;
int i=0;
String ExportedValue=" ";
int AverageNumber=100; // each written reading is an average of X
readings
int DelayReadings=3000; // time separation between readings
// Warning Pin
int ledpin=5;
void setup()
{
//LED warning light
pinMode(ledpin, OUTPUT);
// define pin modes for tx, rx pins:
pinMode(rxPin, INPUT);
pinMode(txPin, OUTPUT);
mySerial.begin(9600);
Serial.begin(9600);
// Input
Serial.begin(9600);
pinMode(AnalogPin, INPUT);
dht.setup(DigitalPin);
// SD Config
Serial.print("100;100;0;0;");
pinMode(chipSelect, OUTPUT);
if (!SD.begin(chipSelect))
{
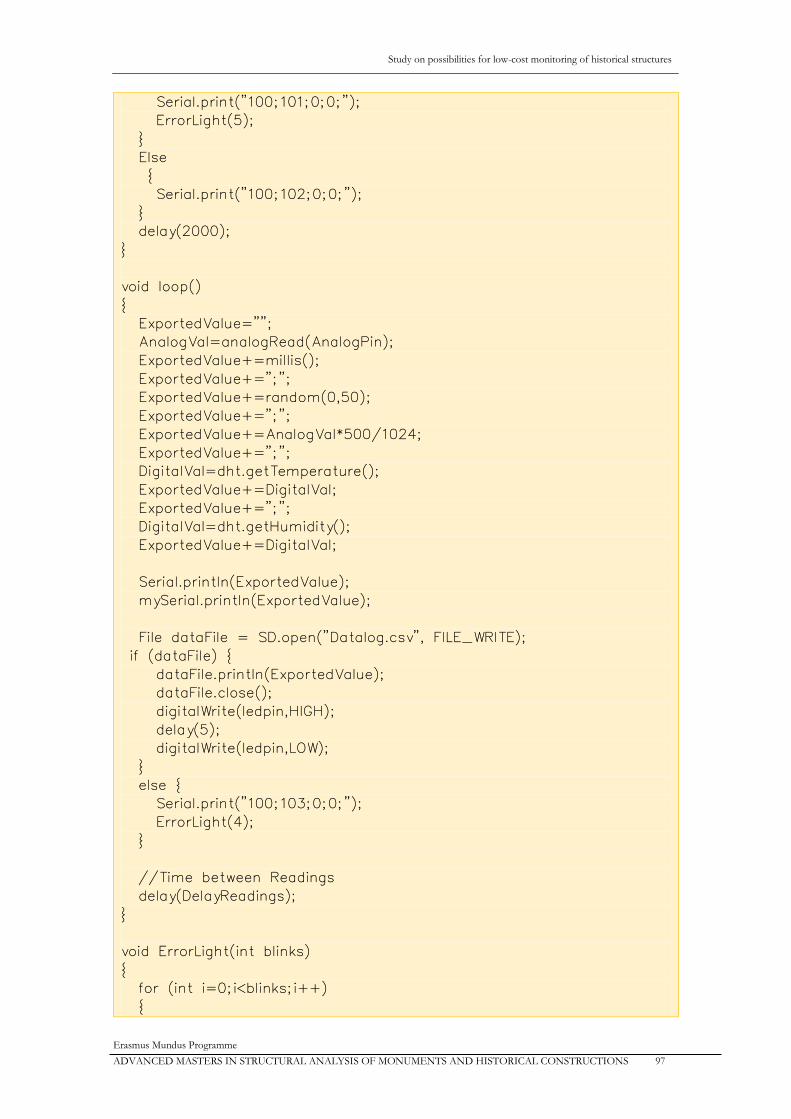
Study on possibilities for low-cost monitoring of historical structures
Erasmus Mundus Programme
ADVANCED MASTERS IN STRUCTURAL ANALYSIS OF MONUMENTS AND HISTORICAL CONSTRUCTIONS 97
Serial.print("100;101;0;0;");
ErrorLight(5);
}
Else
{
Serial.print("100;102;0;0;");
}
delay(2000);
}
void loop()
{
ExportedValue="";
AnalogVal=analogRead(AnalogPin);
ExportedValue+=millis();
ExportedValue+=";";
ExportedValue+=random(0,50);
ExportedValue+=";";
ExportedValue+=AnalogVal*500/1024;
ExportedValue+=";";
DigitalVal=dht.getTemperature();
ExportedValue+=DigitalVal;
ExportedValue+=";";
DigitalVal=dht.getHumidity();
ExportedValue+=DigitalVal;
Serial.println(ExportedValue);
mySerial.println(ExportedValue);
File dataFile = SD.open("Datalog.csv", FILE_WRITE);
if (dataFile) {
dataFile.println(ExportedValue);
dataFile.close();
digitalWrite(ledpin,HIGH);
delay(5);
digitalWrite(ledpin,LOW);
}
else {
Serial.print("100;103;0;0;");
ErrorLight(4);
}
//Time between Readings
delay(DelayReadings);
}
void ErrorLight(int blinks)
{
for (int i=0;i<blinks;i++)
{
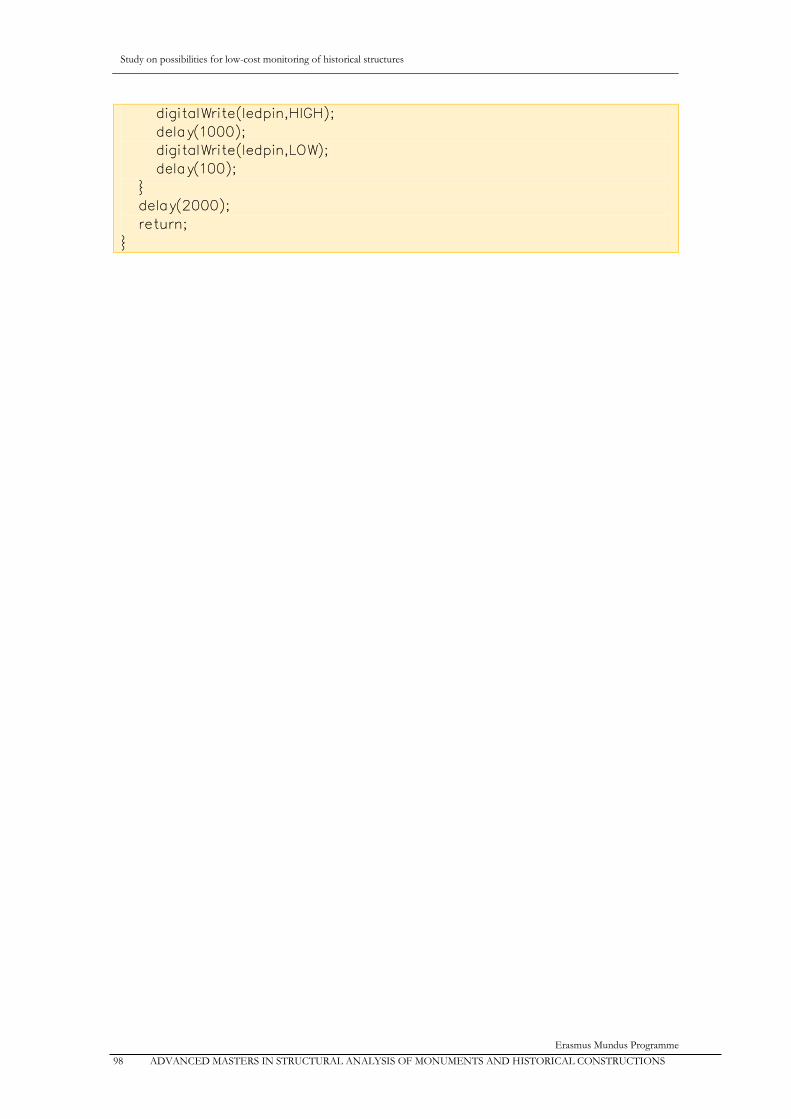
Study on possibilities for low-cost monitoring of historical structures
Erasmus Mundus Programme
98 ADVANCED MASTERS IN STRUCTURAL ANALYSIS OF MONUMENTS AND HISTORICAL CONSTRUCTIONS
digitalWrite(ledpin,HIGH);
delay(1000);
digitalWrite(ledpin,LOW);
delay(100);
}
delay(2000);
return;
}

Study on possibilities for low-cost monitoring of historical structures
Erasmus Mundus Programme
ADVANCED MASTERS IN STRUCTURAL ANALYSIS OF MONUMENTS AND HISTORICAL CONSTRUCTIONS 99
Appendix 5
Arduino programming of Prototype testing with direct results
To be compiled in Arduino IDE, C++ language
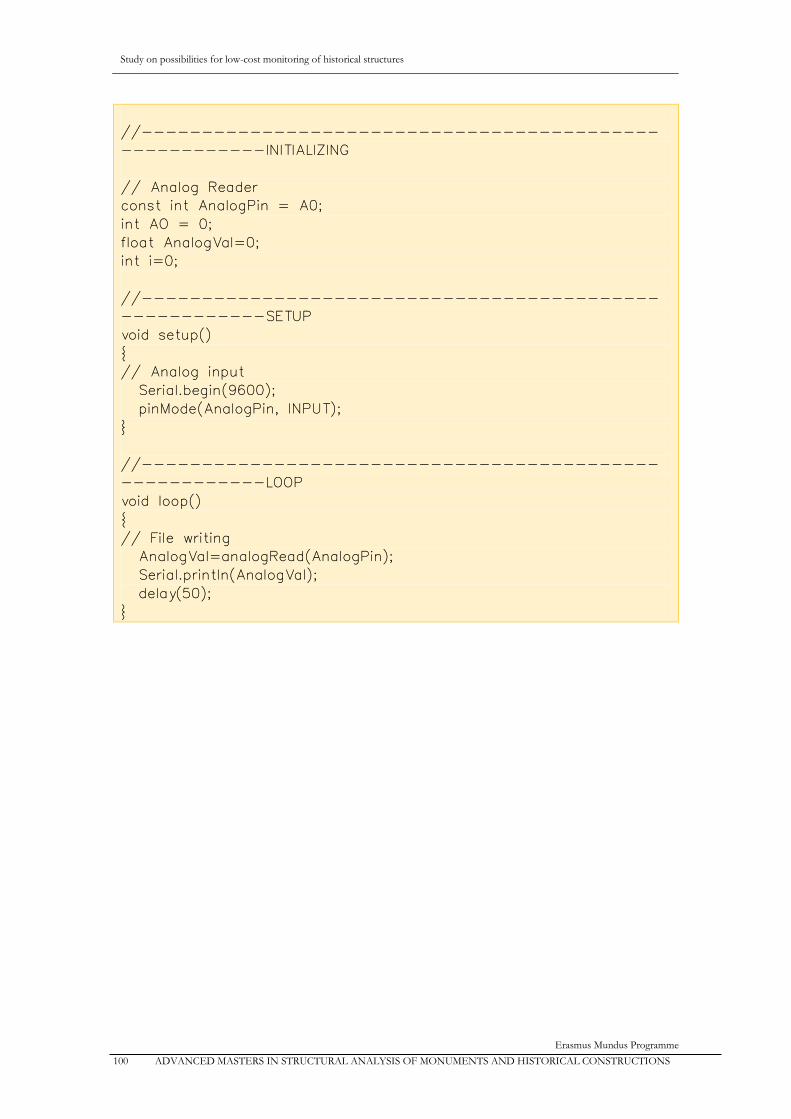
Study on possibilities for low-cost monitoring of historical structures
Erasmus Mundus Programme
100 ADVANCED MASTERS IN STRUCTURAL ANALYSIS OF MONUMENTS AND HISTORICAL CONSTRUCTIONS
//-------------------------------------------
------------INITIALIZING
// Analog Reader
const int AnalogPin = A0;
int AO = 0;
float AnalogVal=0;
int i=0;
//-------------------------------------------
------------SETUP
void setup()
{
// Analog input
Serial.begin(9600);
pinMode(AnalogPin, INPUT);
}
//-------------------------------------------
------------LOOP
void loop()
{
// File writing
AnalogVal=analogRead(AnalogPin);
Serial.println(AnalogVal);
delay(50);
}

Study on possibilities for low-cost monitoring of historical structures
Erasmus Mundus Programme
ADVANCED MASTERS IN STRUCTURAL ANALYSIS OF MONUMENTS AND HISTORICAL CONSTRUCTIONS 101
Appendix 6
Arduino programming of Prototype testing with averages
To be compiled in Arduino IDE, C++ language
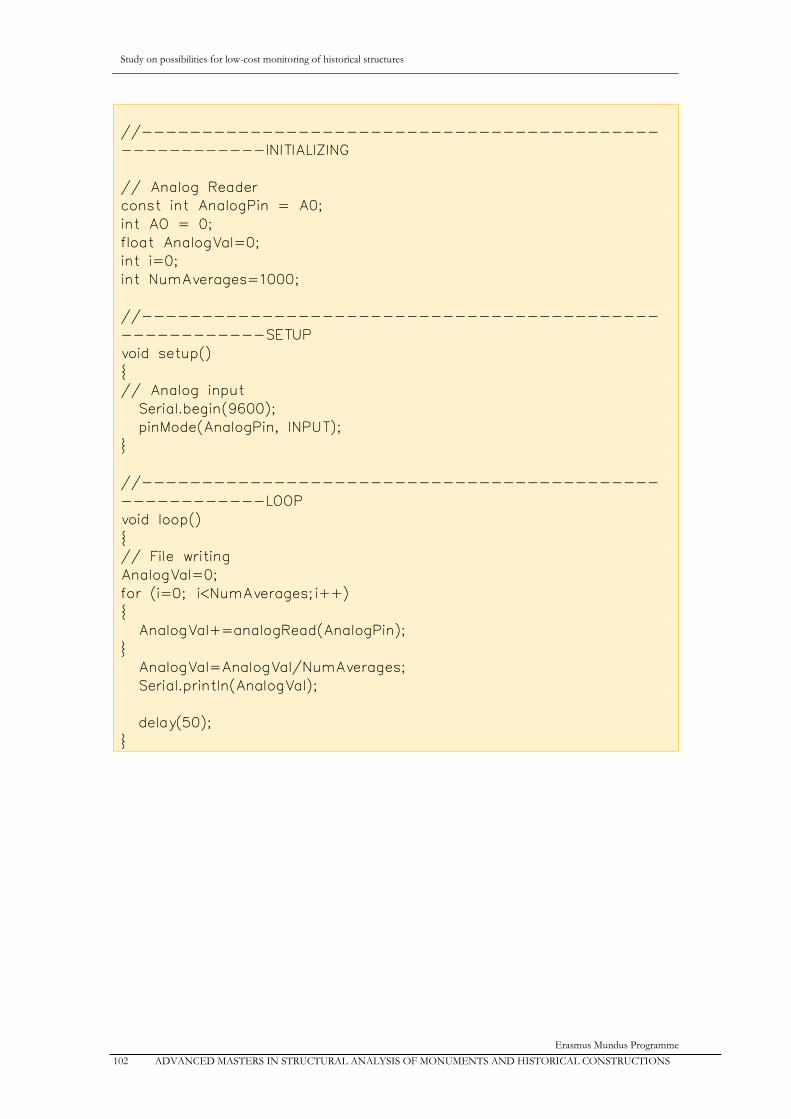
Study on possibilities for low-cost monitoring of historical structures
Erasmus Mundus Programme
102 ADVANCED MASTERS IN STRUCTURAL ANALYSIS OF MONUMENTS AND HISTORICAL CONSTRUCTIONS
//-------------------------------------------
------------INITIALIZING
// Analog Reader
const int AnalogPin = A0;
int AO = 0;
float AnalogVal=0;
int i=0;
int NumAverages=1000;
//-------------------------------------------
------------SETUP
void setup()
{
// Analog input
Serial.begin(9600);
pinMode(AnalogPin, INPUT);
}
//-------------------------------------------
------------LOOP
void loop()
{
// File writing
AnalogVal=0;
for (i=0; i<NumAverages;i++)
{
AnalogVal+=analogRead(AnalogPin);
}
AnalogVal=AnalogVal/NumAverages;
Serial.println(AnalogVal);
delay(50);
}

Study on possibilities for low-cost monitoring of historical structures
Erasmus Mundus Programme
ADVANCED MASTERS IN STRUCTURAL ANALYSIS OF MONUMENTS AND HISTORICAL CONSTRUCTIONS 103
Appendix 7
Arduino programming of programs for testing Arduino Reading frequency
To be compiled in Arduino IDE, C++ language

Study on possibilities for low-cost monitoring of historical structures
Erasmus Mundus Programme
104 ADVANCED MASTERS IN STRUCTURAL ANALYSIS OF MONUMENTS AND HISTORICAL CONSTRUCTIONS
For reading from a single analog sensor:
//---INITIALIZING
// Analog Reader
const int AnalogPin = A0;
int AO = 0;
float AnalogVal=0;
int i=0;
//---SETUP
void setup()
{
// Analog input
Serial.begin(9600);
pinMode(AnalogPin, INPUT);
}
//---LOOP
void loop()
{
i++;
// File writing
AnalogVal=analogRead(AnalogPin);
Serial.print(i);
Serial.print(";");
Serial.print(millis());
Serial.print(";");
Serial.println(AnalogVal);
}
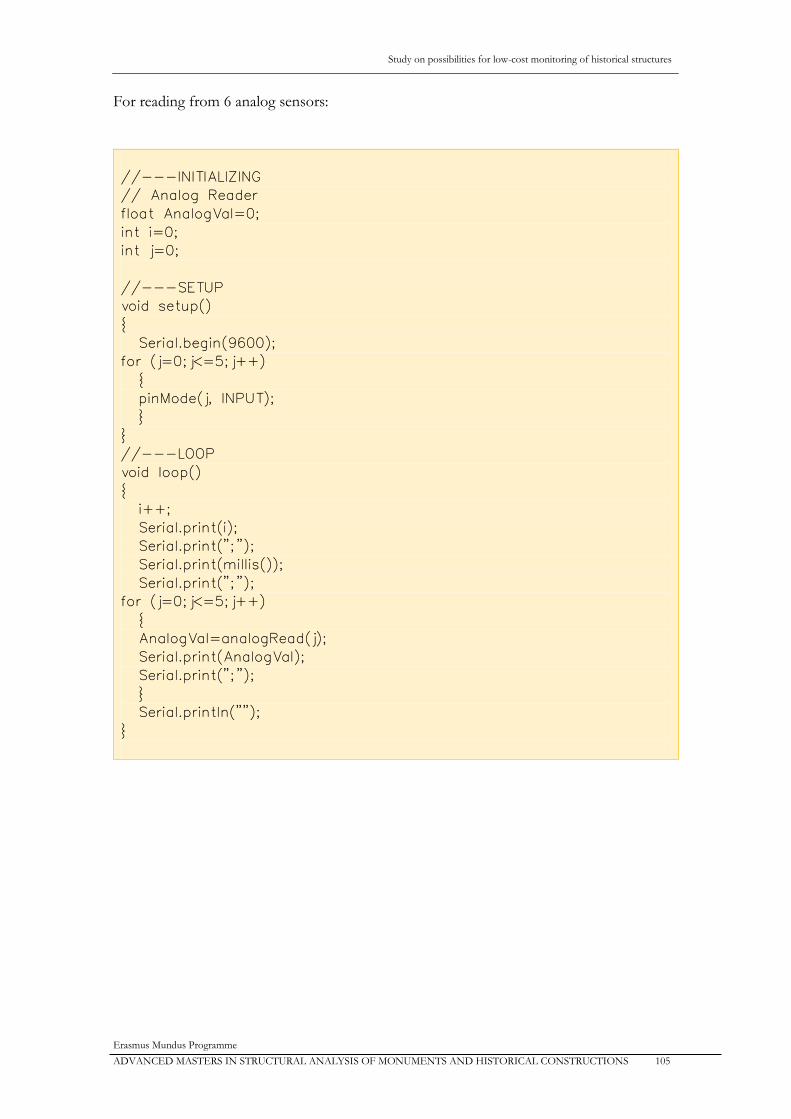
Study on possibilities for low-cost monitoring of historical structures
Erasmus Mundus Programme
ADVANCED MASTERS IN STRUCTURAL ANALYSIS OF MONUMENTS AND HISTORICAL CONSTRUCTIONS 105
For reading from 6 analog sensors:
//---INITIALIZING
// Analog Reader
float AnalogVal=0;
int i=0;
int j=0;
//---SETUP
void setup()
{
Serial.begin(9600);
for (j=0;j<=5;j++)
{
pinMode(j, INPUT);
}
}
//---LOOP
void loop()
{
i++;
Serial.print(i);
Serial.print(";");
Serial.print(millis());
Serial.print(";");
for (j=0;j<=5;j++)
{
AnalogVal=analogRead(j);
Serial.print(AnalogVal);
Serial.print(";");
}
Serial.println("");
}