
Willie gary willie gary esqWillie Gary Attorney - Willie Gary Esq (800) 329-4279
Upload
nguyenngocCategory
view
221download
2
A Community-Based Participatory Assessment ofFish Consumption and Dietary Mercury Exposure along the Lower James River, Virginia USA
A Dissertation
Presented to
The Faculty ofthe School of Marine Science
The College of William & Mary in Virginia
In Partial Fulfillment
of the Requirements for the Degree of
Doctor of Philosophy
by
Erica L. Holloman
2011

APPROVAL SHEET
This dissertation is submitted in partial fulfillment of
the requirements for the degree of
. Doctor of Philosophy
j£ of li/lrhd--Erica L. Holloman
Approved by the Com::a Dece')Jfer 3!)11
tLu~JC-~ Michael C. Newman, Ph.D. Committee Chairman/ Advisor
Michael A. Unger, Ph.D .
. ~1
Jerome Nriagu, Ph.I:f~ Sc.D. University of Michigan A1/n Arbor, Michigan . /)
f r'f) !/.. 1.; ~ I 1<-v(,----z t. I ~ ._..----.__ t
'-.._...1'. Timmons Roberts, Ph.D. Brown University Providence, Rhode Island

DEDICATION
To my Iya Catherine Louise Smith, my Baba Willie Frank Holloman, and my Egungun sitting on both sides
Howeverfar a stream flows, it neverforgets its origin. ,...., Ase' Ase' Ase' 0!
iii
TABLE OF CONTENTS
Page
DEDICATION .................................................................................. .iii
ACKNOWLEDGMENTS ..................................................................... vi
LIST OF TABLES ............................................................................ viii
LIST OF FIGURES ............................................................................. .ix
ABSTRACT .................................................................................... xi
INTRODUCTION ............................................................................... 2
CHAPTER 1 A Community-Based Assessment of Seafood Consumption along the Lower James River, Virginia, USA: Potential Sources of Dietary Mercury Exposure
Abstract. ................................................................................. .13
Introduction .............................................................................. 14
Material and Methods .................................................................. 1 7
Results .................................................................................... 22
Discussion ................................................................................ 25
Conclusion ............................................................................... 32
Acknowledgtnents ....................................................................... 33
Literature Cited .......................................................................... 34
iv
CHAPTER2 Expanding Perceptions of Subsistence Fish Consumption: Evidence of High Commercial Fish Consumption and Dietmy Mercury Exposure in an Urban Coastal Community
Abstract. .................................................................................. 44
Introduction .............................................................................. 45
Material and Methods .................................................................. 49
Results .................................................................................... 57
Discussion ............................................................................... 60
Conclusion ............................................................................... 69
Acknowledgments ....................................................................... 71
Literature Cited ......................................................................... 72
CHAPTER3 A Probabilistic Characterization of Dietary Mercury Exposure in an Urban Coastal Community
Abstract ................................................................................... 87
Introduction .............................................................................. 88
Material and Methods .................................................................. 91
Results .................................................................................... 96
Discussion ................................................................................ 98
Conclusion .............................................................................. 1 06
Acknowledgments ..................................................................... 107
Literature Cited ........................................................................ .1 08
CONCLUSION ................................................................................. 122
VITA ............................................................................................. l27
v

ACKNOWLEDGMENTS
Now at the end ofthis long and arduous journey, I pause to remember and acknowledge those who have supported me along the way. Mo juba Olodumare. Mo juba gbobo Orisa.
To my advisor Dr. Michael C. Newman, thank you for all of the guidance and support you have given me over the years. As you often stated, your job was not to be my friend but to ensure that I graduated with the tools and insight necessary to be the best scientist I desired and not an empty drum. I am grateful for this and the many other life lessons you taught me.
To my committee members, Dr. Isa W. Miles, Dr. Mary Fabrizio. Dr. Michael Unger, Dr. Jerome Nriagu, and Dr. Timmons Roberts, I thank you too for your guidance and support over the years. Most importantly, I thank you for your flexibility and patience with me as I dealt with the uncertainties of life.
To my W & M NIMS family, thank you for providing me with a home away from home. A special thank you to Dr. Lynelle Ragland, Dr. Monica Griffin, Dr. Chon Glover, Fonda Powell, Maxine Butler, Gina Burrell, Dorothy Robinson, Darlene Johnson, Denise Berry, Beverlyn Ferguson, Elizabeth Francis, Dr Linda Schaffner, Sue Presson, and Kevin Kiley.
To my Hampton University family, Dr. Benjamin Cuker and Dr. Deidre Gibson, I am forever grateful for all the financial and emotional support you have given throughout my academic career. Ben, you have been there with me since the beginning of my academic journey in Marine Science. I truly can't thank you enough for all that you have given me. Deidre, from my very first introduction to Dr. Newman to the gentle words of encouragement you have given me throughout the years, I am forever thankful.
To my Moton Community House family and the residents of the Southeast Community, my scientific endeavors herein would be in vain if it was not for love and support. I am, because you are. A special and heartfelt thank you to Linwood DeBrew and Angela Harris.
Last but not least to my family and friends, words cannot express my sincere and deepest gratitude my heart holds for you. I stand tall because I stand on the shoulders of those who came before me. I thank you for your struggles and your triumphs. To my Grandmother Maggie Smith, thank you for the unconditional love that only a mother can
vi
give. You are my source of strength and my beacon of light, love, and life. I love you always. To my Godmother Linda Gay, I am so grateful and blessed to have you in my life. I thank you for all that you have done and the unconditional love that you have given me throughout the years. To Gary Hill, thank you for taking this journey with me and helping me make this dream come true. What was only a beginning has now taken a life of its own as we prepare together for the arrival of a new dream come true. To Heidi Geisz, true friends are hard to come by and I am so thankful that you are my friend. I am forever grateful for the love and support you have given me and look forward to the years ahead. To RASheda Young, Jozan Powell-Wright, and Regina Easley, I thank you for sharing your light, your love, and your legacy of friendship with me. Together, we have weathered many storn1s and I am forever indebted for all that you have done me. A special thank you to the host of relatives and friends not personally mentioned herein. Know that I am grateful for all that you have done for it takes a village to raise a child and together you raised me and I say thank you. Ase' Ase' Ase' 0!
vii
CHAPTER 1
TABLE 1
TABLE2
CHAPTER2
TABLE 1
TABLE2
TABLE3
TABLE4
CHAPTER3
TABLE 1
TABLE 2
LIST OF TABLES
Page
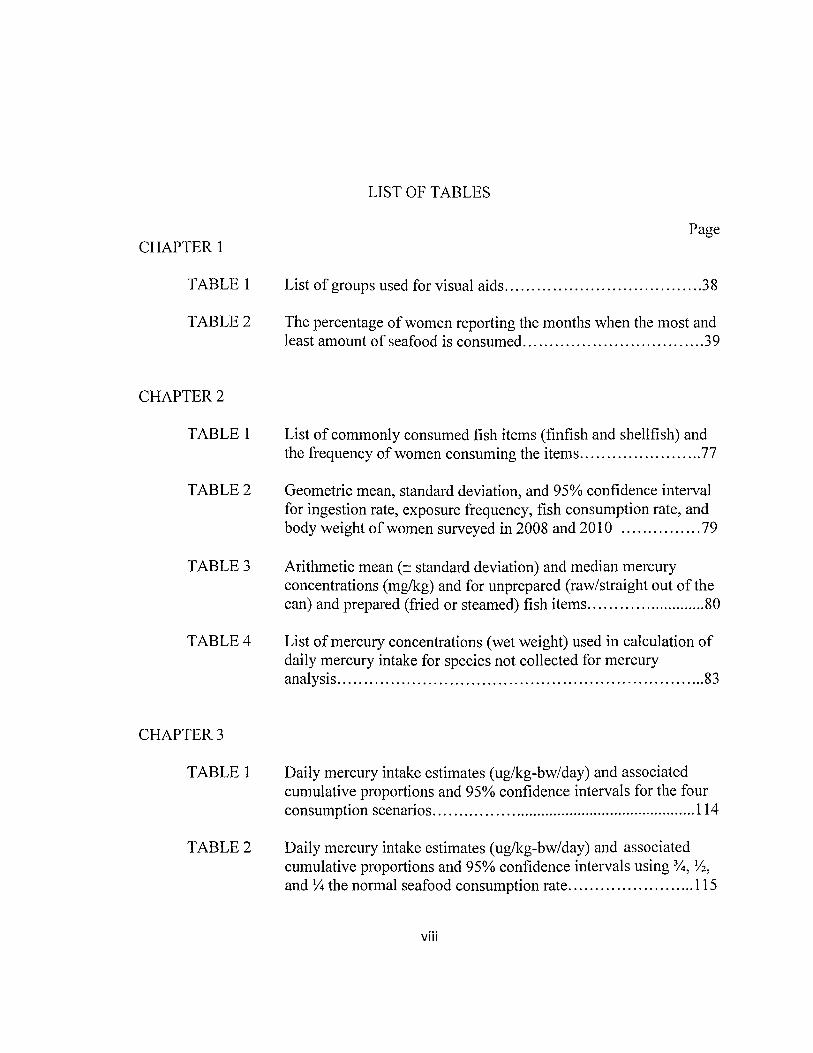
List of groups used for visual aids ..................................... 38
The percentage of women reporting the months when the most and least amount of seafood is consumed .................................. 39
List of commonly consumed fish items (finfish and shellfish) and the frequency of women consuming the items ....................... 77
Geometric mean, standard deviation, and 95% confidence interval for ingestion rate, exposure frequency, fish consumption rate, and body weight of women surveyed in 2008 and 201 0 ............... 79
Arithmetic mean (± standard deviation) and median mercury concentrations (mg/kg) and for unprepared (raw/straight out of the can) and prepared (fried or steamed) fish items ......................... 80
List of mercury concentrations (wet weight) used in calculation of daily mercury intake for species not collected for mercury analysis ..................................................................... 83
Daily mercury intake estimates (ug/kg-bw/day) and associated cumulative proportions and 95% confidence intervals for the four consumption scenarios ............................................................ 114
Daily mercury intake estimates (ug/kg-bw/day) and associated cumulative proportions and 95% confidence intervals using %, Yz, and Yt the normal seafood consumption rate ........................ 115
viii

LIST OF FIGURES
Page INTRODUCTION
FIGURE 1 General location ofthe Southeast Community of Newport News, VA .......................................................... 11
CHAPTER 1
FIGURE 1 Consumption frequency of the seafood items generally consumed .................................................................. 40
FIGURE2 The summed amount consumed (g/day) of seafood items generally consumed by the women surveyed ......................................... .41
FIGURE 3 Comparison of seafood consumption rates between current study and other investigations .................................................... .42
CHAPTER2
FIGURE 1 Comparison offish consumption patterns estimated using data collected in 2008 and 2010 .............................................. 84
FIGURE 2 Proportion of deterministic daily mercury intake rates (mg/kg-bw/day) using canned white tuna, light tuna, and no tuna ........... 85
CHAPTER3
FIGURE 1 Comparison of point and probabilistic distributions of daily 1nercury intake ........................................................... 118
FIGURE 2 Comparison of probabilistic distributions of daily mercury intake
for all four consumption scenarios ................................... 119
ix
FIGURE3
FIGURE4
CONCLUSION
FIGURE 1
Probabilistic distributions of daily mercury exposures for the four consumption scenarios ................................................. 120
Comparison of probabilistic distributions of daily mercury intake at 25% of the normal consumption rate for African American women in the Southeast Community ................................ 121
For consumption scenario both tuna, comparison of daily mercury exposure and mean daily mercury exposure ....................... .126
X
ABSTRACT
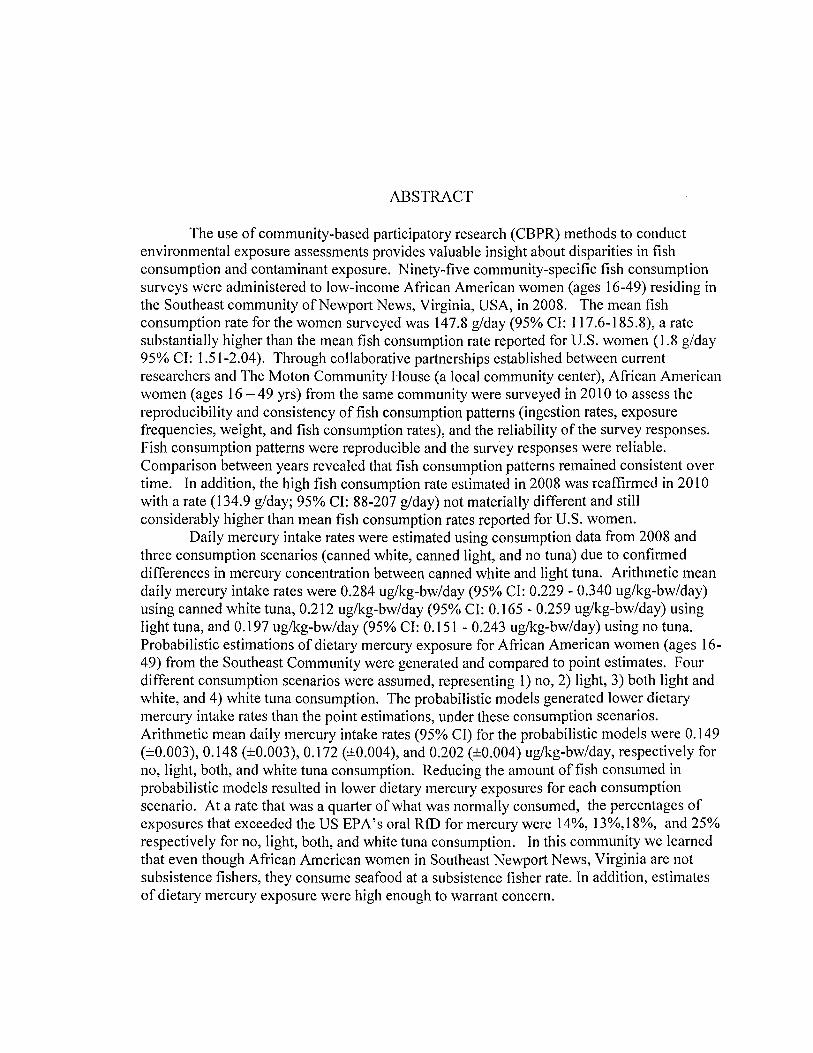
The use of community-based participatory research (CBPR) methods to conduct environmental exposure assessments provides valuable insight about disparities in fish consumption and contaminant exposure. Ninety-five community-specific fish consumption surveys were administered to low-income African American women (ages 16-49) residing in the Southeast community ofNewport News, Virginia, USA, in 2008. The mean fish consumption rate for the women surveyed was 147.8 g/day (95% CI: 117.6-185.8), a rate substantially higher than the mean fish consumption rate reported for U.S. women ( 1.8 g/day 95% CI: 1.51-2.04). Through collaborative partnerships established between current researchers and The Moton Community House (a local community center), African American women (ages 16 - 49 yrs) from the same community were surveyed in 201 0 to assess the reproducibility and consistency of fish consumption patterns (ingestion rates, exposure frequencies, weight, and fish consumption rates), and the reliability of the survey responses. Fish consumption patterns were reproducible and the survey responses were reliable. Comparison between years revealed that fish consumption patterns remained consistent over time. In addition, the high fish consumption rate estimated in 2008 was reaffirmed in 2010 with a rate (134.9 g/day; 95% CI: 88-207 g/day) not materially different and still considerably higher than mean fish consumption rates reported for U.S. women.
Daily mercury intake rates were estimated using consumption data from 2008 and three consumption scenarios (canned white, canned light, and no tuna) due to confirmed differences in mercury concentration between canned white and light tuna. Arithmetic mean daily mercury intake rates were 0.284 ug/kg-bw/day (95% CI: 0.229 - 0.340 ug/kg-bw/day) using canned white tuna, 0.212 ug/kg-bw/day (95% CI: 0.165 - 0.259 ug/kg-bw/day) using light tuna, and 0.197 ug/kg-bw/day (95% CI: 0.151 - 0.243 ug/kg-bw/day) using no tuna. Probabilistic estimations of dietary mercury exposure for African American women (ages 16-49) from the Southeast Community were generated and compared to point estimates. Four different consumption scenarios were assumed, representing 1) no, 2) light, 3) both light and white, and 4) white tuna consumption. The probabilistic models generated lower dietary mercury intake rates than the point estimations, under these consumption scenarios. Arithmetic mean daily mercury intake rates (95% CI) for the probabilistic models were 0.149 (±0.003), 0.148 (±0.003), 0.172 (±0.004), and 0.202 (±0.004) ug/kg-bw/day, respectively for no, light, both, and white tuna consumption. Reducing the amount offish consumed in probabilistic models resulted in lower dietary mercury exposures for each consumption scenario. At a rate that was a quarter of what was normally consumed, the percentages of exposures that exceeded the US EPA's oral RID for mercury were 14%, 13%,18%, and 25% respectively for no, light, both, and white tuna consumption. In this community we learned that even though African American women in Southeast Newport News, Virginia are not subsistence fishers, they consume seafood at a subsistence fisher rate. In addition, estimates of dietary mercury exposure were high enough to warrant concern.
A Community-Based Participatory Assessment ofFish Consumption and Dietary Mercury Exposure along the Lower James River, Virginia USA

2
INTRODUCTION
The field of environmental risk analysis was created out of the need to manage
and regulate ecological and human health risk by way of risk assessment, management,
and communication. US EPA (1992) defines risk as the probability of a specified
3
adverse effect occurring. Recently, researchers have called for a more holistic
understanding of scientific (risk assessment, management, and communication) and
social (i.e. cultural, economic, and political) perspectives as it relates to risk (Macgill and
Siu 2004, 2005). One answer to this call is the infusion of community-based
participatory research (CBPR) techniques in the process of environmental risk analysis.
Over the last two decades, the field of public health has established alternative
approaches to research that involves community members, organizational representatives,
and researchers in all aspects of research in the process known as CBPR (Israel et al.,
1998). Composed of three major overlapping components, CBPR involves participatory
research, education, and social action (Leung et al., 2004). Within this framework,
CBPR provides a mechanism for community members to actively participate as equal
partners with researchers in problem definition, inforn1ation collection, data analysis, and
dissemination of information pertaining to environmental hazards affecting their
community (Minkler, 2000).
The environmental justice movement consistently advocates that people of color
and the poor have greater participation in research and decision-making as it relates to
contaminant exposure because they often bear the burden of adverse effects (National
4
Environmental Justice Advisory Council (NEJAC), 2002). In 1994 President Clinton
issued Executive Order 12898, "Federal Action to Address Environmental Justice in
Minority Populations and Low-income Populations," which required Federal agencies to
make achieving environmental justice part of its mission. Even though CBPR is very
beneficial to environmental risk analysis (and communities bearing dispropmiional
environmental burdens), these methods are seldom used by many Federal and State
agencies. The assimilation of CBPR methods with environmental risk assessments might
provide Federal and State agencies with a more holistic understanding as to why
disparities in the consumption of contaminated finfish and shellfish (further referred to as
fish) exist. Such disparities have created issues of environmental injustice (NEJAC,
2002) and by law (EO 12898) should be adequately addressed by Federal agencies.
Consequently, as it relates to fish consumption and contaminant exposure, many Federal
programs, policies, and activities continue to fall short in fulfilling Executive Order
12898 (OIG 2004).
It is imperative that research used to create and implement envirmm1ental policy
effectively address and include people of color and the poor. Traditionally however, such
research is designed within a framework that addresses the general US population and
makes assumptions (valid or not) about US subpopulations (e.g. subsistence fishers,
ethnic minorities, or recreational anglers). This is especially true as it relates to the
development of fish advisories and consumption limit strategies. Exposure data used to
set aquatic environmental standards often rely on parameter values that mirror the
characteristics and practices ofthe general US population (NJEAC, 2002). Typically,

5
such values do not reflect the characteristics and practices of minority and low-income
populations (NJEAC, 2002). In addition, the estimation offish consumption and
contaminant exposure in US subpopulations is greatly influenced by an assessor's
perception and the selection of parameter values used to estimate exposure. Thus for
Federal and State assessors, narrowly held perceptions of certain US subpopulations and
the selection of parameter values could result in environmental policies and standards that
do not effectively protect all US populations.
In 2004, the US EPA and Food and Drug Administration (US FDA) jointly
developed fish consumption advice for one specific contaminant, mercury (US
EPA/FDA, 2004). This joint effort reflected an understanding that human exposure to
mercury contaminated fish involves the consumption of both commercial and
noncommercial items. Mercury poses a human-health risk because of the adverse
neurodevelopmental effects that have been linked with exposure. Methylmercury
(MeHg), the predominant form of mercury associated with fish, is known for its
neurotoxicity and developmental toxicity (National Research Council (NRC), 2000;
Castoldi et al., 2008). In addition, some studies have linked methylmercury exposure
from fish consumption to cardiovascular toxicity (Salonen et al., 1995; Guallar et al.,
2002; Virtanen et al., 2005; Roman et al., 2011) while others have found no associations
(Ahlqwist et al., 1999; Hallgren et al., 2001; Y oshizawa et a!., 2002; Mozaffarian 2009;
Mozaffarian et al., 2011). Studies have found mercury concentrations in the blood and
hair of one US subpopulation (African Americans) to be higher than other populations
(Schober et al., 2003; CDC, 2001 and 2005; Mahaffey et al., 2009). However, peer-
6
reviewed publications focused exclusively on African American fish consumption
patterns and contaminant exposures are scarce (Weintraub and Birnbaum, 2008) and
cultural and lifestyle factors influencing such exposures are rarely defined (Beehler et al.,
2001; Cecelski, 2001; Weintraub and Birnbaum, 2008). Thus, assessments addressing
fish consumption and potential dietary mercury exposure and risks are warranted.
The overarching goal of this dissertation was the application of community-based
participatory research (CBPR) techniques with traditional exposure assessment methods
to generate scientifically sound and socially relevant exposure inforn1ation for a US
subpopulation. Tlu·ough collaborative partnerships established between current
researchers and a local community center (The Moton Community House), the CBPR
approach was used to explore fish consumption and dietary mercury exposure for African
American women of childbearing age (ages 16 - 49 yrs) residing along the southern
portion of the James River in the Southeast Community of Newport News, Virginia, USA
( Figure 1 ). The three primary research chapters presented herein were written in formats
specific for journal publication. Chapter one, summarizes the results of the community
specific fish consumption survey that was administered during April- May 2008 to
African American women (ages 16-49) residing in the Southeast community ofNewport
News, Virginia. Of particular interest was determination of ingestion rates (IR, g/meal)
and exposure frequencies (EF, meals/year and meals/day) in order to estimate seafood
consumption rates (CR, g/day), as well as the major sources (grocery/seafood market,
self-caught, restaurant) of the seafood items consumed. Chapter two presents the results
of five main objectives. Specific objectives were to: 1) assess the reproducibility of the
7
East End Fish Consumption Survey, 2) quantify the reliability of the responses used to
estimate fish consumption rates, 3) assess the consistency of fish consumption pattems in
the community, 4) determine mercury concentrations in commonly consumed fish items,
and 5) generate detenninistic (point) estimates of daily mercury intake. The third and
final chapter characterizes dietary mercury exposure by probabilistically modeling
mercury intake for African American women (ages 16 - 49 yrs) residing in the Southeast
Community of Newport News, Virginia. In addition, consumption scenarios aimed at
reducing dietary mercury exposure are also explored.

LITERATURE CITED
Ahlqwist, M., Bengtsson, C., Lapidus, L., Gergdahl, I.A., Schutz, A., 1999. Serum mercury concentration in relation to survival, symptoms, and diseases: results from the prospective population study of women in Gothenburg, Sweden. Acta. Odontol. Scand. 57,168-174.
Beehler, G., McGuinness, B.M., Vena, J.E., 2001. Polluted fish, sources of knowledge, and the perception of risk: Contextualizing African American anglers' sport fishing practices. Human Organ. 60, 288-297.
Castoldi, A.F., Johansson, C., Onishchenko, N., Coccini, T., Roda, E., Vahter, M., Ceccatelli, S., Manzo, L., 2008. Human developmental neurotoxicity of methylmercury: impact of variables and risk modifiers. Regul. Toxicol. Pharmacol. 51, 201-214.
Cecelski, D.S., 2001. The Waterman's song: Slavery and freedom in maritime North Carolina. University ofNorth Carolina Press, Chapel Hill, NC.
Centers for Disease Control and Prevention (CDC), 2001. Blood and hair mercury levels in young children and women of childbearing age -United States, 1999. Morb. Mortal. Wkly. Rep. 50, 140-143.
8
Centers for Disease Control and Prevention (CDC), 2005. Third national report on human exposure to environmental chemicals. Atlanta, GA.
Guallar, E., Sanz-Gallardo, M.l., van't Veer, P., Bode, P., Aro. A., Gomez-Aracena, J., Kark, J.D., Riemersma, R.A., Martin-Moreno, J.M., Kok, F.J., 2002. Mercury, fish oils, and the risk of myocardial infarction, in New Engl. J. Med. 347 (22), 1747-54.
Hallgren, C.G., Hallmans, G., Jansson, J.H., Marklund, S.L., Huhtasaari, F., Schu""tz, A., Stro""mberg, U., Vessby, B., Skerfving, S., 2001. Markers ofhigh fish intake are associated with decreased risk of a first myocardial infarction. Br. J. Nutr. 86, 397--404.
Israel, B.A., Schulz, A.J ., Parker, E.A., Becker, A.B., 1998. Review of community-based research: Assessing partnership approaches to improve public health. Annu. Rev. Public Health. 19, 173-202.
Leung, M.W., Yen, I.H., Minkler, M., 2004. Community-based participatory research: a promising approach for increasing epidemiology's relevance in the 21st century. Int. J. Epidemiol. 33, 499-506.

Macgill, S.M. and Siu, Y.L., 2005. A new paradigm for risk analysis. Futures. 37, 1105-1131
Mahaffey, K.R., Clicker R.P., Jeffries, R.A., 2009. Adult women's blood mercury concentrations vary regionally in the United States: Associations with patterns of fish consumption (NHANES 1999- 2004). Environ. Health Perspect. 117(1), 47 -53.
Minkler, M., 2000. Participatory action research and healthy communities. Public Health Rep. 115, 191-97.
9
Mozaffarian, D., 2009. Fish, Mercury, Selenium and Cardiovascular Risk: Current Evidence and Unanswered Questions. Int. J. Environ. Res. Public Health. 6, 1894-1916.
Mozaffarian, D., Shi, P., Morris, J.S., et al., 2011. Mercury exposure and risk of cardiovascular disease in two U.S. cohorts. N. Engl. J. Med. 364, 1116-25.
National Environmental Justice Advisory Council (NEJAC), 2002. Fish Consumption and Environmental Justice.
National Research Council (NRC), 2000. Toxicological Effects of Methylmercury. National Academy Press, Washington, DC.
Office ofinspector General (OIG). 2004. EPA Needs to Consistently Implement the Intent of the Executive Order on Environmental Justice. 2004-P-00007, Washington, DC
Roman, H.A., Walsh, T.L., Coull, B.A., et al., 2011. Evaluation ofthe cardiovascular effects of methylmercury exposures: current evidence supports development of a dose-response function for regulatory benefits analysis. Environ. Health Perspect. 119,607-614.
Salonen, J.T., Seppanen, K., Nyyssonen, K., Korpela, H., Kauhanen, J., Kantola, M., Tuomilehto, J., Esterbauer, H., Tatzber, F., Salonen, R., 1995. Intake ofmercury from fish, lipid peroxidation, and the risk of myocardial infarction and coronary, cardiovascular, and any death in Eastern Filmish men. Circulation. 91(3), 645-655.
Schober, S.E., Sinks, T.H., Jones, R.L., Bolger, P.M., McDowell, M., Osterloh, J., et al., 2003. Blood mercury levels in U.S. children and women of childbearing age, 1999-2000. JAMA. 289, 1667-1674.

10
United States Environmental Protection Agency (US EPA). 1992. Reducing Risk for All Communities. Vol. I. Office ofPolicy, Planning, and Evaluation, EPA 230-R-92-008, Washington, DC.
United States Environmental Protection Agency/ Food and Drug Administration (US EPA/FDA), 2004. What You Need to Know About Mercwy in Fish and Shellfish. EPA-823-R-04-005. Available from URL: http://www.epa.gov/waterscience/fishadvice/advice/html or http://www.cfsan.fda.gov/~dms/admeh£!3.html [Accessed: 2/18/2011].
Virtanen, J.K., Voutilainen, S., Rissanen, T.H., et al., 2005. Mercury, fish oils, and risk of acute coronary events and cardiovascular disease, coronary heart disease, and allcause mortality in men in eastern Finland. Arterioscler. Thromb. Vase. Bioi. 25, 228-33.
Yoshizawa, K., Rimm, E.B., Morris, J.S., Spate, V.L., Chung-cheng, H., Spiegelman, D., Stampfer, M.J., Willett, M.D., 2002. Mercury and the risk of coronary heart disease in men. N. Engl. J. Med. 347, 1755-1760
Weintraub, M., Birnbaum, L.S., 2008. Catfish consumption as a contributor to elevated PCB levels in a non-Hispanic black subpopulation. Environ. Res. 107, 412-417.
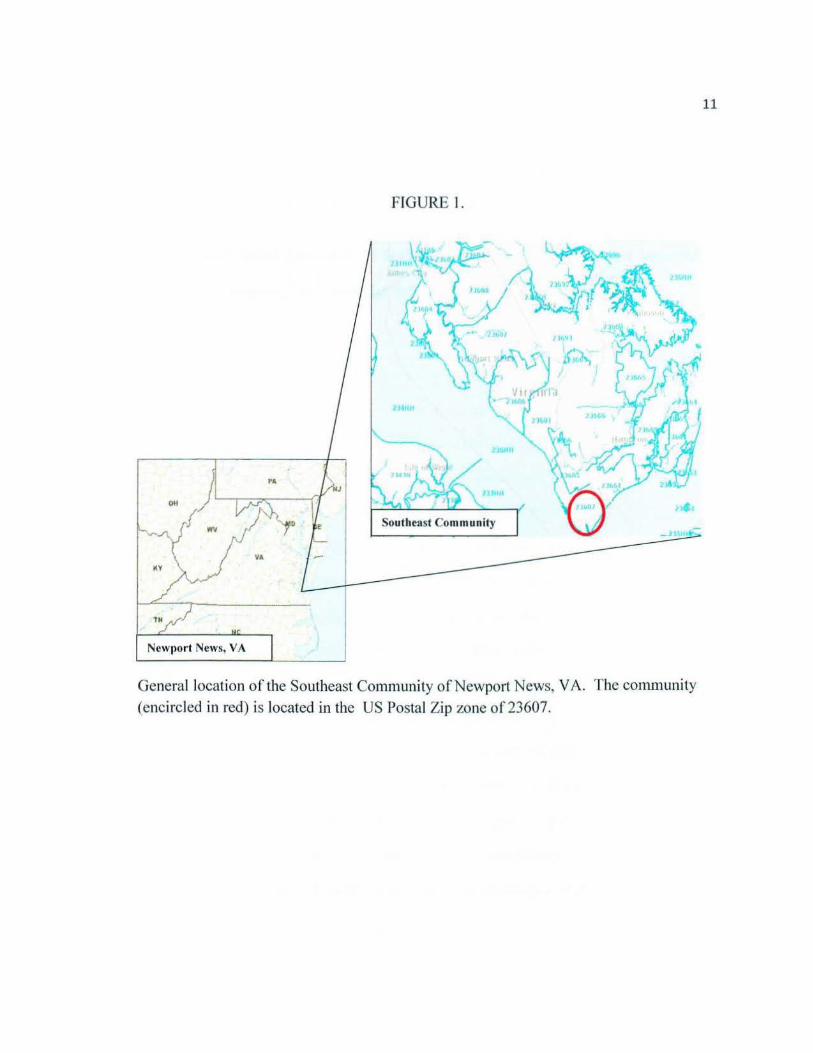
FIGURE I.
011
Southeast Community
General location of the Southeast Community of Newport News, VA. The community
(encircled in red) is located in the US Postal Zip zone of23607.
11
12
CHAPTER 1
A Community-Based Assessment of Seafood Consumption along the Lower James River,
Virginia, USA: Potential Sources of Dietary Mercury Exposure
13
ABSTRACT
The use of community-based participatory research (CBPR) methods to conduct environmental
exposure assessments provides valuable insight about disparities in seafood consumption and
contaminant exposure. Ninety-five community-specific seafood consumption surveys were
administered to low-income African American women (ages 16-49) residing in the Southeast
community ofNewport News, Virginia, USA, for the purpose of assessing potential dietary
mercury exposure. Only the results of the seafood consumption surveys are presented in this
manuscript. Approximately 65% ofthe women surveyed do not fish; however, 83% had
consumed seafood within the last seven days. Whiting, shrimp, and canned tuna were the three
items most frequently consumed. Ninety-three percent of the women surveyed stated that
grocery/seafood markets were the main sources of the seafood items generally consumed. The
mean seafood consumption rate for the women surveyed was 147.8 g/day (95% CI: 117.6-185.8),
a rate substantially higher than the mean seafood consumption rate reported for U.S. women (1.8
g/day 95% CI: 1.51-2.04). Shrimp, croaker, and blue crab were the top three seafood items with
the highest summed amount (g/day) consumed. There was no significant association between
demographic variables (age, income, education, and weight) and total number of seafood items
listed, ingestion rate (g/meal), exposure frequency (meals/year), and seafood consumption rate
(g/day). By using CBPR to assess seafood consumption in this community we learned that even
though women in Southeast Newport News, Virginia are not subsistence fishers, they consume
seafood at a subsistence fisher rate. Of the three seafood items most frequently consumed,
canned tuna potentially plays a significant role in dietary mercury exposure for women in this
community. Future work includes detennining mercury concentrations in seafood items
consumed and generating community-specific statements of dietary mercury risks.
14
1. INTRODUCTION
The environmental justice movement consistently advocates that people of color
and the poor have greater participation in research and decision-making as it relates to
contaminant exposure because they often bear the burden of adverse effects (National
Environmental Justice Advisory Council (NEJAC), 2002). However, exposure
information used to set environmental health standards is often not reflective of many
minority and low-income communities (NEJAC, 2002). The integration of community
based participatory research (CBPR) techniques with conventional exposure assessment
methods provides the poor and people of color opportunities to equitably participate in
environmental research and decision-making that generates exposure information more
reflective of their communities. Fundamental principles of CBPR: 1) recognizes
community as an unit of identity, 2) builds on strengths and resources within the
community, 3) facilitates collaborative, equitable involvement of all partners in all phases
of the research, 4) integrates knowledge and intervention for mutual benefit of all
partners, 5) promotes a co-learning and empowering process that attends to social
inequalities, 6) involves a cyclical and iterative process, 7) addresses health from both
positive and ecological perspectives, 8) disseminates findings and knowledge gained to
all partners, and 9) involves a long-term commitment by all partners (Israel, 2000). It is
understood that the degree to which any research effort achieves one or any combination
of these principles is dependent upon the context, purpose and participants involved
(Israel, 2000).

15
At the heart of successful models of CBPR, a clear distinction is made between
conducting research "in" a community where community members have limited, if any,
involvement and is mainly researcher-driven (Israel, 2000) versus participatory research
where community members, organizational representatives, and researchers operate as
equal partners in all phases of the research process (Israel et al., 1998; Minkler, 2000;
O'Fallen and Dearry, 2002; Leung et al., 2004; Minkler et al., 2006; Terrell et al., 2008;
Nelson et al., 2009). Therefore, attempts of integrating CBPR with traditional exposure
assessments should strive for equability between researchers and communities in the
problem definition, information collection, data analysis, and dissemination of
contaminant exposure information. The use of CBPR methods to investigate seafood
consumption and risk of contaminant exposure has generated scientifically sound,
socially relevant and community-specific exposure information that provides greater
insight about exposure disparities. For example, in the Greenpoint/Williamsburg
neighborhood of Brooklyn New York, CBPR methods used to investigate cumulative
exposures and subsistence fishing revealed a potentially serious cancer risk that would
have likely been ignored by the U.S. Environmental Protection Agency (U.S. EPA) if it
was not for the community specific data (Corburn, 2002).
Disparities in seafood consumption and contaminant exposure may exist because
ofthe consumption of more seafood annually and more seafood meals oflarger servings
(Burger et al., 1999 and 2001; Sechena et al., 1999; NEJAC, 2002; Corburn, 2002;
Gibson and McClafferty, 2005). Such disparities may also be greatly influenced by
cultural and lifestyle factors that ultimately determine which seafood items are consumed

16
and how it is prepared (Judd et al., 2004; NEJAC, 2002). Minority targeted seafood
consumption assessments generally focus on Asians, Pacific Islanders, or Native
Americans (e.g. Toy et al., 1996; Sechena et al., 1999 and 2003; Duncan, 2000; Judd et
al., 2004). African Americans also experience higher exposures to contaminated seafood
than the average U.S. consumer (Burger et al., 1999 and 2001, Center for Disease Control
(CDC), 2001 and 2005; Schober et al., 2003; Gibson and McClafferty, 2005). However,
peer-reviewed publications focused exclusively on African American seafood
consumption patterns and contaminant exposures are scarce (Weintraub and Birnbaum,
2008) and cultural and lifestyle factors influencing such exposures are rarely defined
(Beehler et al., 2001; Cecelski, 2001; Weintraub and Birnbaum, 2008).
The consumption of seafood is the most common exposure pathway for mercury
(National Research Council (NRC), 2000; Mahaffey et al., 2008). The amounts and
types of seafood consumed vary among geographical locations of the United States
(NRC, 2000; Mahaffey et al., 2009). Hence, variations in mercury exposure are most
likely due to individual seafood consumption patterns (NRC, 2000). Studies have found
mercury concentrations in the blood and hair of African Americans to be higher than
other populations (Schober et al., 2003; CDC, 2001 and 2005; Mahaffey et al., 2009).
Considering that investigations focused exclusively on African American seafood
consumption patterns and contaminant exposure are not well established in peer-reviewed
literature, assessments addressing seafood consumption and potential dietary mercury
exposure and risks are warranted.
17
This work applied CBPR techniques with traditional exposure assessment
methods to generate scientifically sound and socially relevant seafood consumption and
dietary mercury exposure information for low-income, African American women (ages
16-49 yrs) residing along the southern portion of the James River in Virginia, USA.
Findings are summarized of only the community-specific seafood consumption survey
administered during April- May 2008 to 95 African American women (ages 16-49)
residing in the Southeast community ofNewport News, Virginia. Of particular interest
was determination of ingestion rates (IR, g/meal) and exposure frequencies (EF,
meals/year and meals/day) in order to estimate seafood consumption rates (CR, g/day), as
well as the major sources (grocery/seafood market, self-caught, restaurant) of the seafood
items consumed. This information, coupled with mercury concentrations, will be used to
probabilistically define daily mercury intake (mg/kg bw-day) and generate risk
statements for low-income African American women residing in Southeast Newport
News, Virginia.
2. MATERIALS AND METHODS
2.1. Community Partnerships:
Located along the southern portion of the James River, Newport News has
180,150 residents ofwhom 54% are White and 39% African American (US Census,
2000). African Americans make up approximately 87% of the population residing in the
Southeast community of Newport News (US Census, 2000). Partnerships were created
with the Moton Community House and Heal-Thy Generations: A Southeast Health

Movement, a local community center and health coalition known for its dedication to
improving the health and quality of life for residents in the Southeast community.
Through these partnerships, 10 African-American women, representative of the
population of interest (low-income African American women ofthe Southeast
community), were recruited to participate on a Community Advisory Council (CAC).
The women of CAC were recruited by personal announcement and recommendations
from the executive director of the Moton Community House and members of Heal-Thy
Generations. The council was established to provide the necessary community-specific
guidance for only this research endeavor. Members met periodically and were
compensated for their time. Fom1al meeting procedures included agendas and an
attendance policy in which women were only compensated for meetings they attended.
2. 2. Survey Design and Implementation:
The initial draft of the Southeast Seafood Consumption Survey was based on
18
modifications to fish consumption surveys used in the Asian and Pacific Islander Seafood
Consumption Study in King County, W A (Sechena et. al., 1999) and the Elizabeth and
Lower James River Angler Survey (Gibson and McClafferty, 2005). This draft was
submitted to CAC and refined, finalized, and submitted to the Protection of Human
Subjects Committee (PHSC) at the College of William and Mary. The final version of
the Southeast Seafood Consumption Survey complied with appropriate ethical standards,
and was exempted from a formal PHSC review.
Ninety-five surveys were administered among ten different sites located
throughout the Southeast community during April and May 2008. Sites were randomly

19
selected from a list of locations suggested by CAC and sampled during the five-day work
week between 10:00 AM to 5:00PM. Participants were conveniently sampled and
compensated for completing the survey. To prevent women from taking multiple
surveys, the same individual administered the seafood consumption survey. In addition,
upon completion of the survey, women were given coupons that were numbered and
stamped with a raised seal that had to be redeemed in order to receive their compensation.
This also assisted in preventing women from taking multiple surveys and duplicating
coupons issued.
The survey was structured to gain insight about the IR (g/meal), EF (meals/day or
meals/year), CR (g/day), and sources of the seafood items consumed for African
American women (ages 16- 49) residing in the Southeast community. Traditionally, the
amount of seafood consumed (IR) is determined by asking one to select approximately
how much (generally between 1.5 -16 oz) of a particular item is consumed. The CAC
advised that the use of these amounts without some visual aid would be confusing;
therefore, visual aids were used.
2. 3. Visual Aids:
The main concepts for the visual aids were derived from the Asian and Pacific
Islander Seafood Consumption Study in King County, WA (Sechena et al., 1999). The
CAC provided a list of seafood items thought to be commonly consumed by women in
the Southeast community. This list was divided into 13 groups based on advice that the
groups must represent a similar body shape of the seafood item in question but, did not
have to be the exact item to evoke recognition of portion sizes (Table 1; Sechena et al.,
1999). The CAC also advised that the visuals be presented as cooked items; therefore,
real items were used and prepared based on cooking methods suggested by CAC. Once
prepared, items were individually vacuum sealed, labeled, and refrigerated until used.
Weights (g) associated with uncanned seafood items (e.g. fresh fish) were based on the
cooked weights ofthe items. Weights (g) associated with canned seafood items (e.g.
canned tuna) were based on the weight given on the can label. All seafood items used
represented individual portion sizes.
2.4. Determination of IR, EF, and CR:
20
Participants were asked to list up to 11 seafood items they consume and select the
portion size generally consumed for each item listed. Participants were then asked how
many of the individual portion size selected would be consumed during one meal setting.
The amount consumed (IR, g/meal) was determined by the number of individual portions
consumed during one meal setting multiplied by the weight of the portion size selected.
TheIR used in analysis was determined by multiplying theIR obtained by percent yield
(14, 20, 28, and 25% respectively) of edible meat for blue crab ( Callinectes sapidus),
lobster (Homarus americanus), snow crab leg (Chinoecetes opilio or C. bairdi), and
dungeness crab (Cancer magister) because weights used for portion sizes were based on
whole items.
To determine EF, the women were given the option to answer how many times
per week or per month they consumed each particular seafood item they listed.
Depending upon how the women answered, time per week was multiplied by 52
(weeks/year) and time per month by 12 (months/year) to determine meals/year (EFy). The

EFy was then divided by 365 to obtain the number of meals consumed daily (EFd,
meals/day). The EFd was used in the calculation of seafood consumption rates (g/day).
21
For each participant, ifiR or EFy was not determined for a particular item listed, it
was considered to be censored. Out the 784 seafood items listed, only 41 were censored
for IR and only eight censored for EFy. Values for all censored data were obtained by one
of two methods thought to assist in reducing uncertainty in the value selected. First, if
the summed frequency (total number of women) for the particular item was three or
greater, a value for the censored datum was randomly selected based on probability data
collected for IR or EFy for that particular item in question. For the second method, when
little or no information was available (less than or equal to three women total), the value
for the censored datum was randomly selected using Crystal Ball 11.1.1.1.00 (Oracle,
Redwood Shores, CA) in which a uniform distribution was assumed for IR or EFy.
Information used to generate the uniform distribution was based on data collected and
data reported in the peer-reviewed literature that was most reflective of the women in this
community. Once values were obtained for all censored data, IR and EFy (converted to
EFd) were used to calculate seafood consumption rates (CR).
TheIR (g/meal) was multiplied by EFd (meal/day) to determine seafood
consumption rates (CR, g/day). This was done for each seafood item listed by a
participant. The CR was then summed for each participant to get a total seafood
consumption rate. The mean seafood consumption rate was calculated using the summed
CR for each of the 95 women.

22
2. 5. Statistical Analysis:
The SAS version 9.1 software (SAS Institute Inc, Cary, NC) was used for all
statistical analysis. The mean seafood consumption rate was presented in terms of a
geometric mean because the results of seafood consumption rates for the 95 women were
not normally distributed. A nonparametric Kendall T procedure was used to assess
correlations between demographic variables (age, income, education, and weight) and
total number of seafood items listed, summed ingestion rate (g/meal), summed exposure
frequency (meals/year), and summed seafood consumption rate (g/day).
3. RESULTS
3.1. Study population:
The response rate for agreeing to take the survey was approximately 70% (1 04
out of a total of 149 women). Six surveys were terminated because of age (younger than
16 years older than 49 years), lack of parental permission, or interviewee resided outside
of the area of interest. Three surveys were not included in the final analysis because it
was later discovered that they did not live in the area of interest. Of the 95 women
surveyed, approximately 13% (95% CI: 6-19%) had not completed high school nor
received a General Equivalency Diploma (OED), 76% (95% CI: 67 -85%) completed
high school, OED or vocational training, 9% (95% CI: 3-15%) completed college (2 or 4
year program), and 2% (95% CI: 0-5%) completed a graduate program. Approximately
77% (95% CI: 68-85%) ofthe women had household incomes of$0- $20,000, 16%

23
(95% CI: 8-23%) had household incomes of$20,001- $35,000, and 7% (95% CI: 2-13%)
had household incomes of$35,001- $45,000+.
3.2. Seafood Consumption Patterns:
Sixty-five percent (95% CI: 56 -75%) of the participants (95 women) reported
that they do not fish; however, 83% (95% CI: 75-91 %) had consumed seafood within
seven days prior to being interviewed. The most common seafood items consumed
within seven days prior to being interviewed were shrimp (Penaeus,:,pp, 24% of 168
items listed); whiting (Merlangius, :,pp, 20%); canned tuna (Thunnus alalunga or
Katsuwonus pelamis 8%); blue crab (Callinectes sapidus, 7%), and croaker
(Micropogonias undulates, 7%). Eighty-five percent of the women reported consuming
the most amount of seafood during the spring, summer, and fall months (Table 2);
whereas, 4 7% reported consuming the least amount of seafood during the fall, winter,
spring months and the winter, spring, and summer months (Table 2).
The most commonly consumed seafood items were whiting, shrimp, tuna, snow
crab legs (Chinoecetes opilio or C. bairdi), blue crab and croaker (Figure 1). Ofthe784
consumed seafood items, approximately 93% (95% CI: 91-95%) came from
grocery/seafood markets, 4% (95% CI: 2-5%) were self-caught, 3% (95% CI: 2-4%) were
from restaurants, and 1% (95% CI: 0-1%) did not report the source. The women reported
that they fillet their fish most of the time (42% of95 women, 95% CI: 32-52%),
sometime (37%, 95% CI: 27- 48%) and never (21 %, 95% CI: 13- 29%).

24
Eighty-seven percent (of95 women, 95% CI: 81- 94%) reported they pan/deep
fry their seafood most of the time, 11% (95% CI: 4- 17%) reported sometime, and 2%
(95% CI: 0- 5%) reported never. Over half of the women (52% of95 women, 95% CI:
41 - 62%) never reuse the oil/fat from cooking although, 36% (95% CI: 26 - 46%)
reported that they do reuse the oil/fat most of the time and 13% (95% CI: 6- 19%)
reported sometime.
3.3. Seafood Consumption Rate:
For each seafood item listed by the women, the amount consumed (g/day) was
summed to estimate the total amount of seafood ingested daily (Figure 2). The items
with the largest total amount consumed(> 1000 g/day) were shrimp, croaker, blue crab,
whiting, snow crab legs, tuna (canned), spot, and mackerel (Scomberomorus Cavalla)
cakes (Figure 2). The unadjusted consumption rates (distribution was not normal) range
from 1.52 g/day to 1327 g/day. The geometric mean seafood consumption rate was
147.8 g/day (5.2 oz/day) with 95% confidence intervals of 117.6 -185.8 g/day (4.1- 6.6
oz/day). There was no significant (a= 0.05) association between demographic variables
(age, income, education, and weight) and total number of seafood items listed (Tau b
25
coefficient= 0.01, 0.00, 0.16, 0.06 respectively; p = 0.86, 0.98, 0.06, and 0.40
respectively), summed ingestion rate (r b coefficient= -0.02, 0.03, 0.13, 0.06
respectively; p = 0.73, 0.67, 0.09, and 0.39 respectively), summed exposure frequency (r
b coefficient= -0.02, -0.02, 0.06, 0.01 respectively; p = 0.73, 0.78, 0.45, and 0.85
respectively), and summed seafood consumption rate (r b coefficient= -0.05, 0.05, 0.09,
0.04 respectively; p = 0.47, 0.50, 0.22, and 0.59 respectively).
4. DISCUSSION
The use of CBPR (community-based participatory research) techniques to
conduct exposure assessments offers Federal and State agencies, as well as communities,
a unique approach in generating scientifically sound, socially relevant, and community
specific exposure information. Parameter uncertainty, the most readily recognized source
of uncertainty quantified in risk assessments, is caused by lack of specific knowledge and
can be reduced by collecting more and higher quality data (U.S. EPA, 2001). As it
relates to fish consumption, many agencies have applied exposure characteristics,
susceptibilities, and co-risk factors of the general population (NJEAC, 2002). Such
application can have significant implications for those whose exposure characteristics are
markedly different then the general population. For example, Silver et al. (2007)
suggested that the consumption of contaminated fish can have disproportionate impacts
on low-income, non-white groups in California's Sacramento-San Joaquin Delta due to
higher fish consumption and lower advisory awareness. By using CBPR techniques,

exposure assessments are enhanced with community-specific knowledge that increases
the quality of data collected and reduces parameter uncertainty in risk estimates.
26
This study employed CBPR methods to assess seafood consumption for women
of child bearing age (16-49) in a coastal, low-income, African American community. To
our knowledge, this is the first study that quantified seafood (fish and shellfish)
consumption exclusively in a low-income community of African American women (age
16-49). It should be noted, that because of the relatively small, convenient sample
design, it is difficult to generalize our results to women outside of this community. In
addition, we did not account for variation and difficulty of dietary recalls in this
community. A verification study is underway to address these issues and quantify the
uncertainty of responses obtained from the survey.
Seafood consumption in our study was similar to what has been reported for low
income women (Bienenfeld et al., 2003; Silver et al., 2007). In this study, the percentage
of women consuming whiting (83%), shrimp (81 %) and canned tuna (79%) was
comparable to Silver et al. (2007) for shrimp (86%) and canned tuna (79%), and higher
than Bienenfeld et al. (2003) for whiting (45%) and tuna (fresh and canned, 38%). The
high consumption of commercial seafood coincided with what was reported by Silver et
al. (2007).
Burger et al. (1999) suggested that fish consumption studies take into account
individual differences in the rate of fish consumption and quantity of fish consumed per
meal in order to avoid a downward bias in consumption rate. It was also suggested that
27
by only examining averages (number of meals per week and serving size), the
understanding of consumption patterns of those potentially most at risk is incomplete
(Burger et al., 1999). If individual differences in fish consumption rates and amounts
consumed are not accounted for and averages are used, there is a greater potential for
valuable information to be lost through data aggregation. This study collected
information on exposure frequencies (how often, EF) and ingestion rates (how much, IR)
of individual seafood items reported by each participant and then calculated a
consumption rate (CR) for each seafood item listed. For each participant, the
consumption rate for individual seafood items was then summed to yield a total seafood
consumption rate. By collecting and analyzing consumption information in this manner,
consumption rates are more accurate and representative of the individual and hence the
distribution in the population. It should be noted however, that our model for
determining EF and IR assumes regular and consistent seafood consumption. Such an
assumption possibly overestimated our consumption rates.
The geometric mean seafood consumption rate (147.8 g/day) determined in this
study is the highest mean seafood consumption rate that has been reported for African
American women: 47.7 g/day (Burger et al., 2001), 2.4 g/day (Mahaffey et al., 2004), and
41.2 g/day (Silver et al., 2007). The higher consumption rate is most likely due to how
consumption rates were calculated. Accounting for individual differences in exposure
frequencies and ingestion rates, and not using averages, could have resulted in the higher
estimate. Additionally, the way in which ingestion rates (g/meal) were calculated could
have resulted in the higher estimate.
28
To estimate ingestion rates, many studies first define portion sizes then, have
participants select the size generally consumed (Burger et al., 1999; Gibson and
McClafferty, 2005; Harris et al., 2008, Silver et al., 2007). The same was done in this
study but, a necessary adjustment was made based on recommendations from CAC.
Members of CAC stated the total amount ingested for a particular item was not only the
portion size, but also how many individual portions were consumed during one meal
setting. Therefore, a more accurate reflection of ingestion was the portion size selected
multiplied by the number of individual portions consumed during one meal setting. Not
making this adjustment would result in underestimation of ingestion rates for this
community. Such an adjustment should be considered when determining ingestion rates
and is potentially one of the reasons why the consumption rate in this study was higher
than rates reported in the literature for African American women (Burger et al., 2001;
Mahaffey et al., 2004; Silver et al., 2007).
In comparison to seafood consumption rates reported by Mahaffey et al. (2004)
for the general U.S. women (age 16-49) and African American women (age 16-49 yrs)
populations, the consumption rate in this study was approximately 82 and 62 times
higher, respectively (Figure 3). If either of the consumption rates reported by Mahaffey et
al. (2004) were used to determine health risks associated with seafood consumption for
women in this study, the risk would be grossly underestimated. The same would be true if
EPA's default value for the general population (17.5 g/day; U.S. EPA, 2000) or
recreational fishers (17.5 g/day; U.S. EPA, 2000) was used (Figure 3). The mean seafood
consumption rate for this study (147.8 g/day) most closely resembles EPA's default value
for subsistence fishers (142.4 g/day; U.S. EPA, 2000) and that of other minority
populations (Figure 3).
29
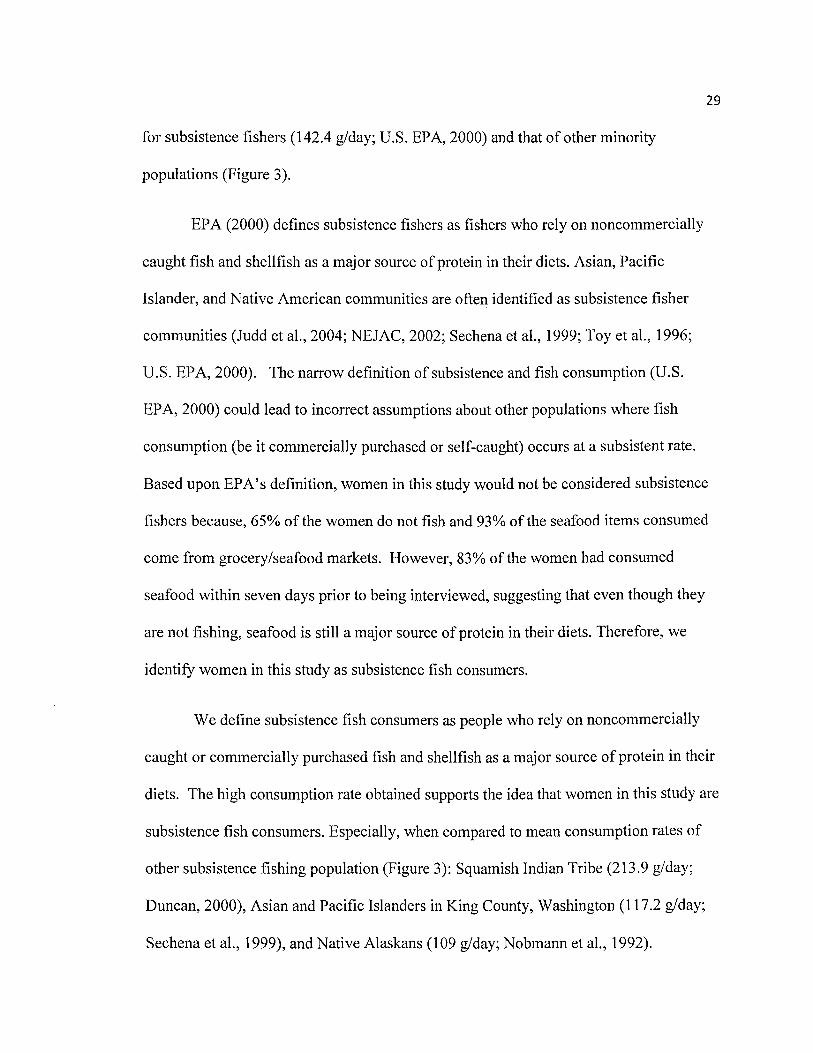
EPA (2000) defines subsistence fishers as fishers who rely on noncommercially
caught fish and shellfish as a major source of protein in their diets. Asian, Pacific
Islander, and Native American communities are often identified as subsistence fisher
communities (Judd et al., 2004; NEJAC, 2002; Sechena et al., 1999; Toy et al., 1996;
U.S. EPA, 2000). The narrow definition of subsistence and fish consumption (U.S.
EPA, 2000) could lead to incorrect assumptions about other populations where fish
consumption (be it commercially purchased or self-caught) occurs at a subsistent rate.
Based upon EPA's definition, women in this study would not be considered subsistence
fishers because, 65% of the women do not fish and 93% of the seafood items consumed
come from grocery/seafood markets. However, 83% of the women had consumed
seafood within seven days prior to being interviewed, suggesting that even though they
are not fishing, seafood is still a major source of protein in their diets. Therefore, we
identify women in this study as subsistence fish consumers.
We define subsistence fish consumers as people who rely on noncommercially
caught or commercially purchased fish and shellfish as a major source of protein in their
diets. The high consumption rate obtained supports the idea that women in this study are
subsistence fish consumers. Especially, when compared to mean consumption rates of
other subsistence fishing population (Figure 3): Squamish Indian Tribe (213.9 g/day;
Duncan, 2000), Asian and Pacific Islanders in King County, Washington (117.2 g/day;
Sechena et al., 1999), and Native Alaskans (1 09 g/day; Nobmmm et al., 1992).
30
The strengths of using CBPR to guide this research was that it helped to establish
trust between the community and researchers involved and provided invaluable
community knowledge that has enhanced our understanding of our work. Through the
partnerships established, the executive director of the Moton Community house and
members of CAC equitably participated in the problem definition, information collection
and data analysis for this investigation. Results of this work were discussed with CAC to
explore possible lifestyle and cultural explanations. Members of CAC conveyed that one
possible lifestyle explanation for the high rate of seafood consumption may be due to the
promotion of seafood as a healthy alternative to meats high in fat (i.e. pork or beef)
usually consumed by women in this community. Culturally, it was suggested that prior
the Trans-Atlantic slave trade, many African Americans were part coastal communities
along the Western coast of Africa and that a culture of fishing and seafood consumption
already existed and was brought with them. In addition, during slavery many African
Americans joined indigenous communities (Johnson, 2001) where a culture of fishing
and seafood consumption also existed. Members ofCAC also noted that in the U.S.,
during periods of slavery and Jim Crow, fishing provided free food and places of solitude
and peace from the inhumane acts of people, the laws, and the regulations of the time.
Interestingly, CAC noted that the high rate of purchased commercial seafood may be
because it is easily accessible and more convenient for a single mother than actually
fishing. As one women stated, "Even though I do not have a lot of money, my time is
still valuable and often used towards work. I don't have the time to fish to feed my
family. For me, it is easier and more efficient to purchase fish than spending the time
attempting to catch (or not) dinner"

31
As it relates to dietary mercury exposure and any potential risk, results of this
study imply that even though women in this community consume a lot of seafood (147.8
g/day) their risk of mercury exposure may be low. Except for canned tuna, the most
common seafood consumed within seven days prior to being interviewed (shrimp,
whiting, blue crab, and croaker) and in general (whiting, shrimp, snow crab legs, blue
crab, and croaker) have the least amount ofmercury of seafood caught and sold
commercially (National Research Defense Council (NRDC), 2009). This would suggest
that consumption of these items would not place women in the community at high risk of
dietary mercury exposure. On the other hand, according to the NRDC (2009), mercury
concentrations in canned tuna range from moderate to high, depending on the type (light
or albacore (white)) and could potentially play a significant role in dietary mercury
exposure for women in this community. Future work includes determining mercury
concentrations in seafood items consumed and generating community-specific statements
of dietary mercury risks.
The results obtained in this study are potentially bias toward African American
women (age 16-49 yrs) in the Southeast Community of Newport News, Virginia with
low incomes. Because the surveys were administered during normal business working
hours (9 AM to 5 PM), the results may also be bias toward women who do not work.
Finally, the seasonality in seafood consumption may have biased consumption rates
upwardly. Participants in this study were surveyed during April and May, months that
correspond to when the women consumed the most amount of seafood. If the survey was
administered during months that corresponded to when the women consumed the least
32
amount of seafood, the mean seafood consumption rate may have been lower. Currently,
surveys are being administered to define this potential bias.
5. CONCLUSION
The use of CBPR greatly improves exposure assessments by providing
community-specific information. Community-specific information increases data quality
and reduces parameter uncertainty for those estimating risk. Through the CBPR
approach we learned that ingestion rates (g/meal) are not only the selected portion size
but, more importantly, how many of the individual portions are consumed during one
meal setting. In addition, even though women in this study are not subsistence fishers,
they are subsistence fish consumers.
Women in this community have high seafood consumption rates which could
have significant implications for exposure of contaminants associated with seafood (i.e.
mercury or polychlorinated biphenyls) With the exception of canned tuna, seafood items
commonly consumed suggest that women in this community are at low risk of dietary
mercury exposure. However, the consumption of canned tuna could potentially place
women in this community at a higher risk. Future work will determine mercury
concentrations in seafood items consumed and generate community-specific statements
of dietary mercury risks.

33
ACKNOWLEDGMENTS
Thanks to Dr. Isa Williams-Miles for her guidance with CBPR methodology and
survey design, Christopher Burrell for his assistance with follow-up interviews, and
Hakima Muhammad for allowing CAC to meet at her home. Special thanks to the
women on the Community Advisory Council: Catina Stephenson, Genise Hardy, Sharita
Hardy, Stacey Hill, Sarah Jones, Theressa Parker, Eunice Perry, Tasha Pounds, Tramaine
Roberts, and Keyanna Bethea. Lastly, special thanks to Lindwood Debrew, the executive
director ofthe Moton Community House, and all the coalition members of Heal-Thy
Generations: A Southeast Health Movement.

LITERATURE CITED
Beehler, G., McGuinness, B.M., Vena, J.E., 2001. Polluted fish, sources ofknowledge, and the perception of risk: Contextualizing African American anglers' sport fishing practices. Human Organ. 60, 288-297.
34
Bienenfeld, L.A., Golden, A. L., Garland, E.J., 2003. Consumption offish from polluted waters by WIC participants in East Harlem. Bull. N.Y. Acad. Med. 80, 349-357.
Burger, J., Stephens, W. L., Boring, S., Kuklinski, M., Gibbons, J.W., Gochfeld, M., 1999. Factors in exposure assessment: Ethnic and socioeconomic difference in fishing and consumption of fish caught along the Savannah River. Risk Anal. 19, 427-438.
Burger, J., Gaines, K. F., Gochfeld, M., 2001. Ethnic differences in risk from mercury among Savannah River fisherman. Risk Anal. 21, 533-544.
Cecelski, D.S., 2001. The Waterman's song: Slavery and freedom in maritime North Carolina. University of North Carolina Press, Chapel Hill, NC.
Centers for Disease Control and Prevention (CDC), 2001. Blood and hair mercury levels in young children and women of childbearing age -United States, 1999. Morb. Mortal. Wkly. Rep. 50, 140-143.
Centers for Disease Control and Prevention (CDC), 2005. Third national report on human exposure to environmental chemicals. Atlanta, GA.
Corburn, J., 2002. Combining Community-Based Research and Local Knowledge to Confront Asthma and Subsistence-Fishing Hazards in Greenpoint/Williamsburg, Brooklyn, New York. Environ. Health Perspect. 110,241-248.
Duncan, M., 2000. Fish consumption survey of the Suquamish Indian tribe of the Port Madison Indian Reservation, Puget Sound Region. The Suquamish Tribe, Port Madison Indian Reservation, fisheries department, Suquamish, W A, USA.
Gibson, Joshua C. and McClafferty, Julie A. 2005. Identifying populations at risk for consuming contaminated fish in three regions of concern. Chesapeake Bay Program and Conservation Management Institute. CMI-HDD-05-01, Blacksburg, VA
Harris, S.A., Urton, A., Turf, E., Monti, M.M., 2009. Fish and shellfish consumption estimates and perceptions of risk in a cohort of occupational and recreational fishers ofthe Chesapeake Bay. Environ. Res. 109, 108-115.

35
Israel, B.A, Schulz, A.J., Parker, E.A., Becker, A.B, 1998. Review of community-based research: Assessing partnership approaches to improve public health. Annu. Rev. Public Health. 19, 173-202.
Israel, B.A., 2000. Community Based participatory research: Principles, Rationale and Policy Recommendations. In: O'Fallen LR, Tyson FL, Dearry A, (Eds), Sucessful Models of Community-Based Paticipatory Research: Final Report. National Insititue of Environmental Health Sciences. Research Triangle Park, NC. pp. 16 -29
Johnson, W.R. (Ed), 2001. Exploring the legacy and future of Black/Indian relations.< http://web.mit.edu/wjohnson/www/kiaanafh/NCAI pdf Transcript.pdf> (accessed 11/16/09)
Judd, N., Griffith, W., Faustman, E., 2004. Consideration of cultural and lifestyle factors in defining susceptible populations for environmental disease. Toxicology. 198, 121-133.
Leung, M.W., Yen, I.H., and Minkler, M., 2004. Community-based participatory research: a promising approach for increasing epidemiology's relevance in the 21st century. Inter. J. Epidem. 33, 499-506
Mahaffey, K., Clickner, R., Boduro, C., 2004. Blood organic mercury and dietary mercury intake: National Health and Nutrition Examination Survey, 1999 -2002. Environ. Health Perspect. 112, 562-570.
Mahaffey, K.R., Clicker R.P., Jeffries, R.A., 2008. Methylmercury and omega-3 fatty acids: Co-occurrence of dietary sources with emphasis on fish and shellfish. Environ. Res. 107, 20-29.
Mahaffey, K.R., Clicker R.P., Jeffries, R.A., 2009. Adult women's blood mercury concentrations vary regionally in the United States: Associations with patterns of fish consumption (NHANES 1999- 2004). Environ. Health Perspect. 117(1), 47 -53.
Minkler, M., 2000. Participatory action research and healthy communities. Public Health Rep. 115, 191-97.
Minkler, M., Vasquez, V., Shepard, P. 2006. Promoting Environmental Health Policy Through Community Based Participatory Research: A Case Study from Harlem, New York. J. Urban Health. 83, 101 -110.
National Environmental Justice Advisory Council (NEJAC), 2002. Fish Consumption and Environmental Justice.

36
National Research Council (NRC), 2000. Toxicological Effects of Methylmercury. National Academy Press, Washington, DC.
National Research Defense Council (NRDC), 2009. Mercury Contamination in Fish: A Guide to Staying Health and Fighting Back. <http://www.nrdc.oru/health/effects/mercurv/guide.asp> (assessed on 10/ 23/ 2009).
Nelson BW, A wad D, Alexander J, Clark N. 2009. The continuing problem of asthma in very young children: a community-based participatory research project. J Sch Health. 79, 209-215.
Nobmann, E.D., Byers, T., Lanier, A.P., Hankin, J.H., Jackson, M.Y., 1992. The diet of Alaska Native adults: 1987-1988. Am. J. Clin. Nutr. 55, 1024-1032.
O'Fallen L.R., Dearry A., 2002. Community-based participatory research as a tool to advance environmental health sciences. Environ. Health Perspect. 11 0(2), 155 -159.
Schober, S.E., Sinks, T.H., Jones, R.L., Bolger, P.M., McDowell, M., Osterloh, J., et al., 2003. Blood mercury levels in U.S. children and women of childbearing age, 1999-2000. JAMA. 289, 1667-1674.
Sechena, R., Nakano, C., Liao, S., Polissar, N., Lorenzana, R.,Truong, S., Fenske, R., 1999. Asian and Pacific Islander seafood consumption study. EPA Office of Environmental Assessment, Seattle, W A.
Sechena, R., Liao, S., Lorenzana, R., Nakano, C., Polissar, N., Fenske, R., 2003. Asian and Pacific Islander seafood consumption study- a community-based study in King County, Washington. J. Expo. Anal. Environ. Epidemiol. 13, 256- 266.
Silver, E., Kaslow, J., Lee, D., Lee, S., Tan, M.L., Weis, E., Ujihara, A., 2007. Fish consumption and advisory awareness among low-income women in California's Sacramento-San Joaquin Delta. Environ. Res. 104,410-419.
Terrell, J.A., Williams, E.M., Murekeyisoni, C.M., Watkins, R., Tumiel-Berhalter, L., 2008. The Community-Driven Approach to Environmental Exposures: How a Community-Based Participatory Research Program Analyzing Impacts of Environmental Exposure on Lupus Led to a Toxic Site Cleanup. Environ. Justice. 1 (2), 87 - 92.
Toy, K.A., Polissar, N.L., Liao, S., Mittelstaedt, G.D., 1996. A fish consumption study of the Tulalip and Squaxin Island tribes of the Puget Sound region. Tulalip Tribes, Department of Environment, Marysville, W A.

U.S. Bureau of Census., 2000. Population and Income File, SF3. US Dept. of Commerce. Washington, DC.
37
U.S. EPA., 2000. Guidance for assessing chemical contaminant data for use in fish advisories. volume II: Risk assessment and fish consumption limits. EPA-823/B-00-008. U.S. Environmental Protection Agency, Office of Water.
U.S. EPA. 2001. Risk assessment guidance for superfund (RAGS) volume III- Part A: Process for conducting probabilistic risk assessment. EPA 540-R-02-002. U.S. Environmental Protection Agency, Office ofEmergency and Remedial Response, Washington D.C.
Weintraub, M., Birnbaum, L.S., 2008. Catfish consumption as a contributor to elevated PCB levels in a non-Hispanic black subpopulation. Environ. Res. 107, 412-417.

38
TABLE 1.
Group Description
A Whole body, e.g., croaker, spot, perch
B Slender fillets, e.g., whiting, trout, catfish
c Patties/Cakes, e.g., salmon, mackerel, crab
D Scallops
E Shrimp
F Mussels, clams, oysters
G Snow crab legs
H Whole blue crabs
Salmon steak
J Broad fillets, e.g., catfish, flounder
K Tilapia
L Canned fish, e.g., sardines, herring
M Canned tuna
List of groups used for visual aids.

TABLE2.
N % 95%CI
Months that seafood items are consumed the most
Spring-Fall (Mar.- Dec.) 81 85% 78-93%
Winter-Summer (Dec.- Sep.) 8 8% 2-14%
Fall-Spring (Sep.- Jun.) 4 4% 0.1-8%
All Year (Jan.- Dec.) 2 2% 0-5%
Total 95 100%
Months that seafood items are consumed the least
Fall-Spring (Sep.- Jun.) 44 47% 37-58%
Winter-Summer (Dec.- Sep.) 44 47% 37-58%
Spring-Fall (Mar.- Dec.) 5 5% 0.7-10%
Total 93 100%
The percentage of women reporting the months when the most and least amount of seafood is consumed.
39

FIGURE 1.
Seafood Item consumed· ~~~W3 ~::::::~::~::~::::::::~: ... ~.: .. :.: .. ~ .... ::::::::::.:=n Tuna Snow Crab Legs Blue Crab Croaker Scallops Spot rv'rackerel Cake Salmon Cake Til apia Crab Cake Trout Flounder Oysters Catfish Clam Sardines Lobster Mussels Black Bass Buttertlsh Salmon Steak Perch Striped Bass Trout (Sea) Dungeness Crab King fish Morik Fish Porgy Bluefish Clam Strips Crab meat Fish Sticks Large mouth Bass Mackerel Salad Puppy Drum Sha<J Sushi
--· ·---·::.eel =::J
0 10 20 30 40 50 60 70 80
FREQUENCY (total#ofwomen)
40
Consumption frequency of the seafood items generally consumed (n = 95 women). Mercury concentrations have been determined for whiting (Mf!rlangius spp. ), shrimp (Penaeus spp.), tuna (Thunnus alalunga and Katsuwonus pelamis), snow crab legs (Chinoecetes opilio or C. bairdi), blue crab (Callinectes sapidus), croaker (Micropogonias undulates), scallops (Placopecten magellanicus), spot (Leiostomus xanthurus), mackerel (Scomberomorus Cavalla) cakes, salmon (Oncorhynchus gorbuscha) cakes, tilapia (Oreochromis spp.), crab (Callinectes sapidus) cake, trout (Oncorhynchus spps, Salvelinus spp or Salmo trutta), flounder (Paralichthys dentatus or Pleuronectes americanus) oysters (Crassostrea virginica or C. gigas), catfish (Ictalurus punctatus, 1 jitrcatus, Pylodictis olivaris, or Ameiurus catus ), clams (Protothaca staminea, Mya arenaria, Saxidomus giganteus, or Mercenaria mercenaria,), sardines (Clupea harengus), lobster (Homarus americanus) and mussels (Mytilus edulus).

Seafood Item consumed Shrimp Croaker Blue Crab Whltlno Snow Crab Legs Tuna Spot r.fackerel Cake Salmon Cake Scallops Tllapla Flounder Crab Cake Trout Catfish Sardines Oysters Lobster Trout (Sea) Mussels Fish Sticks Black Bass Clam Monk Fish Salmon Steak Striped Bass Butlerfish Mackerel Salad Porgy Perch Clam Strips Puppy Drum Large mouth Bass Dungeness Crab Cral) meat King fish Bluefish Shad Sushi
FIGURE2.
"====-'-======?
l 0 1000 2000 3000 4000
Summed Amount Consumed (g/day)
The summed amount consumed (g/day) of seafood items generally consumed by the women surveyed (n=95).
41

250
>; ('Q 200 ~ --.9 VI <II -('Q
0:: 150 c: 0
+= Q. E :;, VI
100 c: 0 (.)
~ 0 0 -('Q
50 <II (/J
FIGURE 3.
o U.S. Women (1)
• U.S. African American Women (1)
• U.S. EPA Default Value for general and recreational (2)
• Native Alaskans (3)
• Asian and Pacific Islanders (4)
• U.S. EPA Default Value for subsistence (2)
• Current Study
o s quamish Indian Tribe (5)
1.8 2.4
Investigations
42
213.9
147.8
Comparison of seafood consumption rates between current study and other investigations (
1Maheffey et al. , 2004 2US EPA, 2000 3Nobmann et al. 1992 4Sechena et al., r999, 5Duncan, 2000).

43
CHAPTER2
Expanding Perceptions of Subsistence Fish Consumption: Evidence of High Commercial
Fish Consumption and Dietary Mercury Exposure in an Urban Coastal Community

44
ABSTRACT
Through collaborative partnerships established between current researchers and The Moton
Community House (a local community center), African American women (ages 16-49 yrs) from
the Southeast Community of Newport News, Virginia, USA were surveyed to assess the
reproducibility and consistency of fish consumption patterns (ingestion rates, exposure
frequencies, weight, and fish consumption rates) derived from a community-specific fish
consumption survey. Women were also surveyed to assess the reliability of the survey responses,
and to estimate daily mercury intake. Fish consumption patterns were reproducible and the
survey responses were reliable. Comparison between years revealed that fish consumption
patterns remained consistent over time. In addition, the high fish consumption rate estimated in
2008 (147.8 g/day; 95% CI: 117.6-185.8 g/day) was reaffinned with a rate (134.9 g/day; 95% CI:
88-207 g/day) not materially different and still considerably higher than mean fish consumption
rates reported for U.S. women. Daily mercury intake rates were estimated using consumption
data from 2008 and three consumption scenarios (canned white, canned light, and no tuna) due to
confirmed differences in mercury concentration between canned white and light tuna. Arithmetic
mean daily mercury intake rates were 0.284 ug/kg-bw/day (95% CI: 0.229 - 0.340 ug/kg-bw/day)
using canned white tuna, 0.212 ug/kg-bw/day (95% CI: 0.165-0.259 ug/kg-bw/day) using light
tuna, and 0.197 ug/kg-bw/day (95% CI: 0.151 - 0.243 ug/kg-bw/day) using no tuna.
Approximately 58%- 73% of the daily mercury intake rates for African American women in the
Southeast Community exceeded US EPA's oral reference dose (RID) ofO.lO ug/kg-bw/day for
mercury. In addition, 2% of the rates exceeded a level (1.00 ug/kg-bw/day) documented to
produce adverse health effects. Past and current investigations confirmed that even though
women in this community were not subsistence fishers, they are subsistence fish consumers.

45
1. INTRODUCTION
The estimation of finfish and shellfish (further referred to as fish) consumption
and contaminant exposure in US subpopulations (e.g. subsistence fishers, ethnic
minorities, or recreational anglers) can be greatly influenced by an assessor's perception
and the selection of parameter values used to estimate exposure; especially, in
subpopulations where peer reviewed publications and exposure data are limited, and an
assessor is left to their own "best" judgment. Due to limited exposure data for certain US
subpopulations (e.g., ethnic minorities), Federal and State default values are often used
when estimating fish consumption and contaminant exposure (e.g. mercury,
polychlorinated biphenyls, or endocrine disrupters) in these populations. However, more
thought and consideration needs to be given when selecting such values because they
typically are not reflective of many US subpopulations and are based on both consumers
and non consumers of fish as oppose to only fish consumers (National Environmental
Justice Advisory Council (NEJAC), 2002). For Federal and State assessors, narrowly
held perceptions of certain subpopulations could lead to incorrect assumptions of fish
consumption and contaminant exposure that in turn could result in environmental policies
and standards that do not effectively protect these subpopulations.
Subsistence fishers are generally defined as those that rely on non-commercially
caught fish as a major source of protein to their diet (US Environmental Protection
Agency (US EPA), 2000a, 2000b ). In the US, subsistence fishers represent
subpopulations that are potentially highly exposed to contaminated fish and exhibit the
highest fish consumption rates reported, as suggested by US EPA's default consumption
46
rate for subsistence fishers (142.4 g/day) and peer reviewed publications (Toy et al.,
1996; Sechena et al., 1999 and 2003; Duncan, 2000; Judd et al., 2004). The high fish
consumption rates exhibited by subsistence fishers strongly support the use of the
adjective "subsistence" in describing their fish consumption patterns; although,
subsistence fish consumers are often only thought of as individuals with high
consumption rates who "fish" for, instead of "purchase," fish. This perception of
subsistence fish consumers (and consumption), currently held by many exposure and risk
assessors, stymies the use of the adjective "subsistence" to also describe subpopulations
that do not fish but whose consumption of fish provides a major source of protein to their
diet, is commercially purchased, and is comparable to that of subsistence fishers.
Recently we suggested that currently held perceptions of subsistence fish consumers (and
consumption) be broaden to include other subpopulations populations with comparable
subsistence fish consumption patterns and contaminant exposures (Holloman and
Newman, 2010). We define subsistence fish consumers broadly as those who rely on
noncommercially caught or commercially purchased fish as a major source of protein in
their diets (Holloman and Newman, 2010).
In 2004, the US EPA and Food and Drug Administration (US FDA) jointly
developed fish consumption advice for one specific contaminant, mercury (US
EPA/FDA, 2004 ). This joint effort reflected an understanding that human exposure to
mercury contaminated fish involves the consumption of both commercial and
noncommercial items. Mercury poses a human-health risk because of the adverse
neurodevelopmental effects that have been linked with exposure. Methylmercury

47
(MeHg), the predominant form of mercury associated with fish, is known for its
neurotoxicity and developmental toxicity (National Research Council (NRC), 2000;
Castaldi et al., 2008). In addition, some studies have linked methylmercury exposure
from fish consumption to cardiovascular toxicity (Salonen et al., 1995; Guallar et al.,
2002; Virtanen et al., 2005; Roman et al., 2011) while others have found no associations
(Ahlqwist et al., 1999; Hallgren et al., 2001; Y oshizawa et al., 2002; Mozaffarian, 2009;
Mozaffarian et al., 2011). To protect humans against chronic and developmental mercury
toxicity, US EPA developed an oral reference dose (RID) of 0.10 ug/kg-bw/day, an
estimate of a daily oral exposure that is likely to be without an appreciable risk of adverse
health effects over a lifetime (US EPA, 2001a, 200lb).
In the US, African Americans represent a subpopulation whose dietary mercury
exposure may potentially be underestimated due to misperceptions about subsistence fish
consumption. Numerous studies continue to report that African Americans have higher
fish consumption rates and associated contaminant exposures than the general US
population or other subpopulations such as recreational anglers (e.g., Burger et al., 1999;
Burger et al., 2001; Mahaffey et al., 2004; Gibson and McClafferty, 2005; Derrick et al.,
2008; Shilling et al., 2008; Mahaffey et al., 2009; McGraw and Waller, 2009; Holloman
and Newman, 2010; Shilling et al., 2010). However, peer-reviewed publications remain
limited regarding African American fish consumption patterns and contaminant
exposures (Weintraub and Birnbaum, 2008; Derrick et al., 2008; McGraw and Waller,
2009; Holloman and Newman, 2010) and cultural and lifestyle factors influencing such
exposures (Beehler et al., 2001; Cecelski, 2001; Weintraub and Birnbaum, 2008).
48
Through collaborative partnerships established between current researchers and a
local community center (The Moton Community House), a community-based
participatory research (CBPR) approach was used to explore fish consumption and
dietary mercury exposure for African American women of childbearing age (ages 16- 49
yrs) residing in the Southeast Community of Newport News, Virginia, USA. During
April and May 2008, we administered a community-based fish consumption survey to
African American women (n = 95) for the purpose of estimating fish consumption
patterns (Holloman and Newman 2010). Our results suggest that even though African
American women in this community are not subsistence fishers, they are subsistence fish
consumers and that their consumption of commercially purchased items is high enough to
warrant concerns of dietary mercury exposure (Holloman and Newman, 2010).
The goals of the present investigation were to confinn that the consumption
survey used to estimate fish consumption patterns was reproducible and to estimate
dietary mercury exposures for African American women (ages 16- 49 yrs) residing in the
Southeast Community ofNewport News, Virginia. Specific objectives were to: 1) assess
the reproducibility of the East End Fish Consumption Survey, 2) quantify the reliability
of the responses used to estimate fish consumption rates, 3) assess the consistency offish
consumption patterns in the community, 4) detem1ine mercury concentrations in
commonly consumed fish items, and 5) generate deterministic (point) estimates of daily
mercury intake. We hypothesized that fish consumption rates for African American
women in the Southeast Community were greater than US EPA default values. We also
hypothesized that daily mercury exposures, as well as percentage of the population
49
exceeding US EPA's oral RID for mercury, for African American women in this
community were higher than reported estimates and exceedances for general US women.
2. MATERIALS AND METHODS
2.1. Survey Design
The 201 0 East End Fish Consumption Survey was based on the consumption
survey administered during April and May 2008 (Holloman and Newman, 201 0). The
East End Fish Consumption Survey was designed to estimate the ingestion rate (IR,
g/meal), exposure frequency (EF, meals/year), and consumption rate (CR, g/day) of
individual fish (finfish and shellfish) items consumed by, and the body weight (Wgt, kg)
of, low-income African American women residing in the Southeast Community of
Newport News, Virginia, USA Methods previously published (Holloman and Newman,
201 0) were used in determining IR, EF, and CR, for the current survey. All questions
asked in the 2008 survey were included in the 2010 version of the East End Fish
Consumption Survey.
Changes in the 2010 version ofthe East End Fish Consumption Survey included
the use of different visual aids, clarification of cooking methods, and an additional
question used to quantify reliability of responses. It was noted that the validity ofthe
estimates (i.e., Wgt, IR, EF, and CR) was important but was quantified not due to limited
resources. In the current survey, 68 new individual fish items were vacuum sealed and
used based on visual aid methods previously published (Holloman and Newman, 2010).
For clarification of cooking methods, the same questions asked in 2008 were asked in the
so
current survey but separately for fish and shellfish. To assess the reliability of the
responses given by the participants, they were asked initially to state consumption
information for all fish items they listed then at the end of the survey, they were asked to
restate consumption information pertaining specifically to the first fish item listed. A
measure of concordance between the two responses (beginning and end) was determined
and used as a relative measure of reliability in responses given by the participants.
2.2. Sample Size and Recruitment
The number of women used to assess the consistency of fish consumption and
reproducibility of the East End Fish Consumption Survey was based on confidence
interval precision using SAS PROC POWER (Version 9.2 software; SAS Institute Inc,
Cary, NC). We were interested in confidently detecting a difference between 2010
estimates for IR, EF, and Wgt that was at most, 30% of the 2008 mean estimates.
Because ofthe nonnormality in theIR, EF, and Wgt distributions obtained in 2008, log
transformed data were used in the calculation of sample size. Sample sizes for IR, EF,
and W gt were calculated and the results ofthe three variables compared. It was
determined that 12 women would be sufficient to achieve the desired precision. A total
of 12 participants were conveniently recruited throughout the Southeast community of
Newport News, Virginia. Inclusion criteria for participation were that participants (1)
resided in the Southeast community ofNewport News, VA, (2) considered themselves an
African American or Black woman between the ages of 16- 49 years, and (3) consumed
fish. None of the selected women had participated in the 2008 survey.

51
We attempted to assess reproducibility by administering the survey to the same 12
women, four separate times during February 2010- June 2010. This time frame was
selected because we also wanted to simultaneously examine seasonality of fish
consumption, representing winter/spring (February/April2010) and spring/summer
(May/June 2010) consumption. However, the number of participants (12) needed to
confidently achieve the desired precision for assessing reproducibility was only attained
during May 2010. In June 2010, the month with the next highest number of
participants, only nine out of the 12 women were able to take the survey. Therefore,
subsequent analysis for reproducibility only focused on data collected during May and
June 2010 for nine women (with the understanding that differences in 2010 less than 30%
of the 2008 estimates may not confidently be detected), and seasonality was not analyzed.
To assess the consistency offish consumption patterns (IR, EF, and CR), the 12 women
in the current study were surveyed during a time (the month of May) comparable to when
women in 2008 were surveyed (Holloman and Newman, 2010), and data between the two
were compared.
2.3. Determination of Mercury Concentrations
2.3.1 Sample Collection
A total of39 different types offish were listed as items consumed by women in
the Southeast Community ofNewport News, Virginia (Holloman and Newman, 2010);
however, all items were not analyzed for mercury due to time, availability, and resources.
Out of the 39 items listed, a total of24 fish items were selected for mercury
detern1ination (Table 1 ). Fish items selected were based on: 1) ten or more women

52
surveyed in 2008 (Holloman and Newman, 2010) consuming a particular item (n =19), 2)
the potential of an item having elevated mercury concentrations due to species' trophic
ecology and availability of the item in local grocery stores and fish markets (n = 2), and
3) three randomly selected fish items consumed by 9 or less of the women (n = 3).
For each of the 24 fish items, ten samples were selected from local grocery stores
and fish markets. Grocery stores and fish markets were selected for sampling because
93% offish items consumed by women in 2008 came from stores and markets where as
only 4% of items consumed were self-caught (Holloman and Newman, 2010). Selection
of the store or market to purchase the item was based on the cumulative probability of all
stores and markets listed by women in 2008 (Holloman and Newman, 2010). For one of
the items (lobster), in addition to being purchased at a grocery store/fish market, four out
ofthe ten samples were selected from a local restaurant because of the high probability of
lobsters being consumed at restaurants. Also for trout (n = 19), the only species available
in the selected stores and markets was sea trout which was why trout (sea) (n = 3) was
denoted with an asterisk in Table 1. Once at the store or market, all of the different
brands and types (fresh, frozen, canned) of the particular item were listed and a random
number table was used to select an item from this list. If a store or market did not carry
the particular fish item, another store/market was selected as previously mentioned and
the process repeated.
2.3.2 Sample Preparation and Analysis
Once collected, individual items were cut in half. One half of the item was
processed and analyzed in its unprepared (raw or straight out of the can with no further
53
preparation required) state; the other was cooked, processed, and analyzed in its prepared
(further preparation required) state. Based on cooking and cleaning methods previously
determined (Holloman and Newman, 2010) all cooked finfish was breaded (with skin on)
and pan/deep fried, and all cooked shellfish was boiled/steamed and the shell removed
before homogenizing. The halves were homogenized and placed into tared acid washed
(10% HN03) polypropylene bottles. The sample bottle was reweighed and the weight of
the bottle with the sample recorded. The unprepared and prepared halves were freeze
dried to constant weight and then wet: dry weight ratios calculated.
Total mercury concentrations (mg/kg, ppm) of dried samples were determined
using a Milestone DMA-80 Direct Mercury Analyzer (Shelton, CT). The method
detection limit (MDL) and limit of quantification (LOQ) for the DMA-80 were 0.0001
and 0.0005 mg/kg for 0.05 g of tissue, respectively. Results were converted to a wet
weight concentration (mg/kg) by dividing the dry weight concentration by the wet: dry
ratio. All mercury concentrations used in determining mercury exposure were the
converted wet weight concentrations (mg/kg, ppm).
2.3.3 Quality Control and Quality Assurance
Standard curves were generated using different amounts ofDORM-3, certified
standard reference material from the National Research Council of Canada. To assess
analytical quality of each analytical session, the certified standard reference material
TORT-2 was used to establish control charts in which four replicates of the reference
material (two in the beginning, one in the middle, and one at the end) were analyzed
during each session. Based on the planned use of the data (i.e., estimating daily mercury

54
intake), a recovery of± 6% for the TORT-2 reference material was deemed acceptable as
the control chart upper and lower limits. Mean mercury concentrations (wet weight,
mg/kg,) for all fish items analyzed were well above the method detection limit (0.0001
mg/kg) and limit of quantification (0.0005 mg/kg; Table 3). For the entire analytical
process, the mean percent recovery for the certified standard reference material, TORT 2,
was 103% (±2%).
2. 4. Daily Mercury Intake
A deterministic (point) estimate of daily mercury intake (mg/kg-bw/day) was
generated for low income African American women (ages 16-49 yrs) in Southeast
Newport News, Virginia using consumption data generated from women surveyed in
2008 (Holloman and Newman, 2010) along with mercury data generated from the current
investigation. Other mercury data were obtained from the peer reviewed literature and
state databases (Table 4). Specifically, fish consumption rates (g/day converted to
kg/day) were multiplied by mean mercury concentrations (mg/kg) yielding an amount of
mercury consumed (mg/day) for individual fish items listed. For each of the 95 women,
the amounts of mercury consumed for individual fish items listed were summed yielding
a total (summed) amount which was then divided by the woman's weight (kg). Because
only 93 out of the 95 women reported their weight, 93 daily mercury intake rates (mg/kg
bw/day) were estimated and ranked. Transformed ranks (Blom, 1958) and cumulative
proportions of daily mercury intake (mg/kg-bw/day) were plotted. In addition, because
canned tuna (not differentiating between type of canned tuna) was the only type of tuna
that the women stated consuming in 2008 (Holloman and Newman, 2010) and known

55
differences in mercury concentrations between types of canned tuna (white and light;
Burger and Gochfeld, 2004 ), three estimates of mercury intake were generated. These
three estimates represented the consumption offish that included either canned "white",
"light", or "no" tuna.
2. 5. Statistical Analysis
SAS 9.2 (SAS Institute Inc, Cary, NC) was used for all statistical analyses and
probability values less than 0.05 were deemed significant. Data from the 2010 East End
Fish Consumption Survey were not nom1ally distributed. Therefore, a nonparametric
Kendall -r procedure was used to assess correlations between demographic variables (age,
income, education, and body weight) and total number offish items listed, summed
ingestion rate (IR, g/meal), summed exposure frequency (EF, meals/year), and summed
fish consumption rate (CR, g/day). In addition, geometric estimates for means, standard
deviations, and 95% confidence intervals were determined for summed IR, EF, and CR,
and for body weight
Data from the nine out of 12 women surveyed in May and June 2010 were
compared to assess the reproducibility of the consumption survey to estimate IR, EF, CR,
and body weight (kg, Wgt) for African American women (ages 16-49 yrs) in the
Southeast Community. A nonparametric two sample Wilcoxon Rank Sum test (two
sided) was performed using NP AR1 WAY SAS procedures to generate a rank sum
statistic (WRs) along with associated p-values. Significant probabilities suggested that
the underlying distributions ofiR, EF, CR, and Wgt differed significantly between May
and June surveys and that the survey could not reproduce such estimates.

56
For consumption information requested twice within the survey, a measure of
concordance between responses was determined and used to quantify the reliability of
survey responses (i.e., for meal size, meals/year, and portion size) used to estimate IR,
EF, CR, and Wgt. The validity ofthe estimate itself(i.e., IR, EF, CR, and Wgt) was not
quantified. Because the response data was not normally distributed, nonparametric
procedures were employed and the Kendall -r-b coefficient was generated. This statistic
was used as the quantitative measure of reliability for responses used to estimate IR, EF,
CR, and Wgt.
To assess the consistency offish consumption patterns (IR, EF, and CR) for
African American women (ages 16-49 yrs) in the Southeast Community, data from
2008 (Holloman and Newman, 2010) was compared with current May 2010 data. A
nonparametric two sample Wilcoxon Rank Sum test (two-sided) was also performed
using NP AR1 WAY SAS procedures to generate a rank sum statistic (WRs) and
associated probabilities (p-values). Significant probabilities suggested that the
underlying distributions ofiR, EF, CR, and Wf:,rt differed significantly between years and
that the fish consumption patterns for African American women in the Southeast were
not consistent through time. Fish consumption patterns for African American women in
the Southeast Community were also compared to US EPA default values for the general
population, recreational anglers, and subsistence fishers and the higher estimate was
determined.
Mercury concentration data was not normally distributed; therefore, difference in
mercury concentrations between raw and cooked samples were also analyzed using

57
nonparametric procedures. A Wilcoxon signed rank test was performed using PROC
UNIVARIATE to estimate the signed ranked statistic (W sR). The hypothesis that the
median difference between raw and cooked samples is equal to zero was rejected for all
items with significant probability values thus suggesting that the underlying distributions
between raw and cooked samples differed.
Nonparametric methods were used to compare the three daily mercury intake
rates (white tuna, light tuna, or no tuna). A Kruskal-Wallis test was performed and a X2
statistic generated using the NPAR1 WAY SAS procedure to determine if a difference
among the intake rates existed. A probability value less than 0.05 was deemed
significant and suggested that a difference among the three intake rates existed.
Cumulative proportions of daily mercury intake rates were plotted and compared to US
EPA's oral reference dose (RID) for mercury (0.10 ug/kg-bw/day). The percentage of
intake rates exceeding the oral RID was determined and compared to national estimates
of exceedances.
3. RESULTS
3.1. Reproducibility, reliability, and consistency offish consumption patterns
Fish consumption data (IR, EF, CR, and Wgt) for the nine out of 12 participants
who took the survey during May and June 2010 were used to assess the reproducibility of
the consumption survey. Comparisons revealed no significant difference (p >0.05) in
underlying distributions ofiR (WRs = 87, p = 0.93), EF (WRs = 91, p = 0.70), CR (WRs =
92 p = 0.60), and Wgt (WRs = 86, p = 1.00) between May and June 2010 for the nine
58
participants. Measures of concordance (Kendall t-b) used to assess the reliability of
participant survey responses were high (Kendall t-b > 0.80) for May (n=12) and June
(n=9) 2010. For May 2010, Kendall t-b coefficients were 0.92 (95% CI: 0.76- 1.00) for
meal size, 0.95 (95% CI: 0.85 - 1.00) for meals/year, and 1.0 (95% CI: 1.00- 1.00) for
portion size. For June 2010, Kendall r-b coefficients were 1.00 for meal size, meals/year,
and portion size.
Data used to assess the consistency of fish consumption patterns was obtained
during May 2010, a time similar to that for the 2008 survey (April and May). All of the
women (n = 12) surveyed in 2010 had completed high school, GED or vocational training
and had household incomes of $0 - $20,000. There was no significant association (p
>0.05) between demographic variables (age, income, education, and weight) and total
number of fish items listed (Kendall t = 0.12, 0.28, -0.1 0, -0.08 respectively; p = 0.62,
0.30, 0.71, and 0.72 respectively) and summed IR (Kendall t = 0.14, 0.33, 0.26, 0.17
respectively; p = 0.53, 0.19, 0.31, and 0.45 respectively). There was a significant
association between the demographic variable age and summed EF (Kendall t = 0.5; p =
0.02), and summed CR (Kendall t = 0.46; p = 0.04); however, there was no significant
association between the other demographic variables (income, education, and weight) and
summed EF (Kendall t = 0.19, -0.21,-0.02 respectively; p = 0.47, 0.41, and 0.94
respectively) and summed CR (Kendall t = 0.33, 0.17, 0.24 respectively; p = 0.19, 0.52,
and 0.30 respectively).
Fish consumption data was not normally distributed therefore, geometric means
for Wgt and the sums ofiR, EF, and CR were reported (Table 2). Comparison between

59
years for fish consumption data (Figure. 1 A-D) revealed no significant difference (p
<0.05) in underlying distributions ofiR (WRs = 653, p = 0.96), EF (WRs = 519, p = 0.21),
CR (WRs = 561 p = 0.40), and Wgt (WRs = 599, p = 0.71) between 2008 and 2010.
3.2. Mercury Concentration ofCommonly Consumed Fish Items
Mercury concentrations ranged between 0.001-0.327 mg/kg for unprepared (raw
or straight from the can) items and 0.012-0.177 mg/kg for prepared (cooked) items. In
general, prepared items were higher in concentration than unprepared items. Out of the
20 fish items in which a comparison of median differences between prepared and
unprepared concentrations could be made, median differences were significantly greater
than zero for 14 of the items (Table 3). Median differences were significantly greater
than zero for shrimp croaker, blue crab, whiting, salmon cake, scallops, tilapia, flounder,
crab cake, catfish, lobster, black bass, and butterfish. For sea trout, the median difference
was significantly greater than zero with a borderline p value (0.049).
3.3. Deterministic Estimates of Daily Mercury Intake
For women surveyed in 2008, arithmetic mean daily mercury intake rates were
0.284 ug/kg-bw/day (95% CI: 0.229- 0.340) using canned white tuna, 0.212 ug/kg
bw/day (95% CI: 0.165 - 0.259) using light tuna, and 0.197 ug/kg-bw/day (95% CI: 0.151
- 0.243) using no tuna. The mean ranks of daily mercury intake rates were significantly
different among the choice oftuna used (x2 = 8.60; p = 0.01). For approximately 58%-
73% of the cases, daily mercury intake rates for low income African American women in
Southeast Newport News, VA, would exceed US EPA's oral reference dose (RID) of
0.10 ug/kg-bw/day for mercury (Figure 2). In addition, for approximately 2% of cases,

women in this community would exceed a level (10*RtD for mercury; 1.00 ug/kg
bw/day) documented to produce adverse health effects (Figure 2).
4. DISCUSSION
4.1. East End Fish Consumption Survey
60
In the field of nutritional epidemiology, there are numerous methods to assess the
validity and reproducibility of estimates derived from fish consumption surveys
(Shatenstein et al., 1999; Mina et al., 2007; Birgisdottir et al., 2008). We understand the
importance of validating estimates (IR, EF, CR, and Wgt) derived from the East End Fish
Consumption Survey; however, due to limited resources we were only able to assess the
reproducibility of the estimates and the reliability of the responses used to generate the
estimates. For reproducibility, results revealed no difference in the underlying
distributions ofiR, EF, CR, and Wgt between May and June 2010 for the nine women
surveyed thereby implying that the survey was able to reproduce the estimates. A
difference between May and June estimates may have existed but, was not detected
because the number of participants (n=12) needed to confidently detect such difference
(at most 30% ofthe 2008 estimates) was not achieved. However, if such a difference
existed, it would be marginal in comparison to the more illuminating differences between
estimates for African American women in the Southeast Community and US. EPA
default values for the general population and recreational anglers. Thus, even with the
possibility of the estimates between May and June being different, such a difference still
does not overshadow the fact that the survey was able to reproduce the substantially
higher estimates exhibited by women in this community.
61
Reliability of the responses used to generate the fish consumption estimates was
not assessed in 2008; however, data collected in 2010 (May and June) did suggest that
responses used in generating estimates were highly reliable and similar to the responses
given 2008 (Holloman and Newman, 2010). For both May and June, the measures of
concordance (Kendall -r-b) were 0.92 and 1.00 respectively for meal size, 1.00
respectively for portion size, and 0.95 and 1.00 respectively for meals/year. Such high
measures of concordances (>0.80) strongly implies that responses in 2010 were reliable
and that the same may have been true for responses given in 2008; thus for our purposes
we assumed that responses given in 2008 were reliable as well.
Comparisons of estimates between the years (2008 and only May 2010) strongly
suggest that fish consumption patterns of African American women in the Southeast were
consistent through time. Seasonality was not able to be addressed but can play a
significant role in fish consumption for women in this community. Both of the surveys
were administered during late spring (April and May) and therefore may only be
reflective of consumption during that season. Thus, because the current and past
(Holloman and Newman, 20 I 0) investigations assumed regular and consistent
consumption, fish consumption estimates generated for African American women in the
Southeast are potentially overestimated.

62
As noted earlier, the validity ofiR, EF, CR, and Wgt should be investigated and
could be addressed by using dietary records or recalls in which consumption estimates
generated by the survey are compared with estimates generated by the records or recalls
(Masson et al., 2003). The use ofbiomarkers (e.g. hair and blood mercury) could also be
used to assess the validity of estimates derived from fish consumption surveys.
Biomarkers provide a more accurate estimate of actual fish consumption as well as a
method free from errors associated with dietary records (e.g. food consumption diaries)
or recollections, e.g. 24 hour recall (Mina et al., 2007).
The lack of validating IR, EF, CR, and Wgt potentially means that the estimates
may not be accurate and precise reflections of fish consumption for African American
women in this community. However, based on current conclusions that: 1) the survey
consistently estimated ingestion rate (g/meal), exposure frequency (meal/year), fish
consumption rate (g/day), and body weight (kg), 2) the responses used to generate such
estimates were highly reliable, and 3) estimates derived from the survey were
reproducible, we assumed the estimates generated in 2008 and currently were reasonable
reflections of fish consumption patterns during late spring and early summer for African
American women in the Southeast Community.
4. 2. Evidence of high subsistence fish consumption
The high fish consumption rate (147.8 g/day) obtained in 2008 for African
American women residing in this urban costal community (Holloman and Newman,
201 0) was also reconfirmed with results of the current investigation. The mean fish
consumption rate of women surveyed in the current investigation (134.9 g/day) was not
63
materially different from women surveyed in 2008; however, it was considerably higher
than US EPA default values reported for the general population and recreational angler
(17.5 g/day), and more similar to the default value for subsistence fishers (142g/day).
In estimating ingestion rates, a necessary adjustment was made based on the
understanding that the total amount ingested for a particular item was not only the portion
size (g/meal), but also how many individual portions (meal size) were consumed during
one meal setting (Holloman and Newman, 2010). Such an adjustment should be
considered when estimating ingestion rates and was calculated by multiplying the portion
size selected by the number of individual portions consumed during one meal setting
(Holloman and Newman, 2010). For African American women in this community, not
making this adjustment would result in underestimation of ingestion rates and is
potentially one of the reasons why consumption rates were higher.
Additionally, as noted in an earlier publication (Holloman and Newman, 2010),
the manner in which rates were calculated (using individual differences in exposure
frequencies and ingestion rates instead of averages) likely contributed to the higher
consumption rate estimates. For each individual surveyed in 2008, theIR for each item
listed was summed and used to represent a summed ingestion rate (g/meal) for the
individual. Thus, the IR reported in Table 2 is the mean of the summed ingestion rates
for the 95 individuals surveyed in 2008 (Holloman and Newman, 2010) and not the mean
of mean ingestion rates which, explains why this estimate seems extremely high. Women
surveyed in 2008 and 2010 could list up to 11 fish items and on average listed 8 items for
both years. To get a rough estimate of mean ingestions rates, the summed ingestion rates

64
could be divided by the average number of fish items listed (e.g., the mean of summed IR
for 2008 (1366g/meal) I mean# of items listed (8) = 171 g/meal).
It has been suggested that not taking into account species specific differences in
fish consumption potentially biases estimates downward (Burger et al., 1999). On the
other hand, others have suggested that such a "species specific" approach tends to
overestimate fish consumption patterns (Lincoln et al., 2011). For May 2010,
consumption rates (CR, g/day) based on a question specific to fish meals consumed
within seven days of taking the survey were generated and compared to the mean
summed CR generated from the listing of all fish consumed. Comparisons revealed that
the estimate based on the seven day question was lower (84 g/day; 95% CI: 32 - 219
g/day) than the mean summed CR estimate (134 g/day; 95% CI: 88 -207 g/day), however,
not significantly lower. Similar to work highlighting this difference (Lincoln et al.,
2011), we believe that true fish consumption for women in this community lies
somewhere between the two estimates (7 day CR and summed CR).
Based on the women surveyed in 2008, African American women (ages 16-49
yrs) from this urban coastal community would not be considered subsistence fishers
(hence subsistence fish consumers) because 65% of the women surveyed did not fish and
93% of the fish items consumed came from grocery/fish markets (Holloman and
Newman, 2010). However, the women consumed fish at a rate (147.8 g/day; Holloman
and Newman, 2010) comparable to rural subsistence fishing population such as the
Squamish Indian Tribe (213 .9 g/day; Duncan, 2000), Asian and Pacific Islanders in King
County, Washington (117.2 g/day; Sechena et al., 1999), and Native Alaskans (109
65
g/day; Nobmann et al., 1992). In addition, 83% of the women surveyed had consumed
fish within seven days of being interviewed (Holloman and Newman, 2010). Such fish
consumption patterns were also confirmed with results of the current investigation in
which 75% (95% CI: 46- 100 %) of the women surveyed in 2010 did not fish and 90%
ofthe items consumed came from grocery stores (53%; 95% CI: 43 - 63%) and fish
markets (37%; 95% CI: 27- 47%). Sixty-seven percent (95% CI: 35 - 98%) of the
women had consumed fish seven days prior to being interviewed. Collectively, this
evidence strongly suggests that African American women from the Southeast Community
of Newport News are subsistence fish consumers and rely on commercially caught fish as
a major source of protein in their diets (Holloman and Newman, 2010).
4.3. Preparation of Fish and Mercury Concentration
Mean mercury concentrations for the fish items analyzed were comparable to
other mean estimates reported for commercial fish items (Sunderland, 2007; McKelvey et
al., 2010; US FDA, 2011a, 2011b). The higher mercury concentrations (statistically
significant in many cases) for items prepared (cooked) versus unprepared (raw) were
similar to differences reported in the literature (Morgan et. al, 1997; Burger et al., 2003).
Noting the difference in mercury concentration between cooked versus raw fish items, it
has been suggested that food preparation factors be used in estimating mercury exposure
(Morgan et al, 1997; Burger et al., 2003). Preparation factors (mercury concentration in
cooked item/mercury concentration in raw item; Burger et al., 2003) for the current
investigation ranged from 1.1 (perch) to 1.6 (croaker) for fish and from 1.2 (snow crab
legs) to 1.5 (crab cake) for shellfish, compared to 1.5 to 1.8 for largemouth bass (Burger

66
et al., 2003) and 1.3 to 1.6 for walleye and lake trout (Morgan et al., 1997). Factors
obtained in the current investigation also coincided with the suggestion that a preparation
conversion factor of2 would be a suitable, protective default value (Burger et al., 2003).
As highlighted by Burger et al. (2003), the process of cooking fish (particularly deep
frying) causes moisture loss, but no mercury loss which results in an increase in mercury
concentration in the cooked fish relative to the raw fish sample. This is the most
plausible explanation as to why mercury concentrations were higher in cooked fish items
than in raw items.
No adjustments were made using a preparation food conversion factor to estimate
mercury intake because amount consumed and mercury concentrations were based on
cooked items. Burger et al. (2003) warned that assessors who do not take cooking
methods into account, but use raw fish contaminant data, may be overestimating safe
consumption levels and underestimating actual exposure. Thus, the lack of clearly stating
what type of data (prepared/cooked data) was used to generate consumption estimates
and mercury concentrations can create serious risk communication issues. For the
current investigation, estimates of meal size and amount consumed were based on cooked
items except for canned tuna, clams, oysters, and sardines in which estimates were based
on how the items are normally consumed in this community, unprepared (straight from
the can with no further cooking preparation). Mercury concentrations were also based on
cooked items except for canned tuna, clam, oysters, and sardines in which concentrations
were based on no further preparation (i.e. frying). As noted earlier, if fish consumption
estimates are based on cooked items but, an assessor calculates exposure based on raw
67
fish contaminant data, such estimates would underestimate actual exposure (Burger et al.,
2003). For the current investigation, because the estimation offish consumption and
mercury exposure were based on cooked items, it was believed that calculated exposure
estimates were more reflective of the actual daily mercury intake for women in the
community.
4.4. Daily Mercury Intake: Evidence ofhigh exposure
The mean mercury consumption per day (mg Hg /day;) using white tuna (0.02 mg
Hg/day), light tuna (0.015 mg Hg/day), and no tuna (0.014 mg Hg/day) was similar to
means reported for minority anglers from California's Central Valley Delta (African
American: 0.02 mg Hg/day; Southeast Asian: 0.02 mg Hg/day; Asian/Pacific Islander:
0.02 mg Hg/day; Hispanic: 0.01 mg Hg/day; Native American: 0.02 mg Hg/day)
(Shilling et al., 201 0). Daily mercury intake rates for no, light, and white tuna
consumption ( 0.197, 0.212, and 0.284 ug/kg-bw/day respectively) were significantly
higher than national estimates reported for general US women (0.02 ug/kg-bw/day; 95%
CI: 0.02 - 0.03 ug/kg-bw/day; Mahaffey et al., 2004) and for non-Hispanic Black women
(0.05 ug/kg-bw/day; 95% CI: 0.01 - 0.09 ug/kg-bw/day; Mahaffey et al., 2004).
However, current mercury intake rates more closely resembled the median rates of
fishing populations such as fluvial lake fish eaters in Canada (0.80 and 0.14 ug/kg
bw/day; Abdelouahab et al. 2008), and mean rates of subsistence fishing populations
such as the Tulalip native population in Washington State, US (0.11 - 0.20 ug/kg
bw/day), the Squaxin Island native population in Washington State, US (0.11 - 0.22
ug/kg-bw/day), and the Suquamish native population in Washington State, US (0.16-

0.25 ug/kg-bw/day; Marien and Patrick, 2001). This evidence strongly supports earlier
conclusions that African American women in the Southeast Community of Newport
News, Virginia are subsistence fish consumers (Holloman and Newman, 2010) and
suggests that dietary mercury exposure among these women is high.
68
Exposure to mercury from the consumption of fish can produce both chronic and
developmental toxicity effects in humans (US EPA 2001a, 2001b). To protect humans
against such mercury toxicity, US EPA developed an oral reference dose (RID) ofO.lO
ug/kg-bw/day, an estimate of a daily oral exposure that is likely to be without an
appreciable risk of adverse health effects over a lifetime (US EPA, 2001 a, 2001 b). This
RID was based on cord blood measurements and is associated with a blood mercury
(BHg) concentration of5.8 ug/1 (NRC, 2000; US EPA, 2001a, 2001b). The percentage of
women exceeding US EPA's oral RID was high for all three estimates (white, light, and
no tuna) with more than 50% of the estimates exceeding this threshold. These
exceedances were approximately 2- 3 times higher than what was reported in general
(29%) and specifically for African American (36%), Hispanic (25%), Asians (42%) and
Native American (27%) low income women in California's Sacramento-San Joaquin
Delta (Silver et al., 2007). These exceedances were also considerably greater than recent
national BHg exceedances for general US women (ages 16- 49 yrs, 4. 7 %; Mahaffey et
al., 2009) and for African American women ( 4.1 %; Mahaffey et al., 2009).
The oral RID, 0.10 ug/kg-bw/day, is a conservative estimate meant to be
protective of all components of populations including susceptible subgroups and is not
associated with measureable health effects. However, ten times the oral RID for mercury
69
is an intake estimate that has resulted in measurable health effects (US EPA, 2001 a,
2001b). The percentage ofwomen exceeding this estimate (1.00 ug/kg-bw/day) was
approximately 2% for the current investigation. This was comparable to the 5% of
consumers found to be exceeding this estimate in California's Central Valley Delta
(Shilling et al., 201 0). Collectively, the estimates of daily mercury intake and the
proportion ofwomen exceeding US EPA's oral RID provide strong evidence that African
American women in the Southeast Community of Newport News, Virginia might be
highly exposed to mercury through the consumption of fish.
5. CONCLUSION
It is erroneous to compare mean fish consumption of fish consumers with means
of general populations that includes both consumers and non consumers of fish; however,
many Federal and State agencies use default values based on such per capita estimates to
describe fish consuming populations as well as setting environmental standards and
policies to protect them (NEJAC, 2002). Assessors need to be more aware of their
perceptions associated with certain subpopulations and their selection of parameter
estimates used to characterize fish consumption in these populations, especially when
exposure data is limited. Narrow perceptions and incorrect assumptions of fish
consumption and contaminant exposure for many US subpopulations has lead to serious
issues of environmental injustices regarding risk management and communication
whereby non protective standards and polices have been implemented (and
70
communicated), and the burden of exposure reduction has placed solely on the individual
and population (NEJAC, 2002).
Through the collaborative partnership established between our research team and
the Moton Community House, critical insights were gained about fish consumption
patterns and dietary mercury exposure for low income African American women residing
in the Southeast Community ofNewport News, Virginia. One critical insight was that
fish consumption rates for women in this community were the highest rates reported for
African American women and supported the evidence that fish consumption among
women of this ethnicity was high compared to general population. Another insight was
that the sources of the fish items consumed by women in this community were mainly
from commercial sources (grocery store or fish market), not noncommercial sources
(fishing).
Results from the past (Holloman and Newman, 2010) and current investigations
confirmed that, even though women in this community are not subsistence fishers, they
consume fish at a subsistence fisher rate. It is conceivable how a lifestyle factor such as
subsistence fish consumption would have significant impacts on dietary mercury
exposure and results from the current investigation confirms this to be true for women in
this community. Noteworthy is the potential environmental injustice issue arising from
current perceptions of subsistence fish consumption held by many charged with assessing
and regulating exposure to contaminated fish. Assessors viewing subsistence fish
consumption only in relation to items fished for, instead of purchased, may
unintentionally overlook or make incorrect assumptions about populations who are not

71
subsistence fishers, but nonetheless, consume commercial fish at a subsistence rate.
African American women residing in the urban costal community of Southeast Newport
News, Virginia is one example of such a population.
ACKNOWLEDGMENTS
Special thanks to the women of the Southeast Community ofNewport News,
Virginia, USA whom without, our collaborative efforts would be in vain. Lastly, special
thanks to Linwood DeBrew (the executive director of the Moton Community House) and
Angela Harris (community resident/activist) for their guidance and support in
maintaining collaborative partnerships established between The College of William &
Mary, Virginia Institute of Marine Science and The Moton Community House.

72
LITERATURE CITED
Abdelouahab N, Vanier C, Baldwin M, Garceau S, Lucotte M, Mergler D. Ecosystem matters: Fish consumption, mercury intake and exposure among fluvial lake fisheaters. Sci ofthe Tot Environ 2008; 407 (1):154 -164.
Ahlqwist M, Bengtsson C, Lapidus L, Gergdahl IA, Schutz A. Serum mercury concentration in relation to survival, symptoms, and diseases: results from the prospective population study of women in Gothenburg, Sweden. Acta Odontol Scand 1999; 57:168-174.
Beehler G, McGuitmess BM, Vena JE. Polluted fish, sources of knowledge, and the perception of risk: Contextualizing African American anglers' sport fishing practices. Human Organ 2001; 60: 288-297.
Birgisdottir, BE, Kiely M, Martinez JA, Thorsdottir I. Validity of a food frequency questionnaire to assess intake of fish in adults in three European countries. Food Control2008; 19: 648-653.
Blom G. Statistical Estimates and Transformed Beta Variables. New York: John Wiley & Sons, Inc; 1958.
Burger J, Stephens WL, BoringS, Kuklinski M, Gibbons JW, Gochfeld M. Factors in exposure assessment: ethnic and socioeconomic difference in fishing and consumption of fish caught along the Savannah River Risk Anal 1999; 19: 427-438.
Burger J, Gaines, KF, Gochfeld M. Ethnic differences in risk from mercury among Savannah River fisherman. Risk Anal2001; 21: 533-544.
Burger J, Dixon C, Boring CS. Effect of Deep-Frying fish on Risk from Mercury. J Toxicol. Environ. Health 2003; 66:817-828.
Burger J, Gochfeld M. Mercury in Canned Tuna: Temporal Trends. Environ Res. 2004; 96:239-249.
Castoldi AF, Johansson C, Onishchenko N, Coccini T, Roda E, Vahter M, Ceccatelli S, Manzo L. Human developmental neurotoxicity of methylmercury: impact of variables and risk modifiers. Regul Toxicol Pharmacol2008; 51: 201-214.
Cecelski DS. The Waterman's song: Slavery and freedom in maritime North Carolina. University ofNorth Carolina Press, Chapel Hill, NC; 2001.

72
LITERATURE CITED
Abdelouahab N, Vanier C, Baldwin M, Garceau S, Lucette M, Mergler D. Ecosystem matters: Fish consumption, mercury intake and exposure among fluvial lake fisheaters. Sci of the Tot Environ 2008; 407 (1):154- 164.
Ahlqwist M, Bengtsson C, Lapidus L, Gergdahl lA, Schutz A. Serum mercury concentration in relation to survival, symptoms, and diseases: results from the prospective population study of women in Gothenburg, Sweden. Acta Odontol Scand 1999; 57:168-174.
Beehler G, McGuinness BM, Vena JE. Polluted fish, sources of knowledge, and the perception of risk: Contextualizing African American anglers' sport fishing practices. Human Organ 2001; 60: 288-297.
Birgisdottir, BE, Kiely M, Martinez JA, Thorsdottir I. Validity of a food frequency questionnaire to assess intake offish in adults in three European countries. Food Control2008; 19: 648-653.
Blom G. Statistical Estimates and Transformed Beta Variables. New York: John Wiley & Sons, Inc; 1958.
Burger J, Stephens WL, BoringS, Kuklinski M, Gibbons JW, Gochfeld M. Factors in exposure assessment: ethnic and socioeconomic difference in fishing and consumption offish caught along the Savannah River Risk Anal1999; 19: 427-438.
Burger J, Gaines, KF, Gochfeld M. Ethnic differences in risk from mercury among Savannah River fisherman. Risk Anal2001; 21: 533-544.
Burger J, Dixon C, Boring CS. Effect of Deep-Frying fish on Risk from Mercury. J Toxicol. Environ. Health 2003; 66:817-828.
Burger J, Gochfeld M. Mercury in Canned Tuna: Temporal Trends. Environ Res. 2004; 96:239-249.
Castoldi AF, Johansson C, Onishchenko N, Coccini T, Roda E, Vahter M, Ceccatelli S, Manzo L. Human developmental neurotoxicity of methylmercury: impact of variables and risk modifiers. Regul Toxicol Pharmacol 2008; 51: 201-214.
Cecelski OS. The Waterman's song: Slavery and freedom in maritime North Carolina. University ofNorth Carolina Press, Chapel Hill, NC; 2001.

73
Derrick CG, Miller JSA, Andrews JM. A fish consumption study of anglers in an at-risk community: A community- based participatory approach to risk reduction. Public Health Nursing. 2008; 25 (4): 312-318.
Duncan M. Fish consumption survey of the Squamish Indian Tribe of the Port Madison Indian Reservation, Puget Sound Region. The Suquamish Tribe, Port Madison Indian Reservation, fisheries department, Suquamish, W A, USA. 2000.
Gibson Joshua C. McClafferty JA. Identifying populations at risk for consuming contaminated fish in three regions of concern. Chesapeake Bay Program and Conservation Management Institute. CMI-HDD-05-01, Blacksburg, VA. 2005
Guallar E, Sanz-Gallardo MI, van't Veer P, Bode P, Aro A, Gomez-Aracena J, Kark JD, Riemersma RA, Martin-Moreno JM, Kok FJ. Mercury, fish oils, and the risk of myocardial infarction, in New Engl J Med 2002; 347 (22): 1747-54.
Hallgren CG, Hallmans G, Jansson JH, Marklund SL, Huhtasaari F, Schu""tz A, Stro··mberg U, Vessby B, Skerfving S. Markers ofhigh fish intake are associated with decreased risk of a first myocardial infarction. Br J Nutr 2001; 86:397-404.
Holloman EL, Newman MC. A community-based assessment offish consumption along the lower James River, Virginia, USA: Potential sources of dietary mercury exposure. Environ. Res 2010; 110: 213-219.
Judd N, Griffith W, Faustman E. Consideration of cultural and lifestyle factors in defining susceptible populations for environmental disease. Toxicology 2004; 198:121-133.
Lincoln AR, Shine JP, Chesney EJ, Vorhees DJ, Grandjean P, Senn DB. Fish consumption and mercury exposure among Louisiana recreational anglers. Environ Health Perspect. 2011; 119 (2): 245 - 251.
Lowenstein JH, Burger J, Jeitner CW, Amato G, Kolokotronis SO, Gochfeld M. DNA barcodes reveal species-specific mercury levels in tuna sushi that pose a health risk to consumers. Bioi Lett 2010; 6(5): 692-695.
Mahaffey K, Clickner R, Boduro C. Blood organic mercury and dietary mercury intake: National health and nutrition examination survey 1999 -2002. Environ Health Perspect 2004; 112: 562-570.
Mahaffey KR, Clicker RP, Jeffries RA. Adult women's blood mercury concentrations vary regionally in the United States: Associations with patterns of fish consumption (NHANES 1999- 2004). Environ Health Perspect. 2009; 117(1 ): 47 -53.
Marien K, Patrick GM. Exposure analysis of five fish consuming populations for overexposure to methylmerucry. J Expo Anal Environ Epidemiol2001; 11(3):193-206.
74
Masson LF, McNeil G, Tomany JO, Simpson JA, Peace HS, Wei L, Grubb DA, BoltonSmith C. Statistical approaches for assessing the relative validity of a foodfrequency questionnaire: use of correlation coefficients and the kappa statistic. Public Health Nutr 2003; 6(3): 313-321.
McGraw Sr JE, Waller DP. Fish ingestion and congener specific polychlorinated biphenyl and p,p'-dichlorodiphenyldichloroethylene serum concentrations in a great lakes cohort of pregnant African American women. Environ Int 2009; 35: 557-565.
Mckelvey W, Chang M, Amason J, Jeffery N, Kricheff J, Kass D. Mercury and polychlorinated biphenyls in Asian market fish: A response to results from mercury biomonitoring in New York City. Environ Res 2010; 110 (7): 650-657.
Mina K, Fritschi L, Knuiman M. A valid semiquantitative food frequency questionnaire to measure fish consumption. Eur J Clin Nutri 2007; 61: 1023-1031.
Morgan J, Berry MR, Graves RL Effects of commonly used cooking practices on total mercury concentration in fish and their impact on exposure assessments. J Expos Anal Environ Epidemiol1997; 7:119-134.
Mozaffarian, D. Fish, Mercury, Selenium and Cardiovascular Risk: Current Evidence and Unanswered Questions. Int. J. Environ. Res. Public Health 2009; 6: 1894-1916.
Mozaffarian D, ShiP, Morris JS, et al. Mercury exposure and risk of cardiovascular disease in two U.S. cohorts. N Engl J Med 2011; 364:1116-25.
National Environmental Justice Advisory Council (NEJAC). Fish Consumption and Environmental Justice. 2002
National Research Council (NRC). Toxicological Effects ofMethylmercury. Washington, DC: National Academy Press; 2000.
Nobmann ED, Byers T, Lanier AP, Hankin JH, Jackson MY. The diet of Alaska Native adults: 1987 -1988. A J Clin Nutr 1992; 55: 1024-1032.
Peles JD, Glenn TC, Brant HA, Wall AK, Jagoe CH. Mercury concentration in largemouth bass (Micropterus Salmoides) from five South Carolina reservoirs. Water Air Soil Poll. 2006; 173: 151- 162.
75
Roman HA, Walsh TL, Coull BA, et al. Evaluation of the cardiovascular effects of methylmercury exposures: current evidence supports development of a doseresponse function for regulatory benefits analysis. Environ Health Perspect 2011; 119: 607-614.
Salonen JT, Seppanen K, Nyyssonen K, Korpela H, Kauhanen J, Kantola M, Tuomilehto J, Esterbauer H, Tatzber F, Salonen R. Intake of mercury from fish, lipid peroxidation, and the risk of myocardial infarction and coronary, cardiovascular, and any death in Eastern Finnish men. Circulation 1995; 91(3):645-655.
Sechena R, Nakano C, Liao S, Polissar N, Lorenzana R, Truong S, Fenske R. Asian and Pacific Islander fish consumption study. Seattle, WA: EPA Office of Environmental Assessment; 1999.
Sechena R, Liao S, Lorenzana R, Nakano C, Polissar N, Fenske R. Asian American and Pacific Islander seafood consumption-a community-based study in King County, Washington. J Expo Anal Environ Epidemiol2003; 13(4):256-266.
Shatenstein B, Kosatsky T, Nadon S, Lussier-Cacan S, Weber JP. Reliability and relative validity of fish consumption data obtained in an exposure assessment study among Montreal-Area sportfishers. Environ Res Section A. 1999; 80: S71-S86.
Shilling FM, SommerS, Leonelli L, Shimoum D. Community-based strategies to reduce mercury exposure in Delta fishing communities. Report for the California Department of Public Health and the Central Valley Regional Water Quality Control Board. 2008.
Shilling F, White A, Lippert L, Lubell M. Contaminated Fish Consumption in California's Central Valley Delta. Environ Res 2010; 110: 334- 344
Silver E, Kaslow J, Lee D, LeeS, Tan ML, WeisE, Ujihara A. Fish consumption and advisory awareness among low-income women in California's Sacramento-San Joaquin Delta. Environ Res 2007; 104; 410-419.
Sunderland EM. Mercury exposure from domestic and imported estuarine and marine fish in the United States fish market, Environ Health Perspect 2007; 115(2):235-242.
Toy KA, Polissar NL, Liao S, Mittelstaedt GD. A fish consumption study of the Tulalip and Squaxin Island tribes of the Puget Sound region. Tulalip Tribes, Department of Environment, Marysville, WA; 1996.
United States Environmental Protection Agency (US EPA). Guidance for Assessing Chemical Contaminant Data for use in Fish Advisories. Volume I: Fish Sampling and Analysis. EPA-823/B-00-007 Washington, DC: Office of Water; 2000a

76
United States Environmental Protection Agency (US EPA). Guidance for Assessing Chemical Contaminant Data for use in Fish Advisories. Volume II: Risk Assessment and Fish Consumption Limits. EPA-823/B-00-008 Washington, DC: Office of Water; 2000b.
United States Environmental Protection Agency (US EPA): Integrated Risk Information System (IRIS). Methylmercury; 2001a. Available from URL: http://www.epa.gov/iris/subst/0073.htm [Accessed: 111112005].
United States Environmental Protection Agency (US EPA). Water Quality Criterion for the Protection of Human Health: Methylmercury. EPA-823/R-01-001 Washington D.C: Office of Water; 2001 b.
US EPA/FDA. What You Need to Know About Mercury in Fish and Shellfish. EPA-823-R-04-005. [Online]; 2004; Available: http://www.epa.gov/waterscience/fishadvice/advice/html or http://www .cfsan. fda. gov/-dms/admehg3 .html [Accessed: 2/18/2011].
United States Food and Drug Administration (US FDA). Mercury Concentrations in Fish: FDA Monitoring Program (1990-2009). Washington, DC: Food and Drug Administration; 2011a;Available: http://www.fda.gov/Food/FoodSafety/ProductSpecificinfom1ation/Fish!FoodbornePathogensCon1aminants/Methylmercury/ucm 191 007.htm [Accessed: 2/23/2011].
United States Food and Drug Administration (US FDA). Mercury levels in commercial fish and shellfish. Washington, DC: Food and Drug Administration (1990-2009); 2011 b; Available: http://www.fda.gov/Food/FoodSafety/ProductSpecificlnfonnation/Fish/FoodbornePathogensContaminants/Methylmercury/ucm 115644.htm [Accessed: 2/23/2011].
Virginia Department of Environmental Quality (VA DEQ). Fish tissue and sediment monitoring program; 2008. Available from URL: www.deg.state.va.us/fishtissuelfishtissue.html [Accessed: 1/31/2011].
Virtanen JK, Voutilainen S, Rissanen TH, et al. Mercury, fish oils, and risk of acute coronary events and cardiovascular disease, coronary heart disease, and all-cause mortality in men in eastern Finland. Arterioscler Thromb Vase Biol2005; 25: 228-33.
Weintraub M, Birnbaum LS. Catfish consumption as a contributor to elevated PCB levels in a non-Hispanic black subpopulation. Environ Res. 2008; 107: 412-417.
Y oshizawa K, Rimm EB, Morris JS, Spate VL, Chung-cheng H, Spiegelman D, Stampfer MJ, Willett MD. Mercury and the risk of coronary heart disease in men. N Engl J Med 2002; 347:1755-1760.

TABLE 1.
List of commonly consumed fish items (finfish and shellfish) and the frequency of women consuming the items. Items with an asterisk(*) refer to the fish items selected for total mercury analysis (24 out of39 items).
77

78
Common Names of Fish Items Number of Women Consuming Consumed Items (n= 95)
1. Whiting* 79 2. Shrimp* 77 3. Tuna* 77 4. Snow Crab Legs* 70 5. Blue Crab* 65 6. Croaker* 61 7. Scallops* 43 8. Spot* 40 9. Mackerel Cake* 35 10. Salmon Cake* 35 11. Tilapia* 25 12. Crab Cake* 21 13. Trout* 19 14. Flounder* 18 15. Oysters* 18 16. Catfish* 16 17. Clam* 16 18. Sardines* 12 19. Lobster* 11 20. Mussels 7 21. Black Bass* 5 22. Butterfish* 4 23. Salmon Steak 4 24. Perch* 3 25. Striped Bass* 3 26. Trout (Sea)* 3 2 7. Dungeness Crab 2 28. King fish 2 29. Monk Fish 2 30. Porgy* 2 31. Bluefish 1 32. Clam Strips 1 33. Crab meat 1 34. Fish Sticks 1 35. Largemouth Bass 1 36. Mackerel Salad 1 3 7. Puppy Drum 1 38. Shad 1 39. Sushi 1
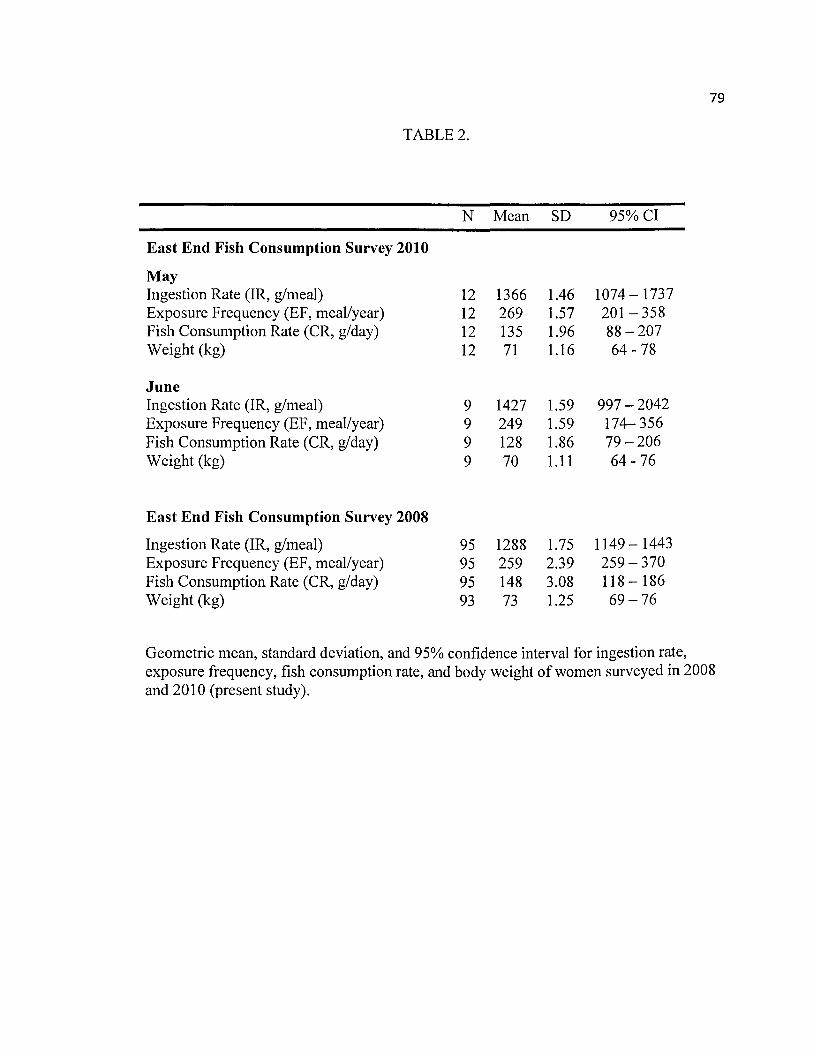
TABLE 2.
East End Fish Consumption Survey 2010
May Ingestion Rate (IR, g/meal) Exposure Frequency (EF, meal/year) Fish Consumption Rate (CR, g/day) Weight (kg)
June Ingestion Rate (IR, g/meal) Exposure Frequency (EF, meal/year) Fish Consumption Rate (CR, g/day) Weight (kg)
East End Fish Consumption Survey 2008
Ingestion Rate (IR, g/meal) Exposure Frequency (EF, meal/year) Fish Consumption Rate (CR, g/day) Weight (kg)
N
12 12 12 12
9 9 9 9
95 95 95 93
Mean SD
1366 1.46 269 1.57 135 1.96 71 1.16
1427 1.59 249 1.59 128 1.86 70 1.11
1288 1.75 259 2.39 148 3.08 73 1.25
95%CI
1074- 1737 201-358 88-207 64-78
997-2042 174-356 79-206 64-76
1149- 1443 259-370 118- 186 69-76
79
Geometric mean, standard deviation, and 95% confidence interval for ingestion rate, exposure frequency, fish consumption rate, and body weight of women surveyed in 2008 and 2010 (present study).
80
TABLE 3.
Arithmetic mean(± standard deviation) and median mercury concentrations (mg/kg) and for unprepared (raw/ straight out of the can) and prepared (fried or steamed) fish items. (*)refers to items with a median difference between unprepared and prepared that was significantly greater than zero.

81
Unprepared Prepared
Fish Items (finfish & shellfish) N Mean(± SD) Median N Mean(+/- SD) Median
Whiting* 10 0.046 (± 0.029) 0.034 10 0.066 (± 0.038) 0.054
Shrimp* 9 0.021 (± 0.014) 0.016 10 0.023 (± 0.0 17) 0.018
Canned Tuna (white) 5 0.327 (± 0.072) 0.361
Canned Tuna (light) 5 0.056 (± 0.052) 0.035
Snow Crab Legs 10 0.103 (± 0.056) 0.077 10 0.114 (± 0.057) 0.086
Blue Crab* 9 0.053 (± 0.021) 0.053 10 0.057 (± 0.022) 0.057
Croaker* 10 0.079 (± 0.029) 0.080 10 0.127 (± 0.059) 0.134
Scallops* 10 0.012 (± 0.005) 0.013 10 O.oi8 (± 0.009) 0.020
Spot 10 0.021 (± 0.013) 0.014 10 0.022 (± 0.011) 0.018
Mackerel Cake 10 0.043 (± 0.0 II) 0.041 10 0.047 (± 0.010) 0.046
Salmon Cake* 10 0.022 (± 0.008) 0.019 10 0.027 (± 0.011) O.Q25
Tilapia* 10 0.012 (± 0.014) 0.002 10 0.012 (± 0.014) 0.002
Crab Cake* 10 0.033 (± 0.025) 0.020 10 0.045 (± 0.025) O.Q35
Trout (Sea)* 10 0.119 (± 0.103) 0.088 10 0.134 (± 0.111) 0.108
Flounder* 10 0.069 (± 0.048) 0.056 10 0.081 (± 0.051) 0.071
Oysters 10 0.025 (± 0.014) 0.021
Catfish* 10 0.015 (± 0.021) 0.006 10 0.020 (± 0.029) 0.006
Clam 10 0.001 (± 0.004) 0.009
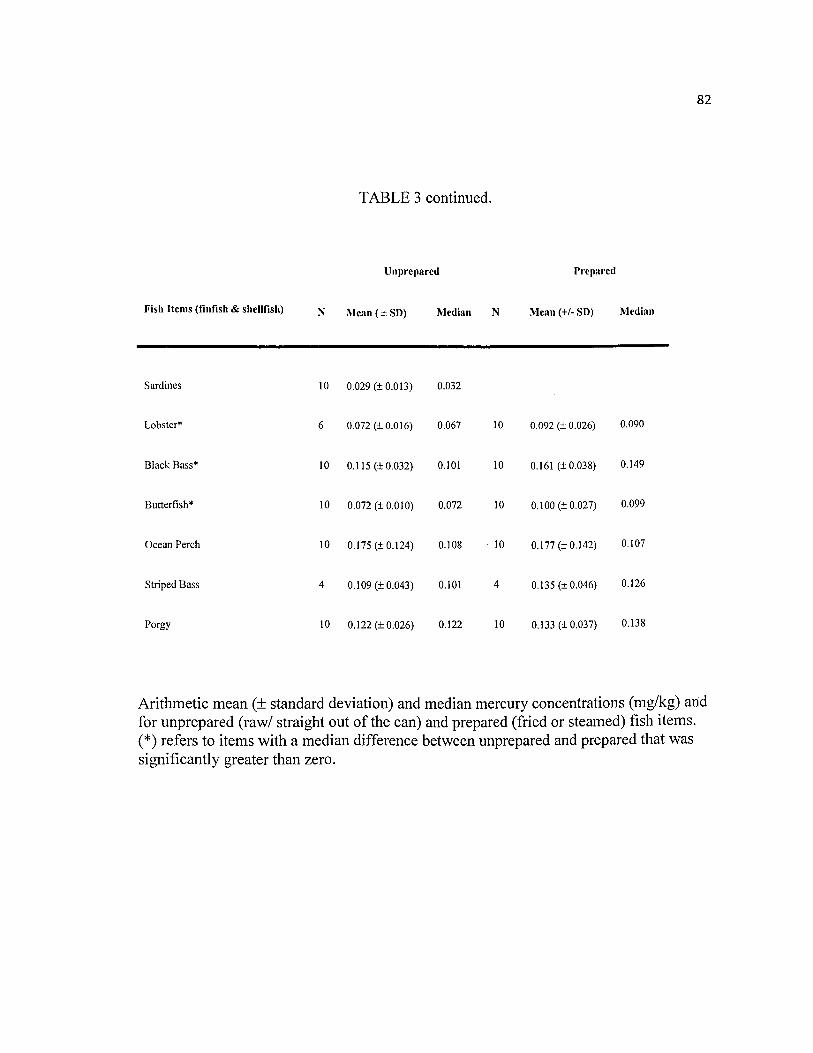
82
TABLE 3 continued.
Unprepared Prepared
Fish Items (finfish & shellfish) N Mean(± SD) Median N Mean (+/- SD) Median
Sardines 10 0.029 (± 0.013) 0.032
Lobster* 6 0.072 (± 0.0 16) 0.067 10 0.092 (± 0.026) 0.090
Black Bass* 10 0.115 (± 0.032) 0.101 10 0.161 (± 0.038) 0.149
Butterfish* 10 0.072 (± 0.010) 0.072 10 0.100 (± 0.027) 0.099
Ocean Perch 10 0.175 (± 0.124) 0.108 . 10 0.177 (± 0.142) 0.107
Striped Bass 4 0.109 (± 0.043) 0.101 4 0.135 (± 0.046) 0.126
Porgy 10 0.122 (± 0.026) 0.122 10 0.133 (± 0.037) 0.138
Arithmetic mean (± standard deviation) and median mercury concentrations (mg/kg) an:d for unprepared (raw/ straight out of the can) and prepared (fried or steamed) fish items. (*)refers to items with a median difference between unprepared and prepared that was significantly greater than zero.

83
TABLE4.
Species Mean (mg/kg) Reference
Mussels 0.080 Sunderland 2007 Salmon Steak 0.040 Sunderland 2007 Trout (Sea) a 0.140 Current Study Dungeness Crab 0.260 Sunderland 2007 King fish b 0.150 Sunderland 2007 Monk Fish 0.180 Sunderland 2007 Bluefish 0.340 Sunderland 2007 Clam Strips c 0.010 Current Study Crab meat 0.060 Sunderland 2007 Fish Sticks d 0.100 Sunderland 2007 Largemouth Bass 0.690 Peles et al. 2006 Mackerel Salad e 0.047 Current Study Puppy Drum1 0.020 VADEQ2008 Shad 0.020 Sunderland 2007 Sushi g 0.474 Lowenstein et al. 201 0
List of mercury concentrations (wet weight) used in calculation of daily mercury intake for species not collected for mercury analysis. a Used mercury concentration for sea trout fi'om current study. b Used mercury concentration for king mackerel ji-om referenced study. c Used mercury concentration for clam ji-om current study. d Used mercury concentration for codfi·om referenced study. e Used mercury concentration for mackerel fi·om current study. fUsed mercury concentration for red drum (Chesapeake Bay Small Coastal Drainage- Lower Chesapeake Bay) fi'om referenced study. g Used mercury concentration for yellow fin tunaji-om referenced study.

84
FIGURE 1.
A B
09 09
0.8 0.8
0.7 0.7
06 0.6 c c 0 0.5 0
0.5 :e :e 0
0.4 0 0. 0. 0.4 2 2 0.. 03 0.. 0.3
--2008 (n = 95)
---2010 (n: 12)
0.2 0.2 01
01 0 • t 11 I • I •
0 0 20 40 60 eo 100 120 140 0 1000 2000 3000 4000 5000
Weight(kg) Ingestion Rate (glmeol)
c D
0.9 0.9
0.8 08
07 0.7
06 c 0.6
c 0
0 :e 0.5 :e 0.5 0 Q.
8. 0.4 -2008 (n: 95) 2 0.4 2 0.. 0.. 0.3 ---2010 (n: 12)
0.3
-2008 (n: 95)
---2010 (n: 121
02 02
0.1 0.1
0 l·-·'t-"'1 ·--··t ' l···l-·1""'" 1 ·-1- 0 0 500 1000 1500 2000 0
, 1,, 1,,,, f p; -1! j I Itt t • t' • I • • • • I' t 't I
200 400 600 800 1000 1200 1400
Exposure Frequency (meal/year) Fish Consumption Rate (glday)
Comparison of fish consumption patterns estimated using data collected in 2008 and 2010: A) Weight (wtg, kg), B) Ingestion rate (IR, g/meal). C) Exposure Frequency (EF, meal/year), and D) Fish Consumption rate (CR, g/day).
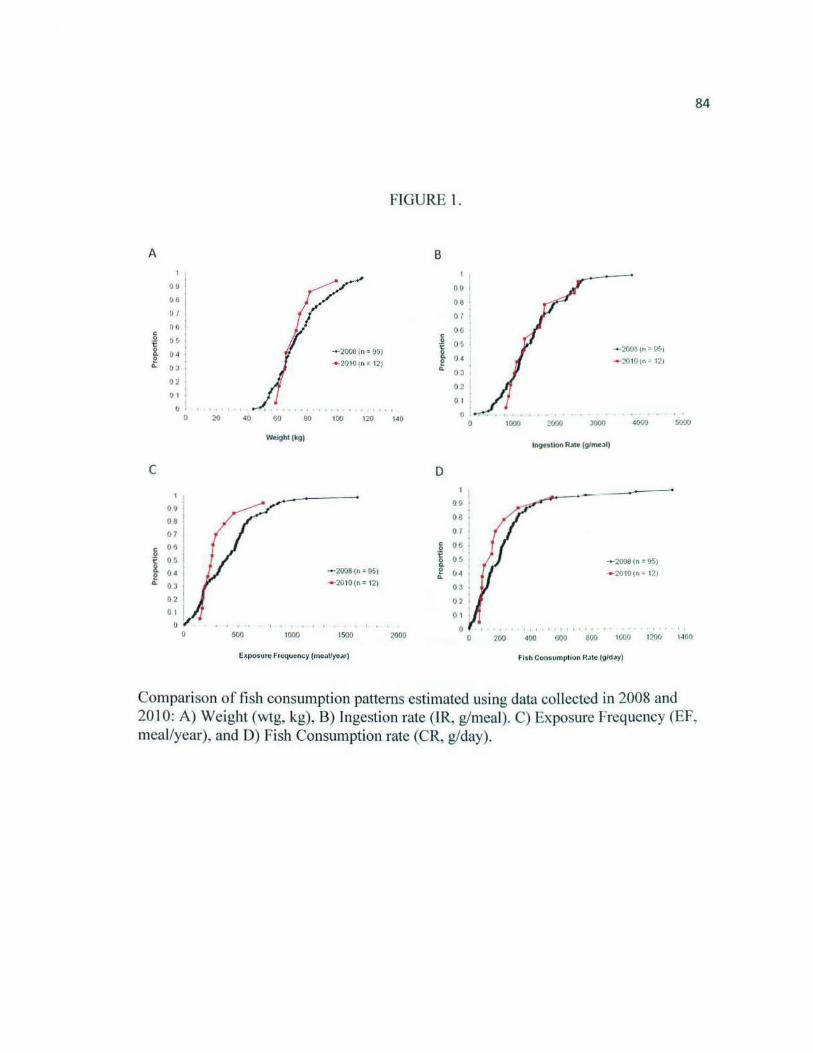
A
QU
08
U I
06
J ~: 03
c
02
0 1
0 0
09 oe I
07
j ~: i 04 £ o3 I
02
0 1
0 0
20
FIGURE I.
B
09
08
07
02
40 80 100 1:.'0 140
0 1
II
Weigh!(~g)
- 2008 (n • 95) - 2010 (n: 12)
500 1000 1500
Exposure Frequ~ncy (mei'IIJyear)
2000
D
09
08
01
c OG
1 0 I
- 2008to = 951
- :m10•n = 12)
0 1000 3000 4000 5000
1"9"1ion R••• (g/meol)
200 400 600 800 1000 1200 1400
Fish Conoump11on Ra1c (gldoy)
Comparison of fish consumption patterns estimated using data co llected in 2008 and
84
20 I 0: A) Weight (wtg, kg), B) Ingestion rate (IR, g/meal). C) Exposure Frequency (EF, meal/year), and D) Fish Consumption rate (CR, g/day).
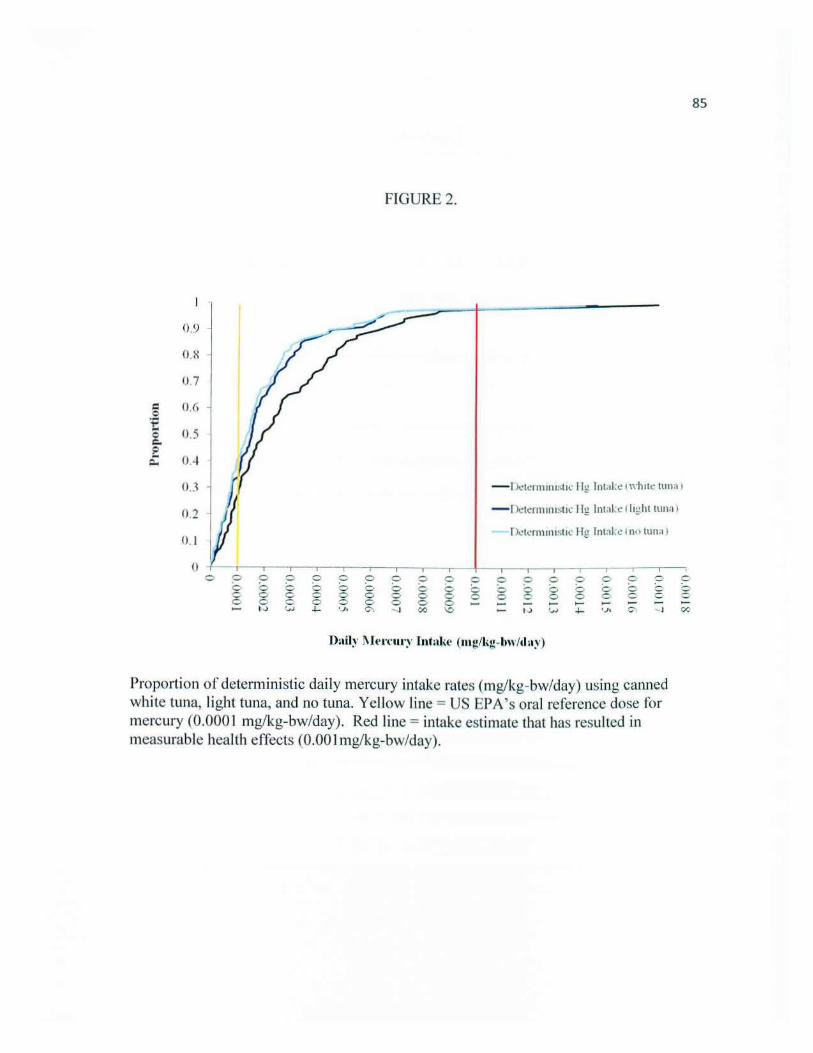
FIGURE 2.
0.9
O.X
0.7
= (),() 0 .,... t:
0.5 0 ,;:;:.
e 0.-1 c..
O.J - I ~termnu~••~ IIJ; Jntal:t' 1 whllt' lima 1
0.2 -r~termnltst•~· Jig lnt••k<' r light tuna l
0. I D~l<'rmu11sllc Hg lnt:ll:~ I no lunn l
() I
0 0 0 0 0 0 ~ 0 0 0 0 0 0 0 ~ 0 0 c 6 6 6 0 0 0 0 0 0 0 c g 0 0 c ~ c c 0 S2 0 0 0 0 0 0 c 0 0 0 0 c c w 0 0 c 0 c 0 - -1...) +- '.Jo 0\ ..... , 00 \0 I.J \,d -1- '.I• C'· -...)
Dail~· l\It•J'<' IIl'Y lntal.:t• (m gll•l!-bw/clay)
Proportion of deterministic daily mercury intake rates (mg/kg-bw/day) using canned white tuna, light tuna, and no tuna. Yellow line = US EPA's oral reference dose for mercury (0.0001 mg/kg-bw/day). Red line = intake estimate that has resulted in measurable health effects (0.001 mg/kg-bw/day).
0 0 0
00
85

CHAPTER3
A Probabilistic Characterization of Dietary Mercury Exposure in an Urban Coastal
Community
86

87
ABSTRACT
Through collaborative partnerships established between current researchers and The Moton
Community House, probabilistic estimations of dietary mercury exposure for African American
women (ages 16-49) from the Southeast Community ofNewport News, Virginia, USA were
generated and compared to previously published point estimates for the same population. Four
different consumption scenarios were assumed, representing 1) no, 2) light, 3) both light and
white, and 4) white tuna consumption. The probabilistic models generated lower dietary mercury
intake rates than the point estimations, under these consumption scenarios. Arithmetic mean
daily mercury intake rates (95% CI) for the probabilistic models were 0.149 (±0.003), 0.148
(±0.003), 0.172 (±0.004), and 0.202 (±0.004) ug/kg-bw/day, respectively for no, light, both, and
white tuna consumption. Median daily mercury intake rates for the same consumption scenarios
were 0.1 06, 0.107, 0.120, and 0.143 ug/kg-bw/day respectively. Under all consumption
scenarios, an African American woman in the Southeast Community with mean or median dietary
mercury intake could experience adverse health effects. For all consumption scenarios, more
than half of African American women in the Southeast Community had exposures that exceeded
US EPA's oral RID for mercury (0.10 ug/kg-bw/day). The percentages of estimates that
exceeded an oral RID for mercury that results in measurable health effects (1.00 ug/kg-bw/day)
ranged between 0.22- 0.71% for all four consumption scenarios. Reducing the amount of fish
consumed in probabilistic models resulted in lower dietary mercury exposures for each
consumption scenario. At a rate that was a quarter of what was normally consumed, the
percentages of exposures that exceeded the US EPA's oral RID for mercury were 14%,
13%,18%, and 25% respectively for no, light, both, and white tuna consumption

88
1. INTRODUCTION
It is well established that ethnic minority and low-income communities
experience higher mean exposures to contaminated fish and shellfish (further referred to
as fish) than general US populations (Toy et al., 1996; Burger et al., 1999; Sechena et al.,
1999; Burger et al., 2001; National Environmental Justice Advisory Council (NEJAC),
2002; Gibson and McClafferty, 2005; Derrick et al., 2008; Shilling et al., 2008; Mahaffey
et al., 2009a; McGraw and Waller, 2009; Holloman and Newman, 2010; Shilling et al.,
201 0). Such disparities have been linked to the consumption of more fish annually and
larger fish servings (Burger et al., 1999, 2001; Sechena et al., 1999; NEJAC, 2002;
Corbum, 2002; Gibson and McClafferty, 2005; Holloman and Newman, 2010). Theses
disparities have also been linked to cultural and lifestyle factors (Beehler et al., 2001;
Cecelski, 2001; NEJAC, 2002; Judd et al., 2004; Weintraub and Birnbaum, 2008) such as
subsistence fishing (Duncan, 2000; Sechena et al., 1999; Nobmann et al., 1992; Marien
and Patrick, 2001) or subsistent fish consumption (Holloman and Newman, 2010, in
press). In the US, one subpopulation that continues to experience higher than average
exposures to contaminated fish is African Americans (Burger et al. 1999, 2001; CDC
2001; Corbum, 2002; Schober et al., 2003; CDC, 2005; Gibson and McClafferty, 2005,
Derrick et al., 2008; Shilling et al., 2008; McGraw and Waller, 2009; Holloman and
Newman, 2010, in press; Shilling et al., 201 0).
The consumption of fish is the most common exposure pathway for human
mercury exposure (NRC, 2000). Due to the higher consumption of fish, African
Americans may be more at risk of adverse health effects associated with dietary mercury
exposure than the general US population. Exposure to mercury can cause numerous

89
health effects although, human carcinogenicity remains inconclusive, effects on human
immune system are poorly understood, and reproductive effects have not been fully
evaluated (NRC, 2000). Some researchers suggest that the cardiovascular system is a
likely site of mercury toxicity (Salonen et al., 1995; S0rensen et al., 1999; NRC, 2000;
Guallar et al., 2002) but others have found no associations (Ahlqwist et al., 1999;
Hallgren et al., 2001; Y oshizawa et al., 2002). On the other hand, neurodevelopmental
effects caused by mercury exposure have been well established (Harada, 1995; Marsh et
al., 1987; Myers et al., 1995a-c; Grandjean et al., 1995, 1997,1999; NCR, 2000; US EPA,
2001b; Castaldi et al., 2008). To protect humans against chronic and developmental
mercury toxicity, US EPA developed an oral reference dose (RID) ofO.lO ug/kg-bw/day,
an estimate of a daily oral exposure that is likely to be without an appreciable risk of
adverse health effects over a lifetime (US EPA, 2001).
Dietary mercury exposure can be estimated using either bio-markers (e.g. blood
or hair) or exposure equations. Bio-markers provide a more accurate estimate of mercury
exposure but often require more resources to generate such estimates. For African
Americans, mercury concentrations in the blood and hair have been reported higher than
other populations (CDC, 2001; Schober et al., 2003; CDC, 2005; Mahaffey et al., 2009a).
On the other hand, the quantification of mercury exposure using exposure equations
involves estimating contaminant concentrations and calculating contaminant intake rates
(US EPA, 1999), and does not require the collection of human biological materials.
Traditionally with exposure equations, a point estimate approach is used to calculate
intake rates in which single values, such as a mean, characterizes variables in the
exposure equations (US EPA, 2001 c). The use of such an approach provides a limited
understanding of variability and does not fully define exposure (US EPA, 2001 c).
90
In communities disproportionately impacted by the consumption of contaminated
fish, employing a point estimate approach potentially masks valuable information
necessary to insightfully characterize exposure. Instead, the use of a probabilistic
approach highlights information about variation in contaminant exposure in addition to
information about uncertainty in the exposure estimate. Specifically, probability
distributions for one or more variables are used in an exposure equation in order to
quantitatively characterize the variability and/or uncertainty in the exposure estimate (US
EPA, 2001c). One of the most common probabilistic methods, Monte Carlo simulation,
combines probability distributions of key variables in an exposure equation along with
the remaining variables to generate probability distributions of exposures (US EPA,
2001c).
Through collaborative partnerships established between current researchers and a
local community center (The Moton Community House), community-based participatory
research (CBPR) methodology was used to explore fish consumption and dietary mercury
exposure for African American women of childbearing age (ages 16-49 yrs) residing in
the Southeast Community of Newport News, Virginia, USA (Holloman and Newman,
2010, in press). Results of this collaborative effort suggested that women in this urban
costal community consumed fish at a subsistence rate and that the majority of the items
consumed came from commercial markets (Holloman and Newman, 2010, in press). In
addition, distributions of point estimates revealed that more than half of the ninety-three
women surveyed exceeded US EPA's oral RID for mercury (Holloman and Newman, in

press) and that such exceedances were considerably greater than equivalent blood
mercury exceedances for general US women (ages 16-49 yrs, 4.7 %; Mahaffey et al.,
2009a) and for African American women ( 4.1 %; Mahaffey et al., 2009a).
91
The main goal of this work was to better characterize dietary mercury exposure
by probabilistically modeling mercury intake for African American women (ages 16-49
yrs) residing in the Southeast Community ofNewport News, Virginia. Consumption
scenarios aimed at reducing dietary mercury exposure were also explored. Ultimately,
through collaborative efforts and meaningful partnerships, it is our goal to facilitate the
community's development of their own strategies for defining and managing health risks
associated with dietary mercury exposure.
2. MATERIALS AND METHODS
2.1. Quantification of dietary mercury exposure
2.1.1. Determination of fish consumption patterns and mercury concentrations
To quantify mercury exposure, the magnitude, frequency and duration offish
consumption were determined for African American women (age 16 - 49 yrs) residing in
the Southeast Community ofNewport News, VA. A community-based fish consumption
survey (East End Fish Consumption Survey) was developed to estimate the ingestion rate
(IR, g/meal), exposure frequency (EF, meals/year), and consumption rate (CR, g/day) of
individual fish items consumed by, and the weight (Wgt, kg) oflow-income African
American women residing in the Southeast Community. The survey was administered
during April and May 2008 (Holloman and Newman, 2010) and estimates ofiR, EF, CR,
and Wgt were assessed for reproducibility, reliability, and consistency in 2010 (Holloman

92
and Newman, in press). Total mercury concentrations (mg/kg) were detennined for the
24 most prominent fish items listed (out of a total of 3 9 items) by the 95 women surveyed
in 2008 (Holloman and Newman, 2010). Details of sample preparation, analysis, and
quality control and quality assurance for determining mercury concentrations were
reported in Holloman and Newman (in press)
2.1. 2. Point and probabilistic parameter estimations
Distributions of point estimated daily mercury intakes (mg/kg-bw/day) were
generated for African American women using consumption data generated from women
surveyed in 2008 (Holloman and Newman, 2010) along with mercury data generated
from Holloman and Newman (in press), peer reviewed literature (Peles et al., 2006;
Sunderland, 2007; Lowenstein et al., 2010), and federal databases (US FDA, 2009a,
2009b ). Because the type of canned tuna was not defined in the survey and differences
are present between canned light and white tuna mercury concentrations, three different
distributions of daily mercury intake were generated that represented the consumption of
no tuna, canned light tuna, and canned white tuna. Details of the procedures used to
generate point estimates were previously published by Holloman and Newman (in press).
Distributions of probabilistic mercury exposures were generated for the same
population, using the same consumption data that generated the point estimates.
Forecasting software Oracle Crystal Ball<D 2010 (Redwood Shores, CA) was used to
simulate fish consumption patterns and estimate daily mercury intake. For our model,
five variables were used to determine daily mercury intake: 1) fish consumption rate (CR,
g/day), 2) body weight (Wgt, kg), 3) ingestion rate (IR, g/meal), 4) exposure frequency
(EF, meals/day), and 5) mercury concentrations (mg/kg), used to determine the amount of
93
mercury consumed (mg). Similar to point estimates, consumption scenarios representing
canned tuna consumption were generated; however, four scenarios were created: 1) no
tuna, 2) only light tuna, 3) both white and light tuna (50/50 chance), and 4) only white
tuna.
2.1.3. Monte Carlo Simulations
To begin simulations, a fish consumption rate was selected from a custom
probability distribution created using the 95 fish consumption rates generated in 2008
(Holloman and Newman, 2010). Once selected, this rate served as the maximum
consumption rate for that simulation trial. A total of 10,000 trials were used for each
consumption scenario. A random number generator was used to select a fish or shellfish
from a list created from cumulative probabilities of fish and shellfish consumed by
women surveyed in 2008 (Holloman and Newman, 2010). Based on fish consumption
data collected in 2008 (Holloman and Newman, 201 0), separate custom probability
distributions or point estimates were produced for ingestion rate (IR) and exposure
frequency (EF). For IR and EF, custom distributions were created only for fish items in
which two or more women stated consuming the item. Point estimates were used for the
other remaining fish items in which only one woman stated consuming it.
Once a fish item was selected, IR (kg/meal) was multiplied by EF (meal/day) to
obtain a consumption rate (CR, kg/day). Consumption rate was then multiplied by
mercury concentration (mg/kg) to obtain an amount of mercury consumed (mg/day). For
the variable mercury concentration (mg/kg), custom probability distributions were
produced for all fish and shellfish previously analyzed for mercury (Holloman and
Newman, in press). Point estimates were used for the other remaining mercury
94
concentrations which came from the peer reviewed literature (Peles et al., 2006;
Sunderland, 2007; Lowenstein et al., 2010) and federal databases (US FDA, 2009a,
2009b). For each trial, up to 20 fish items were randomly selected, and the corresponding
CR and amount of mercury consumed were summed until the summed CR was equal or
greater than the maximum consumption rate allowed for that trial. If the summed CR
was greater than the maximum amount, the difference was determined and used to adjust
the summed amount of mercury consumed.
The summed amount of consumed mercury was used as the total amount of
mercury ingested daily in the model. For each consumption scenario, forecasts were
generated, the amount of mercury consumed per day was normalized to kg of body
weight (mg/kg-bw/day), and distributions of mercury exposures were produced. The
body weight (kg) used to standardize the amount of mercury consumed was selected from
a custom probability distribution based on data collected in 2008 (Holloman and
Newman, 2010). Data obtained from all Monte Carlo simulations were used in
subsequent analysis.
2.1. 4. Statistical Analysis
For point estimates, mercury intakes were ranked and the proportions transformed
using a Blom transformation (Blom, 1958) in order to generate cumulative proportions of
daily mercury intake (mg/kg-bw/day). For probabilistic estimates, percentiles generated
from Monte Carlo simulations were ranked and the proportions transformed in the same
manner to generate cumulative proportions. Confidence intervals (95%) were also
generated for cumulative proportions of daily mercury intake. The formula for the
95
P+Z Jp(I- p) - a/2
normal approximation interval ( n ) was used where p was the
proportion for the rank, Z is 1.96, and n was the sample size (n = 93 and 100 for point
and probabilistic estimates, respectively). Cumulative proportions and corresponding
confidence intervals were plotted and compared for both point and probabilistic intake
estimates. Plotted distributions were also compared to the US EPA's oral reference dose
(RID) for mercury (0.1 0 ug/kg-bw/day) and an oral RID that has resulted in measurable
health effects (1.0 ug/kg-bw/day).
2. 2. Characterization of dietary exposure and consumption scenarios aimed at reducing exposure
Probabilistic estimates were used in characterizing both individual and population
mercury exposures for African American women in the Southeast Community. Mean
and median estimates generated from the Monte Carlo simulations were used to
characterize individual exposures and assess if a woman with such intakes might suffer
adverse health effects due to dietary mercury exposure. To characterize population
exposure, the proportion of intakes from the simulations that exceeded the US EPA's oral
reference dose (RID) for mercury (0.1 0 ug/kg-bw/day) was determined. In addition, the
proportion of estimates that exceeded an oral RID that has resulted in measurable health
effects (1.0 ug/kg-bw/day) was determined.
Once the individual and population distributions for dietary mercury intakes were
generated, consumption scenarios aimed at reducing exposures were explored. The
number of trials per simulation was reduced to 1, 000 and compared to results using
10,000 trials. Because of immaterial differences in estimates generated, subsequent
simulations exploring mercury reduction only contained 1,000 trials per simulation.
96
Specifically, the fish consumption rate used in each of the consumption scenarios (no
tuna, light tuna, both light and white. tuna and white tuna) was reduced to %, Yz, and 1;4 of
the original fish consumption rate, respectively. Individual and population exposures
were characterized for each of the consumption scenarios in the same manor mentioned
above for each reduced consumption rate.
3. RESULTS
3.1 Point and probabilistic estimations
Comparison of point and probabilistic intakes revealed that the probabilistic
estimates were somewhat lower than the point estimates, regardless of consumption
scenarios (Figure lA-C). However, comparison of the 95% confidence intervals for both
estimates suggested that the differences in the estimates were not significant and that the
probabilistic estimates adequately reflected dietary mercury exposure for African
American women in the Southeast Community (Figure lA-C). For the consumption
scenario labeled both tuna, only probabilistic estimates were generated and compared to
point estimates for the scenarios, no tuna, light tuna, and white tuna (Figure lD). The
probabilistic estimate for both tuna was very similar to point estimates for no tuna and
light tuna consumption and not significantly lower than the point estimate for white tuna
(Figure lD).
Comparison of the Monte Carlo simulations suggested that the consumption of no
tuna and light tuna generated similar daily mercury intake estimates and that the
consumption of both tuna and white tuna yielded higher estimates (Figure 2). Arithmetic
mean daily mercury intake rates (95% CI) for the probabilistic models were 0.149

97
(±0.003), 0.148 (±0.003), 0.172 (±0.004), and 0.202 (±0.004) ug/kg-bw/day, respectively
for no, light, both, and white tuna consumption. Median daily mercury intake rates for
the same consumption scenarios were 0.106, 0.107, 0.120, and 0.143 ug/kg-bw/day
respectively. Sensitivity analysis of the consumption scenarios revealed that out of all
the variables used for each model, fish consumption rate (g/day) had the greatest
influence on daily mercury intake estimates for no tuna (rank correlation= 0.36,
contribution to variance= 45%), light tuna (rank correlation= 0.38, contribution to
variance= 46%), both tuna (rank correlation= 0.35, contribution to variance= 46%), and
white tuna (rank correlation 0.35, contribution to variance= 43%) consumption.
3. 2 . Dietary mercury exposure
Under the scenario of no tuna consumption, both the mean and median exposures
exceeded US EPA's oral RID for mercury (0.1 ug/kg-bw/day, Table 1). The mean and
median exposures for the remaining consumption scenarios also exceeded this limit.
Thus, under the any of the consumption scenarios, an African American woman in the
Southeast Community with mean or median intake estimates may suffer adverse health
effects due to fish consumption and dietary mercury exposure (Table 1 ).
For all consumption scenarios, more than half of African American women in the
Southeast Community exceeded US EPA's oral RID for mercury (Figure 3A-D). The
proportion of exceedances was similar for no tuna (.52) and light tuna (.52) consumption.
However, the inclusion of white tuna in the fish diet of African American women in the
Southeast Community slightly increased the proportion of exceedances for both (.55) and
white (.59) tuna consumption. The proportion of estimates that exceeded an oral RID for

mercury that has resulted in measurable health effects (1.0 ug/kg-bw/day) was less than
.01 for all four consumption scenarios.
3.3 Reduction of dietary mercury exposures
98
Reducing the amount offish consumed (the variable fish consumption rate, g/day)
in the Monte Carlo simulations resulted in lower dietary mercury intake for each
consumption scenario (no tuna, light tuna, both tuna, and white tuna; Table 2). For an
individual consuming both tuna with mean or median intake, she would have to consume
at V4 the fish consumption rate to have an exposure that was below the US EPA oral RID
for mercury (Table 2). At this consumption rate (V!), the proportions of estimates that
exceeded US EPA's oral RID for mercury (under all consumption scenarios) were 0.14,
0.13, 0.18, and 0.25 respectively for no tuna, light tuna, both tuna, or white tuna
consumption (Figure 4). The proportion of estimates that exceeded an oral RID for
mercury that has resulted in measurable health effects was 0. 001 and 0.0004
respectively, for no tuna and white tuna consumption. For the scenarios light and both
tuna consumption, all estimates were below this RID (Figure 4).
4. DISCUSSION
4.1. Point and Probabilistic Estimates
The consideration of variability and uncertainty is important when estimating
exposures. Variability refers to differences that cannot be reduced or eliminated but can
be better characterized with more data. On the other hand, uncertainty (caused by lack of
knowledge) can be reduced by collecting both quality data and more data (US EPA,
2001c). Sources of variability in our exposures included variability in mercury

99
concentrations in the fish (mg/kg), ingestion rates (g/meal), exposure frequencies
(meals/year), consumption rate (g/day), and body weight (kg). Sources of uncertainty
included, parameter uncertainty, model uncertainty, and scenario uncertainty. Parameter
uncertainty is the most readily recognized source of uncertainty quantified in exposure
assessments (US EPA, 2001c).
Issues of uncertainty provided the context of why community-based participatory
research (CBPR) methodology was the framework for our research endeavors (Holloman
and Newman, 201 0). The most effective and efficient way we reduced uncertainty
associated with estimating fish consumption patterns and dietary mercury exposure of
African American women in the Southeast Community was through partnerships created
and maintained with community stakeholders (e.g. The Moton Community House and
community residents) and researchers. Collectively, our efforts increased the quality of
the data obtained and our certainty associated with our estimates of fish consumption and
dietary mercury exposure (Holloman and Newman 201 0, in press). Therefore we were
highly confident in the utility of: 1) the assumptions used in parameter estimations, 2) the
use of the exposure model created, and 3) the selection of consumption scenarios used.
The distribution of individual point estimates for 93 women surveyed in 2008
(Holloman and Newman, in press) provided a general measure of population variability
in dietary mercury intake for African American women in the Southeast Community of
Newport News, Virginia. For the three consumption scenarios, no tuna, light tuna, and
white tuna, the ranges of intakes were 0.000 to 1.41ug/kg-bw/day, 0.001 to 1.46 ug/kg
bw/day, and 0.002 to 1.69 ug/kg-bw/day respectively. Approximately half of the 93
point estimates were equal to or higher than mean and median estimates of daily mercury
100
intake for all three consumption scenarios. Distributions of the 93 exposures suggested
that African American women in the Southeast Community might experience adverse
health effects due to fish consumption and dietary mercury exposure. This was strongly
supported by the observation that mean and median estimates for all consumption
scenarios were above US EPA's oral reference dose (RID) for mercury.
The distributions of point estimates also provided exposure estimates of actual
women (n = 93) from the community and were used in determining if the probabilistic
models accurately simulated fish consumption and dietary mercury exposure. Based on
comparison of the two methods, the probabilistic models estimated lower intakes;
however, such differences were immaterial given the intent of our endeavors. Thus for
our purposes, probabilistic distributions were deemed the most useful depictions of
dietary exposure for African American women in the Southeast Community.
The custom probability distributions assumed in the probabilistic simulations
represented variability within each of the five variables (fish consumption rate, body
weight, ingestion rate, exposure frequency, and mercury concentration) used to estimate
mercury exposure. Therefore, our probabilistic distributions specifically were intended
to represent the variability, not uncertainty, in dietary mercury exposure for African
American women in the Southeast Community. Fish consumption rates (g/day)
contributed the most to the variance in exposures for all consumption scenarios. Recall
that in our simulations, this assumption served as the maximum fish consumption rate for
an individual (trial). Thus, the magnitude of incorrectly assuming (and modeling) fish
consumption rates for African American women in the Southeast Community could have
serious consequences (such as underestimation of mercury exposure). Because we used

101
CBPR (community-based participatory research) techniques to help reduce uncertainty
(parameter, model, scenario) in our estimations of fish consumption patterns (Holloman
and Newman 2010, in press), we were confident that the assumptions used and exposures
estimated during the simulations were sufficiently reflective of African American women
in the Southeast Community.
4. 2. Characterization of dietary mercury exposure
As previously mentioned, probabilistic distributions were used to characterize
daily mercury exposures for African American women (ages 16-49 yrs) in the Southeast
Community of Newport News, Virginia. Individual exposures were placed in the context
of position within a probabilistic distribution of intakes. We selected mean and median
estimates to represent "individual daily exposures" within the population and asked 1) if
African American individuals in the Southeast Community might experience adverse
health effects due to the fish they consume and dietary mercury intake, and 2) what was
the mean individual exposure? For all consumption scenarios (no, both, light, and white
tuna consumption), results indicated that African American women in the Southeast
Community with mean or median exposures might experience adverse health effects due
to the amount of mercury ingested from fish and shellfish consumed.
Similar to point estimates (Holloman and Newman, in press), mean and median
exposures for all probabilistic consumption scenarios (Table 1) were higher than recent
national estimates reported for general US women (0.022 ug/kg-bw/day; 95% CI: 0.021 -
0.024 ug/kg-bw/day; Mahaffey et al., 2009b) and for non-Hispanic Black women (0.022
ug/kg-bw/day; 95% CI: 0.020 - 0.024 ug/kg-bw/day; Mahaffey et al., 2009b ).
Probabilistic mean and median exposures also more closely resembled the mercury intake
102
rates of subsistence fishing populations (Abdelouahab et al., 2008; Marien and Patrick,
2001). This supported earlier conclusions (Holloman and Newman 2010, in press) that
dietary mercury exposure for African American women in the Southeast Community of
Newport News is high enough to warrant concern.
The US EPA derived an estimate of daily oral mercury intake (oral reference dose
(RID) = 0.1 ug/kg-bw/day) that is likely to be without an appreciable risk of adverse
health effects over a lifetime, in order protect humans against chronic and developmental
mercury toxicity (US EPA, 200la). This RID was based on cord blood measurements
and is equivalent to a blood mercury (BHg) concentration of 5.8 ug/1 and a hair
concentration of 1.0 ug/g (NCR, 2000; US EPA, 200la, 200lb). We estimated what
proportion of African American women in the Southeast Community exceeded the US
EPA oral RID for mercury.
For all of the consumption scenarios, the percentage of African American women
in the Southeast Community that exceeded the US EPA oral RID for mercury was greater
than 50%. In this community, approximately one out of two women might develop
adverse health effects due to exposure. Such exceedances were approximately 11 - 14
times higher than national BHg exceedances for general US women and for African
American women ( 4. 7 and 4.1% respectively; Mahaffey et al., 2009a). These
exceedances were also approximately 6 to 7 times higher than oral RID exceedances for a
population ofwomen anglers in the Wyoming (7.9%; Johnson and Snow, 2007) and 2
times higher than low income minority women from California's Sacramento-San
Joaquin Delta (29%; Silver et al., 2007). Approximately lout of 455 African American
women from the Southeast Community exceeded an oral RID for mercury that has
103
resulted in measurable health effects (1.0 ug/kg-bw/day) for no and light tuna
consumption. Approximately 1 out of303 and 1 out of 141 African American women
exceeded this RID for both and white tuna consumption, respectively. This was lower
than the 5% of women found to be exceeding this oral RID in California's Central Valley
Delta (Shilling et al., 201 0).
Dietary mercury exposure and proportions of intake exceedances in the US can
vary depending upon regionally were one lives (Northeast, South, West and Midwest)
and proximity to the coasf(Mahaffey et al., 2009a). In the US, regions with the highest
dietary mercury exposure are the Northeast and the South (Mahaffey et al., 2009a). In
addition, communities of coastal areas experience higher exposures than those of inland
areas (Mahaffey et al., 2009a). Regionally, African American women in the Southeast
Community ofNewport News, Virginia reside in the Southern region of the US, along
the Atlantic Coast. When compared to 30 - day mercury intake estimates from the South
and from the Atlantic Coast, mean intakes for African American women in the Southeast
Community were greater than national averages and 95th percentiles (Mahaffey et al.,
2009b ). In addition, the proportion of African American women in the Southeast
Community exceeding US EPA's RID's for mercury was higher than national
exceedances (Mahaffey et al., 2009a). However, when compared to exceedances from a
study focusing on anglers in the South (Louisiana) along the Gulf Coast ( 40%; Lincoln et
al., 2011) the percentages of exceedances were more similar. Such similarity in
exceedances, compared to national exceedances, highlights the importance of using
community (region) specific data to estimate dietary mercury intake and that great

103
resulted in measurable health effects (1.0 ug/kg-bw/day) for no and light tuna
consumption. Approximately 1 out of303 and 1 out of 141 African American women
exceeded this RID for both and white tuna consumption, respectively. This was lower
than the 5% of women found to be exceeding this oral RID in California's Central Valley
Delta (Shilling et al., 201 0).
Dietary mercury exposure and proportions of intake exceedances in the US can
vary depending upon regionally were one lives (Northeast, South, West and Midwest)
and proximity to the coasf(Mahaffey et al., 2009a). In the US, regions with the highest
dietary mercury exposure are the Northeast and the South (Mahaffey et al., 2009a). In
addition, communities of coastal areas experience higher exposures than those of inland
areas (Mahaffey et al., 2009a). Regionally, African American women in the Southeast
Community of Newport News, Virginia reside in the Southern region of the US, along
the Atlantic Coast. When compared to 30- day mercury intake estimates from the South
and from the Atlantic Coast, mean intakes for African American women in the Southeast
Community were greater than national averages and 95th percentiles (Mahaffey et al.,
2009b ). In addition, the proportion of African American women in the Southeast
Community exceeding US EPA's RID's for mercury was higher than national
exceedances (Mahaffey et al., 2009a). However, when compared to exceedances from a
study focusing on anglers in the South (Louisiana) along the Gulf Coast ( 40%; Lincoln et
al., 2011) the percentages of exceedances were more similar. Such similarity in
exceedances, compared to national exceedances, highlights the importance of using
community (region) specific data to estimate dietary mercury intake and that great

104
thought and consideration should be given to ensure that data used reflects the population
of interest.
4. 3. Reducing dietary mercury exposure
Fish consumption rates contributed to over half of the variance for all
distributions of daily mercury intake generated. Comparison of all four consumption
scenarios (no, light, both, and white tuna consumption) suggested that the elimination of
canned tuna from the diet of African American women in the Southeast Community
would generate the lowest estimate of dietary mercury exposure; however, the amount of
mercury ingested would still be high enough to warrant concern. Especially considering
that for no tuna consumption, that mean or median individuals would exceed limits
assumed to be without an appreciable risk of adverse health effects over a lifetime and
that half of the women in the Southeast Community would also exceeds such limits.
Because of the high contribution to the variance, explorations of dietary mercury
reduction focused on the amount of fish (g/day) assumed in the models. The amount of
fish assumed was reduced by 75, 50, and 25% to determine 1) ifreducing the amount of
consumed fish lowered dietary mercury exposure and 2) the magnitude of reduction
necessary to generate mean and median estimates below the US EPA's oral RID for
mercury. Reducing the amount of fish consumed did reduce dietary mercury exposure
for African American women in the Southeast (Table 2). For African American women
consuming fish at a rate % of what was normally consumed, mean and median estimates
of daily mercury intakes (for all consumption scenarios) remained above the US EPA's
oral RID for mercury. At a rate Yz of what was normally consumed, mean and median
estimates for not consuming any canned tuna were below the US EPA's oral Rfd;
105
however, the inclusion of canned tuna (light, both, or white) increased mean intakes
above this RID while median estimates remained below. In order to generate mean and
median exposures below 0.10 ug/kg-bw/day (for all consumption scenarios) a woman
would have to consume fish at a rate 114 of what was normally consumed.
Any fish consumption advice aimed at reducing dietary mercury exposure must
also consider the nutritional benefits from such consumption. On average, African
American women in the Southeast Community consume fish at a rate of 147.8 g/day (5.2
oz/day; Holloman and Newman, 2010). Reducing this rate to a quarter of the normal
amount would reduce dietary mercury exposure; however, some of the nutritional
benefits associated with fish and shellfish consumption might also be reduced. One of
the most recognized nutritional benefits from fish consumption is the intake of two
polyunsaturated fatty acids (Omega-3 and Omega-6 fatty acids) that the body cannot
synthesize and must be ingested in order to meet human physiological demands (Genuis,
2008). Omega-6 fatty acids are mainly derived from plant sources where as fish and
shellfish are the most common sources of omega-3 fatty acids. Eicosapentaenoic acid
(EPA) and docosahexaenoic acid (DHA) are two omega-3 fatty acids that have received a
lot of attention because of protective effects against coronary heart disease (CHD; Kris
Etherton et al., 2002; Domingo et al., 2007) as well as their importance in proper fetal
development (Domingo et al., 2007; Genuis, 2008).
Fish and shellfish that were analyzed for mercury (Holloman and Newman, in
press) were also analyzed for omega-3 and omega-6 fatty acids. Analysis of these results
is currently underway. When comparing mercury concentrations offish items commonly
consumed by African American women in the Southeast Community (Holloman and

106
Newman, in press), with omega-3 fatty acid concentrations reported in the literature
(Mahaffey et al., 2008), salmon and mackerel had the highest amounts ofEPA + DHA
(1.59 and 1.79 g/100g offish respectively; Mahaffey et al., 2008) and relatively low
mercury concentrations (27.1 and 47.2 ug/kg respectively; Holloman and Newman, in
press). Therefore, for an African American woman in the Southeast Community, the
consumption of salmon and mackerel may provide the highest amounts of omega-3 fatty
acids with the lowest mercury concentrations.
5. CONCLUSION
Subsistence fish consumers are generally defined as those that rely on non-
commercially caught fish as a major source of protein to their diet (US EPA, 2000a,
2000b ). Recently, we suggested that current perceptions of subsistence fish consumption
potentially overlooked and underestimated the contribution of commercially consumed
fish to the diet of certain ethnic minorities and low-income communities therefore,
potentially underestimating its contribution to dietary mercury exposure (Holloman and
Newman, 2010, in press). Through our collaborative, community-based participatory
research endeavors, we identified a subpopulation of African American women of
childbearing age (ages 16 - 49 yrs) whose fish intake from commercial markets and
dietary mercury exposures were high enough to warrant concern. The difference between
national mercury exposure estimates and that of African American women in the
Southeast Community strongly emphasized the importance of using community specific
data when making assumptions about a population. This difference also highlighted and
confirmed the existence of a subpopulation of women in the US that disproportionally

experience higher exposures to mercury. It is our goal to facilitate strategies and
solutions that are aimed at reducing mercury exposure in this community.
ACKNOWLEDGMENTS
107
Special thanks to the women of the Southeast Community ofNewport News,
Virginia, USA whom without, our collaborative efforts would be in vain. Lastly, special
thanks to Linwood DeBrew (the executive director of the Moton Community House and
Angela Harris (community resident/activist) for their guidance and support in
maintaining collaborative partnerships established between The College of William &
Mary, Virginia Institute of Marine Science and The Moton Community House.
108
LITERATURE CITED
Abdelouahab, N., Vanier, C., Baldwin, M., Garceau, S., Lucotte, M., Mergler, D., 2008. Ecosystem matters: Fish consumption, mercury intake and exposure among fluvial lake fish-eaters. Sci. Total Environ. 407 (1), 154- 164.
Ahlqwist, M., Bengtsson, C., Lapidus, L., Gergdahl, LA., Schutz, A., 1999. Serum mercury concentration in relation to survival, symptoms, and diseases: results from the prospective population study of women in Gothenburg, Sweden. Acta. Odontol. Scand. 57,168-174.
Beehler, G., McGuinness, B.M., Vena, J.E., 2001. Polluted fish, sources ofknowledge, and the perception of risk: Contextualizing African American anglers' sport fishing practices. Human Organ. 60, 288-297.
Blom, G., 1958. Statistical Estimates and Transformed Beta Variables. New York: John Wiley & Sons, Inc.
Burger, J., Stephens, W.L., Boring, S., Kuklinski, M., Gibbons, J.W., Gochfeld, M., 1999. Factors in exposure assessment: ethnic and socioeconomic difference in fishing and consumption offish caught along the Savannah River. Risk Anal. 19, 427-438.
Burger, J., Gaines, K.F., Gochfeld, M., 2001. Ethnic differences in risk from mercury among Savannah River fisherman. Risk Anal. 21, 533-544.
Castoldi, A.F., Johansson, C., Onishchenko, N., Coccini, T., Roda, E., Vahter, M., Ceccatelli, S., Manzo, L., 2008. Human developmental neurotoxicity of methylmercury: impact of variables and risk modifiers. Regul. Toxicol. Pharmacol. 51,201-214.
Cecelski, D.S., 2001. The Waterman's song: Slavery and freedom in maritime North Carolina. University ofNorth Carolina Press, Chapel Hill, NC.
Centers for Disease Control and Prevention (CDC), 2001. Blood and hair mercury levels in young children and women of childbearing age -United States, 1999. Morb. Mortal. Wkly. Rep. 50, 140-143.
Centers for Disease Control and Prevention (CDC), 2005. Third national report on human exposure to environmental chemicals. Atlanta, GA.
Corbum, J., 2002. Combining community-based research and local knowledge to confront asthma and subsistence-fishing hazards in Greenpoint/Williamsburg, Brooklyn, New York. Environ. Health Perspect. 110,241-248.
109
Derrick, C. G., Miller, J.S.A., Andrews, J.M., 2008. A fish consumption study of anglers in an at-risk community: A community- based participatory approach to risk reduction. Public Health Nursing. 25 ( 4), 312-318.
Duncan, M., 2000. Fish consumption survey of the Squamish Indian Tribe of the Port Madison Indian Reservation, Puget Sound Region. The Suquamish Tribe, Port Madison Indian Reservation, fisheries department, Suquamish, W A, USA.
Domingo, J.L., Bocio, A., Falco', G., Llobet, J.M., 2007. Benefits and risks offish consumption Part I. A quantitative analysis of the intake of omega-3 fatty acids and chemical contaminants. Toxicol. 230,219-226.
Genuis, S.J ., 2008. To sea or not to sea: benefits and risks of gestational fish consumption. Reprod Toxicol. 26 (2), 81-5.
Gibson, J. C., McClafferty, J.A., 2005. Identifying populations at risk for consuming contaminated fish in three regions of concern. Chesapeake Bay Program and Conservation Management Institute. CMI-HDD-05-01, Blacksburg, VA.
Grandjean, P., Weihe, P., White. R.F., 1995. Milestone development in infants exposed to methylmercury from human milk. Neurotoxicology 16(1), 27-34.
Grandjean, P., Weihe, P., White, R.F., Debes, F., Araki, S., Yokoyama, K., Murata, K., S0rensen, N., Dahl, R., J0rgensen, P.J., 1997. Cognitive deficit in 7-year-old children with prenatal exposure to methylmercury. Neurotoxicology Teratol. 19(6), 417-428.
Grandjean, P., White, R., Nielsen, A., Cleary, D., de Oliveira Santos, E.C., 1999. Methylmercury neurotoxicity in Amazonian children downstream from gold mining. Environ. Health Perspect. 107(7), 587-591.
Guallar, E., Sanz-Gallardo, M.I., van't Veer, P., Bode, P., Aro, A., Gomez-Aracena, J., Kark, J.D., Riemersma, R.A., Martin-Moreno, J.M., Kok, F.J., 2002. Mercury, fish oils, and the risk of myocardial infarction, in New Engl J. Med. 347 (22), 1747-54.
Hallgren, C.G., Hallmans, G., Jansson, J.H., Marklund, S.L., Huhtasaari, F., Schu"'tz, A., Stro"'mberg, U., Vessby, B., Skerfving, S., 2001. Markers ofhigh fish intake are associated with decreased risk of a first myocardial infarction. Br. J. Nutr. 86, 397-404.
Harada, M., 1995. Minamata Disease: Methylmercury poisoning in Japan caused by environmental pollution. Crit. Rev. Toxicol. 25(1 ), 1-24.
Holloman, E.L., Newman M.C., 2010. A community-based assessment offish consumption along the lower James River, Virginia, USA: Potential sources of dietary mercury exposure. Environ. Res. 110,213-219.
110
Holloman, E.L., Newman, M.C., in press. Expanding perceptions of subsistence fish consumption: Evidence of high commercial fish consumption and dietary mercury exposure in an urban coastal community. Sci. Total. Environ. DOl : 10.10 16/j .scitotenv.20 11.10.003
Johnston, J.J., Snow, J.L., 2007. Population-based fish consumption survey and probabilistic methylmercury risk assessment. Hum. Ecol. Risk Assess. 13, 1214-1227.
Judd, N., Griffith, W., Faustman, E., 2004. Consideration of cultural and lifestyle factors in defining susceptible populations for environmental disease. Toxicol. 198, 121-133.
Kris-Etherton, P.M., Harris,W.S., Appel, L.J., For the Nutrition Committee. AHA scientific statement, 2002. Fish consumption, fish oil,omega-3 fatty acids, and cardiovascular disease. Circulation 106, 2747-2757.
Lincoln, A.R., Shine, J.P., Chesney, E.J., Vorhees, D.J., Grandjean, P., Senn, D.B., 2011. Fish consumption and mercury exposure among Louisiana recreational anglers. Environ. Health Perspect., 119 (2) 245 - 251.
Lowenstein, J.H., Burger, J., Jeitner, C.W., Amato, G., Kolokotronis, S.O., Gochfeld, M. 2010. DNA barcodes reveal species-specific mercury levels in tuna sushi that pose a health risk to consumers. Bioi Lett. 6(5), 692-695.
Mahaffey, K.R., Clicker, R.P., Jeffries, R.A., 2008. Methylmercury and omega-3 fatty acids: Co-occurrence of dietary sources with emphasis on fish and shellfish. Environ. Res. 1 07, 20 - 29.
Mahaffey, K.R., Clicker, R.P., Jeffries, R.A., 2009a. Adult women's blood mercury concentrations vary regionally in the United States: Associations with patterns of fish consumption (NHANES 1999- 2004). Environ. Health Perspect. 117(1), 47 -53.
Mahaffey, K.R., Clicker, R.P., Jeffries, R.A., 2009b. Adult women's blood mercury concentrations vary regionally in the United States: Associations with patterns of fish consumption (NHANES 1999- 2004). [Supplemental Material] Environ. Health Perspect. 117(1), 47 -53.
McGraw, Sr. J.E., Waller, D.P., 2009. Fish ingestion and congener specific polychlorinated biphenyl and p,p'-dichlorodiphenyldichloroethylene serum

concentrations in a great lakes cohort of pregnant African American women. Environ. Int. 35, 557 -565.
111
Marien, K., Patrick, G.M., 2001. Exposure analysis of five fish consuming populations for overexposure to methylmerucry. J. Expo. Anal. Environ. Epidemiol. 11(3), 193-206.
Myers, G.J., Marsh, D.O., Cox, C .. , Davidson, P.W., Shamlaye, C.F., Tanner, M.A., Choi, A., Cernichiari, E., Choisy, 0., Clarkson, T.W., 1995a. A pilot neurodevelopmental study of Seychellois children following in utero exposure to methylmercury from a maternal fish diet. Neurotoxicology 16(4), 629-638.
Myers, G.J., Marsh, D.O., Cox, C .. , Davidson, P.W., Shamlaye, C.F., Tanner, M.A., Choi, A., Cernichiari, E., Choisy, 0., Clarkson, T.W., 1995b. Main neurodevelopmental study of Seychellois children following in utero exposure to methylmercury from a maternal fish diet: Outcome at six months. Neurotoxicology 16(4), 653-664.
Myers, G.J., Davidson, P.W., Cox, C., Shamlaye, C.F., Tanner, M.A., Choisy, 0., Sloane-Reeves, J., Marsh, D.O., Cernichiari, E., Choi, A., Berlin, M., Clarkson, T.W., 1995c. Neurodevelopmental outcomes of Seychellois children sixty-six months after in utero exposure to methylmercury from a maternal fish diet: Pilot study. Neurotoxicology. 16(4), 639-652.
National Environmental Justice Advisory Council (NEJAC), 2002. Fish Consumption and Environmental Justice.
National Research Council (NRC), 2000. Toxicological Effects ofMethylmercury. Washington, DC: National Academy Press.
Nobmann, E.D., Byers, T., Lanier, A.P., Hankin, J.H., Jackson, M.Y., 1992. The diet of Alaska Native adults: 1987-1988. Am. J. Clin. Nutr. 55,1024-1032.
Peles, J.D., Glenn, T.C., Brant, H.A., Wall, A.K., Jagoe, C.H. 2006. Mercury concentration in largemouth bass (Micropterus Salmoides) from five South Carolinareservoirs. WaterAirSoilPoll.173, 151-162.
Salonen, J.T., Seppanen, K., Nyyssonen, K., Korpela, H., Kauhanen, J., Kantola, M., Tuomilehto, J., Esterbauer, H., Tatzber, F., Salonen, R., 1995. Intake ofmercury from fish, lipid peroxidation, and the risk of myocardial infarction and coronary, cardiovascular, and any death in Eastern Fitmish men. Circulation 91(3), 645-655.
Schober, S.E., Sinks, T.H., Jones, R.L., Bolger, P.M., McDowell, M., Osterloh, J., et al., 2003. Blood mercury levels in U.S. children and women of childbearing age, 1999-2000. JAMA. 289, 1667-1674.

Sechena, R., Nakano, C., Liao, S., Polissar, N., Lorenzana, R., Truong, S., Fenske, R., 1999. Asian and Pacific Islander fish consumption study. Seattle, W A: EPA Office of Environmental Assessment
112
Shilling, F.M., Sommer, S., Leonelli, L., Shimoum, D., 2008. Community-based strategies to reduce mercury exposure in Delta fishing communities. Report for the California Department of Public Health and the Central Valley Regional Water Quality Control Board.
Shilling, F., White, A., Lippert, L., Lubell, M., 2010. Contaminated Fish Consumption in California's Central Valley Delta. Environ. Res. 110, 334- 344
Silver, E., Kaslow, J., Lee, D., Lee, S., Tan, M.L., Weis, E., Ujihara, A., 2007. Fish consumption and advisory awareness among low-income women in California's Sacramento-San Joaquin Delta. Environ. Res. 104,410-419.
S0rensen, N., K. Murata, E. Budtz-J0rgensen, P. Weihe, and P. Grandjean. 1999. Prenatal methylmercury exposure as a cardiovascular risk factor at seven years of age. Epidemiology 10(4):370-375.
Sunderland, E.M., 2007. Mercury exposure from domestic and imported estuarine and marine fish in the United States fish market, Environ. Health Perspect. 115(2), 235-242.
Toy, K.A., Polissar, N.L., Liao, S., Mittelstaedt, G.D., 1996. A fish consumption study of the Tulalip and Squaxin Island tribes of the Puget Sound region. Tulalip Tribes, Department of Environment, Marysville, W A
United States Environmental Protection Agency (US EPA), 1999. Risk Assessment Guidance for Superfund (RAGS), Volume I: Human Health Evaluation Manual, Part A. EPA- 540/1-89/002. Office ofEmergency and Remedial Response, Washington, DC.
United States Environmental Protection Agency (US EPA), 2000a. Guidance for Assessing Chemical Contaminant Data for use in Fish Advisories. Volume I: Fish Sampling and Analysis. EPA-823/B-00-007. Office ofWater, Washington, DC.
United States Environmental Protection Agency (US EPA), 2000b. Guidance for Assessing Chemical Contaminant Data for use in Fish Advisories. Volume II: Risk Assessment and Fish Consumption Limits. EPA-823/B-00-008. Office of Water, Washington, DC.
United States Environmental Protection Agency (US EPA), 2001a: Integrated Risk Information System (IRIS). Methylmercury. Available from URL: http://www.epa.gov/iris/subst/0073.htm [Accessed: 7/5/2011].

United States Environmental Protection Agency (US EPA), 2001b. Water Quality Criterion for the Protection ofHuman Health: Methylmercury. EPA-823/R-01-001. Office of Water, Washington D.C.
United States Environmental Protection Agency (US EPA), 2001c. Risk Assessment Guidance for Superfund (RAGS) Volume III - Part A: Process for Conducting Probabilistic Risk Assessment. EPA 540-R-02-002. Office ofEmergency and Remedial Response, Washington D.C.
113
United States Environmental Protection Agency/ Food and Drug Administration (US EPA/FDA), 2004. What You Need to Know About Mercury in Fish and Shel?fish. EPA-823-R-04-005. Available from URL: http://www.epa.gov/waterscience/fishadvice/advice/html or http://www.cfsan.fda.gov/~dms/admehg3.html [Accessed: 2/18/2011].
United States Food and Drug Administration (US FDA), 2004. Mercury Concentrations in Fish: FDA Monitoring Program (1990-2004). Food and Drug Administration, Washington, DC. Available from URL: http://www.fda.gov/Food/FoodSafety/ProductSpecificlnfom1ation/Fish/FoodbornePathogensContaminants/Methylmercury/ucm 191 007.htm [Accessed: 2/23/2011].
Weintraub, M., Birnbaum, L.S., 2008. Catfish consumption as a contributor to elevated PCB levels in a non-Hispanic black subpopulation. Environ. Res. 107, 412-417.
Yoshizawa, K., Rimm, E.B, Morris, J.S., Spate, V.L., Chung-cheng, H., Spiegelman, D., Stampfer, M.J., Willett, M.D., 2002. Mercury and the risk of coronary heart disease in men. N. Engl. J. Med. 347, 1755-1760.

114
TABLE 1.
Consumption Intake Cumulative Proportion Scenarios (ug/kg-bw/day) J>roportion 95% CI
No tuna Average 0.149 0.60 0.51-0.70 Median 0.106 0.50 0.40-0.59 90th Percentile 0.345 0.89 0.83-0.95 95th Percentile 0.446 0.94 0.90-0.99 99th Percentile 0.729 0.98 0.96- 1.00
Light tuna Average 0.148 0.60 0.51-0.70 Median 0.107 0.50 0.40-0.59 90th Percentile 0.343 0.89 0.83-0.95 95th Percentile 0.439 0.94 0.90-0.99 99th Percentile 0.677 0.98 0.96-1.00
Both tuna Average 0.172 0.60 0.51-0.70 Median 0.120 0.50 0.40-0.59 90th Percentile 0.402 0.89 0.83-0.95 95th Percentile 0.530 0.94 0.90-0.99 99th Percentile 0.813 0.98 0.96-1.00
White tuna Average 0.202 0.61 0.51-0.70 Median 0.143 0.50 0.40-0.59 90th Percentile 0.488 0.89 0.83-0.95 95th Percentile 0.613 0.94 0.90-0.99 99th Percentile 0.929 0.98 0.96-1.00
Daily mercury intake estimates (ug/kg-bw/day) and associated cumulative proportions and 95% confidence intervals for the four consumption scenarios (N = 10,000 trials per simulation). Average cumulative proportions were associated with the largest intake estimate less than or equal to the average estimate. US EPA's oral RID for mercury is 0.10 ug/kg-bw/day
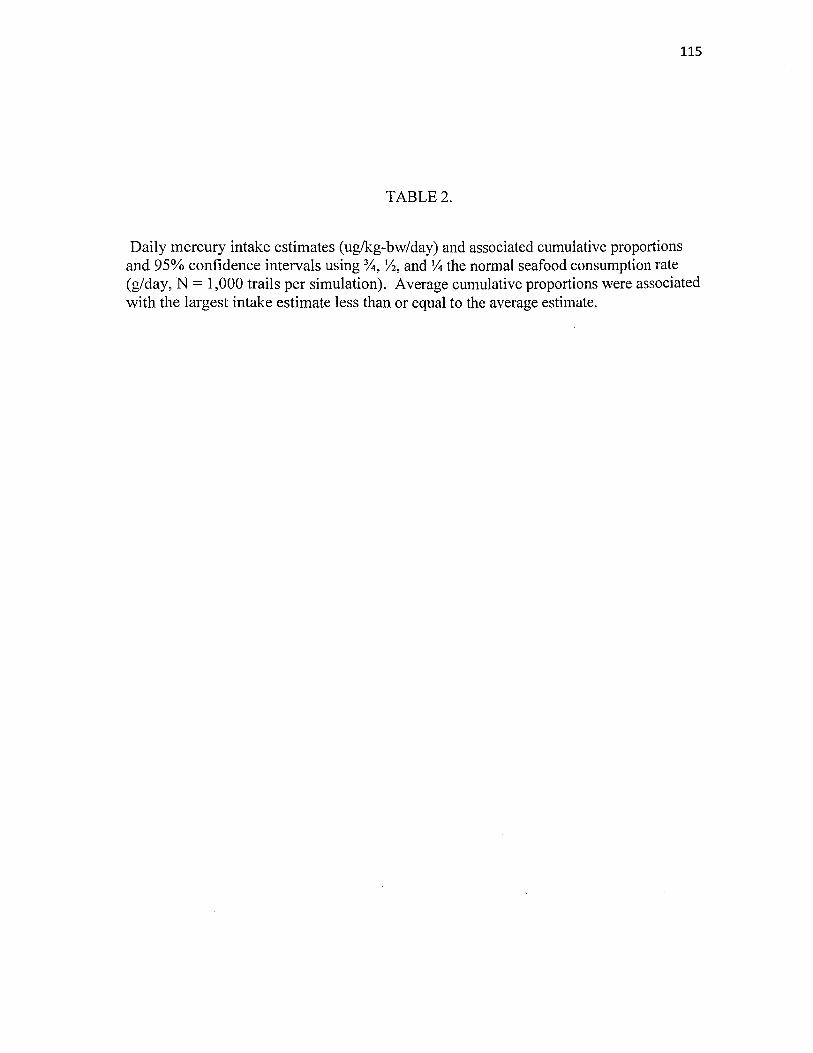
115
TABLE2.
Daily mercury intake estimates (ug/kg-bw/day) and associated cumulative proportions and 95% confidence intervals using%, lh, and Y4 the normal seafood consumption rate (g/day, N = 1,000 trails per simulation). Average cumulative proportions were associated with the largest intake estimate less than or equal to the average estimate.

117
TABLE 2 continued.
Consumption Intake Cumulative Proportion Scenarios (ug/kg-bw/day) Proportion 95% CI
% Consumption Rate
No tuna Average 0.049 0.67 0.58-0.77 Median 0.028 0.50 0.40-0.59 90th Percentile 0.118 0.89 0.83-0.95 95th Percentile 0.166 0.94 0.90-0.99 99th Percentile 0.304 0.98 0.96-1.00 Light tuna Average 0.052 0.68 0.59-0.78 Median 0.031 0.50 0.40-0.59 90th Percentile 0.121 0.89 0.83-0.95 95th Percentile 0.162 0.94 0.90-0.99 99th Percentile 0.322 0.98 0.96-1.00 Either tuna Average 0.061 0.66 0.57-0.76 Median 0.035 0.50 0.40-0.59 90th Percentile 0.154 0.89 0.83-0.95 95th Percentile 0.218 0.94 0.90-0.99 99th Percentile 0.323 0.98 0.96-1.00 White tuna Average 0.079 0.66 0.56-0.75 Median 0.047 0.50 0.40-0.59 90th Percentile 0.189 0.89 0.83-0.95 95th Percentile 0.285 0.94 0.90-0.99 99th Percentile 0.433 0.98 0.96-1.00
Daily mercury intake estimates (ug/kg-bw/day) and associated cumulative proportions and 95% confidence intervals using%, Yz, and 114 the normal seafood consumption rate (g/day, N = 1,000 trails per simulation). Average cumulative proportions were associated with the largest intake estimate less than or equal to the average estimate.
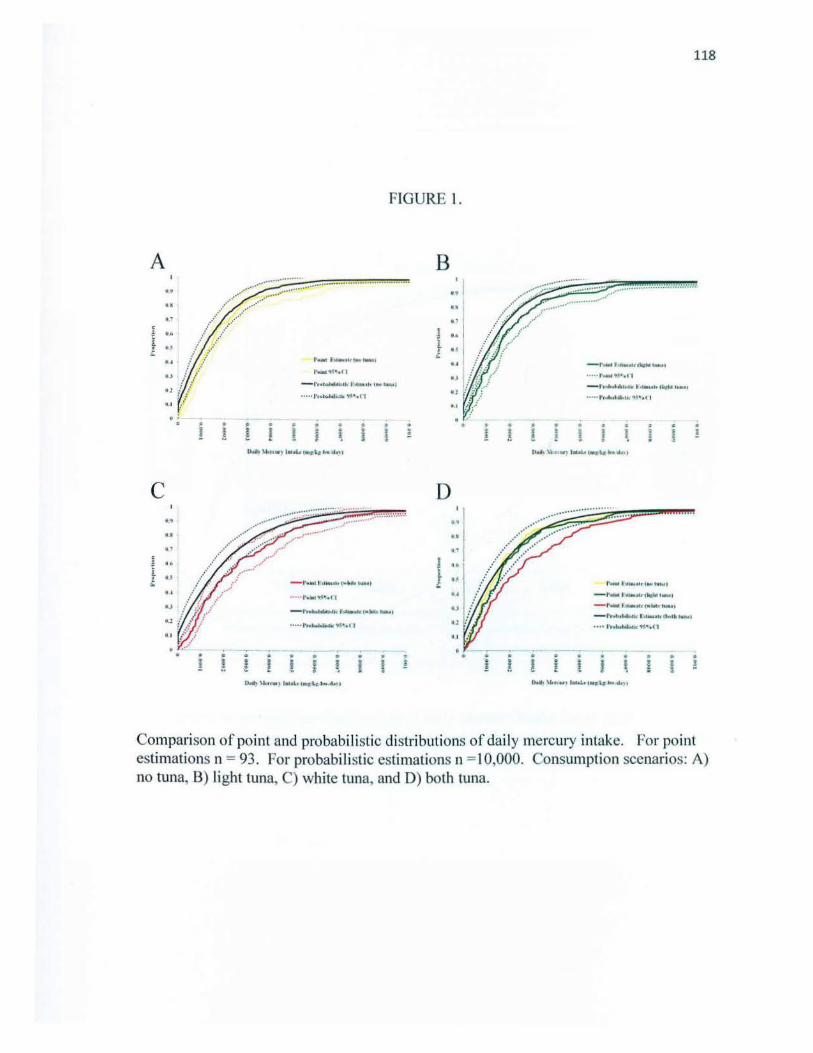
A .. .. ... ,
II ; . i
. A
c •• .. ., •• . '
•.•• ! 0 I
...... · OJ
.,
. ~
I ~
FIGURE 1.
Q . . ; . . . . ~ ( ! J ~ t J ! ~
OMh \t..ttw'\ ·-~\• fltZ-\a: ... lb\ I
... :·-.·.·.· .... ·::;.·.·.·.\
.. .. ···· .··· ..... ·····
-l'••• f'u.,..llh'l"'"''' '~•t
'" '•1\i-•f;• .. tt
-1~...._ t\1-•lf'I•......_IW~UI
••••• l ..... ~wif'•.tl
. ; . . . ; . ~
! ! ~ f ~ I I i
~, ...... "*', ......... ~.t-l.!:k~t
B •• I
.. I ,, 1 .. t .. ~ ..
• J
D . . "
~ o;
t "' tl
"
. . . ! ! !
.. ·················· ..··
.. ............
0 . ! !
118
................ :.::.:::::::::.:.•.•
_ , ................. tcM--..t
............ , .. t. _,, ................... ~·-i~·· ·"'' ..... .,....,,~,,u,.,,~,. . .,~· ., '
. ~
- ··--·w.-.-.. tlllt)wtw.~l _ , ..... ~,t .... f' t .WU j
_,.,.....~ ··~t'-4 ... .-.. •
.... . ... ~ .. ~~· .(1
. I
!
. !
Compari son of point and probabilistic distributions of daily mercury intake. For point estimations n = 93. For probabilistic estimations n = I 0,000. Consum ption scenarios: A) no tuna, B) light tuna, C) white tuna, and D) both tuna.
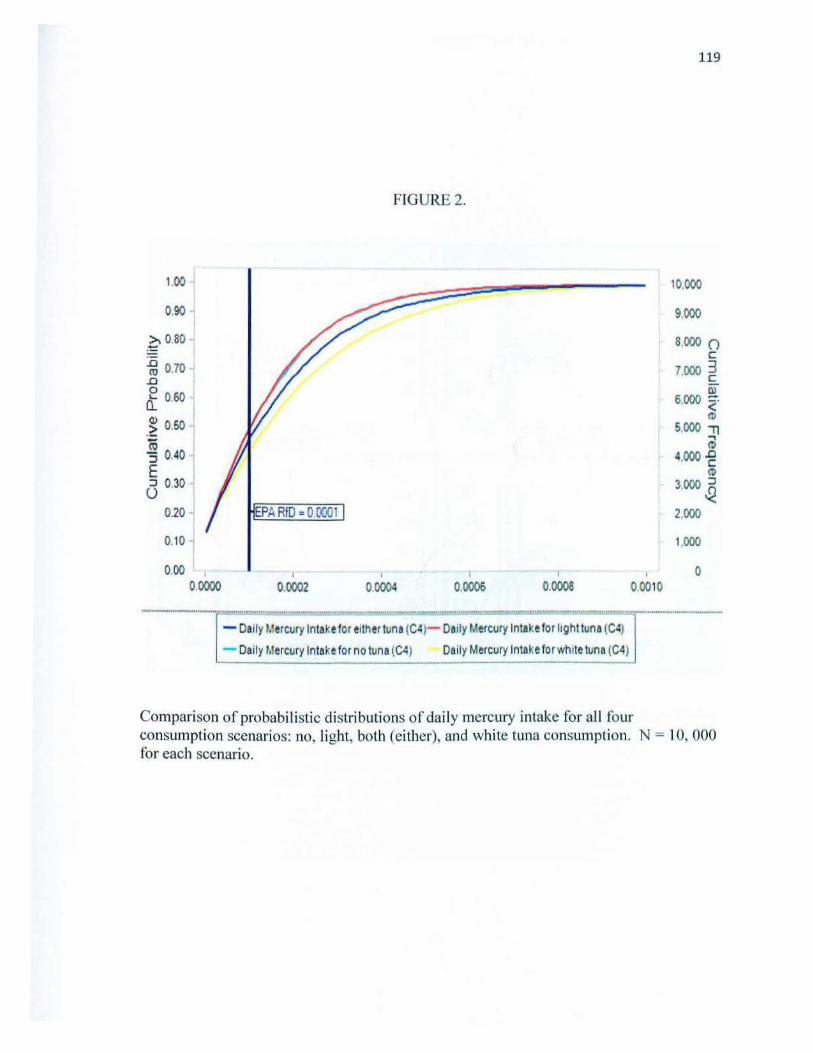
1.00
0.90 I
~ 0.80 -:0 ro 0.70 .0 0 0: 0.60
(1) .~ o.so (6 '3 0.40 E a 0.:}0
0.20
0.10 I
0.00 I
0.0000 0.0002
FIGURE 2.
1 I
0.0004 0.0006 0.0008 0.0010
119
10.000
9,000
8000 0 c
7000 3 . c Q)
6,000 ~· (l)
5,000 il .., (l)
4,000 .g (l)
3.000 ~
2.000
1,000
0
Comparison of probabi listic distributions of daily mercury intake for all four consumption scenarios: no, light, both (either), and white tuna consumption. N = I 0, 000 for each scenario.

A
c ~ 1 00 :.0 (I) 080 .0 0
O.: oso <P >
·~ 040 s 8 020 I
000 I> 0.0000
_,.-------/ tf•!t!n • 0 00011 ·~ed"ten • 0 00011 P~Rf0• 0 0001 l
0 0003 0 0006 0 0009
m~g·I7N/day
----/ ....
/ I/ lr·!ean • 0 0002 If.' edt an • 0 0001
P;. RID. o ocm
~ I
0 0003 0 0006 0 0009 m~g·I7N/day
FIGURE 3.
10000p
8000 ~ ~
6.000 ~·
11 4000 ;
.0 c 2000 ~
~ 0
D ~1 00
~ 080 .0 0 Q: oso <P > ~ 0 40 I s E 020
8 000 I>
00000
lf,'ean • 0 00011 ·'edaan • 0 00011 P.:.RIO • 00001 I
0 0003 00006 0 0009 m~g·bw/ day
I ft!un • 0 0002 1 ft.ledtan • 0 0001 1 P~RIO•OOOOll
0 0003 0 0006 0 0009 m~g·bw/day
120
10000 ()
sooo l ~
6.000 ~ 11
4.000 a; .0 c
2.000 ~ ~
0
10.000 () c
8000 ~ ~
6.000 ~ 11
4 000 a; .0 c
2.000 ~
~ 0
Probabilistic distributions of daily mercury exposures for the four consumption scenarios: A) no tuna, B) light tuna, C) both tuna, and D) white ttma. N = 10, 000 for each scenario.

121
FIGURE 4.
f""'""''''" '''"""''"·--··"···· ........................................................................................................................................................... ....... ............................................................................................ !
1 00 -j
0.90 j €0.80
{il 0.70 ..0
· e oso ; 0..
i ~ 0.50 j-1-=; 0.40 -i E !(3 0.30 ' : 0.20-
0.10 -
EPA RID = 0.0001
··:J C i
700 3 ! C i iili
600 ~ ~ a>!
500 , i ~ ~
400 ..0 i c ' ro '
300 ::::l I
.Q ! 200 l 100 I
! 0,00 1 j j j J j 0 !
! ......................... ~:~ ............... . ...... {)·~-~ ............................... ~:.:.~ ........ ...................... ~=-··~= .. · .. =· ... = .... = .... = ..... = .... = .... = .. -= .... =-~=·J~= .... = .. ·B="·"=""""'' ""'"'-"'= .... =······~·-~~-~ ............................ ! - Daily Mercury Intake for either tuna (C4) - Dally Mercury Intake for light tuna (C4}
Daily Mercury Intake for no tuna (C4) Dally Mercury lntakeforwh1te tuna (C4)
Comparison of probabilistic distributions of daily mercury intake at 25% of the normal consumption rate for African American women in the Southeast Community . N = I ,000 for each scenario.

122
CONCLUSION
123
The use of CBPR greatly improves exposure assessments by providing
community-specific information. Community-specific information increases data quality
and reduces parameter uncertainty for those estimating risk. Through the CBPR
approach we learned that ingestion rates (g/meal) are not only the selected portion size
but, more importantly, how many of the individual portions are consumed during one
meal setting. In addition, even though women in this study were not subsistence fishers,
they were subsistence fish consumers.
Assessors need to be more aware of their perceptions associated with certain
subpopulations and their selection of parameter estimates used to characterize fish
consumption in these populations, especially when exposure data is limited. Narrow
perceptions and incorrect assumptions of fish consumption and contaminant exposure for
many US subpopulations has lead to serious issues of environmental injustices regarding
risk management and communication whereby. non protective standards and polices have
been implemented (and communicated), and the burden of exposure reduction has placed
solely on the individual and/or population. Through the collaborative partnership
established between our research team and the Moton Community House, critical insights
were gained about fish consumption patterns and dietary mercury exposure for low
income African American women residing in the Southeast Community of Newport
News, Virginia. Noteworthy is the potential environmental injustice issue arising from
current perceptions of subsistence fish consumption held by many charged with assessing
and regulating exposure to contaminated fish. Assessors viewing subsistence fish
consumption only in relation to items fished for, instead of purchased, may
unintentionally overlook or make incorrect assumptions about populations who are not
subsistence fishers, but nonetheless, consume commercial fish at a subsistence rate.
124
The custom probability distributions assumed in the probabilistic simulations
represented variability within each of the five variables (fish consumption rate, body
weight, ingestion rate, exposure frequency, and mercury concentration) used to estimate
mercury exposure. Therefore, our probabilistic distributions specifically were intended
to represent the variability, not uncertainty, in daily dietary mercury exposure for African
American women in the Southeast Community. We also understood that our
probabilistic estimates did not represent a mean daily mercury exposure; therefore, using
the 10,000 daily estimates obtained for both tuna, we modeled consumption for one year
(365 days/trails) and compared this with the daily exposures obtained for both tuna
(Figure 1 ). The mean daily mercury exposures were slightly lower than the daily
exposures; however for our purpose, this difference was immaterial. Thus, it was
concluded that an African American women in the Southeast Community who consumed
fish for a year would still have a mean exposure that was above US EPA's oral RID for
mercury and may experience adverse health effects due to consumption.
Through our endeavors, we identified a subpopulation of African American
women of childbearing age (ages 16-49 yrs) whose fish intake from commercial
markets and dietary mercury exposures were high enough to warrant concern. The
difference between national mercury exposure estimates and that of African American
women in the Southeast Community strongly emphasized the importance of using
community specific data when making assumptions about a population. Future work will
entail determining fatty acid concentrations in the fish items that were analyzed for

125
mercury. Ultimately, it is our goal to facilitate strategies and solutions that are aimed at
reducing mercury exposure in this community.

FIGURE 1.
A ~ 1 00 10000 0 .-=:
/ c: ~ 0 80 3 .D
8.000 c: 0 / Q) ... -a.. 0.60 .!ean • 0 0002 6.000 ~ · G> > ., ·= 0 40 4,000 ~ ro - .D :J c E 020 2 000 CD a :J
~ 0.00 ~ 0
0.0000 00003 00006 00009 mg/kg-bw/day
B ~1.00 360() .-=: c ~ 0 80 / 300 3 .D c: 0 Q) ... 240 ~· Ci 0.60
(I) G> 180 ., > = 0 40
., CD ro 120.D ::J c
E 020 (I)
::J 60 ::J ()
0.00 ~ ~
0 0.00000 0.00030 000060 0.00090
mglkg-bw/day
For consumption scenario both tuna, comparison of A) daily mercury exposure (n =
10,000) and B) mean daily mercury exposure (n= 365).
126
127
VITA
Erica Lynette Holloman
I was born in Atlanta Georgia on May 8, 1977 to the proud parents, Catherine Smith and Willie Holloman. Since childhood, I knew that I wanted to be a scientist and began pursuing my scientific dreams early in life. I graduated from Riverwood High School in May 1995 and matriculated to Hampton University in Hampton Virginia that summer. I earned a B.S. in Marine and Environmental Science from Hampton University in December 1998. I received a M.S. in Biology with a concentration in Environmental Science from Hampton University in August 2001. I entered the doctoral program at the College of William & Mary, Virginia Institute of Marine Science (VIMS), School of Marine Science in August 2004. While at VIMS, I was in the department of Environmental and Aquatic Animal Health and my research program focused on Environmental Risk Assessment.