To download thesis - College of Agriculture, Biotechnology and
131
University of Nevada, Reno Spatial Patterns and Population Performance of Mule Deer: Responses to Water Provisioning in Mojave National Preserve, California A thesis submitted in partial fulfillment of the requirements for the degree of Master of Science in Natural Resources and Environmental Science by Cody J. McKee Dr. Kelley M. Stewart/Thesis Advisor May, 2012
Transcript of To download thesis - College of Agriculture, Biotechnology and

University of Nevada, Reno
Spatial Patterns and Population Performance of Mule Deer:
Responses to Water Provisioning in Mojave National Preserve, California
A thesis submitted in partial fulfillment of the
requirements for the degree of Master of Science in
Natural Resources and Environmental Science
by
Cody J. McKee
Dr. Kelley M. Stewart/Thesis Advisor
May, 2012

We recommend that the thesis
prepared under our supervision by
CODY J. MCKEE
entitled
Spatial Patterns And Population Performance Of Mule Deer: Responses To Water
Provisioning In Mojave National Preserve, California
be accepted in partial fulfillment of the
requirements for the degree of
MASTER OF SCIENCE
Kelley M. Stewart, Ph. D., Advisor
James S. Sedinger, Ph. D., Committee Member
Vernon C. Bleich, Ph. D., Committee Member
Thomas P. Albright, Ph. D., Graduate School Representative
Marsha H. Read, Ph. D., Dean, Graduate School
May, 2012
THE GRADUATE SCHOOL

i
THESIS ABSTRACT
There are four habitat components essential for vertebrate species: food, cover,
space, and water (Mackie 1981). In areas where water is limited, but those other 3
components are readily available, the provisioning of water is expected to benefit
populations of wildlife. Development of water sources in arid regions of the western
United States has been a common practice used by wildlife and range managers in both
state and federal agencies since the early 20th
century (Broyles 1995, Rosenstock et al.
2001, Krausman et al. 2006). As evidence of the considerable popularity of this practice,
water development programs were present in 10 of 11 state wildlife agencies in 1997,
accounting for over 6000 developed water sources (Rosenstock et al. 1999).
Despite widespread use of water developments in wildlife and range management,
few empirical studies have adequately evaluated the effects of those water sources on
wildlife ecology (Broyles 1995, Krausman et al. 2006, Cain et al. 2008). Broyles (1995)
questioned the utility of water developments, and further suggested the necessity,
benefits, and harmful side effects had not yet been evaluated. Conversely, others contend
that water developments provide intrinsic benefits to wildlife populations (Rosenstock et
al. 1999, Bleich 2005, Krausman et al. 2006). Although the provision of water for
wildlife has developed into a controversial topic, investigators agree that there is a need
for more experimental research evaluating the influence of water developments on
species ecology (Broyles 1995, Broyles and Cutler 1999, Rosenstock et al. 1999,
Krausman et al. 2006, Simpson et al. 2011).

ii
Over the last 2 decades, research evaluating the effects of water developments on
wildlife has increased (Krausman and Etchberger 1995, Broyles and Cutler 1999, Dolan
2006, Marshal et al. 2006a, Cain et al. 2008). None of those studies, however, have
conclusively determined the ecological benefits of anthropogenic water developments on
wildlife. In a study of desert sheep (Ovis canadensis nelsoni) in Arizona, USA, Broyles
and Cutler (1999) argued that desert sheep obtained adequate water to meet metabolic
demands from available forage and, thus, were not reliant on available free-water.
Nonetheless, Rosenstock et al. (2001) identified several flaws in their experimental
design and interpretation of data, and ultimately determined the conclusions of Broyles
and Cutler (1999) to be “useless.” Cain et al. (2008b) evaluated the response of desert
sheep to the removal of water developments and found little change in spatial patterns or
population performance. The results of that research were, however, confounded by cool
temperatures and above-average precipitation during the treatment (water-removal) phase
of their experiment (Cain et al. 2008). Other published literature has been mostly
subjective and the conclusions anecdotal (Dolan 2006).
Based on the lack of definitive results, a long-term, experimental study was
needed to account for factors such as environmental stochasticity encountered in Cain et
al.’s (2008b) research or the design flaws inherent in previous research (Broyles and
Cutler 1999, Rosenstock et al. 2001). The goal of my research was to identify the effects
of water developments on mule deer (Odocoileus hemionus) inhabiting a Mojave Desert
ecosystem. I focused my research efforts on those ungulates because many water
development projects are implemented to induce changes in their spatial patterns and
population performance (Broyles 1995, Krausman and Etchberger 1995, Dolan 2006,

iii
Cain et al. 2008). The results of my research could have profound implications for
wildlife management in desert ecosystems, as well as for water management in the west.
Mule deer (Odocoileus hemionus) are widely distributed throughout western
North America and occupy a variety of habitat types, including the Canadian boreal
forest, the Great Basin Desert, the Colorado Plateau, and the Mojave Desert (Wallmo
1981). The ability to adapt to extreme temperatures and precipitation gradients
distinguishes mule deer from many other species of ungulate (Wallmo 1981). In areas of
low habitat productivity, such as desert ecosystems, mule deer require large areas to
maintain viability of populations (Marshal et al. 2006b). Nutritional quality and
availability of forage (Rautenstrauch and Krausman 1989, Marshal et al. 2005), cover
(Ordway and Krausman 1986), natal sites (Fox and Krausman 1994), and availability of
free-standing water (Marshal et al. 2006a) are all used to assess suitability of those large
areas for long-term persistence of mule deer. During times of water scarcity, mule deer
are particularly reliant on the availability of free-standing water (Rautenstrauch and
Krausman 1989, Rosenstock et al. 1999). In arid regions and particularly during the hot-
dry season, the availability of permanent sources of water may be the most important
component of habitat for mule deer.
Spatial distributions of mule deer are intimately linked to availability of resources
on the landscape. Seasonal changes in space use due to changes in resource availability
have been documented in a variety of ungulate species including desert sheep (Cain et al.
2008) and desert mule deer (O.h. crooki; Relyea et al. 2000). During times of water
scarcity, typically the hot-dry season, water content of forage is also limited. Mule deer
have been reported to change distribution and home range to incorporate permanent

iv
sources of water during the hot-dry season (Rautenstrauch and Krausman 1989).
Conversely, when permanent water sources are unavailable, mule deer have been shown
to increase daily movements and home range size to locate sources of water (Hervert and
Krausman 1986), which is likely an expensive energetic allocation. Mule deer inhabiting
resource-limited environments exhibit larger home ranges and increased movements to
meet their energetic demands and, alternatively, they exhibit smaller home ranges and
decreased movements in environments with abundant resources (Ordway and Krausman
1986, Relyea et al. 2000, Marshal et al. 2006a, Bender et al. 2007). If water is a limiting
resource in desert landscapes inhabited by mule deer, then patterns of space use would be
influenced by changes in the availability of that resource.
Changes in density and distribution of ungulate populations are often linked to
changes to changes in body condition, productivity, and survival (McCullough 1979,
Eberhardt 2002, Cook et al. 2007, Bishop et al. 2009). Moreover, populations
constrained by density-dependent processes exhibit poor body condition, low
productivity, and low survival when at or near ecological carrying capacity (McCullough
1979, Kie et al. 1980, Stewart et al. 2005). The underlying mechanisms of population
dynamics dictating density dependence are driven primarily by the availability and
quality of resources on the landscape (Kie and White 1985, Stewart et al. 2002, Bender et
al. 2007, Bishop et al. 2009, Parker et al. 2009). Mule deer inhabiting desert ecosystems
occur at low densities with large ranges (Marshal et al. 2006b) presumably due to limited
availability of resources on the landscape (Marshal et al. 2005, Bender et al. 2007, Bleich
et al. 2010). If availability of permanent sources of water is limiting in desert
environments, then mule deer should reduce their effort spent acquiring free-water when

v
sources of permanent water are provided. Mule deer could then reallocate those efforts to
foraging, which could, ultimately, improve body condition, productivity, and survival.
In chapter 1, I evaluated movements, distribution, and resource selection (i.e.,
patterns of space use) of mule deer in response to provisioning of water developments in
Mojave National Preserve, California, USA from 2008-2011. I hypothesized that deer
would alter movements and distribution to improve access to permanent water,
particularly during times of water scarcity. I also hypothesized that proximity to
permanent water would be a significant component of resource selection by mule deer,
and that mule deer would exhibit selection for sites near those sources. I used general
linear models with random effects for individual mule deer to evaluate the influence of
water availability and season on daily movements and area of mule deer distributions. I
used nonlinear mixed-effects models to evaluate the importance of water in models of
resource selection by mule deer and to determine the magnitude of that water effect.
In chapter 2, I evaluated responses in body condition and traits of demography of
mule deer to provisioning of water developments. I hypothesized that mule deer with
improved access to permanent sources of water would exhibit greater body fat, greater
fetal rates, and higher survival than those in areas where water was limited. I used
general linear models to evaluate the influence of water availability and climatic
conditions on body condition. I then modeled the effects of water availability, body
condition, and climatic conditions on fetal rates using logistic regression. Finally, I used
the known fates package in Program MARK to evaluate the effects of water provisioning,
climatic conditions, and individual characteristics on survival patterns of mule deer and
to estimate monthly and annual probabilities of survival.
vi
LITERATURE CITED
Bender, L. C., L. A. Lomas, and T. Kamienski. 2007. Habitat effects on condition of doe
mule deer in arid mixed wood land-grassland. Rangeland Ecology and
Management 60:277-284.
Bishop, C. J., G. C. White, D. J. Freddy, B. E. Watkins, and T. R. Stephenson. 2009.
Effect of enhanced nutrition on mule deer population rate of change. Wildlife
Monographs 172:1-28.
Bleich, V. C. 2005. In my opinion: Politics, promises, and illogical legislation confound
wildlife conservation. Wildlife Society Bulletin 33:66-73.
Bleich, V. C., J. P. Marshal, and N. G. Andrew. 2010. Habitat use by a desert ungulate:
Predicting effects of water availability on mountain sheep. Journal of Arid
Environments 74:638-645.
Broyles, B. 1995. Desert wildlife water developments: Questioning use in the Southwest.
Wildlife Society Bulletin 23:663-675.
Broyles, B., and T. L. Cutler. 1999. Effect of surface water on desert bighorn sheep in the
Cabeza Prieta National Wildlife Refuge, southwestern Arizona. Wildlife Society
Bulletin 27:1082-1088.
Cain, J. W., P. R. Krausman, J. R. Morgart, B. D. Jansen, and M. P. Pepper. 2008.
Responses of desert bighorn sheep to removal of water sources. Wildlife
Monographs 171:1-32.

vii
Cook, R. C., T. R. Stephenson, W. L. Myers, J. G. Cook, and L. A. Shipley. 2007.
Validating predictive models of nutritional condition for mule deer. Journal of
Wildlife Management 71:1934-1943.
Dolan, B. F. 2006. Water developments and desert bighorn sheep: Implications for
conservation. Wildlife Society Bulletin 34:642-646.
Eberhardt, L. L. 2002. A paradigm for population analysis of long-lived vertebrates.
Ecology 83:2841-2854.
Fox, K. B., and P. R. Krausman. 1994. Fawning habitat of desert mule deer.
Southwestern Naturalist 39:269-275.
Hervert, J. J., and P. R. Krausman. 1986. Desert mule deer use of water developments in
Arizona. Journal of Wildlife Management 50:670-676.
Kie, J. G., D. L. Drawe, and G. Scott. 1980. Changes in diet and nutrition with increased
herd size in Texas white-tailed deer. Journal of Range Management 33:28-34.
Kie, J. G., and M. White. 1985. Population-dynamics of white-tailed deer (Odocoileus
virginianus) on the Welder Wildlife Refuge, Texas. Southwestern Naturalist
30:105-118.
Krausman, P. R., and R. C. Etchberger. 1995. Response of desert ungulates to a water
project in Arizona. Journal of Wildlife Management 59:292-300.
Krausman, P. R., S. S. Rosenstock, and J. W. Cain. 2006. Developed waters for wildlife:
Science, perception, values, and controversy. Wildlife Society Bulletin 34:563-
569.

viii
Mackie, R. J. 1981. Interspecific Relationships. Pages 487-507 in O. C. Wallmo, editor.
Mule and Black-tailed Deer of North America. University of Nebraska Press,
Lincoln, Nebraska, USA.
Marshal, J. P., V. C. Bleich, P. R. Krausman, M. L. Reed, and N. G. Andrew. 2006a.
Factors affecting habitat use and distribution of desert mule deer in an arid
environment. Wildlife Society Bulletin 34:609-619.
Marshal, J. P., P. R. Krausman, and V. C. Bleich. 2005. Rainfall, temperature, and forage
dynamics affect nutritional quality of desert mule deer forage. Rangeland Ecology
and Management 58:360-365.
Marshal, J. P., L. M. Lesicka, V. C. Bleich, P. R. Krausman, G. P. Mulcahy, and N. G.
Andrew. 2006b. Demography of desert mule deer in southeastern California.
California Fish and Game 92:55-66.
McCullough, D. R. 1979. The George Reserve deer herd: Population ecology of a K-
selected species. The University of Michigan Press, Ann Arbor, Michigan, USA.
Ordway, L. L., and P. R. Krausman. 1986. Habitat use by desert mule deer. Journal of
Wildlife Management 50:677-683.
Parker, K. L., P. S. Barboza, and M. P. Gillingham. 2009. Nutrition integrates
environmental responses of ungulates. Functional Ecology 23:57-69.
Rautenstrauch, K. R., and P. R. Krausman. 1989. Influence of water availability and
rainfall on movements of desert mule deer. Journal of Mammalogy 70:197-201.
Relyea, R. A., R. K. Lawrence, and S. Demarais. 2000. Home range of desert mule deer:
Testing the body-size and habitat-productivity hypotheses. Journal of Wildlife
Management 64:146-153.

ix
Rosenstock, S. S., W. B. Ballard, and J. C. Devos. 1999. Viewpoint: Benefits and impacts
of wildlife water developments. Journal of Range Management 52:302-311.
Rosenstock, S. S., J. J. Hervert, V. C. Bleich, and P. R. Krausman. 2001. Muddying the
water with poor science: a reply to Broyles and Cutler. Wildlife Society Bulletin
29:734-738.
Simpson, N. O., K. M. Stewart, and V. C. Bleich. 2011. What have we learned about
water developments for wildlife? Not enough! California Fish and Game 97:190-
209.
Stewart, K. M., R. T. Bowyer, B. L. Dick, B. K. Johnson, and J. G. Kie. 2005. Density-
dependent effects on physical condition and reproduction in North American elk:
an experimental test. Oecologia 143:85-93.
Stewart, K. M., R. T. Bowyer, J. G. Kie, N. J. Cimon, and B. K. Johnson. 2002.
Temporospatial distributions of elk, mule deer, and cattle: Resource partitioning
and competitive displacement. Journal of Mammalogy 83:229-244.
Wallmo, O. C. 1981. Mule and Black-tailed Deer Distribution and Habitats. Pages 1-25
in O. C. Wallmo, editor. Mule and Black-tailed Deer of North America.
University of Nebraska Press, Lincoln, Nebraska, USA.

x
DEDICATION
I dedicate this thesis to all who have a passion for wildlife and to those who
treasure the intrinsic beauty of the desert.

xi
ACKNOWLEDGEMENTS
I gratefully acknowledge financial and technical support from the National Park
Service, California Department of Fish and Game, Nevada Department of Wildlife,
University of Nevada in Reno, Safari Club International, the California Deer Association,
and the Boone and Crockett Club. I thank my thesis advisory committee K. Stewart, V.
Bleich, J. Sedinger, and T. Albright for guidance and many helpful comments of this
manuscript. I thank N. Darby and D. Hughson of the National Park Service, as well as B.
Pierce, K. Monteith, T. Stephenson, and B. Gonzalez of California Department of Fish
and Game for field and methodological assistance. I also thank technicians N. Simpson,
C. Morris, D. Gonzalez, T. Brown, J. Zweifel, I. Knight, J. Saenz, and numerous
volunteers who helped collect data used in this thesis. All capture and handing of mule
deer were compliant with procedures outlined by the California Department of Fish and
Game, were approved by the University of Nevada Reno’s Institutional Animal Care and
Use Committee (IACUC: 00058), and were consistent with the guidelines established by
the American Society of Mammalogists for care and use of wild mammals in research
(Gannon et al. 2007).

xii
TABLE OF CONTENTS
1Chapter 1. Patterns of Space Use by Mule Deer in Response to Experimental
Water Provisioning in a Burned Mojave Desert Landscape .........................................1
Abstract ....................................................................................................................2
Introduction ..............................................................................................................3
Methods..................................................................................................................10
Results ....................................................................................................................19
Discussion ..............................................................................................................24
Conclusions ............................................................................................................32
Acknowledgements ................................................................................................33
Literature Cited ......................................................................................................34
Tables .....................................................................................................................44
Figure Legends.......................................................................................................52
Figures....................................................................................................................56
Chapter 2. Population Performance of Mule Deer: Responses in Demography to
Experimental Water Provisioning in a Mojave Desert Ecosystem .............................66
Abstract ..................................................................................................................67
Introduction ............................................................................................................68
Methods..................................................................................................................74
1 This thesis is composed in accordance to University of Nevada, Reno’s Alternative Formatting for Thesis
or Dissertation, in which the following two chapters are being published concurrently with the submission
of this thesis.

xiii
TABLE OF CONTENTS (continued)
Results ....................................................................................................................81
Discussion ..............................................................................................................84
Acknowledgements ................................................................................................90
Literature Cited ......................................................................................................91
Tables ...................................................................................................................101
Figure Legends.....................................................................................................105
Figures..................................................................................................................107
Thesis Summary .............................................................................................................113
Literature Cited ....................................................................................................115

1
SPACE USE PATTERNS OF MULE DEER IN RESPONSE TO EXPERIMENTAL
WATER PROVISIONING IN A BURNED MOJAVE DESERT LANDSCAPE
Cody J. McKee1*
, Kelley M. Stewart1, James S. Sedinger
1, Vernon C. Bleich
1, and Neal
W. Darby2
1Department of Natural Resources and Environmental Science, University of Nevada-
Reno, 1664 N. Virginia Street, Reno, Nevada 89557, USA
2National Park Service, 2701 Barstow Road, Barstow, California 92311, USA
*Correspondence author. E-mail: [email protected]

2
1ABSTRACT
Providing permanent water to habitats that are water-limited has been assumed to provide
both practical and intrinsic benefits to wildlife populations in arid regions of the western
United States. Recent studies attempting to delineate costs and benefits of providing
permanent water to wildlife have been inconclusive due to a variety of confounding
factors. We investigated the effects of water provisioning and natural wildfire on patterns
of space use by mule deer (Odocoileus hemionus) in 3 study areas (i.e., control area,
water-provided area, and water-limited area) of Mojave National Preserve, California,
2008-2011. We used general linear models to evaluate differences in daily movements
and area of 95% and 50% utilization distributions (UDs) of 39 mule deer in response to
water provisioning. We also used nonlinear mixed-effects models to evaluate the
importance of permanent water in selection of resources of 40 mule deer. We detected
differences among study areas in daily movements, area of the 95% UD, and area of the
50% UD. Pairwise comparisons indicated daily movements were similar in the water-
provided area and water-treatment area but significantly less than the control area. Area
of the 95% and 50% UD were significantly smaller in the water-provided area than both
the water-limited area and control area. We found use of water to be important in models
of resource selection among the 3 study areas but the use of that resource in the water-
provided area was influenced by wildfire disturbance. Our results suggest wildfire has
confounded our ability to detect an effect of water-provisioning and may also explain, in-
part, the differences observed in UDs of mule deer among the 3 study areas. Wildfire 1 The plural pronoun “We” will be used instead of “I” for the remainder of this thesis to indicate other
authors in the two manuscripts submitted for publication.

3
often promotes the regeneration of high-quality forage to mule deer, which likely
contains higher content of preformed water. Mule deer in the water-provided area may
be able to meet both their nutritional and hydration needs while foraging in areas
disturbed by wildfire, reducing the overall importance of access to sources of permanent
water. We urge future investigators to consider multiple landscape-level effects when
evaluating spatial patterns of species in arid environments.
Key Words: California, daily movement, Mojave Desert, Odocoileus hemionus,
resource selection, utilization distribution, wildfire, water developments
INTRODUCTION
Development of water sources in arid regions of western North America has been
a widely implemented management tool by state and federal wildlife agencies since the
1940s (Broyles 1995, Rosenstock et al. 2001, Krausman et al. 2006). Over the last 2
decades, a fervent dispute regarding the realized benefits of these developments on
ecology of desert wildlife has become firmly rooted in the field of wildlife management
(Broyles 1995, Broyles and Cutler 1999, Rosenstock et al. 1999, Krausman et al. 2006).
Studies evaluating the influence of water developments on wildlife have been
inconclusive and confounded by issues with experimental design (Broyles and Cutler
1999; see Rosenstock et al. 2001), were based on subjective information (Dolan 2006),
postulated a lag effect in response to water provisioning (Marshal et al. 2006a), and
experienced cool and wet years after removal of water sources (Cain et al. 2008b). Each

4
of these authors suggested further research is needed to adequately evaluate the influence
of water source developments on ecology of desert wildlife.
The goal of development of water sources for wildlife is to provide a resource in
landscapes perceived to be water-limited. Use of such developments by targeted wildlife
has been the most common measure of success utilized by practitioners (Simpson et al.
2011). Several studies have documented use by wildlife at these water sources yet were
unable to determine the effects of these resources on movements, distribution, or
population performance (Krausman and Etchberger 1995, Marshal et al. 2006a, Cain et
al. 2008b). Nonetheless, claims of poor quality of water, entrapment, increased
predation, and competition (Broyles 1995, Rosenstock et al. 1999, Krausman et al. 2006)
have been largely unsubstantiated (Andrew et al. 2001, Bleich et al. 2006, Simpson et al.
2011). Although the negative effects of water developments have been largely dismissed,
positive influences of water developments on population performance of wildlife have
not been identified, aside from increased abundance and distribution of various ungulate
and upland game bird species (Rosenstock et al. 1999). Addressing the anticipated
benefits of water developments on distribution and range, resource preferences, and
population performance would provide a better understanding of the overall utility of
water developments for wildlife (Simpson et al. 2011).
Despite recognition of the various issues confounding the investigation of water
developments on wildlife, even the most robust experimental designs have not been
resilient to stochastic events that are frequently encountered in large-scale ecological
studies (Douglas and Leslie 1986, Oehler et al. 2003, Cain et al. 2008b). Unfortunately,
the potential impacts of ecological conditions on results are often considered post hoc.

5
The capability to identify these phenomena a priori would provide a more robust
approach to addressing issues surrounding complex ecological relationships, such as the
role of water developments in the ecology of desert wildlife.
In addition to increasing availability of permanent water in arid environments,
several authors suggest fire could improve habitat of ungulate populations across western
North America (Wallmo et al. 1981, Rogers et al. 2004), particularly in fire-adapted
ecosystems (Tiedemann et al. 2000, Bleich et al. 2008, Long et al. 2008). Many
experimental studies investigating the influence of fire on ungulate populations involve a
mosaic of burned and unburned habitats created by small prescribed fires, with the goal
of stimulating growth of high-quality herbaceous forage (Ruthven et al. 2000, Long et al.
2008, Meek et al. 2008). Nevertheless, the influence of large wildfires on ungulate
populations is under-represented in the current body of literature (Holl et al. 2004, Bleich
et al. 2008, Biggs et al. 2010), especially in desert ecosystems. The response of ungulates
to wildfire in a water-limited ecosystem is speculative and, in regions that have
experienced both wildfire activity and development of water sources, individuals may
select for areas that maximize allocation of water and forage of high productivity.
Alternatively, ungulates in these conditions may exhibit a preference for areas with
access to high quality forage or a preference for areas with access to permanent water.
Certainly, trade-offs associated with selection of resources have been documented in
desert ungulates, such as the Sonoran pronghorn (Antilocapra americana sonoriensis),
which have been reported to select forage with high preformed water content but of low
nutritional quality (Fox et al. 2000). Variation in selection of resources by ungulates to
maximize nutrient intake in a burned landscape could confound experimental results and

6
lead to difficulties in interpretation of the responses of those animals to the development
of permanent sources of water.
Mule deer (Odocoileus hemionus) are widely distributed throughout western
North America and occupy a variety of habitat types, including the Canadian boreal
forest, the Great Basin Desert, the Colorado Plateau, the Mojave Desert, and the Sonoran
Desert (Wallmo et al. 1981). Indeed, the ability to adapt to extreme temperatures and
precipitation gradients distinguishes mule deer from other ungulates (Wallmo et al.
1981). In areas of low productivity, such as desert ecosystems, mule deer require large
areas to maintain viable populations (Bleich 2005, Marshal et al. 2006c). Characteristics
commonly used to assess suitability of habitat for mule deer are nutritional quality and
availability of forage (Rautenstrauch and Krausman 1989, Marshal et al. 2005a), cover
(Ordway and Krausman 1986), natal sites (Fox and Krausman 1994), and availability of
free-standing water (Marshal et al. 2006a). During times of water scarcity, mule deer are
especially reliant on permanent sources of water (Rautenstrauch and Krausman 1989,
Rosenstock et al. 1999). In arid regions, particularly during the hot-dry season, water
may be the most important component of habitat for mule deer.
We evaluated movement patterns and resource selection of mule deer in response
to provisioning of permanent sources of water in a Mojave Desert ecosystem. We were
also interested in the influence of a large-scale wildfire on those responses. Our goal was
to determine the relative importance of permanent water on spatial patterns of mule deer
inhabiting a burned ecosystem. We hypothesized that deer will alter movements to
improve access to permanent water, particularly during times of water scarcity such as
the summer season. Thus, we predicted that individuals will exhibit restricted
7
movements and smaller utilization distributions (UD) where access to water is highest
and that those metrics would vary by season. Additionally, we hypothesized that
proximity to permanent water will be a significant component of resource selection by
mule deer, and that they will exhibit selection for sites near those sources. We suspected,
however, that use of permanent water may be confounded by severity of wildfire. We
also predicted that access to water and wildfire severity, where applicable, would be
significant parameters in competitive models of resource selection by mule deer.
STUDY AREA
We studied a population of mule deer in Mojave National Preserve (hereafter
Mojave) in San Bernardino County, California, USA (35°00´N, 115°28´W) from January
2008 until March 2011. The general boundaries of Mojave are delineated on the north by
Interstate Highway 15, on the south by Interstate Highway 40, and on the east by the
California-Nevada state border (Fig 1). Mojave encompass nearly 650,000 ha and
includes components of 3 of the 4 major desert ecosystems of North America: the
Mojave, the Sonoran, and the Great Basin (National Park Service 2011). The overlap of
these desert ecosystems has created a heterogeneous landscape characterized by distinct,
rugged, mountain ranges composed of granite, basalt, and igneous rock separated by
bajadas, playas, and dunes with elevations ranging from 270 m to 2400 m (Thorne et al.
1981). We concentrated our research efforts in the Cima Dome, Mid Hills, and New
York Mountain regions of eastern Mojave (Fig. 1)

8
The climate of Mojave is representative of the arid southwestern USA. However,
wide temperature and precipitation gradients occur between low and mid- to upper-
elevations. Maximum temperatures at low elevations average 40.5°C in summer and
19°C in winter (Desert Studies Center 2011). Temperatures at mid- to upper-elevations
are more moderate in the summer with mean maximum temperatures of 33°C and mean
maximum temperatures of 13°C in the winter (United States Geological Survey 2010).
Precipitation patterns are distinctly bi-modal with a cool season peak occurring during
winter and a warm season peak occurring during the summer (Fig. 2). Mean annual
precipitation at low elevation sites is 8.5 cm (1980-2005, Soda Springs, northern
Mojave), while mean annual precipitation at mid- to upper-elevation sites is 27 cm (1958-
1996, Mitchell Caverns Natural Preserve, southern Mojave).
We delineated seasons with a climograph (Stewart et al. 2002) developed from
historical temperature and precipitation patterns collected at Mitchell Caverns Natural
Preserve in southern Mojave from 1958-1996. The Mitchell Caverns weather station was
ideal for our research objectives because it provided a long-term dataset of climatic
conditions at a similar elevation to our study sites (1,300 m) and experienced similar
weather phenomena. We identified four seasons as follows: winter (cool, wet) began
approximately 1 December and lasted until 31 March, spring (warm, dry) began 1 April
to 31 May, summer (warm, wet) began around 1 June and lasted until 31 September, and
autumn (cool, dry) began 1 October to 30 November (Fig. 2).
Vegetation communities vary by elevation and precipitation gradient in Mojave.
Creosote bush (Larrea tridentate) was abundant in low elevation bajadas and valleys.
Mid-elevations <1,600 m with shallow, rocky, soils were characterized by cholla cactus

9
(Opuntia spp.), barrel cactus (Ferocactus spp.), blackbush (Coleogyne ramosissima),
Spanish bayonet (Yucca spp.) and Joshua tree woodlands (Yucca brevifolia; Thorne et al.
1981). Mid-elevations >1,600 m contained Great Basin sagebrush (Artemesia
tridentata), Utah juniper (Juniperus osteosperma), and pinyon pine (Pinus spp.; Thorne
et al. 1981). White fir (Abies concolar) communities were present in the upper elevations
(>1,800 m) of 2 mountain ranges (Clark Mountain and New York Mountains).
Various natural and developed sources of permanent water were present and
available to mule deer before initiation of our research activities (Fig. 1). Natural and
developed springs were predominately found in the New York Mountains and the Mid
Hills, while water availability on Cima Dome was limited primarily to ground-water
wells with above-ground catchments. Depending on climatic conditions, ephemeral
springs, seeps, and tenajas can provide additional sources of water during winter, spring,
and early summer. Wildlife documented to use permanent sources of water in Mojave
include mule deer, desert tortoise (Gopherus agassizii), spotted skunk (Spilogale
gracilis), mountain lion (Puma concolar), and Gambel’s Quail (Callipepla gambelii; N.
Darby, unpublished data).
On 22 June 2005, a series of lightning strikes sparked several wildfires, occurring
primarily in the Mid Hills area of Mojave. By 23 June 2005, these wildfires merged to
form the Hackberry Complex Fire, which burned 28,700 ha (Fig. 1). The Hackberry
Complex Fire created large expanses of sparsely vegetated desert habitat with few
unburned remnant patches (Fig. 3). Many of the dominant species of vegetation in the
pre-burned landscape (e.g. Utah juniper, Great Basin sagebrush, and barrel cactus) will
take many decades to reestablish. Nevertheless, other native species including annual

10
and perennial herbaceous vegetation such as globemallow (Sphaerelcea spp.) and four
o’clock (Mirabilis spp.), as well as some perennial shrubs, including bitterbrush (Purshia
tridentata var. glandulosa) and desert almond (Prunus fasciculata), now dominate the
post-fire landscape.
METHODS
Experimental Design
Mojave was primarily administered as livestock rangeland before designation as a
unit of the National Park Service. During early settlement, numerous ground-water wells
with above-ground catchments were developed to provide water for domestic livestock
and homesteads. Most of these wells were instituted in the early 20th century. Not only
did those developments provide a reliable source of water for livestock, they were also
used by wildlife. After establishment of Mojave National Preserve (United States
Congress 1994), many livestock wells were allowed to become inactive, effectively
removing a permanent source of water for many species of wildlife.
We divided the central region of Mojave, where the overlap of mule deer and
presence of wells (both active and inactive) was highest, into 3 study areas. Study area 1,
Cima Dome, did not experience well deactivation. Those sources of permanent water
have been available to mule deer since before the establishment of Mojave (hereafter
control area). In study area 2, Mid Hills, deactivated livestock wells were reactivated in
the fall of 2008 (hereafter water-provided treatment). In study area 3, New York
Mountains, livestock wells were not reactivated (hereafter water-limited treatment).

11
Additionally, we added exclusionary fencing around the majority of permanent springs in
the water-limited area to prevent access by mule deer but allowed for access by other
wildlife. We investigated the response in movements and habitat selection patterns of
mule deer in the three areas by comparing results among study areas, seasons, activity
period (i.e., crepuscular hours and resting hours), and wildfire disturbance.
Animal Capture and Handling Procedures
We captured adult female mule deer during the winter or spring of each year of
our study. Each individual was caught with a net-gun fired from a helicopter (Krausman
et al. 1985a). We selected only one adult female per social group when conditions
permitted. We transported captured individuals to a central processing location where
they were fitted with Global Positioning System (GPS) radiocollars (Wildlife GPS
Datalogger, Sirtrack, Havelock North, New Zealand) and were marked uniquely with ear-
tags. We programmed each GPS collar to obtain one location every 1.5 hours (up to 16
locations per day) using GPS satellites and to remotely release from the deer
approximately 1 year after deployment. A Very High Frequency (VHF) radio signal was
incorporated into the design of each collar to allow for the immediate collection of
dropped GPS radiocollars by ground crews. When the capture location was less than 1
km from the processing location, we released individuals from the central processing site.
We transported individuals back to the capture location via vehicle or helicopter when it
was greater than 1 km from the central processing site.

12
Individual Heterogeneity
We derived multiple data points related to patterns of movements, distribution,
and selection of resources for each individual mule deer in Mojave. We anticipated that
those data would vary among individuals and that multiple data points from the same
individual would be correlated (Gillies et al. 2006, Duchesne et al. 2010). We therefore
incorporated a random effect for telemetered mule deer into all models of spatial patterns
and resource selection, which accounted for variation in the magnitude of response of
individuals in those models and, ultimately, designated the individual as the sample unit
(Gillies et al. 2006). Although we were interested in population-level responses to our
water-provisioning experiment, incorporating a random effect for individual mule deer
effectively controlled for psuedoreplication and incorporated the overall contribution of
variation by individual level differences in our analyses.
Patterns of Movement
We imported locations from GPS radiocollars into a GIS (ArcGIS 9.3,
Environmental Systems Research Institute [ESRI], Redlands, California, USA) for
calculation of movement parameters. We used the Hawth’s Analysis Tools extension
(Beyer 2004) to connect consecutive GPS locations with a straight-line and calculate
distance moved between locations. We then summed straight-line segments to obtain
distance traveled per day (km) for each animal. We also used the Hawth’s Analysis
Tools extension (Beyer 2004) to calculate the 95% and 50% fixed kernel density (kde)
estimates as a metric for estimation of area of an individual’s utilization distribution
among seasons (UD; Worton 1989, Seaman and Powell 1996). We used the area (ha) of

13
the 95% kde to represent an individual’s entire UD and area of the 50% kde to represent
an individual’s core area of use. We implemented least-squares cross-validation to
estimate the smoothing parameter (h) of our kernel density estimates (Worton 1989,
Seaman and Powell 1996, Seaman et al. 1999).
We assessed distributions of movement data for normality (SAS Institute 9.2,
Cary, NC) and performed a natural log transformation on both UD and daily movements.
We used a mixed-effects analysis of variance (hereafter ANOVA) to evaluate differences
in movement patterns of mule deer among study areas and seasons, in addition to an
interaction between both of those main effects (PROC MIXED; SAS 9.2, Cary, NC). We
evaluated homoscedasticity of errors of independent variables and distribution of model
residuals for level 1 (random) and level 2 (main) effects using the SAS 9.2 macro
MIXED_DX (Bell et al. 2010). We did not include a year effect in our ANOVA because
logistical constraints resulting from a total helicopter crash during 2010 prevented
collection of representative samples of individuals from each study area, and limited our
power to detect differences among years (control area: 2 individuals, water-provided
treatment area: 11 individuals, water-limited area: 2 individuals). As a result, only one
year (2009) contained representative samples of individual mule deer from each study
area. We employed the least-squared means procedure to evaluate pairwise differences
in movement patterns. For this analysis, variation among study areas were interpreted as
variation among treatment applications.

14
Resource Selection
We were first interested in identifying patterns of high and low activity that may
be influencing resource selection by mule deer. We expected seasonal climatic
conditions and photoperiod to influence these activity patterns and ultimately the
selection of resources. Mule deer are most active during crepuscular hours when
availability of resources is assumed to be a strong predictor of habitat selection (Johnson
et al. 2000). During periods of low activity, mule deer may use landscape features
unrelated to foraging or free-water acquisition such as accessing thermal refugia (Cain et
al. 2006, Cain et al. 2008a) or predator avoidance (Geist 1998). Consequently, access to
permanent sources of water may be more important during periods of high activity than
during periods of low activity. Although errors in GPS locations were small (i.e. missed
GPS fixes), we divided distances moved between consecutive locations by the number of
hours elapsed between the two locations to obtain a movement rate (m/h; Cain et al.
2008b). We then calculated the mean of movement rates ( x ± SE) by hour during the 24
hour cycle to identify periods of high activity (hereafter active) and periods of low
activity (hereafter resting). Lastly, we assigned activity period (i.e., active or resting) to
each location by visually identifying the times of day, by season, when animals are most
active and least active.
We then developed a resource selection probability function (hereafter RSPF) to
determine if resources were being used disproportionately to availability (Manly et al.
2002). We were not interested in building a predictive map from the resulting RSPF, but
we were interested in understanding the relative effects of resources on likelihood of
mule deer use. We evaluated resource selection by mule deer among the 3 study areas

15
(hereafter global dataset) and explicitly within the water-provided treatment area
(hereafter watered dataset). This approach allowed us to investigate general patterns of
resource selection across the entire Mojave region, as well as conditions that were
specific to the water-provided study area (i.e. presence of springs, catchments, and
wildfire). We subsampled GPS location data from individual mule deer by randomly
selecting a single GPS location per day by assigned activity period to minimize spatial
autocorrelation (Stewart et al. 2002). We limited our dataset to used locations occurring
between 1 October 2008, coinciding with the activation of water-developments, and 31
March 2011, the most recent date that deployed collars released from animals. We
subsequently evaluated selection of resources from 21,487 used locations collected from
40 individuals in the global dataset and 9,803 used locations from 20 individuals in the
watered dataset.
We evaluated resource selection within an individual’s UD (3rd
order selection;
Johnson 1980) because mule deer in Mojave were constrained to habitable mountain
ranges that are separated by low elevation bajadas, playas, and sand dunes (i.e. 1st and 2
nd
selection decisions would be based on availability of suitable mountain ranges; Johnson
1980). Furthermore, evaluation of UDs prior to analyses indicated that landscape
placement was strongly associated to those mountain ranges, as well as sources of
permanent water. We were explicitly interested in how individual mule deer used those
water sources within their UD rather than the general placement of their UD. We
therefore expected 3rd
order selection patterns by mule deer to be the most impacted by
the supplementation of water sources. To quantify available resources within an
individual mule deer’s UD, we buffered used locations by the mean distance traveled per

16
day for each study area and season. This procedure bounds the distribution of available
resources at a used location by the distance an individual may travel in a given day
(Boyce et al. 2003, Johnson et al. 2006). We then matched used locations with two
random locations from the bounded distribution of available resources to represent
resource availability in our models of selection (Boyce et al. 2003, Johnson et al. 2006).
We estimated the spatial error of locations by placing GPS collars in a known location for
approximately 7 days, which was approximately 15 m. We subsequently buffered used
and available locations by 15 m to reduce the effects of spatial error in our analysis of
resource selection (Rettie and McLoughlin 1999).
We used a GIS to calculate landscape metrics expected to influence selection of
resources at a 10 m x 10 m pixel resolution (Table 1). In accordance with our
hypotheses, we included predictive covariates relating distance of used and available
locations to nearest source of permanent water, as well as distance to water catchments
and distance to springs. We delineated between types of water source because the water-
provided area contained multiple springs before and during our research activities in
Mojave. We suspected that the importance of springs in the area would provide insight
into the overall importance of free water to mule deer if there was a lag effect by mule
deer in response to activation of water catchments, documented by Marshal et al.
(2006b). To quantify the effect of anthropogenic activity, we calculated the distance
from used and available locations to maintained roads (i.e., high volume of traffic) and
unmaintained roads (i.e., low volume of traffic). We evaluated the importance of the
abiotic predictors, elevation, slope, ruggedness (Sappington et al. 2007), east-west aspect
(aspect transformed by sine function), and north-south aspect (aspect transformed by

17
cosine function) calculated from a Digital Elevation Model (DEM; United States
Geological Survey 2011) at used and available locations. We determined a coarse habitat
type from land cover data obtained from the United States Geological Survey (USGS;
Thomas et al. 2002). To better understand the influence of the Hackberry Complex
wildfire on resource selection in the water-provided treatment area, we included 4
categorical variables related to wildfire severity, i.e. unburned, low severity, moderate
severity, and high severity, which were based on changes in biomass, soil exposure, and
byproducts of fire (Monitoring Trends in Burn Severity 2010). Finally, we included 4
categorical variables representing winter, spring, summer, and autumn season to evaluate
seasonal differences in selection of resources.
We assessed explanatory variables for normality and implemented natural
logarithmic and arcsine square root data transformations when appropriate (Zar 2010).
We also evaluated correlations between variables (PROC CORR; SAS Institute, Cary,
NC) and when 2 variables were correlated we removed one of highly correlated variables
(r > |0.60|; Long et al. 2008) from our models of resource selection. Distance of
locations to water catchments and distance of locations to springs were strongly and
positively correlated in in the control area and strongly and negatively correlated in the
water-limited treatment area. As a result, we modeled only the proximity of mule deer
locations to nearest source of permanent water when evaluating our global dataset. We
investigated the importance of springs and catchments, in addition to wildfire severity, in
the water-provided treatment area only. Finally, we standardized covariates prior to
model evaluation (Zar 2010).

18
We developed a candidate set of a priori models of resource selection (22 models
in each dataset) and implemented mixed-effects logistic regression (Boyce et al. 2003,
Fortin et al. 2009, Duchesne et al. 2010) to analyze the validity of the hypothesized
relationships among model parameters and the probability of use. We included only
parameter’s known to be meaningful from previous research or from our observations in
the field as additive effects, fixed effects, and interactions (Boyce et al. 2003). We used
non-linear mixed models (PROC NLMIXED; SAS Institute, Cary, NC), which
implements adaptive Gaussian quadrature to maximize the true likelihood of model
parameters (Pinheiro and Bates 1996, Duchesne et al. 2010). The implementation of
mixed-effects models also allowed us to control for heterogeneity in resource availability
among individuals (Gillies et al. 2006, Duchesne et al. 2010). Akaike’s Information
Criterion (AIC; Akaike 1973, Anderson et al. 2000) was used to evaluate model support.
Models with the lowest AIC score were designated as the most parsimonious. We
evaluated AIC weights (wi) and parameter estimates (βi) of any model within 2 AIC units
of the most parsimonious model to determine the best supported model because Akaike’s
underlying formula incorporates a 2-unit penalty for each model parameter (Akaike
1973). The estimates of βi from the top-ranked models of resource selection were used to
determine the direction and magnitude of influence (+/-) of model parameters. We
determined significance of those estimates by evaluating 95% confidence intervals.
Confidence intervals of βi that did not over-lap zero were determined to be a significant
component of resource selection by mule deer.

19
RESULTS
Patterns of Movement
We evaluated patterns in daily movement and UD of 39 mule deer consisting of
11 individuals from the control area, 20 individuals from the water-provided treatment
area, and 8 individuals from the water-limited treatment area. We detected differences
among treatment areas (F2,36 = 6.87, P < 0.003), season (F3,84 = 11.26, P < 0.001), and
treatment× season (F6,84 = 24.87, P < 0.001) for daily distance traveled by mule deer in
Mojave. In general, mule deer in the control area moved longer distances than mule deer
in both treatment areas, while daily movements of mule deer in the water-provided area
and water-limited areas were similar (Fig. 4). For area of the 95% UD, we identified
differences among treatment areas (F2,36 = 17.15, P < 0.001) and seasons (F3,83 = 9.03, P
< 0.001) but not treatment × season (F6,83 = 1.25, P = 0.290; Table 2). Mule deer in the
control area had the largest 95% UD among all seasons, followed by mule deer in the
water-limited area, while mule deer in the water-provided area exhibited the most
restricted 95% UD among seasons (Fig. 5a). We detected differences in area of the 50%
core UD among treatment areas (F2,36 = 13.71, P < 0.001) and among seasons (F3,83 =
10.97, P < 0.001) but not treatment × season (F6,83 = 1.43, P = 0.213; Table 2). Area of
the 50% core UD was smallest in the water-provided area, during all seasons, while areas
of the 50% core UD in the control area and water-limited area were similar among each
area and season, but consistently larger than the 50% core UD of the water-provided area
(Fig. 5b).

20
Patterns of activity by hour indicated distinct segregation of periods of active and
resting behavior during each season. Peak activity occurred during the early morning and
late evening hours. Mule deer generally exhibited moderate levels of activity throughout
the night and the most restricted levels of activity during the middle of the day (Fig. 6).
Movements were similar at mid-day and at mid-night during winter only (Fig. 6d).
Length of photoperiod influenced the duration of crepuscular behavior. During the
spring and summer, when length of photoperiod was maximum, we identified active
behavior as movements occurring 06:00-09:00 and 20:00-23:00 PDT and resting
behavior as those movements occurring 11:00-19:00 PDT (Fig. 6a and c). During
autumn and winter, when duration of photoperiod was minimized, we identified active
behavior as movements occurring 07:00-10:00 and 18:00-21:00 PST and resting behavior
as movements occurring 11:00-17:00 PST (Fig. 6b and d). We incorporated those
periods of resting and active behavior into subsequent models of resource selection by
mule deer in Mojave.
Resource Selection
Our top-ranked model of resource selection for adult female mule deer identified
from the global dataset (control: n = 12, water-provided: n = 20, water-limited: n =8)
contained effects of water, roads, ruggedness, elevation, slope, and included fixed effects
of treatment area, habitat type, and season, as well as a two-way interaction between each
covariate and treatment area (wi = 0.60; Table 3). Additionally, all supported models
contained a random effect of individual mule deer in our analysis (Table 3). The second
ranked model (wi = 0.33) from the global dataset contained an additional fixed effect of

21
activity period but evaluation of the parameter estimate for this effect indicated activity
did not substantially influence selection of resources (βi = 0.015, 95% CI = -0.020–0.050;
Table 3). The final model of resource selection containing support from the global
dataset included all parameters from the top model, as well as additional interactions
among east-west aspects and treatment area and among north-south aspects and treatment
area (wi = 0.07; Table 3). Further evaluation of parameter estimates indicated that neither
the additive effects of the northness of aspect (β = -0.022, 95% CI = -0.053–0.008) or
westness of aspect (βi = -0.017, 95% CI = -0.047–0.014) nor an aspect×area interaction
(northness×water-provided: βi = 0.036, 95% CI= -0.004–0.077; northness×water-limited:
βi = -0.002, 95% CI = -0.049–0.077; westness×water-provided: βi = 0.003, 95% CI= -
0.038–0.043; westness×water-limited: βi = 0.018, 95% CI = -0.028–0.066) were
significant determinants of resource selection. Models investigating an influence of
season on selection of covariates in the global dataset were not supported (ΔAIC =
2109.22; Table 3). We were unable to detect a significant influence of a two-way
interaction of activity period and selection of resources (ΔAIC = 2283.20; Table 3).
The top ranked model of resource selection for mule deer in the watered dataset
included a two-way interaction among wildfire severity and all landscape covariates
identified as significant predictors of resource selection in the global dataset (i.e. roads,
elevation, ruggedness, and slope), as well as proximity to water by type of water source
(wi = 0.64; Table 4). The top model also included fixed effects of season and habitat
type, in addition to a random effect of individual mule deer (Table 4). The second-
ranked model contained all parameters from the top model plus a fixed effect of activity
period and was the only other model to receive support (wi = 0.36; Table 4). Models of

22
selection containing the interactions between covariates and season (ΔAIC = 440.82) or
covariates and activity period were not supported (ΔAIC = 485.94; Table 4). The best-
competing model containing only proximity to nearest water source, not water source by
type, was also not competitive (ΔAIC = 35.82; Table 4), which supported our delineation
of type of water source in models of selection in the watered dataset.
Parameter estimates from the top model in the global dataset indicated mule deer
selected sites closer to sources of permanent water than at random in all 3 study areas of
Mojave (Table 5). Mule deer in the water-limited treatment area and individuals in the
control area displayed a higher probability of selecting for sites near sources of
permanent water, while individuals in the water-provided area displayed weaker selection
for these sites (Fig. 7a). Probability of use by mule deer increased as distance to
maintained roads increased, while the negative effect of main roads was the strongest on
individuals in the control area and weakest on individuals in the water-provided area (Fig.
7b). Mule deer in the control area and water-limited area avoided unmaintained roads,
while individuals in the water-provided area displayed neither selection nor avoidance of
roads of this classification (Fig. 7c). We detected a significant, positive relationship
between probability of use and landscape ruggedness in Mojave, although the magnitude
of effect was strongest in the control and water-limited area and weakest in the water-
provided area (Fig. 7d). Mule deer selected lower elevations and steeper slopes in the
control area and water-limited area but selected higher elevations and no selection of
slope in the water-provided area (Fig. 7e and f). We detected an overall negative effect
of the summer season on resource selection but only when compared to the winter (βi = -
0.066, 95% CI = -0.113– -0.014). Overall, mule deer in Mojave exhibited selection for

23
desert washes, Joshua tree woodlands, and pinyon woodlands and avoidance of black
brush and Great Basin sagebrush communities (Table 5).
Wildfire severity exhibited a strong influence on resource selection in the watered
dataset, particularly on selection of water sources (Table 6). The slope of the response by
mule deer to the presence of springs (βi = -0.368, 95% CI = -0.446– -0.289) was steeper
than the slope of the response to catchments (βi = -0.228, 95% CI = -0.302– -0.153) but
only in undisturbed sites (Fig. 8a). In low severity wildfire areas and in moderate
severity wildfire areas, mule deer exhibited little preference for either springs or
catchments (Figs. 8b and c), although the parameter estimate for catchment×moderate
wildfire interaction overlapped zero (βi = 0.087, 95% CI = -0.010–0.184). The influence
of high severity wildfire on selection of catchments (βi = -0.258, 95% CI = -0.871–0.356)
or selection of springs (βi = -0.413, 95% CI = -0.911–0.086) was not different than
selection for these sources of water in unburned areas.
For the remaining parameters of models of resource selection in the watered
dataset, mule deer avoided maintained and unmaintained roads in areas disturbed by
wildfire (Table 6). Wildfire severity did not change the response of mule deer to
elevation. Animals preferred higher elevations regardless of wildfire severity (βi = 0.541,
95% CI = 0.469–0.613; Table 6). Mule deer preferred less rugged terrain in unburned
areas, but exhibited no preference for landscape ruggedness in sites burned at moderate to
low severity (Table 6). Individuals preferred gentle slopes in unburned areas but
exhibited negligible preference for slopes in areas burned at low or moderate severity
(Table 6). Summer imposed an overall negative effect on likelihood of selection but only
in relation to winter (βi = -0.150, 95% CI = -0.227– -0.073). We detected an overall
24
preference by mule deer in the water-provided area for Joshua tree and pinyon
woodlands, avoidance of black brush and Great Basin sagebrush communities, and no
preference for desert wash systems or Mojave yucca vegetation communities (Table 6).
DISCUSSION
Mule deer in the water-provided treatment area exhibited the most restricted daily
movements and had smaller total and core UDs than individuals in the control area or
water-limited area, which lends support to our original predictions of restricted
movements and distribution where sources of water were enhanced. We expected
individuals in the control area to express that same pattern in movements and UD’s as the
water-provided area because they have had long-term access to sources of permanent
water. Surprisingly, mule deer in the control area of Mojave moved longer distances
each day and utilized larger areas than individuals from both the water-provided and
water-limited treatment areas across all seasons. We did detect support for a seasonal
shift in distances traveled each day, but the influence of season varied by area.
Consistent with our original hypothesis and predictions, however, was a seasonal shift in
both the 95% UD and the 50% core UD. In general, the UDs of mule deer among the 3
study areas were the largest during the cool, wet winter months and the most restricted
during the warm summer months (Fig. 5).
Observed movement and UD patterns of mule deer in the control area of Mojave
could be a result of instinctive knowledge of the long-term presence of reliable sources of
water in the area. Under this hypothesis, movements of individuals may not be

25
constrained by the uncertainty of 1) exploration for new sources of free-standing water
and 2) evaporation of known sources of water. Nonetheless, a more likely explanation
for the observed differences in movement parameters is related to habitat productivity.
Several authors have documented the importance of forage quality to free-ranging
ungulates (Relyea et al. 2000, Stewart et al. 2000, Marshal et al. 2006a, Stewart et al.
2006). As a result, movements and distribution of free-ranging ungulates is closely tied
to distribution and quality of forage (Marshal et al. 2006a). Ungulates inhabiting habitats
of low productivity exhibit larger home ranges and increased movements to meet their
energetic demands and, alternatively, they exhibit smaller home ranges and decreased
movements in habitats of high productivity. The control area of Mojave is comprised of
dense concentrations of Joshua trees. Although there is little information available about
habitat productivity in Mojave Desert ecosystems to ungulates (Bleich et al. 1997), areas
comprised of Joshua tree communities may be of low productivity, resulting in the
movement and UD patterns exhibited by mule deer in the control area. Additional
research quantifying the quality of vegetation communities to mule deer in Mojave would
likely provide a better understanding of the proposed relationship between habitat
productivity and the observed patterns of movement.
The results of our selection analysis (i.e., global dataset) largely corroborated
selection patterns exhibited by mule deer across their geographic range. Marshal et al.
(2006a) determined mule deer in the Sonoran Desert preferred higher elevations in
summer and autumn but lower elevations in winter and spring, selected for steeper slopes
in 3 out of 4 seasons, and a weak avoidance of roads in summer and autumn. Although
Marshal et al. (2006a) postulated that varying selection for elevation by season may be an

26
anti-predator strategy during the fawning period; we did not detect this relationship. In
Mojave, mule deer preferred lower elevations in the control area and water-limited area
but higher elevations in the water-provided area. Selection preferences for elevation by
mule deer in control and water-limited area may be explained, in-part, by the distribution
of permanent water sites, which occurred at lower elevations on the landscape. Water
sites within these 2 areas are either naturally occurring springs (water-limited area) or
gravity filled water catchments (control area) and, given the underlying hydrology of
these systems, free-water from watershed recharge or aquifers would travel vertically
through sub-surface flow paths from accumulation at higher elevations to discharge at
springs or catchments at lower elevations (Patten et al. 2008). Free-water available at
catchments in the water-provided area were not constrained by this hydrological process
because they are filled by a series of underground wells where free-water is pumped to
the surface by windmills.
Ordway and Krausman (1986) also identified selection by female mule deer for
moderate to steep slopes (11-75%) but avoidance of gentle slopes (0-10%). Few recent
studies evaluating selection patterns of mule deer have investigated the effect of
landscape ruggedness on likelihood of use. Those studies that incorporated some
component of terrain heterogeneity, however, identified a strong and positive effect of
this landscape metric on probability of selection, which corroborates our findings of
preferences by mule deer for steeper slopes and rugged terrain in Mojave (Fox and
Krausman 1994, Sanchez-Rojas and Gallina 2000). Preference for slopes and ruggedness
likely represents a predator avoidance strategy, which allows for 1) long distance
detection of risk and 2) rapid escape (Geist 1998). These relationships are especially

27
important during the fawning period (Fox and Krausman 1994), although we did not
detect differences in preferences for slopes or ruggedness among seasons.
Consistent with other work assessing resource preferences of ungulates in desert
ecosystems (Blong 1993, Krausman et al. 1985b) our results detected a general
preference for desert wash systems. Forage availability and quality have been identified
by multiple investigators as important components of ungulate habitat (Relyea et al.
2000, Stewart et al. 2000, Marshal et al. 2006a, Stewart et al. 2006), and vegetation
communities found along wash systems often provide primary sources of forage and
cover to ungulates in desert systems (Andrew et al. 2001, Krausman et al. 1998, Marshal
et al. 2005b, Marshal et al. 2006a). Although vegetation communities in Mojave are
likely more diverse than other water-limited systems due to the overlap of 3 of the 4
major desert ecosystems, our detection of desert washes as a significant component of
resource selection by mule deer in Mojave highlights the overall importance of this
habitat component to desert-dwelling herbivores.
We incorporated an interaction term in our candidate models for selection by
season, in which we allowed the response in selection of model parameters to vary by
season. Other investigations have reported seasonal differences in use of landscape
features such as elevation, slope, roads, and water (Ordway and Krausman 1986,
Nicholson et al. 1997, Sanchez-Rojas and Gallina 2000, Marshal et al. 2006a). We
employed this approach to detect differences in in the magnitude of response in resource
selection among seasons. Nonetheless, our best model of resource selection
incorporating the season interaction term was not supported in the model selection
process (ΔAIC = 2109.22; Anderson et al. 2000). Our top-ranked model of selection in

28
the 3 study areas indicated that the effect of an interaction with treatment area on
selection of landscape features was stronger than an interaction with season (Table 3).
We expected that variation in phenology of forage and temperature gradients resulting
from changes in climatic conditions throughout the year would influence selection of
resources by mule deer at varying magnitudes (Marshal et al. 2005a, b). Nonetheless,
that expectation was not supported in our analysis. We detected an overall negative
influence of summer on the probability of resource use but only when compared with
winter. This finding indicates that mule deer in Mojave exhibit a restriction in selection
patterns in response to climatic variation but the response to individual components of the
landscape to seasonal variation does not fluctuate.
We observed a strong response by mule deer to the presence of sources of
permanent water in patterns of resource selection, particularly in the control and water-
limited areas. Across all 3 study areas, individuals exhibited a higher probability of use
near a water site than further away. The importance of water in patterns of resource
selection by desert ungulates is often postulated (Rosenstock et al. 1999, Bleich 2005,
Krausman et al. 2006, Simpson et al. 2011) but preference is rarely detected (Krausman
and Etchberger 1995, Bleich et al. 1997, Marshal et al. 2006a, Cain et al. 2008b). We
identified a strong response by mule deer to presence of sources of permanent water in
both the control area and the water-limited area but a weak response in the water-
provided area. In landscapes where availability of a critical resource, such as water, is
limited in both availability and distribution, species inhabiting those systems may exhibit
a strong preference for that resource. Conversely, in areas where a critical resource is
abundant, species inhabiting those areas may exhibit weak selection or no response for

29
that resource (Mysterud and Ims 1998). Those variations likely represent a dynamic shift
in preferences by species to fluctuations in availability of a resource on the landscape
(Mysterud and Ims 1998, Beyer et al. 2010). The distribution and density of permanent
sources of water are much more restricted in the control area (total sites: 8) and in the
water-limited area (total sites: 3) than in the water-provided area (total sites: 23). Our
findings of preferences of varying magnitudes for permanent water among the 3 study
areas likely suggest a dynamic shift in patterns of use by mule deer where water is limited
(high preference) to areas where water is abundant (low preference), as described by
Mysterud and Ims (1998).
The spatial scale (3rd
order selection) of our analysis may also explain the
variation in preference for sites in proximity to sources of permanent water among the 3
areas. Several authors suggest evaluation of resource selection at multiple spatial scales
to assess resource preferences of free-ranging ungulates (Kie et al. 2002, Boyce et al.
2003). We may not be able to detect a strong preference for sites close to sources of
permanent water by mule deer in the water-provided area because their movement
patterns and distribution were already constricted to areas close to those sources. Thus,
evaluation of factors influencing placement of the home range on the landscape (2nd
order
selection; Johnson 1980) may have been more appropriate (Kie et al. 2002). Evaluation
of UDs prior to analyses, however, indicated that landscape placement of UDs were
strongly associated with known sources of permanent water. We were explicitly
interested in how individuals used those sources within their UD rather than the general
placement of their UD, warranting the 3rd
order spatial scale implemented in our analysis
of resource selection. Moreover, we identified strong selection for proximity to

30
permanent water in both the control area and the water-limited area using this approach,
which provides further support of our methodology.
The influence of Hackberry Complex Fire may explain, in-part, the weak
selection of water by mule deer in the water-provided treatment area. Selection for water
sites by mule deer in unburned regions of the water-provided area (Fig. 8a) was similar in
the magnitude of preference for water sites in the control area and the water-limited area
of Mojave (Fig. 7a). In areas disturbed by low severity wildfire, mule deer exhibited no
selection for springs and catchments, whereas in areas disturbed by moderate severity
wildfire, individuals displayed no preference for springs and a weak selection for
catchments. We were unable to identify an influence of high-severity wildfire on
probability of use of springs or catchments, likely due to few areas disturbed by this
classification of wildfire.
Disturbance to the Mojave landscape due to the Hackberry Complex Fire has
likely created a diminishing impact of the overall importance of sources of permanent
water to mule deer in the water-provided area. In fire-adapted ecosystems, disturbance
from fire often promotes the regeneration of forage of high nutritional quality to
ungulates (Ruthven et al. 2000, Holl et al. 2004, Bleich et al. 2008, Long et al. 2008,
Meek et al. 2008). Prior to the Hackberry Complex Fire, the water-provided area was
comprised of dense Utah juniper stands, and late seral Great Basin big sagebrush and
bitterbrush communities, in addition to various Mojave Desert cacti spp. (Thorne et al.
1981). Previous work has shown that although dense vegetation communities, such as
those existing before the Hackberry Complex Fire, can provide important security cover,
they are of low nutritional quality to ungulates (Van Dyke and Darragh 2006, Bender et

31
al. 2007, Bishop et al. 2009, Halbritter and Bender 2011). The effective removal of
these late seral habitats via wildfire has resulted in an increase in vegetation of high
nutritional value (e.g. annual forbs, globemallow, bitterbrush; Wallmo and Regelin 1981,
Krausman et al. 1997, Bishop et al. 2001). Moreover, early seral vegetation is often more
digestible (Marshal et al. 2005b) and may have greater content of preformed water than
mature vegetation communities. The removal of those juniper communities, due to the
Hackberry Complex Fire, has also resulted in an increase in availability of free-water (N.
Darby, unpublished data) likely due to a reduction in plant update. Thus, mule deer in
the water-provided area of Mojave may be able to meet both their nutritional and
hydration needs while foraging in areas disturbed by the Hackberry Complex Fire,
reducing the overall importance of access to sources of permanent water. Improved
access to habitats of high productivity may also explain the patterns of restricted
movements and distribution exhibited by mule deer in the water-provided area.
Additional research characterizing the quality of vegetation communities following the
Hackberry Complex Fire would provide additional insight into the relationship between
wildfire disturbance and use of permanent water in the water-provided area.
Although our analysis supported the delineation between proximity of mule deer
locations to springs and proximity to catchments in the water-provided area rather than
solely modeling the proximity to any source of permanent water (ΔAIC = 35.82), the
magnitude of difference in selection for springs and catchments was equivocal.
Nevertheless, mule deer were more likely to be closer to springs than further away, while
a similar response to catchments was not as evident, although overlap in the parameter
estimates of these two types of water sources indicated no statistical difference (Table 6).

32
We detected marginal responses by mule deer to either springs or catchments in burned
areas, which was likely a result of the location of those sources within the burned area.
We found the result of similar use of springs and catchments to be surprising because the
vegetation structure at springs and at catchments is fundamentally different. Springs in
Mojave contain a vertical vegetation component immediately surrounding the source,
which may provide important thermal refugia for mule deer during the hottest times of
the year (Cain et al. 2006, Cain et al. 2008a). Also, forage is more concentrated and,
likely, of higher quality at spring sites than other areas of the landscape in Mojave, which
may provide an additional nutritional component to the diet of mule deer that use those
sources. Continued evaluation of patterns of resource selection for water sources will
help to determine if there is a difference in use of springs and water catchments by mule
deer in Mojave.
CONCLUSIONS
Our results supported our original predictions of constricted distributions and the
overall importance of free-water in patterns of resource selection demonstrated by mule
deer in response to the provision of water catchments in Mojave. Those results have
undoubtedly been confounded, however, from landscape disturbance caused by the
Hackberry Complex Fire. Indeed, we encountered many of the same issues as our
predecessors investigating the utility of water provisioning for desert ungulates (Broyles
and Cutler 1999, Marshal et al. 2006a, Cain et al. 2008b). Attributing our findings in
movement and selection exclusively to improved density and distribution of permanent

33
sources of water would be a misleading interpretation of the results from our research.
Further evaluation of habitat structure and nutritional quality of forage in Mojave,
particularly in the water-provided area, would address the hypothesis of variable habitat
conditions between the 3 treatment areas. Additionally, assessment of parameters related
to population performance, such as survival, body condition, productivity, as well as
juvenile survival and recruitment could disentangle the influence of those habitat
conditions from improved access to sources of permanent water.
ACKNOWLEDGEMENTS
We gratefully acknowledge financial and technical support from the National
Park Service, California Department of Fish and Game, Nevada Department of Wildlife,
University of Nevada in Reno, Safari Club International, the California Deer Association,
and the Boone and Crockett Club. We thank technicians N. Simpson, C. Morris, D.
Gonzalez, T. Brown, J. Zweifel, I. Knight, J. Saenz, and numerous volunteers who helped
collect data used in this manuscript. All capture and handing of mule deer were
compliant with procedures outlined by the California Department of Fish and Game,
were approved by the University of Nevada Reno’s Institutional Animal Care and Use
Committee (IACUC: 00058), and were consistent with the guidelines established by the
American Society of Mammalogists for care and use of wild mammals in research
(Gannon et al. 2007).

34
LITERATURE CITED
Akaike, H. 1973. Information theory as an extension of the maximum likelihood
principle. Pages 267-281 in B.N. Petrov and F. Csaki, editors. Second
International Symposium on Information Theory. Akademiai Kiado, Budapest.
Anderson, D. R., K. P. Burnham, and W. L. Thompson. 2000. Null hypothesis testing:
Problems, prevalence, and an alternative. Journal of Wildlife Management
64:912-923.
Andrew, N. G., V. C. Bleich, A. D. Morrison, L. M. Lesicka, and P. J. Cooley. 2001.
Wildlife mortalities associated with artificial water sources. Wildlife Society
Bulletin 29:275-280.
Bell, B. A., J. A. Schoeneberger, G. B. Morgan, J. M. Ferron, and J. D. Kromrey. 2010.
Fundamental diagnostics for two-level mixed models: The SAS 9.2 macro
MIXED_DX. Proceedings of the annual SAS Global Forum.
Bender, L. C., L. A. Lomas, and T. Kamienski. 2007. Habitat effects on condition of doe
mule deer in arid mixed wood land-grassland. Rangeland Ecology and
Management 60:277-284.
Beyer, H. L. 2004. Hawth's Analysis Tools for ArcGIS. Available at
<http://www.spatialecology.com/htools>.
Beyer, H. L., D. T. Haydon, J. M. Morales, J. L. Frair, M. Hebblewhite, M. Mitchell, and
J. Matthiopoulos. 2010. The interpretation of habitat preference metrics under
use-availability designs. Philosophical Transactions of the Royal Society B-
Biological Sciences 365:2245-2254.

35
Biggs, J. R., D. M. VanLeeuwen, J. L. Holechek, and R. Valdez. 2010. Multi-scale
analyses of habitat use by elk following wildfire. Northwest Science 84:20-32.
Bishop, C. J., E. O. Garton, and J. W. Unsworth. 2001. Bitterbrush and cheatgrass quality
on 3 southwest Idaho winter ranges. Journal of Range Management 54:595-602.
Bishop, C. J., G. C. White, D. J. Freddy, B. E. Watkins, and T. R. Stephenson. 2009.
Effect of enhanced nutrition on mule deer population rate of change. Wildlife
Monographs 172:1-28.
Bleich, V. C. 2005. In my opinion: Politics, promises, and illogical legislation confound
wildlife conservation. Wildlife Society Bulletin 33:66-73.
Bleich, V. C., N. G. Andrew, M. J. Martin, G. P. Mulcahy, A. M. Pauli, and S. S.
Rosenstock. 2006. Quality of water available to wildlife in desert environments:
Comparisons among anthropogenic and natural sources. Wildlife Society Bulletin
34:627-632.
Bleich, V. C., R. T. Bowyer, and J. D. Wehausen. 1997. Sexual segregation in mountain
sheep: Resources or predation? Wildlife Monographs 132:1-50.
Bleich, V. C., H. E. Johnson, S. A. Holl, L. Konde, S. G. Torres, and P. R. Krausman.
2008. Fire history in a chaparral ecosystem: Implications for conservation of a
native ungulate. Rangeland Ecology and Management 61:571-579.
Blong, B. 1993. Use of habitat by Colorado Desert deer. California Department and Fish
and Game, Sacramento, USA.
Boyce, M. S., J. S. Mao, E. H. Merrill, D. Fortin, M. G. Turner, J. Fryxell, and P.
Turchin. 2003. Scale and heterogeneity in habitat selection by elk in Yellowstone
National Park. Ecoscience 10:421-431.

36
Broyles, B. 1995. Desert wildlife water developments: Questioning use in the Southwest.
Wildlife Society Bulletin 23:663-675.
Broyles, B., and T. L. Cutler. 1999. Effect of surface water on desert bighorn sheep in the
Cabeza Prieta National Wildlife Refuge, southwestern Arizona. Wildlife Society
Bulletin 27:1082-1088.
Cain, J. W., B. D. Jansen, R. R. Wilson, and P. R. Krausman. 2008a. Potential
thermoregulatory advantages of shade use by desert bighorn sheep. Journal of
Arid Environments 72:1518-1525.
Cain, J. W., P. R. Krausman, J. R. Morgart, B. D. Jansen, and M. P. Pepper. 2008b.
Responses of desert bighorn sheep to removal of water sources. Wildlife
Monographs 171:1-32.
Cain, J. W., P. R. Krausman, S. S. Rosenstock, and J. C. Turner. 2006. Mechanisms of
thermoregulation and water balance in desert ungulates. Wildlife Society Bulletin
34:570-581.
Desert Studies Center. 2010. Climate of the Mojave Desert.
<http://biology.fullerton.edu/dsc/school/climate.html/>. Accessed 31 August
2011.
Douglas, C. L., and D. M. Leslie. 1986. Influence of weather and density on lamb
survival of desert mountain sheep. Journal of Wildlife Management 50:153-156.
Duchesne, T., D. Fortin, and N. Courbin. 2010. Mixed conditional logistic regression for
habitat selection studies. Journal of Animal Ecology 79:548-555.

37
Fortin, D., M. E. Fortin, H. L. Beyer, T. Duchesne, S. Courant, and K. Dancose. 2009.
Group-size-mediated habitat selection and group fusion-fission dynamics of bison
under predation risk. Ecology 90:2480-2490.
Fox, K. B., and P. R. Krausman. 1994. Fawning habitat of desert mule deer.
Southwestern Naturalist 39:269-275.
Fox, L. M., P. R. Krausman, M. L. Morrison, and R. M. Kattnig. 2000. Water and
nutrient content of forage in Sonoran pronghorn habitat, Arizona. California Fish
and Game 86:216-232.
Gannon, W. L., R. S. Sikes, and the Animal Care and Use Committee of the American
Society of Mammalogists. 2007. Guidelines of the American Society of
Mammalogists for the use of wild mammals in research. Journal of Mammalogy
88:809-823.
Geist, V. 1998. White-tailed deer and mule deer. Pages 255-201 in V. Geist, editor. Deer
of the World: Their Evolution, Behavior and Ecology. Stackpole Book,
Harrisburg, Pennsylvania, USA.
Gillies, C. S., M. Hebblewhite, S. E. Nielsen, M. A. Krawchuk, C. L. Aldridge, J. L.
Frair, D. J. Saher, C. E. Stevens, and C. L. Jerde. 2006. Application of random
effects to the study of resource selection by animals. Journal of Animal Ecology
75:887-898.
Halbritter, H., and L. C. Bender. 2011. Quality of habitat occupied by elk (Cervus
elaphus) in the southern Sacramento Mountains, New Mexico. Southwestern
Naturalist 56:1-8.

38
Holl, S. A., V. C. Bleich, and S. G. Torres. 2004. Population dynamics of bighorn sheep
in the San Gabriel Mountains, California, 1967-2002. Wildlife Society Bulletin
32:412-426.
Johnson, B. K., J. W. Kern, M. J. Wisdom, S. L. Findholt, and J. G. Kie. 2000. Resource
selection and spatial separation of mule deer and elk during spring. Journal of
Wildlife Management 64:685-697.
Johnson, C. J., S. E. Nielsen, E. H. Merrill, T. L. McDonald, and M. S. Boyce. 2006.
Resource selection functions based on use-availability data: Theoretical
motivation and evaluation methods. Journal of Wildlife Management 70:347-357.
Johnson, D. H. 1980. The comparison of usage and availability measurements for
evaluating resource preference. Ecology 61:65-71.
Kie, J. G., R. T. Bowyer, M. C. Nicholson, B. B. Boroski, and E. R. Loft. 2002.
Landscape heterogeneity at differing scales: Effects on spatial distribution of mule
deer. Ecology 83:530-544.
Krausman, P. R. 1985. Impacts of the Central Arizona Project on desert mule deer and
desert bighorn sheep. U.S. Bureau of Reclamation, Final Report, Contract 9-07-
30-X069.
Krausman, P. R., J. J. Hervert, and L. L. Ordway. 1985a. Capturing deer and mountain
sheep with a net-gun. Wildlife Society Bulletin 13:71-73.
Krausman, P. R., K. R. Rautenstrauch, and B. D. Leopold. 1985b. Xeroriparian Systems
Used by Desert Mule Deer in Texas and Arizona. Pages 144-149 in R. R.
Johnson, C. D. Ziebell, D. R. Patton, P. F. Ffolliott, and R. H. Hamre, technical

39
coordinators. Riparian Ecosystems and Their Management: Reconciling
Conflicting Uses. U.S. Forest Service Report RM-120, Washington, D.C., USA.
Krausman, P. R., and R. C. Etchberger. 1995. Response of desert ungulates to a water
project in Arizona. Journal of Wildlife Management 59:292-300.
Krausman, P. R., A. J. Kuenzi, R. C. Etchberger, H. R. Rautenstrauch, L. L. Ordway, and
J. J. Hervert. 1997. Diets of desert mule deer. Journal of Range Management
50:513-522.
Krausman, P. R., S. S. Rosenstock, and J. W. Cain. 2006. Developed waters for wildlife:
Science, perception, values, and controversy. Wildlife Society Bulletin 34:563-
569.
Long, R. A., J. L. Rachlow, J. G. Kie, and M. Vavra. 2008. Fuels reduction in a western
coniferous forest: Effects on quantity and quality of forage for elk. Rangeland
Ecology and Management 61:302-313.
Manly, B. F., L. L. McDonald, D. L. Thomas, T. L. McDonald, and W. P. Erickson.
2002. Resource Selection by Animals: Statistical Design and Analysis for Field
Studies. 2nd edition. Kluwer Academic Publishers, Dordrecht, The Netherlands.
Marshal, J. P., P. R. Krausman, and V. C. Bleich. 2005a. Dynamics of mule deer forage
in the Sonoran Desert. Journal of Arid Environments 60:593-609.
Marshal, J. P., P. R. Krausman, and V. C. Bleich. 2005b. Rainfall, temperature, and
forage dynamics affect nutritional quality of desert mule deer forage. Rangeland
Ecology and Management 58:360-365.

40
Marshal, J. P., V. C. Bleich, P. R. Krausman, M. L. Reed, and N. G. Andrew. 2006a.
Factors affecting habitat use and distribution of desert mule deer in an arid
environment. Wildlife Society Bulletin 34:609-619.
Marshal, J. P., P. R. Krausman, V. C. Bleich, S. S. Rosenstock, and W. B. Ballard.
2006b. Gradients of forage biomass and ungulate use near wildlife water
developments. Wildlife Society Bulletin 34:620-626.
Marshal, J. P., L. M. Lesicka, V. C. Bleich, P. R. Krausman, G. P. Mulcahy, and N. G.
Andrew. 2006c. Demography of desert mule deer in southeastern California.
California Fish and Game 92:55-66.
Meek, M. G., S. M. Cooper, M. K. Owens, R. M. Cooper, and A. L. Wappel. 2008.
White-tailed deer distribution in response to patch burning on rangeland. Journal
of Arid Environments 72:2026-2033.
Mysterud, A., and R. A. Ims. 1998. Functional responses in habitat use: Availability
influences relative use in trade-off situations. Ecology 79:1435-1441.
National Park Service. 2011. Nature and Science of Mojave National Preserve.
<http://www.nps.gov/moja/naturescience/index.htm>. Accessed 31 August 2011.
Nicholson, M. C., R. T. Bowyer, and J. G. Kie. 1997. Habitat selection and survival of
mule deer: Tradeoffs associated with migration. Journal of Mammalogy 78:483-
504.
Oehler, M. W., R. T. Bowyer, and V. C. Bleich. 2003. Home ranges of female mountain
sheep, Ovis canadensis nelsoni: Effects of precipitation in a desert ecosystem.
Mammalia 67:385-401.
41
Ordway, L. L., and P. R. Krausman. 1986. Habitat use by desert mule deer. Journal of
Wildlife Management 50:677-683.
Patten, D. T., L. Rouse, and J. C. Stromberg. 2008. Isolated spring wetlands in the Great
Basin and Mojave deserts, USA: Potential response of vegetation to groundwater
withdrawal. Environmental Management 41:398-413.
Pinheiro, J. C., and D. M. Bates. 1996. Unconstrained parametrizations for variance-
covariance matrices. Statistics and Computing 6:289-296.
Rautenstrauch, K. R., and P. R. Krausman. 1989. Influence of water availability and
rainfall on movements of desert mule deer. Journal of Mammalogy 70:197-201.
Relyea, R. A., R. K. Lawrence, and S. Demarais. 2000. Home range of desert mule deer:
Testing the body-size and habitat-productivity hypotheses. Journal of Wildlife
Management 64:146-153.
Rettie, W. J., and P. D. McLoughlin. 1999. Overcoming radiotelemetry bias in habitat-
selection studies. Canadian Journal of Zoology-Revue 77:1175-1184.
Rogers, J. O., T. E. Fulbright, and D. C. Ruthven. 2004. Vegetation and deer response to
mechanical shrub clearing and burning. Journal of Range Management 57:41-48.
Rosenstock, S. S., W. B. Ballard, and J. C. Devos. 1999. Viewpoint: Benefits and impacts
of wildlife water developments. Journal of Range Management 52:302-311.
Rosenstock, S. S., J. J. Hervert, V. C. Bleich, and P. R. Krausman. 2001. Muddying the
water with poor science: A reply to Broyles and Cutler. Wildlife Society Bulletin
29:734-738.
Ruthven, D. C., J. F. Gallagher, and D. R. Synatzske. 2000. Effect of fire and grazing on
forbs in the western South Texas Plains. Southwestern Naturalist 45:89-94.

42
Sanchez-Rojas, G., and S. Gallina. 2000. Factors affecting habitat use by mule deer
(Odocoileus hemionus) in the central part of the Chihuahuan Desert, Mexico: An
assessment with univariate and multivariate methods. Ethology Ecology and
Evolution 12:405-417.
Sappington, J. M., K. M. Longshore, and D. B. Thompson. 2007. Quantifying landscape
ruggedness for animal habitat analysis: A case study using bighorn sheep in the
Mojave Desert. Journal of Wildlife Management 71:1419-1426.
Simpson, N. O., K. M. Stewart, and V. B. Bleich. 2011. What have we learned about
water developments for wildlife? Not enough! California Fish and Game 97:190-
209.
Stewart, K. M., R. T. Bowyer, J. G. Kie, N. J. Cimon, and B. K. Johnson. 2002.
Temporospatial distributions of elk, mule deer, and cattle: Resource partitioning
and competitive displacement. Journal of Mammalogy 83:229-244.
Stewart, K. M., R. T. Bowyer, R. W. Ruess, B. L. Dick, and J. G. Kie. 2006. Herbivore
optimization by north American elk: Consequences for theory and management.
Wildlife Monographs 167:1-24.
Stewart, K. M., T. E. Fulbright, and D. L. Drawe. 2000. White-tailed deer use of
clearings relative to forage availability. Journal of Wildlife Management 64:733-
741.
Thomas, K., J. Franklin, T. Keeler-Wolf and P. Stine. 2002. Central Mojave Vegetation
Map. A digital spatial database (ArcInfo). United States Geological Survey.
Thorne, R. F., B. A. Prigge, and J. Henrickson. 1981. A flora of the higher ranges and the
Kelso Dunes of the eastern Mojave Desert in California. ALISO 10:71-186.

43
Tiedemann, A. R., J. O. Klemmedson, and E. L. Bull. 2000. Solution of forest health
problems with prescribed fire: Are forest productivity and wildlife at risk? Forest
Ecology and Management 127:1-18.
United States Congress. 1994. Public Law 103-433, California Desert Protection Act of
1994, 31 October 1994.
United States Geological Survey. 2010. Climate history of the Mojave Desert region.
< http://mojave.usgs.gov/climate-history/>. Accessed 17 September 2010.
Van Dyke, F., and J. A. Darragh. 2006. Short- and long-term changes in elk use and
forage production in sagebrush communities following prescribed burning.
Biodiversity and Conservation 15:4375-4398.
Wallmo, O. C., and W. L. Regelin. 1981. Rocky Mountain and Intermountain Habitats
Part 1: Food Habits and Nutrition. Pages 387-398 in O. C. Wallmo, editor. Mule
and Black-tailed Deer of North America. University of Nebraska Press, Lincoln,
Nebraska, USA.
Wallmo, O. C., S. L. Brownlee, and A. Lecount. 1981. Desert and Chaparral Habitats
Part 2: Habitat Evaluation and Management. Pages 366-386 in O. C. Wallmo,
editor. Mule and Black-Tailed Deer of North America. University of Nebraska
Press, Lincoln, Nebraska, USA.
Zar, J. H. 2010. Biostatistical Analysis. Fifth Edition. Prentice Hall, Upper Saddle
River, New Jersey, USA.

44
Table 1. Descriptions of parameters and abbreviations used in models of resource selection by mule deer in Mojave National
Preserve, California, USA, 2008-2011.
Model Parameter Abbr Description Parameter Category Effect Type
Activity ACT Level of activity (active vs. resting) Behavior Fixed
Area AREA Treatment Type Influence of treatment Fixed
Catchment CTH Distance to nearest water catchment (m) Proximity to water‡ Covariate†
Mule Deer DEER Individual mule deer Individual heterogeneity Random
Elevation ELEV Elevation (m) Topographic Covariate†
Fire FIRE Fire severity Influence of fire‡ Fixed
Water H2O Distance to nearest source of water (m) Proximity to water Covariate†
Landcover LCOV Landcover type Influence of habitat Fixed
Maintained Roads MR Distance to nearest maintained road (m) Proximity to roads Covariate†
Northness NRT Cosine of aspect (-1 to 1) Topographic Covariate†
Season SEAS Season Influence of season Fixed
Slope SLOPE Degree of slope Topographic Covariate†
Spring SPR Distance to nearest spring (m) Proximity to water‡ Covariate†
Ruggedness VRM Vector ruggedness metric (0 to 1) Topographic Covariate†
Westness WST Sine of aspect (-1 to 1) Topographic Covariate†
Unmaintained Roads 4X4 Distance to nearest unmaintained road (m) Proximity to roads Covariate†
†Parameter z-standardized prior to model analysis.
‡Effect investigated in water-provided treatment area only.

45
Table 2. Estimates (ha) and standard errors (SE) of the 95% and the 50% utilization distribitions (UD) of mule deer by study area
in Mojave National Preserve, California, USA, autumn 2008 through winter 2011. For the 95% UD, differences were detected
between treatment areas (F2,11 = 46.66, P < 0.001) and between seasons (F3,11 = 4.29, P = 0.006) but not treatment × season (F6,11 =
0.51, P = 0.797). For the 50% UD, differences between treatment areas (F2,11 = 34.34, P < 0.001) and between seasons (F3,11 =
5.96, P < 0.001) were also detected but not treatment × season (F6,11 = 0.72, P = 0.634). Sample sizes indicated in table (n).
95% UD 50% UD
Study Area n ha SE ha SE
Control Area
Spring 11 2359 237 429 46
Summer 10 1995 310 366 53
Autumn 10 1830 281 420 51
Winter 14 2654 307 576 62
Water-Limited Area
Spring 20 1035 81 249 20
Summer 18 836 103 186 17
Autumn 15 1010 191 238 37
Winter 14 1285 164 328 55
Water-Provided Area
Spring 9 2060 158 523 53
Summer 9 1751 198 394 53
Autumn 8 1581 314 347 57
Winter 9 1840 185 458 50

46
Table 3. Candidate models of resource selection, which evaluated preferences of mule deer in 3 study areas (control: n = 12,
water-provided: n = 20, water-limited: n =8) of Mojave National Preserve, California, USA, 2008-2011. Models were analyzed
using mixed effects logistic regression and evaluated for competitiveness using differences in Akiake’s Information Criterion
values (ΔAIC) and model support (AIC wt). Also included is number of model parameters (k) and an estimate of the negative log-
likelihood (-LogL). See Table 1 for parameter descriptions.
Model† k -LogL ΔAIC AIC wt
H2O×AREA ELEV×AREA VRM×AREA MR×AREA 4X4×AREA SLOPE×AREA LCOV SEAS
DEER 33 38851.85 0.00 0.60
H2O×AREA ELEV×AREA VRM×AREA MR×AREA 4X4×AREA SLOPE×AREA LCOV ACT SEAS
DEER 34 38851.46 1.22 0.33
H2O×AREA ELEV×AREA VRM×AREA MR×AREA 4X4×AREA SLOPE×AREA NRT×AREA
WST×AREA SEAS LCOV DEER 39 38848.03 4.36 0.07
H2O×SEAS ELEV×SEAS VRM×SEAS MR×SEAS 4X4×SEAS SLOPE×SEAS LCOV DEER 37 39902.46 2109.22 0.00
H2O×ACT ELEV×ACT VRM×ACT MR×ACT 4X4×ACT SLOPE×ACT DEER 26 40000.45 2283.20 0.00
H2O ELEV VRM MR 4X4 SLOPE AREA LCOV SEAS DEER 21 40025.54 2323.38 0.00
INTERCEPT 1 41030.34 4292.98 0.00
†If interaction term (×) is present in model then linear term is included by default. See Table 1 for parameter
descriptions.

47
Table 4. Candidate models of resource selection, which evaluated fine-scale preferences of n = 20 mule deer in the water-
provided treatment area of Mojave National Preserve, California, 2008-2011. Models were analyzed using mixed effects logistic
regression and evaluated for competitiveness using differences in Akiake’s Information Criterion values (ΔAIC) and model
support (AIC wt). Also included is number of model parameters (k) and an estimate of the negative log-likelihood (-LogL). See
Table 1 for parameter descriptions.
Model† k -LogL ΔAIC AIC wt
CTH×FIRE SPR×FIRE ELEV×FIRE VRM×FIRE SLOPE×FIRE MR×FIRE 4X4×FIRE LCOV SEAS DEER 42 16908.85 0.00 0.64
CTH×FIRE SPR×FIRE ELEV×FIRE VRM×FIRE SLOPE×FIRE MR×FIRE 4X4×FIRE LCOV ACT SEAS
DEER 43 16908.42 1.14 0.36
H2O×FIRE ELEV×FIRE VRM×FIRE SLOPE×FIRE MR×FIRE 4X4×FIRE LCOV SEAS DEER 38 16930.76 35.82 0.00
CTH×SEAS SPR×SEAS ELEV×SEAS VRM×SEAS MR×SEAS 4X4×SEAS LCOV FIRE DEER 38 17133.26 440.82 0.00
CTH×ACT SPR×ACT ELEV×ACT VRM×ACT MR×ACT 4X4×ACT LCOV FIRE SEAS DEER 27 17166.82 485.94 0.00
CTH SPR ELEV VRM MR 4X4 LCOV FIRE SEAS DEER 20 17182.29 502.88 0.00
INTERCEPT 1 18719.25 3538.80 0.00
†If interaction term (×) is present in model then linear term is included by default.

48
Table 5. Parameter estimates (β), standard errors (SE), and 95% confidence intervals
from best competing model of resource selection by mule deer from 3 study areas of
Mojave National Preserve, California, USA. The top model included interactions
between study area and the effects of proximity to water, elevation, ruggedness,
proximity to maintained and unmaintained roads, and slope. The top model also included
fixed effects of season and landcover type, and supported the inclusion of a random effect
for individual deer. See Table 1 for parameter descriptions.
Model Parameter β SE Lower
95% CI
Upper
95% CI
Individual Heterogeneity
DEER 0.136 0.032 0.071 0.199
Study Area (Control as reference)
Water-provided -0.159 0.147 -0.456 0.138
Water-limited -0.079 0.179 -0.441 0.282
Proximity to Water†
H2O -0.453 0.024 -0.503 -0.404
H2O×Water-provided 0.433 0.030 0.371 0.494
H2O×Water-limited 0.331 0.034 0.261 0.401
Proximity to Roads†
MNRDS 0.607 0.051 0.503 0.710
MNRDS×Water-provided -0.506 0.055 -0.618 -0.395
MNRDS×Water-limited -0.621 0.057 -0.736 -0.506
4X4RDS 0.425 0.023 0.378 0.471
4X4RDS×Water-provided -0.622 0.028 -0.678 -0.565
4X4RDS×Water-limited -0.356 0.031 -0.418 -0.294
Topographic†
ELEV -0.091 0.031 -0.154 -0.028
ELEV×Water-provided 0.979 0.043 0.893 1.066
ELEV×Water-limited -0.136 0.044 -0.226 -0.046
VRM 0.579 0.042 0.494 0.665
VRM×Water-provided -0.568 0.047 -0.661 -0.475

49
VRM×Water-limited -0.406 0.048 -0.503 -0.308
SLOPE 0.253 0.043 0.166 0.339
SLOPE×Water-provided -0.273 0.046 -0.367 -0.179
SLOPE×Water-provided -0.014 0.051 -0.116 -0.089
Season (Winter as reference)
Autumn 0.003 0.029 -0.056 0.062
Spring 0.018 0.026 -0.036 0.073
Summer -0.066 0.023 -0.113 -0.019
Landcover Type (Juniper as reference)
Desert wash system 0.426 0.079 0.266 0.586
Black brush shrubland -0.358 0.103 -0.565 -0.151
Lava bed and cinder cone -0.728 0.142 -1.014 -0.441
Creosote bush shrubland 0.170 0.208 -0.250 0.590
Joshua tree woodland 0.505 0.039 0.427 0.583
Pinyon woodland 0.424 0.035 0.354 0.494
Big sagebrush shrubland -1.177 0.076 -1.330 -1.024
Mojave yucca scrub 0.133 0.032 0.014 0.252
†Indicates standardized beta coefficient

50
Table 6. Parameter estimates (β), standard errors (SE), and 95% confidence intervals
from best competing model of resource selection of mule deer in the water-provided
treatment area of Mojave National Preserve, California, USA, 2008-2011. The best
model included interactions between wildfire severity and the effects of proximity to
water catchments and springs, elevation, ruggedness, proximity to maintained and
unmaintained roads, and slope. The top model also included fixed effects of season and
landcover type, and supported the inclusion of a random effect for individual deer. See
Table 1 for parameter descriptions.
Model Parameter β SE Lower
95% CI
Upper
95% CI
Individual Heterogeneity
DEER 0.210 0.070 0.063 0.356
Fire Severity (Unburned as reference)
Low -0.454 0.049 -0.557 -0.350
Moderate -0.103 0.050 -0.207 0.001
High 0.331 0.256 -0.163 0.825
Proximity to Water†
CTH -0.228 0.036 -0.302 -0.153
CTH×Low 0.254 0.046 0.157 0.351
CTH×Moderate 0.087 0.046 -0.010 0.184
CTH×High -0.258 0.293 -0.871 0.356
SPR -0.368 0.037 -0.446 -0.289
SPR×Low 0.271 0.047 0.173 0.369
SPR×Moderate 0.404 0.045 0.311 0.498
SPR×High -0.413 0.238 -0.911 0.086
Proximity to Roads†
MNRDS -0.201 0.042 -0.290 -0.112
MNRDS×Low 0.195 0.049 0.092 0.298
MNRDS×Moderate 0.360 0.049 0.258 0.463
MNRDS×High 0.791 0.255 0.257 1.324
4X4RDS 0.030 0.029 -0.091 0.030

51
4X4RDS×Low -0.138 0.038 -0.218 -0.057
4X4RDS×Moderate -0.111 0.037 -0.190 -0.033
4X4RDS×High -0.505 0.236 -0.998 -0.012
Topographic†
ELEV 0.541 0.034 0.469 0.613
ELEV×Low 0.091 0.045 -0.004 0.185
ELEV×Moderate 0.099 0.048 -0.001 0.200
ELEV×High 0.038 0.215 -0.412 0.487
VRM -0.228 0.043 -0.318 -0.139
VRM×Low 0.283 0.055 0.167 0.399
VRM×Moderate 0.267 0.052 0.159 0.375
VRM×High 0.118 0.178 -0.256 0.491
SLOPE -0.245 0.044 -0.338 -0.152
SLOPE×Low 0.372 0.059 0.167 0.399
SLOPE×Moderate 0.267 0.052 0.159 0.375
SLOPE×High 0.118 0.178 -0.256 0.491
Season (Winter as reference)
Autumn -0.063 0.045 -0.157 0.031
Spring -0.022 0.042 -0.110 0.067
Summer -0.150 0.037 -0.227 -0.073
Landcover Type (Juniper as reference)
Desert wash system 0.073 0.144 -0.228 0.374
Black brush shrubland -0.532 0.163 -0.873 -0.191
Joshua tree woodland 0.723 0.053 0.611 0.835
Pinyon woodland 0.809 0.040 0.725 0.892
Big sagebrush shrubland -1.984 0.122 -2.239 -1.730
Mojave yucca scrub 0.045 0.116 -0.198 0.288
†Indicates standardized beta coefficient

52
FIGURE LEGENDS
Figure 1. Location of control and treatment areas in Mojave National Preserve,
southwestern California, USA, where the effects of permanent water provisioning on
mule deer were investigated, 2008-2011. Also identified is the disturbance boundary of
the Hackberry Complex wildfire, which occurred predominately in the Mid Hills and the
Hackberry Mountains region of Mojave National Preserve, California, USA. The
Hackberry Complex wildfire was ignited by a series of lightning strikes in June 2006 and
burned over 28,000 ha.
Figure 2. Annual temperature and precipitation pattern used to delineate seasons in
Mojave National Preserve (hereafter Mojave), California, USA. Solid lines indicate
grouped (by month) seasons. Winter was identified as December-March, spring as April-
May, summer as June-September, and autumn as October-November. Gradient-filled
circles identify mid-winter (February) and mid-summer (August) precipitation peaks,
exhibiting a distinct bi-modal pattern of annual precipitation. Climatological data were
collected at Mitchell Caverns in central Mojave from 1958-1996.
Figure 3. (top) The Mid Hills range in Mojave National Preserve, California, USA. The
Hackberry Complex wildfire created large expanses of sparsely vegetated desert habitat
with relatively few unburned remnant habitat patches. (bottom) The post-wildfire
landscape is now dominated by annual and perennial herbaceous vegetation, e.g.
globemallow (Spaerelcea spp.) and four o’clock (Mirabilis spp.), as well as some

53
perennial shrubs, e.g. bitterbrush (Purshia tridentata var. tridentata) and desert almond
(Prunus fasciculata).
Figure 4. Mean daily distance traveled (km ± SE) by mule deer for 3 study areas in
Mojave National Preserve, California, USA, autumn 2008 through winter 2011. We
evaluated distance traveled for n = 11 in the control area, n = 20 in the water-provided
area, and n = 8 in the water-limited area using mixed-effects analysis of variance.
Pairwise comparisons from a least-square means procedure indicated differences in daily
distance traveled between the control and water-limited area (P = 0.025) and the control
and water-provided area (P < 0.001) but no difference between the water-limited and
water-provided area (P = 0.482). On average ( x + SE), mule deer moved 3.47 + 0.11
km/day in the control area, 2.86 + 0.11 km/day in the water-limited treatment area, and
2.55 + 0.07 km/day in the water-provided treatment area.
Figure 5. Estimates of utilization distribution (ha ± SE) for a) 95% total area and b) 50%
core area used by mule deer for treatment area and season in Mojave National Preserve,
California, USA, autumn 2008 through winter 2011. We evaluated utilization
distribution of mule deer for n = 11 in the control area, n = 20 in the water-provided area,
and n = 8 in the water-limited area using mixed-effects analysis of variance. For the 95%
utilization distribution, differences were detected among treatment areas (F2,36 = 17.15, P
< 0.001) and among seasons (F3,83 = 9.03, P < 0.001), but not the treatment × season
interaction (F6,83 = 1.25, P = 0.290). For the 50% utilization distribution, differences
among treatment areas (F2,36 = 13.71, P < 0.001) and among seasons (F3,83 = 10.97, P <

54
0.001) were also detected, but not the treatment × season interaction (F6,83 = 1.43, P =
0.211).
Figure 6. Hourly movement rates (m/h) of n = 40 mule deer for each season in Mojave
National Preserve, California, USA, 2008-2011. Values on the x-axis have been
converted from UTC to PDT for a) spring and b) summer and from UTC to PST for c)
autumn and d) winter. Error bars represent standard error of movement rates.
Figure 7. Relative probability of selection of n = 40 mule deer, while holding other
model parameters constant (see Table 5), for a) proximity to water, b) proximity to
maintained road, c) proximity to unmaintained roads, d) terrain ruggedness, e) elevation,
and f) slope in Mojave National Preserve, California, USA, 2008-2011. Results are
presented as response of mule deer to parameter by study area where dotted curve
represents study control area, solid curve represents water-provided treatment area, and
dashed curve represents water-limited treatment area.
Figure 8. Relative probability of selection of n = 20 mule deer, while holding other
model parameters constant (see Table 5), for a) proximity to water in an unburned
landscape (βcatchment = -0.228, 95% CI = -0.302–-0.153; βspring = -0.368, 95% CI = -0.446–
-0.289), b) proximity to water in a low burned landscape (βcatchment = 0.254, 95% CI =
0.157–0.351; βspring = 0.271, 95% CI = 0.173–0.369), and c) proximity to water in a
moderately burned landscape (βcatchment = 0.087, 95% CI = -0.010–0.184; βspring = 0.404,
95% CI = 0.311–0.498) of a water-provided treatment area of Mojave National Preserve,

55
California, USA, 2008-2011. Results are presented as response of mule deer to proximity
to nearest source of permanent water by source type where dashed curve represents water
catchments and solid curve represents springs.

56
Figure 1

57
Figure 2
JAN
FEB
MAR
APR
MAY
JUN
JUL
AUG
SEP OCT NOV
DEC
0
10
20
30
40
50
10 15 20 25 30 35
To
tal
Pre
cip
ita
tio
n (
mm
)
Maximum Temperature (°C)
Mojave National Preserve, 1958-1996

58
Figure 3
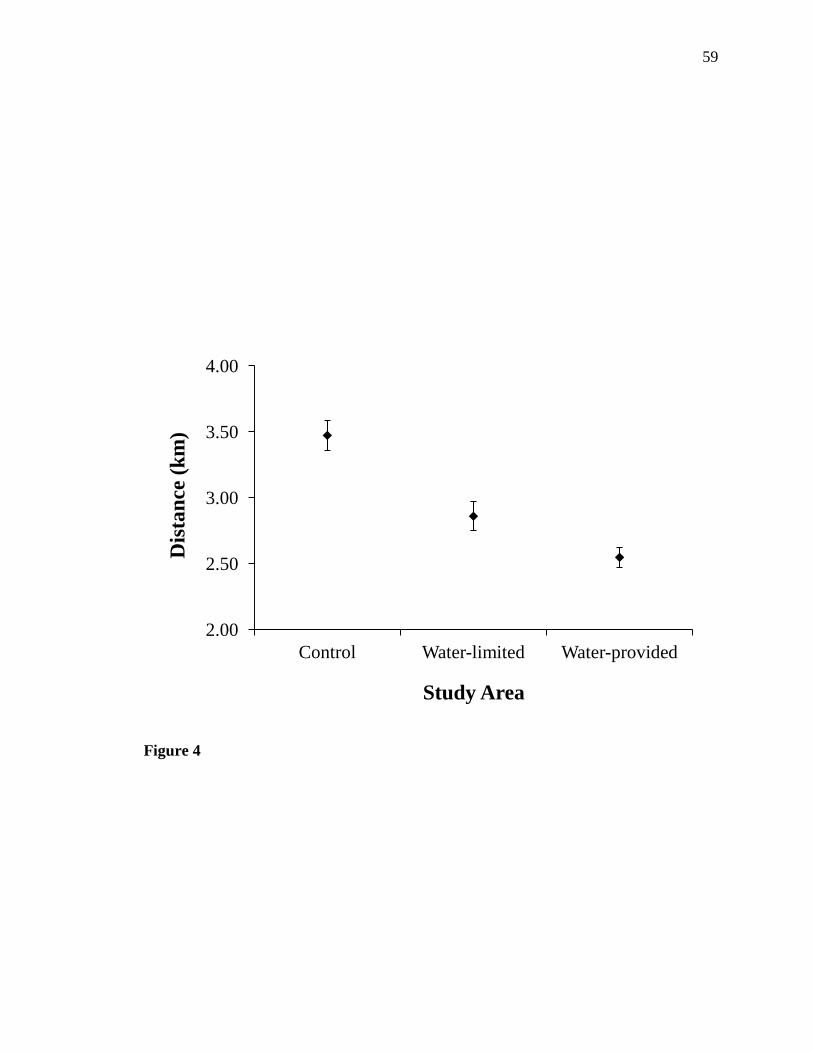
59
Figure 4
2.00
2.50
3.00
3.50
4.00
Control Water-limited Water-provided
Dis
tan
ce (
km
)
Study Area

60
Figure 5
0
100
200
300
400
500
600
700
Spring Summer Autumn Winter
Ker
nel
Den
sity
(h
a)
Season
b) 50% Core Utilization Distribution
0
500
1000
1500
2000
2500
3000
Spring Summer Autumn Winter
Ker
nel
Den
sity
(h
a)
a) 95% Utilization Distribution
Control Water-Limited Water-Provided

61
Figure 6
0
50
100
150
200
250
300
350
Time of Day (PST)
d) winter
0
50
100
150
200
250
300
350 b) autumn
0
50
100
150
200
250
300
350 M
ovem
ent
Rate
(m
/h)
a) spring
0
50
100
150
200
250
300
350
Movem
ent
Rate
(m
/h)
Time of Day (PDT)
c) summer

62
0
0.2
0.4
0.6
0.8
1
0 1000 2000 3000
Sel
ecti
on
Pro
bab
ilit
y
Proximity to Water (m)
a) Permanent Water
Control
Water-Provided
Water-Limited
0
0.1
0.2
0.3
0.4
0.5
0 1000 2000 3000 Proximity to Maintained Roads (m)
b) Maintained Roads
Control
Water-Limited
Water-Provided
0
0.2
0.4
0.6
0.8
1
0 0.003 0.006 0.009 0.012 0.015 Ruggedness
d) Ruggedness
Control
Water-Provided
Water-Limited
0
0.1
0.2
0.3
0.4
0.5
0 300 600 900 1200 1500
Sel
ecti
on
Pro
bab
ilit
y
Proximity to Unmaintained Roads (m)
c) Unmaintained Roads
Control
Water-Provided
Water-Limited

63
Figure 7
0
0.1
0.2
0.3
0.4
0.5
1200 1300 1400 1500 1600 1700
Sel
ecti
on
Pro
bab
ilit
y
Elevation (m)
e) Elevation Control
Water-Provided
Water-Limited
0
0.1
0.2
0.3
0.4
0.5
0 5 10 15 20
Slope (degrees)
f) Slope Control
Water-Provided
Water-Limited

64
0
0.2
0.4
0.6
0.8
1
0 500 1000 1500 2000 2500
Sel
ecti
on
Pro
ba
bil
ity
a) Unburned Landscape
Catchment Spring
0
0.2
0.4
0.6
0.8
1
0 500 1000 1500 2000 2500
Sel
ecti
on
Pro
ba
bil
ity
Proximity to Water (m)
b) Low Severity Wildfire
Catchment Spring
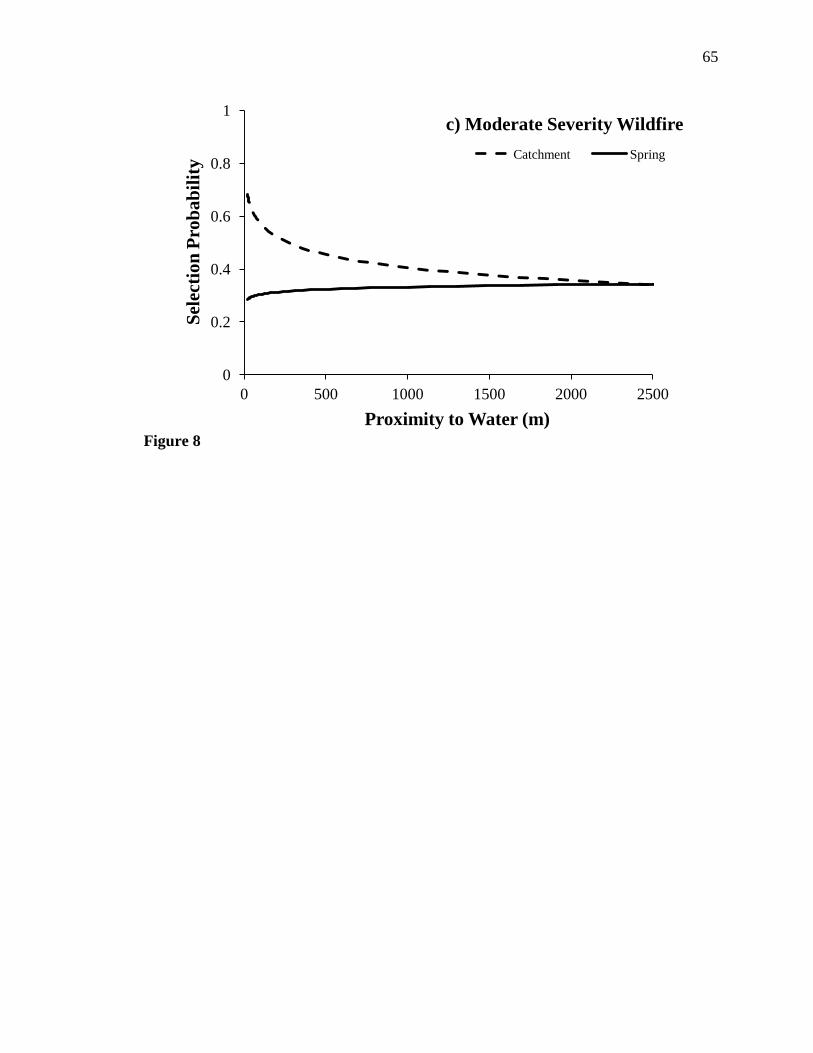
65
Figure 8
0
0.2
0.4
0.6
0.8
1
0 500 1000 1500 2000 2500
Sel
ecti
on
Pro
bab
ilit
y
Proximity to Water (m)
c) Moderate Severity Wildfire
Catchment Spring

66
POPULATION PERFORMANCE OF MULE DEER: RESPONSES IN
DEMOGRAPHY TO EXPERIMENTAL WATER PROVISIONING IN A
MOJAVE DESERT ECOSYSTEM
Cody J. McKee1*
, Kelley M. Stewart1, James S. Sedinger
1, Vernon C. Bleich
1, and Neal
W. Darby2
1Department of Natural Resources and Environmental Science, University of Nevada-
Reno, 1664 N. Virginia Street, Reno, Nevada 89557, USA
2National Park Service, 2701 Barstow Road, Barstow, California 92311, USA
*Correspondence author. E-mail: [email protected]

67
ABSTRACT
Providing permanent water to habitats that are water-limited has been assumed to provide
both practical and intrinsic benefits to wildlife populations in arid regions of the western
United States. Recent studies attempting to delineate costs and benefits of providing
permanent water to wildlife have been inconclusive due to a variety of confounding
factors. We investigated the effects of water provisioning on body condition and traits of
demography of adult female mule deer (Odocoileus hemionus) in 3 study areas (i.e.,
control area, water-provided area, and water-limited area) of Mojave National Preserve,
California, 2008-2011. We used general linear models to evaluate the influence of water
availability and climatic conditions on body condition, and logistic regression to model
the effects of water availability, body condition, and climatic conditions on probability of
producing twins. We used Program MARK to evaluate the effects of water-provisioning,
climatic conditions, and individual characteristics on survival patterns of mule deer and
to estimate monthly and annual probabilities of survival. We did not detect an effect of
water-provisioning on body condition but did identify a significant, positive, effect of
total accumulation of precipitation from the previous year. Our top model of probability
of producing twins did not contain an effect of study area but did suggest a positive
influence of body condition. We were unable to identify an effect of water-provisioning
in patterns of survival but detected higher annual survival in the control area in
comparison with the water-provided area and the water-limited area. Our results
highlight the importance of precipitation on body condition and, in turn, body condition
on twinning probability. We were, however, unable to infer twinning rates to survival
68
and subsequent recruitment of those young into the breeding population. Moreover,
survival of adult female mule deer is generally resilient to variations in resource
availability on the landscape, which was a relationship identified in our experiment. The
description of baseline information related to body condition and demography,
nonetheless, provide an understanding of the general dynamics of a formerly unstudied
population of desert-dwelling herbivores. An appropriate next step in evaluating the
overall influence of water-provisioning on population dynamics of mule deer would be to
investigate variation in birth rates, survival, and recruitment of juveniles.
Key Words: Body condition, California, ingesta-free body fat, Mojave Desert,
Odocoileus hemionus, precipitation, population performance, productivity, Program
MARK, survival, twinning rates, water developments
INTRODUCTION
Development of water sources and its effect on wildlife inhabiting arid
ecosystems has received considerable attention since Broyles (1995) questioned the use
of this popular practice in wildlife management (Krausman et al. 2006; Rosenstock et al.
1999; Simpson et al. 2011). Many of the hypothesized negative side-effects of water
developments, such as poor quality of water, habitat degradation, increased predation,
and entrapment are now known to be relatively unimportant (Andrew et al. 2001; Bleich
et al. 2006; Marshal et al. 2006b; Rosenstock et al. 2001; Simpson et al. 2011).
Provisioning of water in an otherwise water-limited ecosystem has been hypothesized to

69
increase the distribution and abundance of species and to improve population
performance (Dolan 2006; Rautenstrauch and Krausman 1989; Rosenstock et al. 1999;
Simpson et al. 2011). Nonetheless, efforts to identify the benefits of water developments
on population performance have been unsuccessful and subject to a variety of
confounding factors (Broyles and Cutler 1999; Cain et al. 2008; Krausman and
Etchberger 1995; Marshal et al. 2006c). As the availability of natural sources of
perennial water diminish, likely resulting from predicted changes to global climate and
human development (Longshore et al. 2009), understanding the influence of water
developments on species inhabiting arid ecosystems will become ever more important.
Changes in density and distribution of ungulate populations are often linked to
changes in body condition, productivity, and survival (Bishop et al. 2009; Cook et al.
2007; Eberhardt 2002; McCullough 1979). Moreover, populations constrained by
density-dependent processes exhibit low survival, poor body condition, and low
productivity when at or near ecological carrying capacity (Kie et al. 1980; McCullough
1979; Stewart et al. 2005). The underlying mechanisms of population dynamics dictating
density dependence are driven primarily by the availability and quality of resources on
the landscape (Bender et al. 2007; Bishop et al. 2009; Kie and White 1985; Parker et al.
2009; Stewart et al. 2002). Mammalian herbivores inhabiting desert ecosystems occur at
low densities with large ranges (Marshal et al. 2006c) presumably due to limited
availability of resources on the landscape (Bender et al. 2007; Bleich et al. 2010; Marshal
et al. 2005b). If availability of permanent sources of water in arid environments is
limiting to desert ungulates, we would expect those species to reduce their effort spent
acquiring free-water when sources of permanent water are provided. Species could then

70
reallocate those efforts to foraging, which could, ultimately, improve body condition,
productivity, and survival.
A strong causal relationship between climatic conditions, especially rainfall, and
habitat productivity has been identified for a variety of desert ecosystems (Marshal et al.
2005a, 2005b; Oehler et al. 2003; Rautenstrauch and Krausman 1989). Furthermore,
rainfall accumulations, functioning through changes in plant phenology, have been
directly related to body condition of desert dwelling ungulates (Marshal et al. 2008).
During times of decreased precipitation, ungulates exhibited poor body condition (Fox et
al. 2000; Marshal et al. 2008), while a positive relationship between increased
precipitation and body condition and survival has been detected (Cain et al. 2008;
Marshal et al. 2008). Certainly, variation in environmental conditions can exhibit a
critical influence on components of ungulate demography (Gaillard et al. 2000). As
rainfall patterns become more unpredictable and drought conditions persist, the ability to
enhance availability of a critical resource, such as sources of permanent water, may
become increasingly important to ensure the persistence of populations of large
herbivores.
Several studies have identified the importance of water (Morgart et al. 2005;
Rautenstrauch and Krausman 1989; Whiting et al. 2010) and ruggedness (Bleich et al.
1997; Fox and Krausman 1994; Sanchez-Rojas and Gallina 2000) in patterns of resource
selection by ungulates inhabiting a desert ecosystem. Furthermore, a negative
relationship between anthropogenic activity and resource use has also been identified
(Marshal et al. 2006a). Although a link between resource use and fitness of ungulates
have been hypothesized (Boccadori et al. 2008), to our knowledge, there have been few

71
attempts to understand the effects of decisions about resource use on demography
(Dussault et al. 2005; Mahoney and Virgl 2003). Understanding how the use of water
sources, ruggedness, and avoidance of roads by desert ungulates and the consequences of
those patterns of use on population performance would provide valuable insight into
general ecology of the species, as well as a better understanding of the overall importance
of a potentially limiting resource, such as water.
Our objectives were to evaluate body condition and demographic responses (i.e.,
survival, productivity) of mule deer (Odocoileus hemionus) inhabiting a desert ecosystem
to provisioning of permanent sources of water, as well as environmental conditions.
Moreover, decisions in selection of resources by mule deer are not made haphazardly and
specific resources are likely used or avoided to increase overall fitness. Thus, we
considered the relationship between resource use and the effect of those decisions on
demography. We predicted that mule deer with improved access to permanent sources of
water would exhibit higher survival, greater body fat, and greater fetal rates than mule
deer in areas where water was limited. We expected that stochastic variation in climatic
conditions among seasons and years would influence those demographic traits. Finally,
we predicted that deer closer to sources of permanent water, in more rugged terrain, and
further from roads would exhibit higher survival than deer further from water, in less
rugged terrain, and closer to roads. Detection of such enhancements to population
performance would lend support to the use of water as a management tool for ungulates.

72
STUDY AREA
We studied mule deer in Mojave National Preserve (hereafter Mojave), located in
San Bernardino County, California, USA (35°00´N, 115°28´W) from January 2008
through December 2011. The general boundaries of Mojave are delineated to the north
by Interstate Freeway 15, to the south by Interstate Freeway 40, and to the east by the
California-Nevada state border (Fig. 1). The borders of Mojave encompass nearly
650,000 ha and include components of 3 of the 4 major deserts of North America: the
Mojave, the Sonoran, and the Great Basin (National Park Service 2011). The overlap of
these desert ecosystems has created a heterogeneous landscape characterized by distinct,
rugged, mountain ranges composed of granite, basalt, and igneous rock separated by
bajadas, playas, and dunes (Thorne et al. 1981). Elevations ranged from 270 m to 2400
m. Our research efforts were concentrated in the Cima Dome, Mid Hills, and New York
Mountain regions of Mojave (Fig. 1).
The climate of Mojave is representative of the arid southwestern USA, although
wide temperature and precipitation gradients are distinguishable between low and mid- to
upper- elevations. Maximum temperatures at low elevations average 40.5°C in summer
and 19°C in the winter (Desert Studies Center 2010). Temperatures at mid- to upper-
elevations are more moderate in the summer with mean maximum temperatures of 33°C
and mean maximum temperatures of 13°C in the winter (United States Geological Survey
2010). Precipitation patterns are distinctly bi-modal with a cool season peak occurring
during winter and a warm season peak occurring during the summer. Mean annual
precipitation at low elevation sites is 8.5 cm (1980-2005, Soda Springs, northern
73
Mojave), while mean annual precipitation at mid- to upper-elevation sites is 27 cm (1958-
1996, Mitchell Caverns Natural Preserve, southern Mojave).
We delineated seasons with a climograph (Stewart et al. 2002) developed from
historical temperature and precipitation patterns collected at Mitchell Caverns Natural
Preserve in southern Mojave from 1958-1996. The Mitchell Caverns weather station was
ideal for our research objectives because it provided a long-term dataset of climatic
conditions at a similar elevation to our study sites (1,300 m). Winter (cool, wet) began
approximately 1 December and lasted to 31 March, spring (warm, dry) began 1 April to
31 May, summer (warm, wet) began around 1 June and lasted until 31 September, and
autumn (cool, dry) began 1 October to 30 November (Fig. 2).
Vegetation communities vary by elevation and precipitation gradient in Mojave
(Thorne et al. 1981). Creosote bush (Larrea tridentate) was abundant in low elevation
bajadas and valleys (Thorne et al. 1981). Mid-elevations <1,600 m with shallow, rocky,
soils were characterized by cholla cactus (Opuntia spp.), barrel cactus (Ferocactus spp.),
blackbush (Coleogyne ramosissima), Spanish bayonet (Yucca spp.) and Joshua tree
woodlands (Yucca brevifolia; Thorne et al. 1981). Mid-elevations >1,600 m contained
Great Basin sagebrush (Artemesia tridentata), Utah juniper (Juniperus osteosperma), and
pinyon pine (Pinus spp.; Thorne et al. 1981). White fir (Abies concolar) communities
were present in the upper elevations (>1,800 m) of 2 mountain ranges (Clark Mountain
and New York Mountains; Thorne et al. 1981).
Various natural and developed sources of permanent water were present and
available to mule deer before initiation of our study (Fig. 1). Natural and developed
springs were predominately found in the New York Mountains and the Mid Hills, while

74
water availability in Cima Dome was primarily limited to ground-water wells with above-
ground catchments. Depending on climatic conditions, ephemeral springs, seeps, and
tenajas can provide additional sources of water during the winter spring, and early
summer months. Species of wildlife that have been documented using those permanent
sources of water in Mojave includes mule deer, desert tortoise (Gopherus agassizii),
spotted skunk (Spilogale gracilis), mountain lion (Puma concolar), and Gambel’s Quail
(Callipepla gambelii; N. Darby, unpublished data).
METHODS
Study Design
We evaluated the response in body condition, productivity, and survival of adult
female mule deer to the reactivation of livestock wells in Mojave. We divided the central
region of Mojave, where the overlap of mule deer and presence of wells (both active and
inactive) was highest, into 3 study areas (Fig. 1). Study area 1, Cima Dome, did not
experience well deactivation before our study. Permanent sources of water have been
available to mule deer since before the establishment of Mojave. We did not manipulate
water developments in Cima Dome (hereafter control area). In study area 2, Mid Hills,
livestock wells deactivated in 1994 were reinstituted in the fall of 2008 (hereafter water-
provided treatment). In study area 3, New York Mountains, livestock wells were not
reactivated (hereafter water-limited treatment). Additionally, we added exclusionary
fencing around 2 permanent springs in the water-limited area to prevent access by mule
deer but allow for access by other species of wildlife.

75
Animal Capture and Monitoring Procedures
We captured adult female mule deer during the winter or spring of each year from
2008-2011. We targeted 1 adult female per social group using a net-gun fired from a
helicopter (Krausman et al. 1985). We hobbled and blind-folded each animal and
transported captured individuals via helicopter to a central processing location. We fitted
each individual with either a Global Positioning System radiocollar (GPS; Sirtrack,
Havelock North, New Zealand) or a standard Very High Frequency radiocollar (VHF;
Advanced Telemetry Systems, Isanti, Minnesota, USA). Each GPS radiocollar was
programmed to remotely release approximately 1 year after deployment, while VHF
radiocollars remained on the female until the animal died. We employed ultrasonography
to measure deposition of subcutaneous fat at its thickest point immediately cranial to the
cranial process of the tuber ischium (hereafter MAXFAT; Stephenson et al. 2002) and to
determine pregnancy status and fetal rates (Stephenson et al. 1995). MAXFAT
measurements were supplemented by palpations of the sacral ridge and the sacro-sciatic
ligament to determine a body condition index (hereafter rBCS; Cook et al. 2007). An
rBCS of 1 indicated the condition of the individual was generally poor, while incremental
increases to 6 of the rBCS indicated an improvement in overall body condition (Cook et
al. 2007). We also obtained body mass measured to the nearest 1 kg using a 100 kg
hanging scale (Pesola Scales, Baar, Switzerland). When the capture location was less
than 1 km from the processing location, we released the individual from the central
processing site. We returned the animal to the capture location via helicopter or vehicle
when it was greater than 1 km from processing location.
76
We monitored radiocollar status at the first of each month by fixed wing aircraft,
as well as opportunistically by ground crews in Mojave. We recorded signal status as
live, mortality, or no signal detected. If a mortality signal was detected a ground crew
investigated the signal and performed a field necropsy, if possible (Wade and Browns
1985). We classified cause of mortality as predation (e.g., mountain lion predation),
unknown predation, or unknown mortality. We censored all mortalities occurring <2
weeks after capture from our survival analysis.
Local Weather Patterns
We obtained annual and seasonal temperature and precipitation data from a Meso
West weather station (University of Utah, Salt Lake City, Utah, USA) located in the Mid
Hills range of Mojave. We calculated mean daily temperature (ºC), collected over the 24
hour daily cycle, and total accumulation of precipitation (cm) for both year and season by
year. We used the Palmer Drought Severity Index (PDSI; Palmer 1965), which uses
rainfall and temperature data to assess dryness, to determine annual and season by year
drought conditions (National Climate Data Center 2012). We then related these
environmental variables to body condition, productivity, and survival of mule deer.
Landscape Covariates
Previous work evaluating patterns of resource selection by mule deer in Mojave
has identified preferences by individuals for permanent sources of water, terrain
heterogeneity, and an avoidance of well-used roads (McKee 2012). We used ArcGIS
10.0 (Environmental Systems Research Institute [ESRI], Redlands, California, USA) to

77
derive landscape metrics known to influence selection of resources by mule deer and
related them to patterns of survival. We first estimated the spatial error of locations by
placing GPS collars in a known location for 7 days. Evaluation of those GPS collars
indicated locations occurred within 15 m of the true location. We subsequently buffered
locations obtained from deployed GPS radiocollars by 15 m to reduce the effects of
spatial error in our evaluation of resource use, which created a polygon 30 m in diameter
representing each GPS location. We used a Digital Elevation Model (DEM; United
States Geological Survey 2011) to derive a metric of terrain ruggedness (Sappington et al.
2007). We then used the Geospatial Modeling Environment (version 0.5.3, Beyer 2011)
to determine straight-line distance of buffered locations of each animal to nearest source
of permanent water, nearest maintained road, and landscape ruggedness. We calculated
an annual and seasonal mean of landscape metrics for each individual. We evaluated
annual and seasonal use of landscape covariates on survival patterns because body
condition and productivity at capture were likely influenced by habitat use the previous
year but for which we did not have data.
Statistical Analysis
A strong relationship between MAXFAT measurements and total body
composition of ingesta-free body fat (hereafter body fat) in mule deer has been identified
but only when there are measurable deposits of subcutaneous fat (Stephenson et al.
2002). Thus, we derived body fat (%) from MAXFAT measurements and the integration
of rBCS scaled for body mass using protocol developed and validated by Cook et al.
(2010). We investigated differences in body fat among treatment area, body mass,

78
pregnancy and twinning status, and precipitation from previous year. We evaluated the
distributions of independent variables and implemented a cubic transformation on the
negatively skewed variable of body mass prior to statistical analysis (Zar 2010). We used
factorial analysis of covariance (ANCOVA) to evaluate relationships of body fat and
independent variables (PROC GLM; SAS Institute 9.2, Cary, NC). We incorporated
study area and twinning status as main effects in the ANCOVA, while precipitation and
body mass were included as covariates. We tested homoscedasticity of errors of
independent variables using the homogeneity of variance test (HOVTEST) and evaluated
distribution of ANCOVA residuals (PROC UNIVARIATE; SAS 9.2). We employed the
least-squared means procedure to evaluate pairwise differences in body fat among main
effects and a post hoc regression analysis to evaluate the relationship between body fat
and rainfall (PROC REG; SAS 9.2).
Mule deer with low body fat reserves have a high probability of becoming
pregnant (Tollefson et al. 2010), although the ability of a female to produce twins
maximizes her reproductive success (Johnstone-Yellin et al. 2009) and may be more
closely associated with body condition (Johnstone-Yellin et al. 2009; Tollefson et al.
2010). Twinning status of females in Mojave was more variable than pregnancy status
and likely provided a better indicator of the efficacy of our treatments. We evaluated the
influence of study area, body fat, body mass, and precipitation from previous year on
likelihood of a female to produce twins. We modeled the relationship using stepwise
logistic regression (PROC LOGISTIC; SAS 9.2) with a relaxed stepwise sequence (α to
enter and stay = 0.157; Steyerberg et al. 2001). We assigned an individual carrying twins
at capture a ‘1’ and females carrying a single fetus or were not pregnant received a ‘0’.

79
We evaluated correlations among explanatory variables (PROC CORR; SAS 9.2) and
standardized the covariates of body fat, body mass, and precipitation prior to analysis
(Zar 2010). We used a chi-squared (x2) goodness-of-fit test to determine model fit
(Hosmer and Lemeshow 1978) and a Likelihood-Ratio test (LR x2) to determine
significance of the resulting model from a null model of twinning probability. Parameter
estimates (βi) from the model were used to determine the direction and magnitude of
influence (+/-) of model parameters on probability of twinning. We determined
significance of βi by evaluating 95% confidence intervals. Estimates with 95%
confidence intervals that did not over-lap 0 were determined to be significant components
of twinning probability for mule deer in Mojave.
We used the known-fates package in Program MARK (version 6.1, Cooch and
White 2009) to analyze monthly patterns of survival of mule deer, which corresponded to
our monthly efforts of monitoring status of radiocollars. The known-fates package uses a
binomial model to estimate probabilities of survival in a capture-mark-recapture
framework where capture occasions for individuals are recorded as 1) signal was heard
and animal was alive, 2) signal was heard and a mortality signal was detected, or 3)
animal was not heard and was censored from the capture occasion (Cooch and White
2009). To address our hypothesis that mule deer would have higher survival in the water-
provided area of Mojave, we first investigated the fixed effects of the 3 study areas on
overall probability of survival. We then evaluated models of general variation in survival
among months, seasons, and years. Next, we modeled climatic conditions as time-
varying group covariates to identify influence of annual and seasonal variation in
temperature, precipitation, and drought conditions on female survival. Finally, we

80
assessed the influence of individual-level conditions on patterns of survival (Table 1).
We included body fat and fetal rates as individual covariates, and the landscape metrics
of proximity to permanent sources of water, proximity to well-used roads, and
ruggedness as time-varying individual covariates. We did not have data related to body
condition and landscape metrics for individuals during all seasons and years, so we
standardized all individual and group covariates prior to model evaluation (Zar 2010).
This approach allowed the distribution of data to be centered on x where all individual
covariates missing those data could be assigned a ‘0’ and subsequently evaluated in
models of survival in Mojave.
We used Akaike’s Information Criterion adjusted for small sample sizes (AICc;
Akaike 1973) to evaluate candidate models of survival of mule deer in Mojave (Anderson
et al. 2000; Burnham and Anderson 2001). Models with the lowest AICc were
determined to be the most parsimonious (Burnham and Anderson 2002). We evaluated
AICc weights (wi) of all models within 2 AICc of the most parsimonious model to
determine the best supported model because the underlying formula incorporates a 2-unit
penalty for each model parameter to reduce over-fitting of data (Akaike 1973). We
derived model-averaged estimates of monthly survival of all models occurring within 2
AICc units of the top model by using weighted averages of survival probabilities
(Burnham and Anderson 2002). We calculated monthly and annual survival rates and
bootstrapped standard errors for the 3 study areas. We used estimates of βi from the top-
ranked model(s) of survival probability to determine the direction and magnitude of
influence (+/-) of treatments, weather patterns, body condition, productivity, and
landscape metrics. We determined significance of estimates by evaluating 95%

81
confidence intervals; those that did not over-lap 0 were determined to be significant
components of patterns of survival exhibited by mule deer in Mojave.
RESULTS
We captured and monitored 81 unique female mule deer in Mojave between 2008
and 2011. Most individuals were monitored for 10-12 months corresponding to the
length of GPS radiocollar deployment. Of the 81 animals, we investigated 17 confirmed
mortalities during the course of our study. Three of those mortalities occurred < 2 weeks
post-capture and were censored before our analysis of survival. We confirmed the cause
of death in 6 of 14 mortalities; mountain lion (Puma concolar) predation was the primary
cause of death (5 of 6 events). We were unable to determine cause of death for most
mortalities (8 of 14 events).
Logistical constraints during mule deer capture activities in 2010 prevented the
collection of MAXFAT and productivity measurements during that year. Thus, we only
evaluated differences in composition of body fat and productivity of mule deer in Mojave
from 2008, 2009, and 2011. We estimated composition of body fat for 76 adult females
consisting of 25 animals in the control area, 34 animals in the water-provided area, and
17 animals in the water-limited area. Depositions of body fat of mule deer in Mojave
ranged from a minimum of 1.05% and a maximum of 8.83%. We did not detect a
difference in composition of body fat among treatment area (F2,66 = 0.59, P = 0.555),
body mass (F1,66 = 0.40, P = 0.529), or a two-way interaction of treatment area by
precipitation (F2,66 = 0.45, P = 0.643). We detected a relationship between body fat and

82
total precipitation from previous year (F1,66 = 27.31, P < 0.001; Fig. 3). Our post hoc
regression analysis indicated that total precipitation from previous year explained
substantial variation in annual deposition of body fat (r2
= 0.70).
We evaluated twinning rates from a total of 74 adult females in the control (n =
23), water-provided (n = 34), and water limited (n = 17) areas. We determined that 69 of
74 females were pregnant at capture, while 44 of 74 females were carrying twins. The
logistic procedure produced a significant model (LR x2
= 6.17, P =0.046) that
distinguished females carrying twins at capture from those without twins. Parameter
estimates from the final model all overlapped 0 but only marginally. The resulting model
included an intercept term (βi = 0.381, 95% CI= -0.104–0.865) and additive effects of
both body fat (βi = 0.443, 95% CI= -0.047–0.933) and mass (βi = 0.453, 95% CI= -0.079–
0.985). We were unable to identify effects of treatment area, precipitation, or two-way
interactions of body fat by body mass, body fat by precipitation, or treatment area by
body fat. The goodness-of-fit test indicated the resulting model was consistent with a
logistic fit (x2
= 11.04, P = 0.199).
Our best model of monthly survival for 78 mule deer contained a fixed effect of
the control area and additive effects of fetal rate, ruggedness, proximity to permanent
sources of water, and proximity to maintained roads (AICc = 146.39, wi = 0.07; Table 2).
The highest ranked model differentiating probabilities of survival between the water-
provided treatment area and the water-limited area was not supported (ΔAICc = 3.20, wi =
0.014; Table 2). We detected marginal support for models containing an effect of total
accumulation of precipitation during the preceding summer (ΔAICc = 1.10, wi = 0.04;
Table 2) but confidence intervals for the parameter representing this effect overlapped 0
83
(βi = 0.567, 95% CI= -0.583–1.717). Models of survival containing effects of
temperature and drought conditions were less supported than the null model (ΔAICc =
5.47, wi = 0.005; Table 2) and were not considered informative.
Estimates of parameters from our top-ranked model of monthly survival
suggested the control area produced a positive effect on probability of survival for
animals inhabiting that area but the 95% confidence intervals overlapped 0 (Table 3). A
positive, but marginally supported, effect of fetal rate on probability of survival was
detected in the spring, summer, and autumn months following capture (Table 3). We
identified a negative effect of terrain ruggedness on probability of monthly survival
during the autumn, winter, and spring months but did not detect that relationship during
the summer months (Fig. 4; Table 3). We also detected a negative, but marginally
supported, effect of proximity to nearest source of water in the spring and a positive
effect of proximity to maintained roads during autumn (Table 3).
We derived model-averaged probabilities of survival from all models < 2 AICc
units of the top ranked model, which comprised 60% of the cumulative model weights.
Estimates of monthly survival (S ± SE) in the control area were constant during the
biological year (June through May) at 0.997 ± 0.001 (Fig. 5), which resulted in an annual
survival rate of 0.97 ± 0.004 (Fig. 6). Estimates of monthly survival in the treatment
areas were more variable where they fluctuated from 0.987 ± 0.002 during the summer
months to 0.984 ± 0.004 during the autumn and early winter months (Fig. 5). Variation
in monthly survival for the 2 treatment areas resulted in an annual estimate of survival of
0.852 ± 0.009 for both areas (Fig. 6).

84
DISCUSSION
We were unable to detect differences in body condition, productivity, or survival
where availability of water was improved compared to areas where access to water was
limited. Marshal et al. (2006a) postulated that adult mule deer with established home
ranges in a Sonoran Desert ecosystem were less likely to utilize recently developed
sources of water than younger animals without established home ranges, ultimately
suggesting a population level lag-effect in response to the presence of water
developments. Two of capture occasions where we collected data related to body
condition and productivity occurred before (2008) or immediately after (2009) livestock
catchments in the water-provided treatment area were reinstituted in the autumn of 2008.
During only one capture occasion (2011), were those data collected >1 year after the
establishment of new sources of water. Lack of differentiation in body condition of mule
deer among the 3 study areas could have resulted from a lag in response to the
augmentation of water sources.
Our findings highlight the importance of rainfall on body condition and
subsequent productivity of mule deer inhabiting a desert ecosystem, consistent with other
work investigating the influence of climatic conditions on demography of desert
ungulates (Cain et al. 2008; Fox et al. 2000; Marshal et al. 2008). The effects of
increased precipitation on mule deer is likely manifested through an increase in forage
availability and quality (Esparza-Carlos et al. 2011; Marshal et al. 2005a, 2005b), in
addition to increasing the availability of ephemeral sources of water. Following years of
high accumulations of rainfall, mule deer in Mojave exhibited a higher percentage of
85
body fat than following years of low rainfall. Interestingly, following the year of highest
rainfall (19.38 cm, 2010), mule deer did not have the highest percentage of body fat.
Nearly 15 cm of rainfall occurred during the winter months of 2010, while the subsequent
summer received substantially less (0.51 cm). In contrast, nearly 11 cm of rainfall
occurred during the summer of 2007, comprising 60% of the total rainfall from that year.
Mule deer captured during the subsequent winter exhibited the highest levels of body fat
during our study. Those results not only highlight the importance of total precipitation
but also indicate the importance of the timing of precipitation on body condition of an
ungulate inhabiting an arid environment.
Although composition of body fat and body mass contained marginal support in
our analysis of twinning rates of mule deer, our results suggest a positive effect of body
condition on likelihood of twinning. Furthermore, annual pregnancy rates of mule deer
in Mojave were generally high indicating nutritional condition of females was adequate
to support ovulation (Cook et al. 2004; Tollefson et al. 2010). Larger females, and those
with higher levels of body fat, were more likely to be carrying twins at capture than
smaller females and those with low levels of body fat. Our results corroborate the
findings of Tollefson et al. (2010) who observed that similar measures of body condition
were good predictors of twinning rates in captive mule deer. We were, however, unable
to identify an effect of water availability on productivity of females among our 3 study
areas. Bishop et al. (2009) also were unable to detect increases in fecundity of a mule
deer population in response to enhanced nutritional conditions in southern Colorado,
USA. Those authors, however, observed a significant effect of their treatment on
survival of juveniles. Females carrying twins likely maximizes individual fitness of mule

86
deer (Johnstone-Yellin et al. 2009). We were, however, unable to infer twinning rates at
capture to survival and subsequent recruitment into the breeding population of those
young. Effects of the provisioning of water on demography of mule deer in a water-
limited environment may be better manifested through its influence on survival and
recruitment of juveniles among our 3 study areas.
We found little support for effects of climatic conditions on survival of adult
females in Mojave. Although our results included a positive effect of total accumulation
of precipitation from the previous summer in our top suite of models (Table 3), the
confidence intervals for this effect overlapped 0. Additionally, effects of temperature and
drought were inconclusive. Survival of adult female mule deer, however, is generally
robust to climatic fluctuations and variation in adult survival may be only manifested
during extremely poor years (i.e., low rainfall and high temperatures; Gaillard et al.
2000). There was little variation in both temperature and drought among all years and
seasons of our study, which likely limited our ability to detect a relationship between
those climatic variables and survival.
We did not detect a strong relationship between body condition and survival of
adult female mule deer in Mojave but enhanced body condition has been linked to
increased survival of females (Bishop et al. 2009). We did, however, identify a
relationship between fetal rates and survival in our top model of survival, although the
effect of that parameter was not significant. Those results suggest that females carrying
twins at capture had higher survival. The inclusion of the parameter related to fetal rates
in our top model may be indicative of the importance of individual condition of females
on monthly survival in Mojave (i.e., some females may be better equipped to reproduce

87
and survive than others). Nonetheless, mule deer are a long-lived species and females
recruit few off-spring over a lifetime (Anderson 1981; Gaillard et al. 2000). Although
body condition of mule deer fluctuates in response to resource conditions on the
landscape (Fox and Krausman 1994; Marshal et al. 2008), survival of adult females is
relatively insensitive to changes in those conditions (Gaillard et al. 2000). Accordingly,
population dynamics of mule deer in Mojave may be better understood through
evaluation of birth rates and juvenile recruitment (Bishop et al. 2009; Gaillard et al. 2000;
Johnstone-Yellin et al. 2009).
We exercise caution in the interpretation of the negative effect of proximity to
water in spring and the positive effect of proximity to maintained roads in autumn in our
top model of survival. Both of those results were detected in the shortest seasons of the
year and the effect of proximity to maintained roads is counterintuitive to expectations.
During spring, when abundance and quality of vegetation in desert ecosystems are at their
maximum (Marshal et al. 2005a, 2005b), our top model of survival suggested that deer
closer to permanent sources of water had a lower probability of survival. We would
expect that mule deer would be least constrained by the acquisition of free-water during
this period. Thus, it is not surprising that deer would venture further from water sources
and proximity to water is not likely the proximate cause of reduced survival for deer in
those areas. Additionally, hunting season of adult males occurs during the autumn. A
popular strategy for hunting activity in the area is traveling by vehicle along roads, near
which Mojave personnel have documented illegal harvest of female mule deer (N. Darby,
unpublished data). Consequently, proximity to roads during the autumn is a risky
strategy for either sex of mule deer. Given the relatively small temporal scale of the

88
effect of proximity to water and maintained roads (i.e., 2 months) on survival of mule
deer, we suspect those effects to be an artifact of small sample sizes. The relationship
between survival and use of water and roads is in need of further evaluation.
Previous work evaluating landscape ruggedness of ungulates inhabiting a desert
ecosystem have identified preferences by those animals for heterogeneity in terrain
(Bleich et al. 1997; Fox and Krausman 1994; Ordway and Krausman 1986; Sanchez-
Rojas and Gallina 2000), a relationship that was also exhibited by mule deer in Mojave
(McKee 2012). A preference for rugged terrain could represent a predator avoidance
strategy, in which mule deer seek out areas that allow for long-distance detection of
danger and rapid escape (Connolly 1981; Geist 1998). Although mule deer in Mojave
preferentially selected areas of increased ruggedness (McKee 2012), we identified a
negative relationship between increased ruggedness and probability of survival of
females during the autumn, winter, and spring. Coyotes (Canis latrans) have been
identified as a primary predator of juvenile mule deer (Bishop et al. 2009; Connolly
1981; Hurley et al. 2011) and are more abundant in areas of decreased ruggedness
(Bleich et al. 1997). Mule deer will move to areas of more rugged habitat in response to
risk of predation by coyotes (Lingle 2002). Movement to rugged habitat could increase
the exposure of individuals to risk of predation by mountain lions (Beier et al. 1995;
Murphy and Ruth 2009; Pierce et al. 2004), a primary predator of adult mule deer
(Connolly 1981; Hurley et al. 2011). We acknowledge, however, that we were unable to
detect a relationship between female survival and terrain ruggedness during the summer,
a critical period of juvenile vulnerability (Bishop et al. 2009; Gaillard et al. 2000; Hurley
et al. 2011; Johnstone-Yellin et al. 2009). Additionally, selection of habitats with

89
increasing risk of predation is contrary to expectations associated with species that
exhibit life-history strategies consistent with strong density dependence (Gaillard et al.
2000). Continued monitoring of mule deer in Mojave will yield a better understanding of
the relationship between ruggedness and adult female survival.
Monthly and annual probabilities of survival of adult females in all 3 study areas
of Mojave were generally high and consistent with other populations of mule deer
(Bender et al. 2007; Bishop et al. 2005; Bishop et al. 2009; Hurley et al. 2011; Lukacs et
al. 2009). Interestingly, we were unable to differentiate patterns of survival between our
2 treatment areas but we identified significantly higher survival in the control study area.
The configuration of the landscape comprising the control area of Mojave consists of
gentle slopes with a dense vertical vegetation structure and few rugged ranges.
Consequently, the region may not be conducive to the stalk and ambush behavior of
mountain lions (Beier et al. 1995; Murphy and Ruth 2009; Pierce et al. 2004). We
suspect that higher survival of adult female mule deer in the control area is a result of a
reduction in predation risk. This hypothesis requires further study on predator abundance
and distributions in Mojave.
We did not identify variation in either monthly or annual estimates of survival,
indicating constant survival of mule deer during our study. Those results may be due to
short monitoring intervals of individuals, limiting our ability to detect variation, or, more
likely, sample size. Nonetheless, mature female ungulates generally exhibit little
temporal variation in survival (Gaillard et al. 2000), although evaluation of survival does
provide insight into the dynamics of the population as a whole (Bender et al. 2007;
Lukacs et al. 2009). Identification of variation in parameters related to recruitment of

90
neonates is likely a better indicator of population performance when adult survival is high
(Gaillard et al. 2000). Therefore, we may better understand the effects of manipulation of
water sources on mule deer by evaluating variation birth rates and survival of juveniles
among our 3 study areas.
The influence of water developments on body condition and demographic traits of
adult female mule deer in Mojave remains largely unknown. Because survival of mule
deer in Mojave was high and stable during our study, parameters related to recruitment of
young may be more variable and provide a better perspective of the overall importance of
development of water sources. Our results, however, describe findings from phase 1 of a
10 year study. During phase 2, water catchments in the water-limited area will be
reinstituted, which will likely provide further insight into life history strategies of those
mule deer and improve our likelihood of detecting effects of water developments on adult
females. Although not novel, we were able to identify a link between precipitation and
body fat, and body fat and fetal rates, and an indication of an overall effect of female
condition on survival. The description of baseline information related to those
components of demography provides an understanding of the general dynamics of a
formerly unstudied population of desert-dwelling herbivores.
ACKNOWLEDGEMENTS
We gratefully acknowledge financial and technical support from the National
Park Service, California Department of Fish and Game, Nevada Department of Wildlife,
University of Nevada in Reno, Safari Club International, the California Deer Association,

91
and the Boone and Crockett Club. We thank technicians N. Simpson, C. Morris, D.
Gonzalez, T. Brown, J. Zweifel, I. Knight, J. Saenz, and numerous volunteers who helped
collect data used in this manuscript. All capture and handing of mule deer were
compliant with procedures outlined by the California Department of Fish and Game,
were approved by the University of Nevada Reno’s Institutional Animal Care and Use
Committee (IACUC: 00058), and were consistent with the guidelines established by the
American Society of Mammalogists for care and use of wild mammals in research
(Gannon et al. 2007).
LITERATURE CITED
AKAIKE, H. 1973. Information theory as an extension of the maximum likelihood
principle. Pp. 267-281 in Second International Symposium on Information
Theory (B.N. Petrov and F. Csaki, eds.). Akademiai Kiado, Budapest.
ANDERSON, A. E. 1981. Morphological and Physiological Characteristics. Pp. 27-97 in
Mule and Black-tailed Deer of North America (O. C. Wallmo, ed.). University of
Nebraska Press, Lincoln, Nebraska, USA.
ANDERSON, D. R., K. P. BURNHAM, AND W. L. THOMPSON. 2000. Null hypothesis testing:
Problems, prevalence, and an alternative. Journal of Wildlife Management
64:912-923.
ANDREW, N. G., V. C. BLEICH, A. D. MORRISON, L. M. LESICKA, AND P. J. COOLEY.
2001. Wildlife mortalities associated with artificial water sources. Wildlife
Society Bulletin 29:275-280.

92
BEIER, P., D. CHOATE, AND R. H. BARRETT. 1995. Movement patterns of mountain lions
during different behaviors. Journal of Mammalogy 76:1056-1070.
BENDER, L. C., L. A. LOMAS, AND T. KAMIENSKI. 2007. Habitat effects on condition of
doe mule deer in arid mixed wood land-grassland. Rangeland Ecology and
Management 60:277-284.
BISHOP, C. J., J. W. UNSWORTH, AND E. O. GARTON. 2005. Mule deer survival among
adjacent populations in southwest Idaho. Journal of Wildlife Management
69:311-321.
BISHOP, C. J., G. C. WHITE, D. J. FREDDY, B. E. WATKINS, AND T. R. STEPHENSON. 2009.
Effect of enhanced nutrition on mule deer population rate of change. Wildlife
Monographs 172:1-28.
BLEICH, V. C., N. G. ANDREW, M. J. MARTIN, G. P. MULCAHY, A. M. PAULI, AND S. S.
ROSENSTOCK. 2006. Quality of water available to wildlife in desert environments:
Comparisons among anthropogenic and natural sources. Wildlife Society Bulletin
34:627-632.
BLEICH, V. C., R. T. BOWYER, AND J. D. WEHAUSEN. 1997. Sexual segregation in
mountain sheep: Resources or predation? Wildlife Monographs 132:1-50.
BLEICH, V. C., J. P. MARSHAL, AND N. G. ANDREW. 2010. Habitat use by a desert
ungulate: Predicting effects of water availability on mountain sheep. Journal of
Arid Environments 74:638-645.
BOCCADORI, S. J., P. J. WHITE, R. A. GARROTT, J. J. BORKOWSKI, AND T. L. DAVIS. 2008.
Yellowstone pronghorn alter resource selection after sagebrush decline. Journal of
Mammalogy 89:1031-1040.
93
BROYLES, B. 1995. Desert wildlife water developments: Questioning use in the
Southwest. Wildlife Society Bulletin 23:663-675.
BROYLES, B., AND T. L. CUTLER. 1999. Effect of surface water on desert bighorn sheep in
the Cabeza Prieta National Wildlife Refuge, southwestern Arizona. Wildlife
Society Bulletin 27:1082-1088.
BURNHAM, K. P., AND D. R. ANDERSON. 2001. Kullback-Leibler information as a basis
for strong inference in ecological studies. Wildlife Research 28:111-119.
BURNHAM, K. P., AND D. R. ANDERSON. 2002. Model selection and multi-model
inference: A practical information-theoretic approach. 2nd ed. Springer-Verlag,
New York, New York, USA.
CAIN, J. W., P. R. KRAUSMAN, J. R. MORGART, B. D. JANSEN, AND M. P. PEPPER. 2008.
Responses of desert bighorn sheep to removal of water sources. Wildlife
Monographs 171:1-32.
CONNOLLY, G. E. 1981. Limiting factors and population regulation. Pp. 245-285 in Mule
and black-tailed deer of North America (O. C. Wallmo, ed.). University of
Nebraska Press, Lincoln, Nebraska, USA.
COOCH, E. G., AND G. C. WHITE. 2009. Program MARK: a gentle introduction. Eighth
edition.
COOK, J. G., ET AL. 2004. Effects of summer-autumn nutrition and parturition date on
reproduction and survival of elk. Wildlife Monographs 155:1-61.
COOK, R. C., ET AL. 2010. Revisions of rump fat and body scoring indices for deer, elk,
and moose. Journal of Wildlife Management 74:880-896.

94
COOK, R. C., T. R. STEPHENSON, W. L. MYERS, J. G. COOK, AND L. A. SHIPLEY. 2007.
Validating predictive models of nutritional condition for mule deer. Journal of
Wildlife Management 71:1934-1943.
DESERT STUDIES CENTER. 2010. Climate of the Mojave Desert,
<http://biology.fullerton.edu/dsc/school/climate.html/>. Accessed 31 August
2011.
DOLAN, B. F. 2006. Water developments and desert bighorn sheep: Implications for
conservation. Wildlife Society Bulletin 34:642-646.
DUSSAULT, C., J. P. OUELLET, R. COURTOIS, J. HUOT, L. BRETON, AND H. JOLICOEUR.
2005. Linking moose habitat selection to limiting factors. Ecography 28:619-628.
EBERHARDT, L. L. 2002. A paradigm for population analysis of long-lived vertebrates.
Ecology 83:2841-2854.
ESPARZA-CARLOS, J. P., J. W. LAUNDRE, AND V. J. SOSA. 2011. Precipitation impacts on
mule deer habitat use in the Chihuahuan Desert of Mexico. Journal of Arid
Environments 75:1008-1015.
FOX, K. B., AND P. R. KRAUSMAN. 1994. Fawning habitat of desert mule deer.
Southwestern Naturalist 39:269-275.
FOX, L. M., P. R. KRAUSMAN, M. L. MORRISON, AND R. M. KATTNIG. 2000. Water and
nutrient content of forage in Sonoran pronghorn habitat, Arizona. California Fish
and Game 86:216-232.
GAILLARD, J. M., M. FESTA-BIANCHET, N. G. YOCCOZ, A. LOISON, AND C. TOIGO. 2000.
Temporal variation in fitness components and population dynamics of large
herbivores. Annual Review of Ecology and Systematics 31:367-393.

95
GANNON, W. L., R. S. SIKES, AND THE ANIMAL CARE AND USE COMMITTEE OF THE
AMERICAN SOCIETY OF MAMMALOGISTS. 2007. Guidelines of the American
Society of Mammalogists for the use of wild mammals in research. Journal of
Mammalogy 88:809-823.
HOSMER, D. W., AND S. LEMESHOW. 1978. Goodness of fit test for multiple logistic
regression model I: Theoretical development. Biometrics 34:735-735.
HURLEY, M. A., ET AL. 2011. Demographic response of mule deer to experimental
reduction of coyotes and mountain lions in southeastern Idaho. Wildlife
Monographs 178:1-33.
JOHNSTONE-YELLIN, T. L., L. A. SHIPLEY, W. L. MYERS, AND H. S. ROBINSON. 2009. To
twin or not to twin? Trade-offs in litter size and fawn survival in mule deer.
Journal of Mammalogy 90:453-460.
KIE, J. G., D. L. DRAWE, AND G. SCOTT. 1980. Changes in diet and nutrition with
increased herd size in Texas white-tailed deer. Journal of Range Management
33:28-34.
KIE, J. G., AND M. WHITE. 1985. Population-dynamics of white-tailed deer (Odocoileus
virginianus) on the Welder Wildlife Refuge, Texas. Southwestern Naturalist
30:105-118.
KRAUSMAN, P. R., AND R. C. ETCHBERGER. 1995. Response of desert ungulates to a water
project in Arizona. Journal of Wildlife Management 59:292-300.
KRAUSMAN, P. R., J. J. HERVERT, AND L. L. ORDWAY. 1985. Capturing deer and
mountain sheep with a net-gun. Wildlife Society Bulletin 13:71-73.

96
KRAUSMAN, P. R., S. S. ROSENSTOCK, AND J. W. CAIN. 2006. Developed waters for
wildlife: Science, perception, values, and controversy. Wildlife Society Bulletin
34:563-569.
LINGLE, S. 2002. Coyote predation and habitat segregation of white-tailed deer and mule
deer. Ecology 83:2037-2048.
LONGSHORE, K. M., C. LOWREY, AND D. B. THOMPSON. 2009. Compensating for
diminishing natural water: Predicting the impacts of water development on
summer habitat of desert bighorn sheep. Journal of Arid Environments 73:280-
286.
LUKACS, P. M., ET AL. 2009. Separating Components of Variation in Survival of Mule
Deer in Colorado. Journal of Wildlife Management 73:817-826.
MAHONEY, S. P., AND J. A. VIRGL. 2003. Habitat selection and demography of a
nonmigratory woodland caribou population in Newfoundland. Canadian Journal
of Zoology 81:321-334.
MARSHAL, J. P., V. C. BLEICH, P. R. KRAUSMAN, M. L. REED, AND N. G. ANDREW.
2006a. Factors affecting habitat use and distribution of desert mule deer in an arid
environment. Wildlife Society Bulletin 34:609-619.
MARSHAL, J. P., P. R. KRAUSMAN, AND V. C. BLEICH. 2005a. Dynamics of mule deer
forage in the Sonoran Desert. Journal of Arid Environments 60:593-609.
MARSHAL, J. P., P. R. KRAUSMAN, AND V. C. BLEICH. 2005b. Rainfall, temperature, and
forage dynamics affect nutritional quality of desert mule deer forage. Rangeland
Ecology and Management 58:360-365.

97
MARSHAL, J. P., P. R. KRAUSMAN, AND V. C. BLEICH. 2008. Body condition of mule deer
in the Sonoran Desert is related to rainfall. Southwestern Naturalist 53:311-318.
MARSHAL, J. P., P. R. KRAUSMAN, V. C. BLEICH, S. S. ROSENSTOCK, AND W. B.
BALLARD. 2006b. Gradients of forage biomass and ungulate use near wildlife
water developments. Wildlife Society Bulletin 34:620-626.
MARSHAL, J. P., L. M. LESICKA, V. C. BLEICH, P. R. KRAUSMAN, G. P. MULCAHY, AND N.
G. ANDREW. 2006c. Demography of desert mule deer in southeastern California.
California Fish and Game 92:55-66.
MCCULLOUGH, D. R. 1979. The George Reserve deer herd: Population ecology of a K-
selected species. The University of Michigan Press, Ann Arbor, Michigan, USA.
MCKEE, C. J. 2012. Spatial patterns and population performance of mule deer: Responses
to water provisioning in Mojave National Preserve, California. M. S. thesis,
University of Nevada-Reno, Reno, Nevada, USA.
MORGART, J. R., J. J. HERVERT, P. R. KRAUSMAN, J. L. BRIGHT, AND R. S. HENRY. 2005.
Sonoran pronghorn use of anthropogenic and natural water sources. Wildlife
Society Bulletin 33:51-60.
MURPHY, K., AND T. K. RUTH. 2009. Diet and prey selection of a perfect predator. Pp.
118-137 in Cougar: Ecology and Conservation (M. Hornocker and S. Negri, eds.).
The University of Chicago Press, Chicago, Illinois, USA.
NATIONAL PARK SERVICE. 2011. Nature and Science of Mojave National Preserve.
<http://www.nps.gov/moja/naturescience/index.htm>. Accessed 31 August 2011.

98
OEHLER, M. W., R. T. BOWYER, AND V. C. BLEICH. 2003. Home ranges of female
mountain sheep, Ovis canadensis nelsoni: Effects of precipitation in a desert
ecosystem. Mammalia 67:385-401.
ORDWAY, L. L., AND P. R. KRAUSMAN. 1986. Habitat use by desert mule deer. Journal of
Wildlife Management 50:677-683.
PALMER, W. C. 1965. Meteorological drought: Report 45. U.S. Department of
Commerce, Washington, D.C., USA.
PARKER, K. L., P. S. BARBOZA, AND M. P. GILLINGHAM. 2009. Nutrition integrates
environmental responses of ungulates. Functional Ecology 23:57-69.
PIERCE, B. M., R. T. BOWYER, AND V. C. BLEICH. 2004. Habitat selection by mule deer:
Forage benefits or risk of predation? Journal of Wildlife Management 68:533-
541.
RAUTENSTRAUCH, K. R., AND P. R. KRAUSMAN. 1989. Influence of water availability and
rainfall on movements of desert mule deer. Journal of Mammalogy 70:197-201.
RETTIE, W. J., AND P. D. MCLOUGHLIN. 1999. Overcoming radiotelemetry bias in habitat-
selection studies. Canadian Journal of Zoology 77:1175-1184.
ROSENSTOCK, S. S., W. B. BALLARD, AND J. C. DEVOS. 1999. Viewpoint: Benefits and
impacts of wildlife water developments. Journal of Range Management 52:302-
311.
ROSENSTOCK, S. S., J. J. HERVERT, V. C. BLEICH, AND P. R. KRAUSMAN. 2001. Muddying
the water with poor science: A reply to Broyles and Cutler. Wildlife Society
Bulletin 29:734-738.

99
SANCHEZ-ROJAS, G., AND S. GALLINA. 2000. Factors affecting habitat use by mule deer
(Odocoileus hemionus) in the central part of the Chihuahuan Desert, Mexico: An
assessment with univariate and multivariate methods. Ethology Ecology and
Evolution 12:405-417.
SAPPINGTON, J. M., K. M. LONGSHORE, AND D. B. THOMPSON. 2007. Quantifying
landscape ruggedness for animal habitat analysis: A case study using bighorn
sheep in the Mojave Desert. Journal of Wildlife Management 71:1419-1426.
SIMPSON, N. O., K. M. STEWART, AND V. B. BLEICH. 2011. What have we learned about
water developments for wildlife? Not enough! California Fish and Game 97:190-
209.
STEPHENSON, T. R., V. C. BLEICH, B. M. PIERCE, AND G. P. MULCAHY. 2002. Validation
of mule deer body composition using in vivo and post-mortem indices of
nutritional condition. Wildlife Society Bulletin 30:557-564.
STEPHENSON, T. R., J. W. TESTA, G. P. ADAMS, R. G. SASSER, C. C. SCHWARTZ, AND K. J.
HUNDERTMARK. 1995. Diagnosis of pregnancy and twinning in moose by
ultrasonography and serum assay. Alces 31:167-172.
STEWART, K. M., R. T. BOWYER, B. L. DICK, B. K. JOHNSON, AND J. G. KIE. 2005.
Density-dependent effects on physical condition and reproduction in North
American elk: An experimental test. Oecologia 143:85-93.
STEWART, K. M., R. T. BOWYER, J. G. KIE, N. J. CIMON, AND B. K. JOHNSON. 2002.
Temporospatial distributions of elk, mule deer, and cattle: Resource partitioning
and competitive displacement. Journal of Mammalogy 83:229-244.

100
THORNE, R. F., B. A. PRIGGE, AND J. HENRICKSON. 1981. A flora of the higher ranges and
the Kelso Dunes of the eastern Mojave Desert in California. ALISO 10:71-186.
TOLLEFSON, T. N., L. A. SHIPLEY, W. L. MYERS, D. H. KEISLER, AND N. DASGUPTA.
2010. Influence of summer and autumn nutrition on body condition and
reproduction in lactating mule deer. Journal of Wildlife Management 74:974-986.
UNITED STATES CONGRESS. 1994. Public Law 103-433, California Desert Protection Act
of 1994, 31 October 1994.
WADE, D. A., AND J. E. BROWNS. 1985. Procedures for evaluating predation on livestock
and wildlife. Texas Agriculture Extension Service Bulletin B-1429, College
Station, Texas, USA.
WHITING, J. C., R. T. BOWYER, J. T. FLINDERS, V. C. BLEICH, AND J. G. KIE. 2010. Sexual
segregation and use of water by bighorn sheep: Implications for conservation.
Animal Conservation 13:541-548.
ZAR, J. H. 2010. Biostatistical Analysis. Fifth Edition. Prentice Hall, Upper Saddle
River, New Jersey, USA.

101
Table 1. Description, abbreviation (Abbr), and effect category of parameters
investigated in models of survival for mule deer in Mojave National Preserve, California,
USA where the effects of permanent water provisioning on demography of mule deer
were investigated, 2008-2011.
Model Parameter Abbr Description Effect Type
Area AREA Study area Group
Body Condition BF Ingesta-free body fat (%) Covariate
Control Area CA Control area Group
Fetal Rate FR Fetal count at capture Covariate
Water H2O Distance to nearest source of water (m) Covariate†
Precipitation PREC Precipitation from previous summer (cm) Group
Maintained Roads RDS Distance to nearest maintained road (m) Covariate†
Ruggedness RUG Vector ruggedness metric (0 to 1) Covariate†
†Parameter evaluated as a time-varying individual covariate

102
Table 2. Candidate models of monthly survival of 78 mule deer in Mojave National Preserve, California, USA, 2008-2011.
Models were analyzed using Program MARK (version 6.1, Cooch and White 2009) and evaluated using differences in Akiake’s
Information Criterion values (ΔAICc) and model support (wi). Provided are the top 2 models of survival (wi = 0.129) and all
models containing an additional parameter (k) but occur < 2 AICc units of the top model. Certain effects were only detectable
during specific seasons and are indicated in parenthesis of the model description: spring (sp), summer (su), autumn (a), winter (w).
See Table 1 for parameter descriptions.
Model k AICc ΔAICc wi
CA + FR (sp,su,a) + RUG (a,w,sp) + H2O (sp) + RDS (a) 6 146.39 0.00 0.070
CA + FR (sp,su,a) + RUG (a,w,sp) + RDS (a) 5 146.72 0.33 0.059
CA + FR (sp,su,a) + RUG (a,w,sp) + RDS (a) + RUG*H2O (sp) 7 147.43 1.04 0.042
CA + PREC (a,w) + FR (sp,su,a) + RUG (a,w,sp) + H2O (sp) + RDS (a) 7 147.49 1.10 0.040
CA + PREC (a,w) + FR (sp,su,a) + RUG (a,w,sp) + H2O (sp,a) + RDS (a) 7 147.74 1.35 0.036
CA + FR (sp,su,a) + RUG (a,w,sp) + H2O (sp) + RDS (a) + BF (w) 7 147.95 1.57 0.032
CA + FR (sp,su,a) + RUG (a,w,sp) + H2O (sp) + RDS (a) + BF (w,sp) 7 148.27 1.88 0.027

103
CA + FR (sp,su,a) + RUG (a,w,sp) + H2O (sp) + RDS (a) + SU 7 148.29 1.91 0.027
CA + FR (sp,su,a) + RUG (a,w,sp) + H2O (sp) + RDS (a) + BF 7 148.36 1.97 0.026
AREA + PREC (a,w) + FR (sp,su,a) + RDS (a) + RUG (a) + H2O (sp) 8 149.59 3.20 0.014
NULL MODEL (.) 1 151.86 5.47 0.005
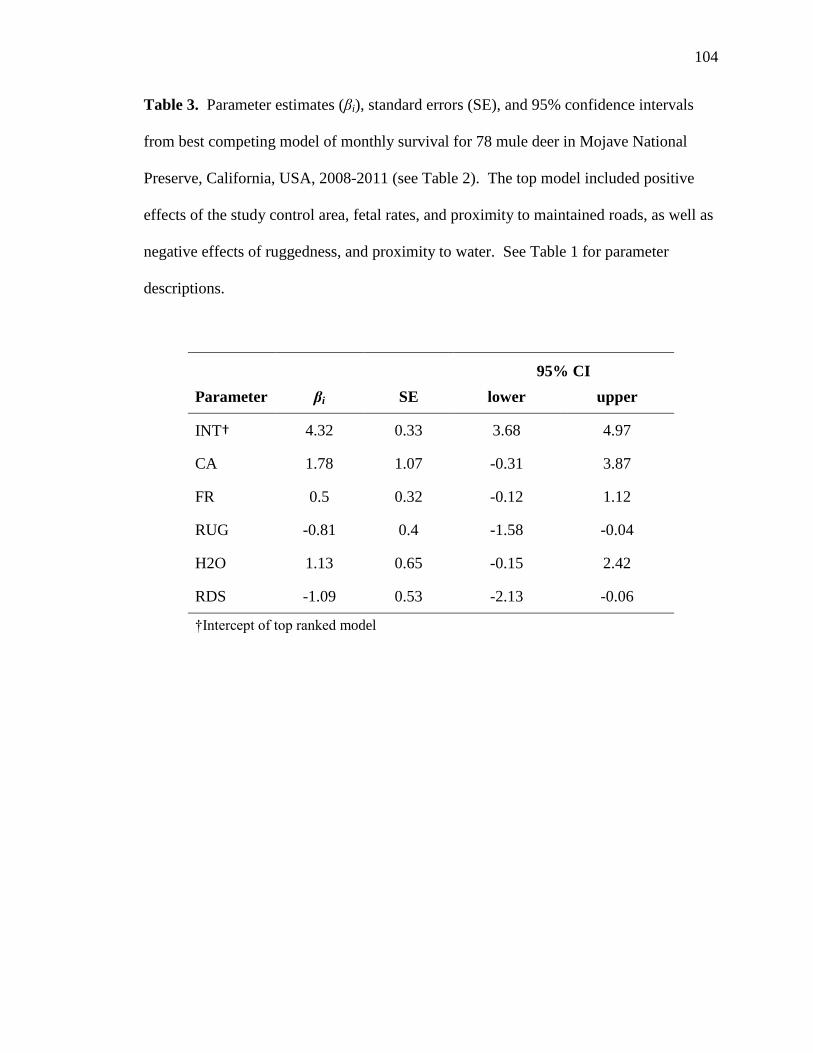
104
Table 3. Parameter estimates (βi), standard errors (SE), and 95% confidence intervals
from best competing model of monthly survival for 78 mule deer in Mojave National
Preserve, California, USA, 2008-2011 (see Table 2). The top model included positive
effects of the study control area, fetal rates, and proximity to maintained roads, as well as
negative effects of ruggedness, and proximity to water. See Table 1 for parameter
descriptions.
95% CI
Parameter βi SE lower upper
INT† 4.32 0.33 3.68 4.97
CA 1.78 1.07 -0.31 3.87
FR 0.5 0.32 -0.12 1.12
RUG -0.81 0.4 -1.58 -0.04
H2O 1.13 0.65 -0.15 2.42
RDS -1.09 0.53 -2.13 -0.06
†Intercept of top ranked model

105
FIGURE LEGENDS
Figure 1. Location of control and treatment areas in Mojave National Preserve,
southwestern California, USA, where the effects of permanent water provisioning on
demography of mule deer was investigated, 2008-2011.
Figure 2. Annual temperature and precipitation pattern used to delineate seasons in
Mojave National Preserve, California, USA, 2008-2011. Winter was identified as
December-March, spring as April-May, summer as June-September, and autumn as
October-November. Gradient-filled circles identify mid-winter (February) and mid-
summer (August) precipitation peaks, exhibiting a distinct bi-modal pattern of annual
precipitation. Climatological data were collected at Mitchell Caverns in central Mojave
National Preserve from 1958-1996.
Figure 3. Relationship between ingesta-free body fat (Cook et al. 2007) and
precipitation accumulation from previous year for mule deer in Mojave National
Preserve, California, USA where the effects of permanent water provisioning on
demography of mule deer were investigated, 2008-2011. We evaluated body fat of 16
animals captured in 2008, 28 animals in 2009, and 32 animals in 2011. A significant
relationship between body fat and total precipitation from previous year was detected (r2
= 0.70; F1,66 = 27.31, P < 0.001). Estimated depositions of body fat ( x ± SE; previous
year’s rainfall in parenthesis) of mule deer captured in 2008 was 6.76 ± 0.26% (19.05

106
cm), 2.91 ± 0.38% (16.21 cm) for mule deer captured in 2009, and 4.97 ± 0.31% (19.38
cm) for mule deer captured in 2011.
Figure 4. Relative probability of monthly survival (S) of mule deer (n = 78), while
holding other model parameters constant (see Table 3), for influence of terrain
ruggedness in Mojave National Preserve, California, USA, 2008-2011. We detected a
significant and negative effect of increased terrain ruggedness on monthly survival during
the autumn, winter, and spring (βi = -0.81, 95% CI= -1.58– -1.04). Solid curve represents
the relationship between monthly survival and terrain ruggedness, while dashed line
represents cumulative effect of ruggedness on autumn, winter, and spring survival.
Figure 5. Monthly patterns of survival (S) for mule deer in Mojave National Preserve,
California, USA during June through May, 2008-2011. Solid curve represents survival
patterns in the study control area (n = 23). Dashed curve represents survival patterns
exhibited by mule deer for both the water-provided treatment area (n = 37) and the water-
limited treatment area (n = 15).
Figure 6. Annual estimates of survival (S) for mule deer in 3 study areas of Mojave
National Preserve, California, USA where the effects of permanent water provisioning on
demography of mule deer were investigated, 2008-2011. Sample size (n) indicated above
survival estimates in figure.

107
Figure 1
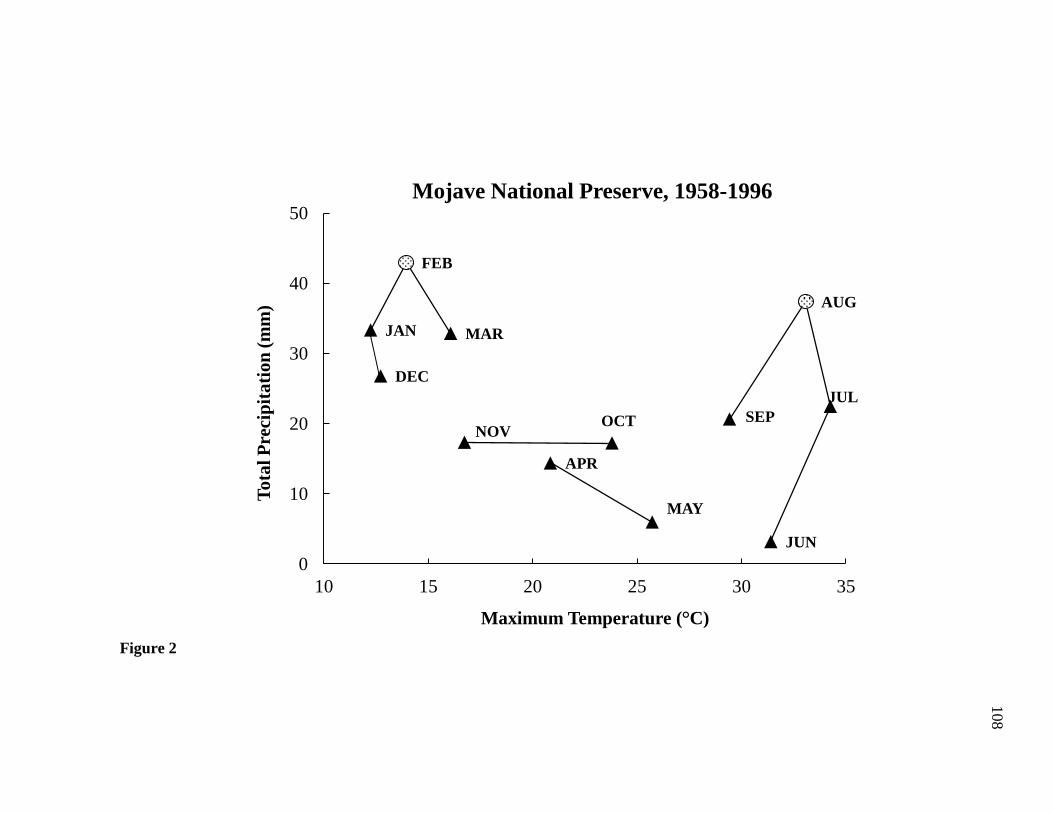
108
Figure 2
JAN
FEB
MAR
APR
MAY
JUN
JUL
AUG
SEP OCT NOV
DEC
0
10
20
30
40
50
10 15 20 25 30 35
To
tal
Pre
cip
ita
tio
n (
mm
)
Maximum Temperature (°C)
Mojave National Preserve, 1958-1996

109
Figure 3
15
16
17
18
19
20
0
2
4
6
8
2008 2009 2011
Pre
vio
us
yea
r p
reci
pit
ati
on
(cm
)
Ing
esta
-fre
e b
od
y f
at
(%)
Year
Body Fat
Precipitation

110
Figure 4
0
0.2
0.4
0.6
0.8
1
0 0.001 0.002 0.003 0.004 0.005
Rel
ati
ve
Pro
ba
bil
ity
of
Su
rviv
al
(S)
Vector Ruggedness Metric (vrm)
Monthly
Cumulative

111
Figure 5
0.97
0.98
0.99
1
JUN JUL AUG SEP OCT NOV DEC JAN FEB MAR APR MAY
Pro
ba
bil
ity
of
Mo
nth
y S
urv
iva
l (S
)
Month
Control Area
Treatment Areas

112
112
Figure 6
n = 23
n = 37 n = 15
0.70
0.75
0.80
0.85
0.90
0.95
1.00
Control Water-Provided Water-Limited
Pro
ba
bil
ity
of
An
nu
al
Su
rviv
al (S
)
Study Area

113
THESIS SUMMARY
Effects of water developments on spatial patterns and population performance of
ungulates inhabiting a desert ecosystem still remains largely unknown. Our findings of
constricted distributions by mule deer and the overall importance of free-water in patterns
of resource selection support our original predictions of changes in special patterns in
response to the provisioning of water. Nevertheless, those results have undoubtedly been
confounded by landscape-level disturbance caused by a large wildfire. Indeed, we
encountered many of the same issues as our predecessors investigating the utility of water
provisioning for desert ungulates (Broyles and Cutler 1999, Marshal et al. 2006, Cain et
al. 2008). Attributing our findings in movement and selection exclusively to improved
density and distribution of permanent sources of water would be a misleading
interpretation of the results from our research. Wildfire often promotes the regeneration
of forage of high nutritional quality to ungulates in fire-adapted ecosystems (Ruthven et
al. 2000, Holl et al. 2004, Bleich et al. 2008, Long et al. 2008, Meek et al. 2008). The
relationship between wildfire and habitat productivity for ungulates appears to also be
true in a desert system where historical fire regimes were likely infrequent. Additional
research characterizing the quality of vegetation communities following wildfire in
Mojave National Preserve, California would provide insight into the relationship between
wildfire disturbance and habitat productivity, and the effects of that relationship on use of
permanent water by mule deer.
We identified a link between precipitation and body fat of mule deer, and body fat
and fetal rates, and an indication of an overall effect of female condition on survival.

114
Indeed, precipitation appears to be a vital climatic component driving those traits of
demography and its importance is manifested through fluctuations in quantity and
availability of forage (Marshal et al. 2005b;a, Esparza-Carlos et al. 2011). As climatic
conditions become more stochastic due to future changes in global climate (Longshore et
al. 2009), the preservation and provisioning of water in desert environments will likely
become necessary to augment variability in natural precipitation.
We did not detect improvements in body condition, fetal rates, or survival of mule
deer in response to water-provisioning. We were also unable to infer those fetal rates at
capture to subsequent recruitment of young into the breeding population. Mature female
ungulates generally exhibit little temporal variation in survival (Gaillard et al. 2000),
which is a relationship that appears to be true in our 3 study areas. Identification of
variation in parameters related to recruitment of neonates is likely a better indicator of
population performance when adult survival is high (Gaillard et al. 2000). Therefore, the
effects of manipulation of water sources on mule deer may be better understood by
evaluating parameters related to juvenile recruitment.
The findings presented in this thesis are from phase 1 of a 2 phase study
conducted over 10 years. During phase 2, water catchments of the water-limited study
area will be reinstituted, which will likely provide further insight into life-history
strategies of mule deer in Mojave National Preserve and improve our likelihood of
detecting effects of water developments on population performance. This information
related to space use and population performance relative to provisioning of water and
wildfire, nonetheless, provide a better understanding of the general dynamics of a
formerly unstudied population of desert-dwelling herbivore.

115
LITERATURE CITED
Bleich, V. C., H. E. Johnson, S. A. Holl, L. Konde, S. G. Torres, and P. R. Krausman.
2008. Fire history in a chaparral ecosystem: Implications for conservation of a
native ungulate. Rangeland Ecology and Management 61:571-579.
Broyles, B., and T. L. Cutler. 1999. Effect of surface water on desert bighorn sheep in the
Cabeza Prieta National Wildlife Refuge, southwestern Arizona. Wildlife Society
Bulletin 27:1082-1088.
Cain, J. W., P. R. Krausman, J. R. Morgart, B. D. Jansen, and M. P. Pepper. 2008.
Responses of desert bighorn sheep to removal of water sources. Wildlife
Monographs 171:1-32.
Esparza-Carlos, J. P., J. W. Laundre, and V. J. Sosa. 2011. Precipitation impacts on mule
deer habitat use in the Chihuahuan Desert of Mexico. Journal of Arid
Environments 75:1008-1015.
Gaillard, J. M., M. Festa-Bianchet, N. G. Yoccoz, A. Loison, and C. Toigo. 2000.
Temporal variation in fitness components and population dynamics of large
herbivores. Annual Review of Ecology and Systematics 31:367-393.
Holl, S. A., V. C. Bleich, and S. G. Torres. 2004. Population dynamics of bighorn sheep
in the San Gabriel Mountains, California, 1967-2002. Wildlife Society Bulletin
32:412-426.
Long, R. A., J. L. Rachlow, J. G. Kie, and M. Vavra. 2008. Fuels reduction in a western
coniferous forest: Effects on quantity and quality of forage for elk. Rangeland
Ecology and Management 61:302-313.

116
Longshore, K. M., C. Lowrey, and D. B. Thompson. 2009. Compensating for diminishing
natural water: Predicting the impacts of water development on summer habitat of
desert bighorn sheep. Journal of Arid Environments 73:280-286.
Marshal, J. P., V. C. Bleich, P. R. Krausman, M. L. Reed, and N. G. Andrew. 2006.
Factors affecting habitat use and distribution of desert mule deer in an arid
environment. Wildlife Society Bulletin 34:609-619.
Marshal, J. P., P. R. Krausman, and V. C. Bleich. 2005a. Dynamics of mule deer forage
in the Sonoran Desert. Journal of Arid Environments 60:593-609.
_____. 2005b. Rainfall, temperature, and forage dynamics affect nutritional quality of
desert mule deer forage. Rangeland Ecology and Management 58:360-365.
Meek, M. G., S. M. Cooper, M. K. Owens, R. M. Cooper, and A. L. Wappel. 2008.
White-tailed deer distribution in response to patch burning on rangeland. Journal
of Arid Environments 72:2026-2033.
Ruthven, D. C., J. F. Gallagher, and D. R. Synatzske. 2000. Effect of fire and grazing on
forbs in the western South Texas Plains. Southwestern Naturalist 45:89-94.