to Appear in the Fed’s ZIRP. Courtesy of Berkadia Mortgage ...
17
Volume VII Issue 1 A Publication of Paramount Capital Corporation Jan 15, 2015 Strategy and Insight for the Commercial Real Estate Industry Inside This Issue: Real Estate Focus: Cracks are Beginning to Appear in the Fed’s ZIRP. CRE Financing Rates, Courtesy of Berkadia Commercial Mortgage, LLC. REIT Returns. Economic/Investment Focus: Financial Repression Redux. Alternative Investments. Are Stocks Massively Overvalued? REIT Focus: Avalon Bay Communities, Inc., an Apartment REIT. REAL ESTATE FOCUS Cracks are Beginning to Appear in the Fed’s ZIRP The great wall of the Federal Reserve’s ZIRP (zero interest rate policy) is beginning to crack, as a number of companies that used cheap Fed debt to grow by buying overvalued real estate assets at a rapid, dangerous and uncontrolled clip are in a death spiral. ZIRP has created distortions in the capital markets, by lowering the cost of capital to unrealistic levels, which inflates asset values to nose bleed levels and increases risk. Many investment, hedge and institutional funds have used this low cost of capital to acquire operating companies, real estate, common stocks, art, bonds, oil and other assets, further pushing up the price for these assets and lowering yields. The assets are also levered up to 60%-80% of cost at very low floating rates over LIBOR or treasuries. Two real estate companies that have leveraged their way to growth recently are American Realty Capital Properties, Inc., (ARCP) the largest net lease REIT and Ocwen Financial Corporation, (OCN) the largest
Transcript of to Appear in the Fed’s ZIRP. Courtesy of Berkadia Mortgage ...

Volume VII Issue 1 A Publication of Paramount Capital
Corporation Jan 15, 2015
Strategy and Insight for the Commercial Real Estate Industry
Inside This Issue:
Real Estate Focus:
Cracks are Beginning
to Appear in the Fed’s
ZIRP.
CRE Financing Rates,
Courtesy of Berkadia
Commercial
Mortgage, LLC.
REIT Returns.
Economic/Investment
Focus:
Financial Repression
Redux.
Alternative
Investments.
Are Stocks Massively
Overvalued?
REIT Focus:
Avalon Bay
Communities, Inc., an
Apartment REIT.
REAL ESTATE FOCUS
Cracks are Beginning to Appear in the Fed’s ZIRP
The great wall of the Federal Reserve’s ZIRP (zero interest rate policy) is beginning to
crack, as a number of companies that used cheap Fed debt to grow by buying overvalued
real estate assets at a rapid, dangerous and uncontrolled clip are in a death spiral. ZIRP has
created distortions in the capital markets, by lowering the cost of capital to unrealistic
levels, which inflates asset values to nose bleed levels and increases risk. Many investment,
hedge and institutional funds have used this low cost of capital to acquire operating
companies, real estate, common stocks, art, bonds, oil and other assets, further pushing up
the price for these assets and lowering yields. The assets are also levered up to 60%-80% of
cost at very low floating rates over LIBOR or treasuries. Two real estate companies that
have leveraged their way to growth recently are American Realty Capital Properties, Inc.,
(ARCP) the largest net lease REIT and Ocwen Financial Corporation, (OCN) the largest

mortgage servicer of single family loans.
ARCP is a high flying net lease REIT that was cobbled together into a $18 billion asset
behemoth by Mr. Nicholas Schorsch, a slippery New York based CRE promoter. In the
span of a few years, Mr. Schorsch grew ARCP into the largest net lease REIT, by using
cheap debt capital in a dizzying array of acquisitions. In 2013 and 2014, Mr. Schorsh
engineered the acquisition of at eight large net lease companies and portfolios totaling over
$16 billion at very inflated cap rates of between 5% and 6%. Net lease portfolios should
trade in the 7% to 8% cap rate area. The majority of the net lease deals that ARCP now
owns are net leased to retailers like Walgreens and Dollar General and restaurants like Red
Lobster. ARCP substantially overpaid for all these acquisitions and is saddled with more
than $8.8 billion in debt and $2.3 billion in goodwill. Any REIT that is required to book
$2.3 billion in goodwill on acquisitions has severely overpaid for those assets. This means
that ARCP’s auditing firm could not allocate the full inflated purchase price to the real
estate assets acquired and had to charge the excess to goodwill.
Things started deteriorating for ARCP in April 2014, when one of its largest institutional
investors, sent a letter to the board of directors asking for the company to stop making these
large acquisitions, so that the financial statements could be analyzed without the volatility
of all the deal making. Mr. Schorsch was subsequently forced to resign as CEO and a new
CEO was hired. During mid-2014, ARCP disclosed that there were intentional
misstatements in its financial statements of approximately $23 million, which resulted in
the entire executive suite resigning including Mr. Schorsch. This included the new CEO
(who had replaced Mr. Schorsch), CFO, COO and CAO. ARCP has also delayed filing its
3rd
quarter 10Q until late January 2015 and is in the process of hiring a new executive team.
Due to the overpayment of assets, accounting misstatements and management turmoil, the
stock of ARCP has dropped from $15/sh. to $9/sh. or -40% during the last year.
The other high flying real estate company that grew on a cheap debt fueled expansion and
crashed, is Ocwen Financial Corp. Ocwen was formed by Bill Erbey back in the early
nineties to buy and workout CRE assets from S&L’s and other lenders in the first secular
CRE downturn that lasted from 1987 to 1992. Ocwen grew tremendously and morphed into
the largest servicer of single family mortgages in the county with assets of $8.3 billion as of
9/30/14. During the last few years, Ocwen spun off four different public companies,
Alitsource Portfolio Solutions (ASPS), that provides foreclosure and other services to
Ocwen’s servicing portfolio, Home Loan Servicing Solutions (HLSS), a company that
acquires mortgage servicing rights, Altisource Residential Corporation (RESI), a REIT that
owns non-performing single family loans and homes and Altisource Asset Management
Corporation (AAMC), the asset manager for RESI. The organization chart of this
convoluted group of companies looks like the schematic diagram for the Space Shuttle.
The growth of Ocwen and these spin-offs took off during the last few years until the Fall of
2014. During that period, Ocwen was sued by the NY State Department of Financial
Services and the U.S. Consumer Financial Protection Bureau (CFPB) for shoddy loan
serving practices and had to pay a $2.1 billion settlement to the CFPB. Mr. Erbey was
forced to resign as CEO of Ocwen and his board positions on the four spin-offs. Early in

2015, the State of CA alerted Ocwen that it may suspend its mortgage servicing license for
various company violations. All these regulatory sanctions have frozen Ocwen’s
acquisitions of new mortgages to service and severely curtailed its business and that of the
spin-offs. The stock prices of Ocwen and its spin-offs have dropped like lead balloons.
During the last year, the price of Ocwen has declined from $52/sh. to $6/sh. or -88%, ASPS
from $162/sh. to $17/sh. or -89%, HLSS from $23/sh. to $13/sh. or -43%, RESI from
$35/sh. to $16/sh. or 54% and AAMC from $1,209/sh. to $161/sh. or -87%.
No doubt there are other real estate centric companies that are suffering from overpriced
acquisitions and high leverage and we suspect many of these will be exposed in 2015.
CRE Financing Rates
The beginning of 2015 is off to a running start as 10 Year T-Notes hit their lowest levels
since the first quarter of 2013. While many economists predicted rising interest rates for
this year, a weakened global economy keeps inflation fears in check. And even if the Fed
raises rates later this year, the impact should be minimal on long-term rates as international
investors flee to safety of U.S. treasuries.
Such news continues to benefit borrowers and sellers as CRE pricing levels stay at
extremely favorable levels. Pressure continues on investors to find reasonable debt and
equity yields as outlined below:
10-yr UST @ 2.08% + 120 to 210 bps = 3.28% to 4.18%
5-yr UST @ 1.6% + 140 to 250 bps = 3% to 4.1%
10-yr Swap @ 2.29% + 160 to 210 bps = 3.89% to 4.39% (Conduit)
FHA 223(f) refi program at 3.20% + 60 bps MIP and FHA 221(d) (4) new-
construction program at 3.65% + 65 bps MIP.
As has been the case for the past three years, mortgage spreads consistently
dropping lower (5-10 bps)
Yields across the CRE spectrum compressing, as in select instances for core
properties, capitalization rates fall within 100 basis points of longer term rates
Financing rates and data are courtesy of John Oharenko, Senior Vice President, Berkadia
Commercial Mortgage, LLC, [email protected], 312-845-8565 and feel free to
contact John for your real estate financing needs.
REIT Returns
The table below shows the total return including dividends for our REIT buy
recommendations since 9/13 and the FTSE NAREIT Equity Index for 2014.
REIT Date of Buy
Recommendation
Buy
Stock
Price
Current
Stock Price
Total
Return
(1)
Highwoods Properties, Inc. (HIW) 9/15/13 $35 $47 27%

Mack-Cali Realty Corp. (CLI) 10/15/13 $21 $19 -6%
Home Properties, Inc. (HME) 11/15/13 $54 $71 27%
Brandywine Realty Trust (BDN) 2/15/14 $14 $16 9%
Weingarten Realty Investors
(WRI)
4/15/14 $30 $37 13%
First Industrial Realty Trust (FR) 12/15/14 19 $22 13%
FTSE NAREIT Equity REITs
(YTD Total Return)
NA NA NA 28%
1. Price appreciation plus the dividend.
ECONOMIC/INVESTMENT FOCUS
Financial Repression Redux
Financial Repression is again rearing its ugly head and refers to several schemes used by a
government or central bank to force or channel investor capital to acquire government
securities. This allows indebted governments to keep issuing debt at lower interest rates
than would otherwise be possible. This is what has been occurring in the U.S., Japan and
the European Union since 2008. Unrealistically low nominal interest rates allow
governments to reduce their debt service costs, continue to spend money and fund massive
budget deficits. Financial repression has lowered worldwide interest rates to unprecedented
levels. The 10 Year T-Note in the U.S. is down to 1.77%, the German 10 Year Note is at
.42% (lowest ever) and the Japanese 10 Year Note is at .26% (lowest ever). Why would any
smart investor lend their money for ten years to the U.S., EU or Japan at these ridiculously
low rates? Because they are scared by all the geopolitical turmoil around the world and are
parking money in government securities for safety. Prior to the Great Recession, investors
poured excess funds into money market accounts that yielded 3%-5% when there was
nervousness in the market. Today, they are buying Treasury securities because the average
interest rate on money market funds is about 2 basis points. With a total U.S. debt of $18.3
trillion, this is a very scary scenario and one we will keep harping on here at VOM.
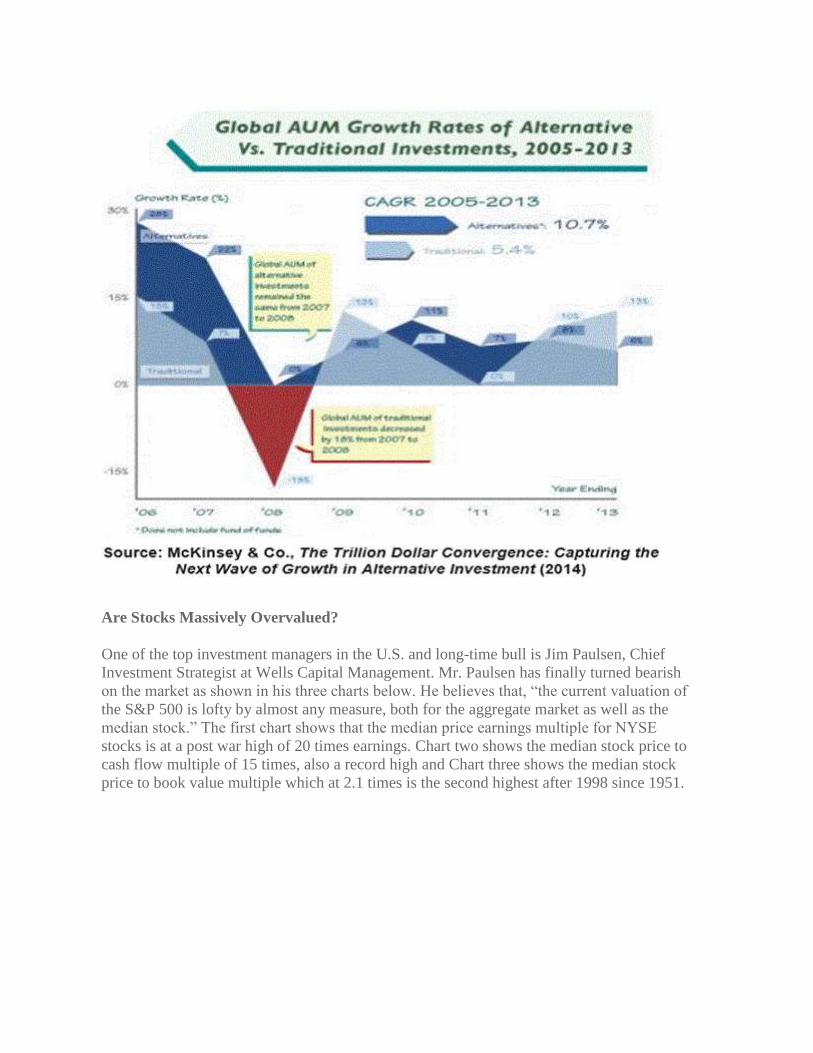
Alternative Investments
One of our favorite sites here at VOM is www.finalteratives.com, which provides
information and articles on hedge and private equity funds. An excellent article was on the
site in early January by Sang H. Lee, Founder and CEO of Darcmatter, titled, “Appetite for
Alternative Investments Grow”. In the article, Mr. Lee discusses the growth of alternative
assets including hedge funds, private equity, real estate, commodities, venture capital and
futures investments. All investors should have an asset allocation to alternative assets. For
individuals, 10%-15% of their portfolio should be in REIT stocks via a REIT ETF
(exchange traded fund) from Vanguard or iShares. We would not recommend individuals
invest in the other alternative assets as they are high risk and have hefty fees. The
interesting charts below are from Mr. Lee’s article and show the tremendous growth and
rates of return in alternative assets from 2005 to 2013

Are Stocks Massively Overvalued?
One of the top investment managers in the U.S. and long-time bull is Jim Paulsen, Chief
Investment Strategist at Wells Capital Management. Mr. Paulsen has finally turned bearish
on the market as shown in his three charts below. He believes that, “the current valuation of
the S&P 500 is lofty by almost any measure, both for the aggregate market as well as the
median stock.” The first chart shows that the median price earnings multiple for NYSE
stocks is at a post war high of 20 times earnings. Chart two shows the median stock price to
cash flow multiple of 15 times, also a record high and Chart three shows the median stock
price to book value multiple which at 2.1 times is the second highest after 1998 since 1951.


REIT FOCUS
Summary
This month’s REIT Focus is on Avalon Bay Communities, Inc. (“AVB”), a publicly traded
REIT specializing in the acquisition, ownership, operation, development and management
of apartment communities, primarily in high barrier to entry markets in the U.S. AVB owns
directly or held interests in 247 apartment communities containing 73,182 apartment
homes, with six communities containing 2,094 units under reconstruction and 27
communities containing 9,151 apartment homes under construction.
Property Information
AVB’s apartment communities are located in 11 states and the District of Columbia. The
average occupancy, monthly rent and Q3-14 yoy rental revenue increase were 95.7%,
$2,271 and 3.7%, respectively.
Major Events
In September 2014, AVB sold forward, 4.5 million shares of common stock at a net price
less fees and discounts of $151.74 per share, with settlement on or before September 2015.
As of Q3-14, AVB had 27 apartment communities under construction, containing 9,151

units and a total cost of $3.2 billion.
Corporate Data
AVB was incorporated in Maryland in 1995, is traded on the NYSE and is located in
Arlington, VA. AVB’s debt is rated BBB+ by Standard & Poor’s and Baa1 by Moody’s.
AVB has 132 million common shares outstanding and a market capitalization of
approximately $23.43 billion.
Management
Timothy J. Naughton, 52, Chairman, CEO and President. Mr. Naughton has served as
Chairman of the Board since May 2013, CEO since January 2012, and as President since
February 2005. Previously, Mr. Naugthon was a director of AVB since September 2005.
Prior to becoming COO, Mr. Naughton served as Senior Vice President and Chief
Investment Officer, and prior to that he was a Regional Vice President, Development and
Acquisitions in the Mid-Atlantic and Midwest. Mr. Naughton has been with the company
or its predecessors since 1989. Mr. Naughton received his MBA from Harvard Business
School and earned his undergraduate degree in Economics from the University of Virginia,
where he graduated with High Distinction and was elected to Phi Beta Kappa.
Kevin O’Shea, 48, Chief Financial Officer. Mr. O’Shea is responsible for the Financial,
Capital Markets, Investor Relations, Risk Management, and Accounting operations of
AVB. Mr. O’Shea is also a member of AVB’s Management Investment Committee. Prior
to being named CFO, effective June 2014, Mr. O’Shea served in several capacities within
the AVB’s Financial Services Department, including Executive Vice President Capital
Markets, Senior Vice President Investment Management, and Vice President Investment
Management. Mr. O’Shea holds an MBA from Harvard University, a JD from Southern
Methodist University and a BA from Boston College.
Matthew H. Birenbaum, 48, Chief Investment Officer. Mr. Birenbaum is responsible for
AVB’s investment strategy and oversees the Investments, Design, Sustainability and
Market Research functions and also chairs the Management Investment Committee. Most
recently, Mr. Birenbaum had been the founding principal of Abbey Road Property Group, a
boutique development and investment firm focused on infill multifamily and mixed-use
projects in the greater Washington DC area. Prior to founding Abbey Road, Mr. Birenbaum
was Senior Vice President at EYA from 2003-2006 (formerly Eakin/Youngentob
Associates), where he directed and supervised all activities in the land acquisition and
development group for this award-winning builder and developer of architecturally
distinguished townhomes and condominiums. Mr. Birenbaum received his MBA from The
Kellogg Graduate School of Management at Northwestern University, where he graduated
with honors, and a BA from Brown University, where he graduated Phi Beta Kappa. Mr.
Birenbaum has served on the board of the L’Enfant Trust, a historic preservation group in
Washington, DC, is an active member of ULI, and is certified LEED-AP.
Ownership

Top Institutional Holders: Shares %
Vanguard Specialized REIT Index Fund 9,493,886 7.19
Invesco 7,665,389 5.81
State Street Corporation 5,831,913 4.42
JP Morgan Chase Co. 5,358,162 4.06
Blackrock Institutional Trust Co. 5,140,152 3.89
Ownership Breakdown
% of Shares Held by All Insider and 5% Owners 1%
% of Shares Held by Institutional & Mutual Fund Owners 99%
Number of Institutions Holding Shares 430
Financial Analysis and Valuation
Select financial data for AVB as of the Q3-14 10Q, 2013 10K and supplemental
information (in millions where applicable):
Financial Data
Real Estate Assets, Gross $17,442
Total Assets $15,881
Property Debt (weighted average fixed rate and variable rate is
4.5% and 1.8%, respectively)
$6,241
Common Stockholders’ Equity $9,045
Revenue $1,244
Net Income $540
Net Income Per Share $4.15
Cash Flow from Operations $641
Revolving Unsecured Credit Facility ($1,300 with $117 used) $1,183
Market Capitalization $23,430
Property Debt to:
Gross Real Estate Assets 36%
Market Capitalization 27%
Enterprise Value 21%
Dividend and Yield ($4.64/sh.) 2.6%
Valuation Methodology
Q3-14 Revenue Annualized $1,720
Less: Q3-14 Operating Expenses Annualized (excluding
depreciation, amortization and interest expense and less G&A
expenses)
648
Annualized Net Operating Income 2014 1,072
Projected Inflation Rate at 3.5% x1.035
Projected Forward NOI for Next Year $1,109
Projected Cap Rate 5.5%

Projected Asset Value of Company $20,173
Add: Land Held for Development (at book value) 176
Construction in Progress (at book value) 1,343
Net Operating Working Capital (at book value) 270
Investment in Unconsolidated Entities (at book value) 305
Total Projected Asset Value of Company $22,267
Less: Noncontrolling Interests (at book value) (12)
Total Debt Per Above (6,241)
Projected Net Asset Value of the Company $16,014
Common Shares Outstanding 132.6M (132M common stock shares
and .6M option and incentive shares)
Projected NAV Per Share $121
Market Price Per Share on 12/15/14 $177
Premium (Discount) to NAV 46%
Financial Metrics
The gross real estate assets, property debt, revenues, net income, funds from operations,
return on invested capital and dividends per share for the years 2009 through Q3-2014 are
shown in the table below:
(millions except per share
amounts)
2009 2010 2011 2012 2013 Q3-2014
Gross Real Estate Assets $8,183 $8,660 $9,286 $9,620 $16,773 $17,442
Property Debt $3,974 $4,067 $3,632 $3,850 $6,144 $6,241
Revenues $851 $895 $968 $1,000 $1,462 $1,244
Net Income $155 $175 $441 $423 $353 $540
Funds From Operations
(FFO) $313 $338 $414 $521 $642 $717
Return on Invested Capital
(1) 5.5% 4.7% 5.8% 6.8% 5% NA
Dividends Per Share $3.57 $3.57 $3.57 $3.88 $4.28 $3.48(2)
(1) This is the ratio of cash provided by operations divided by stockholders equity plus
property debt, less cash, and measures the return the REIT is earning on its invested capital.
(2) Dividend is currently $1.16 per quarter.
The total return of AVB year to date and through five years is show in the chart below:
AVB Total Return YTD (11/14) 1-Yr 3-yr 5-Yr
39.4% 40.3% 12.2% 21.2%

As shown above, our net asset value per share for AVB is $121/sh., versus a market price
of $177/sh. Current average cap rates for apartment properties per our industry experience
and CBRE’s Cap Rate Survey are in the 3.5% to 8% range, depending on the location, age
and quality of the property. We have used an average cap rate of 5.5% due to AVBHH’s
portfolio being primarily Class A apartments located in higher barrier to entry markets.
Valuation Analysis
AVB’s strengths, concerns and recommendations are as follows:
Strengths:
Excellent management team and quality portfolio of apartment assets.
Solid occupancy of 95.7% and yoy rent revenue increase of 3.7%.
Low leverage at 21% of enterprise value.
Increase in gross real estate assets of 113% since 2009.
Concerns:
High stock price at $177/sh. and FFO multiple of 25x.
Low dividend yield of 2.6%.
$3.2 billion development pipeline which increases construction and leasing risk.
Recommendations:
AVB is a solid company with a quality portfolio of apartment assets and are
recommendation is as follows:
We are not recommending the purchase of the stock as AVB is one of the most
overpriced REITs we have seen and is trading at a 4% cap rate. Most of the
apartment REITs are overpriced, trading at low cap rates and high FFO multiples,
due to rent growth expectations and the migration of former home owners to rental
apartments. However, there are building permits for more than 375,000 new
apartment units to-be-built around the country, following more than 250,000 units
constructed in 2014. Our view is that the apartment markets around the country will
begin to soften this year with the influx of new units, even in the high barrier to
entry markets. As an example, we are located in Walnut Creek, CA, a city 25 miles
east of San Francisco, CA, with a population of 65,000. In 2015, there will be more
than 500 new apartment units brought to market with another 300-500 units in the
permit stage. This will cause vacancies to increase by about 5% and rents to soften.
A five year price chart of AVB is shown below:

REIT FOCUS REVIEWS IN PRIOR ISSUES OF VOM ARE AS FOLLOWS:
1. BRE Properties, Inc., June 15, 2011
2. Boston Properties, Inc., July 15, 2011
3. Simon Properties Group, Inc., August 15, 2011
4. First Industrial Realty Trust, September 15, 2011
5. Public Storage, October 15, 2011
6. Ashford Hospitality Trust, Inc., November 15, 2011
7. AvalonBay Communities, Inc., December 15, 2011
8. Alexandria Real Estate Equities, Inc., January 15, 2012
9. Federal Realty Investment Trust, Inc., February 15, 2012
10. Digital Realty Trust, Inc., March 15, 2012
11. Lasalle Hotel Properties, April 15, 2012
12. Apartment Investment and Management Company, May 15, 2012
13. Equity Residential Apartment Company, June 15, 2012

14. The Macerich Company, July 15, 2012
15. SL Green Realty Corp., August 15, 2012
16. Kimco Realty Corp., September 15, 2012
17. Cole Credit Property Trust II, Inc., October 15, 2012
18. Realty Income Corporation, November 15, 2012
19. Piedmont Office Realty Trust, Inc., December 15, 2012
20. Camden Property Trust, January 15, 2013
21. Hudson Pacific Properties, Inc., February 15, 2013
22. CBL & Associates Properties, Inc., March 15, 2013
23. Essex Property Trust, Inc., April 15, 2013
24. Commonwealth REIT, May 15, 2013
25. Douglas Emmett, Inc., June 15, 2013
26. UDR, Inc., July 15, 2013
27. Inland Real Estate Corporation, August 15, 2013
28. Highwoods Properties, Inc., September 15, 2013
29. Mack-Cali Realty Corporation, October 15, 2013
39. Home Properties, Inc., November 15, 2013
40. Kilroy Realty Corporation, December 15, 2013
41. Cedar Realty Trust, Inc., January 15, 2014
42. Brandywine Realty Trust, February 15, 2014
43. Associated Estates Realty Corporation, March 15, 2014
44. Weingarten Realty Investors, April 15, 2014
45. EastGroup Properties, Inc., May 15, 2014

46. Spirit Realty Capital, Inc., June 15, 2014
47. Parkway Properties, Inc., Jul 15, 2014
48. Equity Residential, August 15, 2014
49. Boston Properties, Inc., September 15, 2014
50. The Macerich Company, October 15, 2014
51. Essex Property Trust, Inc., November 15, 2014
52. First Industrial Realty Trust, Inc., December 15, 2014
General Publication Information and Terms of Use
View of the Market is published at www.paramountcapitalcorp.com/vom-newsletter by
Paramount Capital Corporation and edited by Joseph Ori, Executive Managing Director.
Use of this newsletter and its content is governed by the Terms of Use as described herein.
This newsletter is not an offer to sell or the solicitation of an offer to buy any security in
any jurisdiction where such an offer or solicitation would be illegal. This newsletter is
distributed for informational purposes only and should not be construed as investment
advice or a recommendation to sell or buy any security or other investment, or undertake
any investment strategy. It does not constitute a general or personal recommendation or
take into account the particular investment objectives, financial situations, or needs of
individual investors.
The price and value of securities referred to in this newsletter will fluctuate. Past
performance is not a guide to future performance, future returns are not guaranteed, and a
loss of all of the original capital invested in a security discussed in this newsletter may
occur. Certain transactions, including those involving futures, options, and other
derivatives, give rise to substantial risk and are not suitable for all investors. There are no
warranties, expressed or implied, as to the accuracy, completeness, or results obtained from
any information set forth in this newsletter. Paramount Capital Corporation will not be
liable to you or anyone else for any loss or injury resulting directly or indirectly from the
use of the information contained in this newsletter, caused in whole or in part by its
negligence in compiling, interpreting, reporting or delivering the content in this newsletter.
Paramount Capital Corporation receives compensation in connection with the publication
of this newsletter only in the form of subscription fees charged to subscribers and
reproduction or re-dissemination fees charged to subscribers or others interested in the
newsletter content.

THE VIEW OF THE MARKET NEWSLETTER ARCHIVES
For a Subscription to this letter see http://paramountcapitalcorp.com/vom-newsletter
Copyright © Paramount Capital Corporation 2015
Disclaimer: The information, strategies and material presented in the newsletter are for information purposes only
and not to be considered as an offer or a solicitation to sell or an offer or solicitation to buy or subscribe for
securities, investment products or other financial instruments. This newsletter is available only by paid subscription
and should not be reproduced, copied, emailed or disseminated in whole or in part without the express written
consent of Paramount Capital Corporation.